Financial Performance Analysis: Westpac Banking Corporation - HI5002
VerifiedAdded on 2023/06/12
|20
|3920
|224
Case Study
AI Summary
This report provides a financial analysis of Westpac Banking Corporation, examining its financial performance, weighted average cost of capital (WACC), share price movements, and dividend policies. It includes a description of Westpac's operations, governance structure, and ownership. The analysis covers performance ratios such as return on assets, return on equity, and debt-to-equity ratio, along with graphical presentations of share price changes over two years compared to market shares on the Australian Stock Exchange (ASX). Announcements affecting share price are discussed, and the required rate of return is computed using the CAPM method, determining a conservative investment approach. The report also addresses the implications of a higher WACC on Westpac's investment decisions, debt ratio considerations, and dividend policies, culminating in a letter of recommendation for investors. This document is available on Desklib, a platform offering a range of study tools and resources for students.
RUNNING HEAD: Financial analysis of Westpac Banking Corporation
1
Name of the student
Topic- Financial analysis of Westpac Banking Corporation
University name
1
Name of the student
Topic- Financial analysis of Westpac Banking Corporation
University name
Paraphrase This Document
Need a fresh take? Get an instant paraphrase of this document with our AI Paraphraser
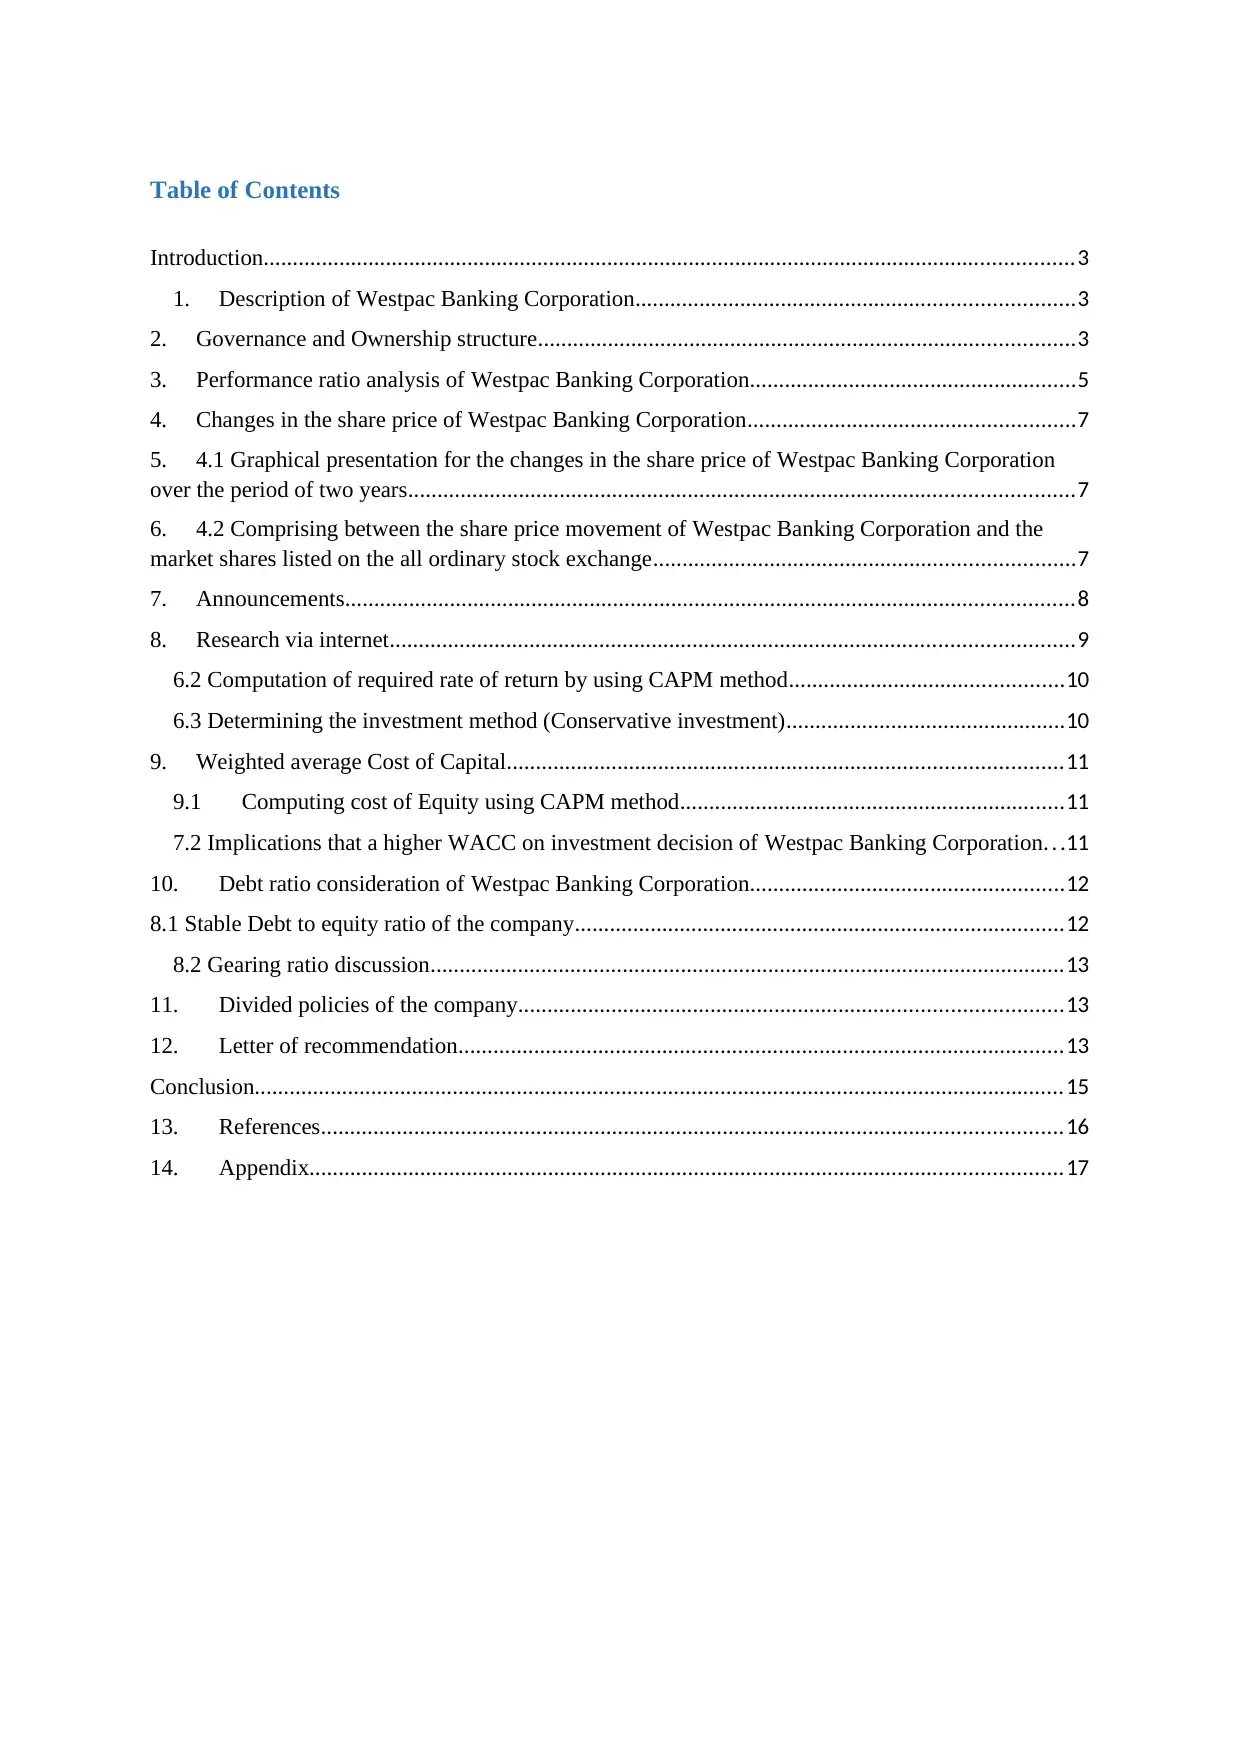
Table of Contents
Introduction...........................................................................................................................................3
1. Description of Westpac Banking Corporation...........................................................................3
2. Governance and Ownership structure............................................................................................3
3. Performance ratio analysis of Westpac Banking Corporation........................................................5
4. Changes in the share price of Westpac Banking Corporation........................................................7
5. 4.1 Graphical presentation for the changes in the share price of Westpac Banking Corporation
over the period of two years..................................................................................................................7
6. 4.2 Comprising between the share price movement of Westpac Banking Corporation and the
market shares listed on the all ordinary stock exchange........................................................................7
7. Announcements.............................................................................................................................8
8. Research via internet.....................................................................................................................9
6.2 Computation of required rate of return by using CAPM method...............................................10
6.3 Determining the investment method (Conservative investment)................................................10
9. Weighted average Cost of Capital...............................................................................................11
9.1 Computing cost of Equity using CAPM method..................................................................11
7.2 Implications that a higher WACC on investment decision of Westpac Banking Corporation. . .11
10. Debt ratio consideration of Westpac Banking Corporation......................................................12
8.1 Stable Debt to equity ratio of the company....................................................................................12
8.2 Gearing ratio discussion.............................................................................................................13
11. Divided policies of the company.............................................................................................13
12. Letter of recommendation........................................................................................................13
Conclusion...........................................................................................................................................15
13. References...............................................................................................................................16
14. Appendix.................................................................................................................................17
Financial analysis of Westpac Banking Corporation
3
Introduction
There are several financial tools which could be used by investors before making
investment decisions. The Westpac Banking Company has been selected in this report. The
discussion emphasises on the financial performance of the company, weighted average cost
of capital, share price analysis, dividend policy. It also contains the letter of recommendation
used by the investors to make the financial decision.
1. Description of Westpac Banking Corporation
Westpac banking Corporation, known as Westpac, is an Australian bank and financial service
provider. It was the first bank in Australia and one of Australia’s “big four” banks. Westpac
provide a broad range of banking and financial services in the market which includes
consumer, business and institutional banking and wealth management services.
The current CEO of the company is Brian Hartzer who is performing all the activities for an
effective run of business.
2. Governance and Ownership structure
The management team of the corporation have several managerial persons who make
decision for the effective run of the business.
(Yahoo finance, 2017)
⊘ This is a preview!⊘
Do you want full access?
Subscribe today to unlock all pages.
Trusted by 1+ million students worldwide
The chart shows the shareholding of members who owned the highest shareholding in
Westpac.
These key managerial persons takes all the important decisions in business.
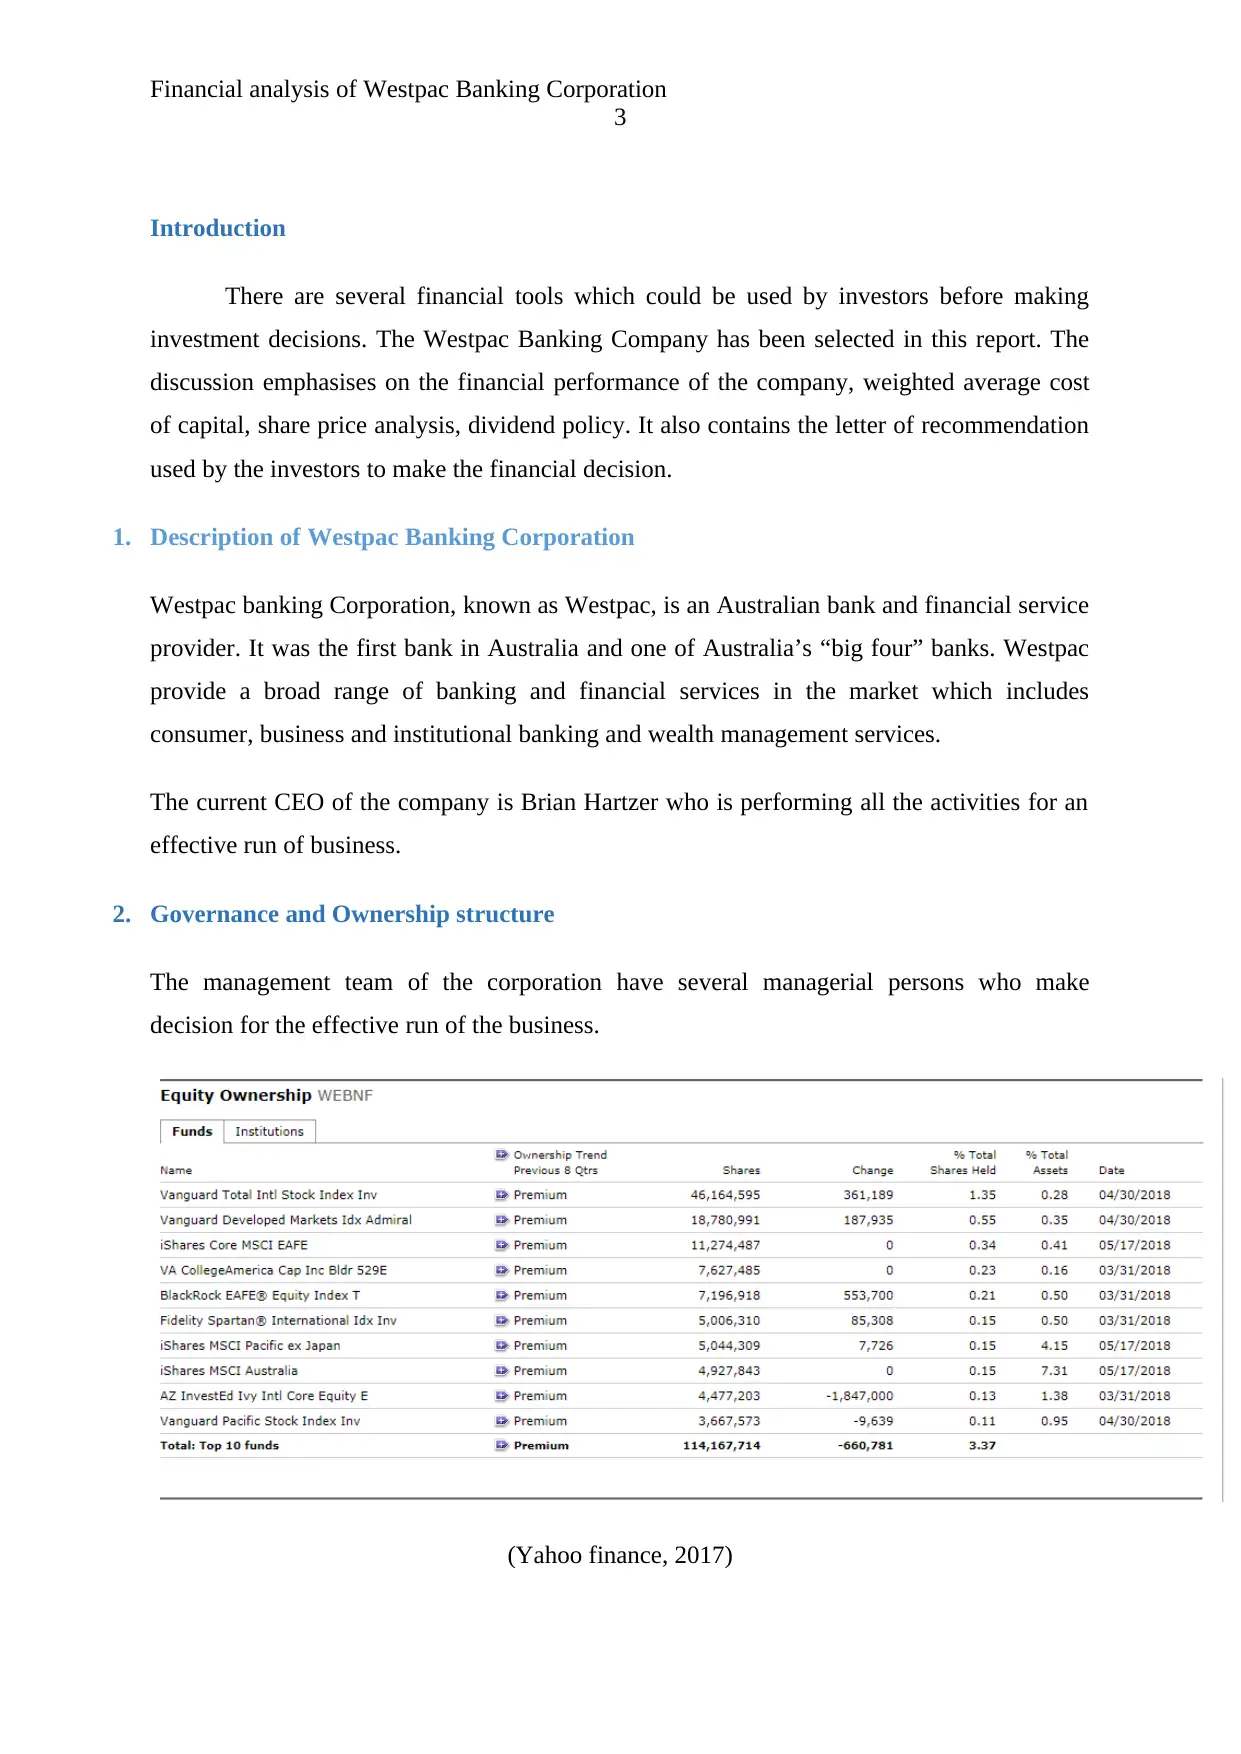
The governance of Westpac has shown that it comply with all the rules and regulations.
Westpac has strengthen legal compliance program.
(Yahoo finance, 2017)
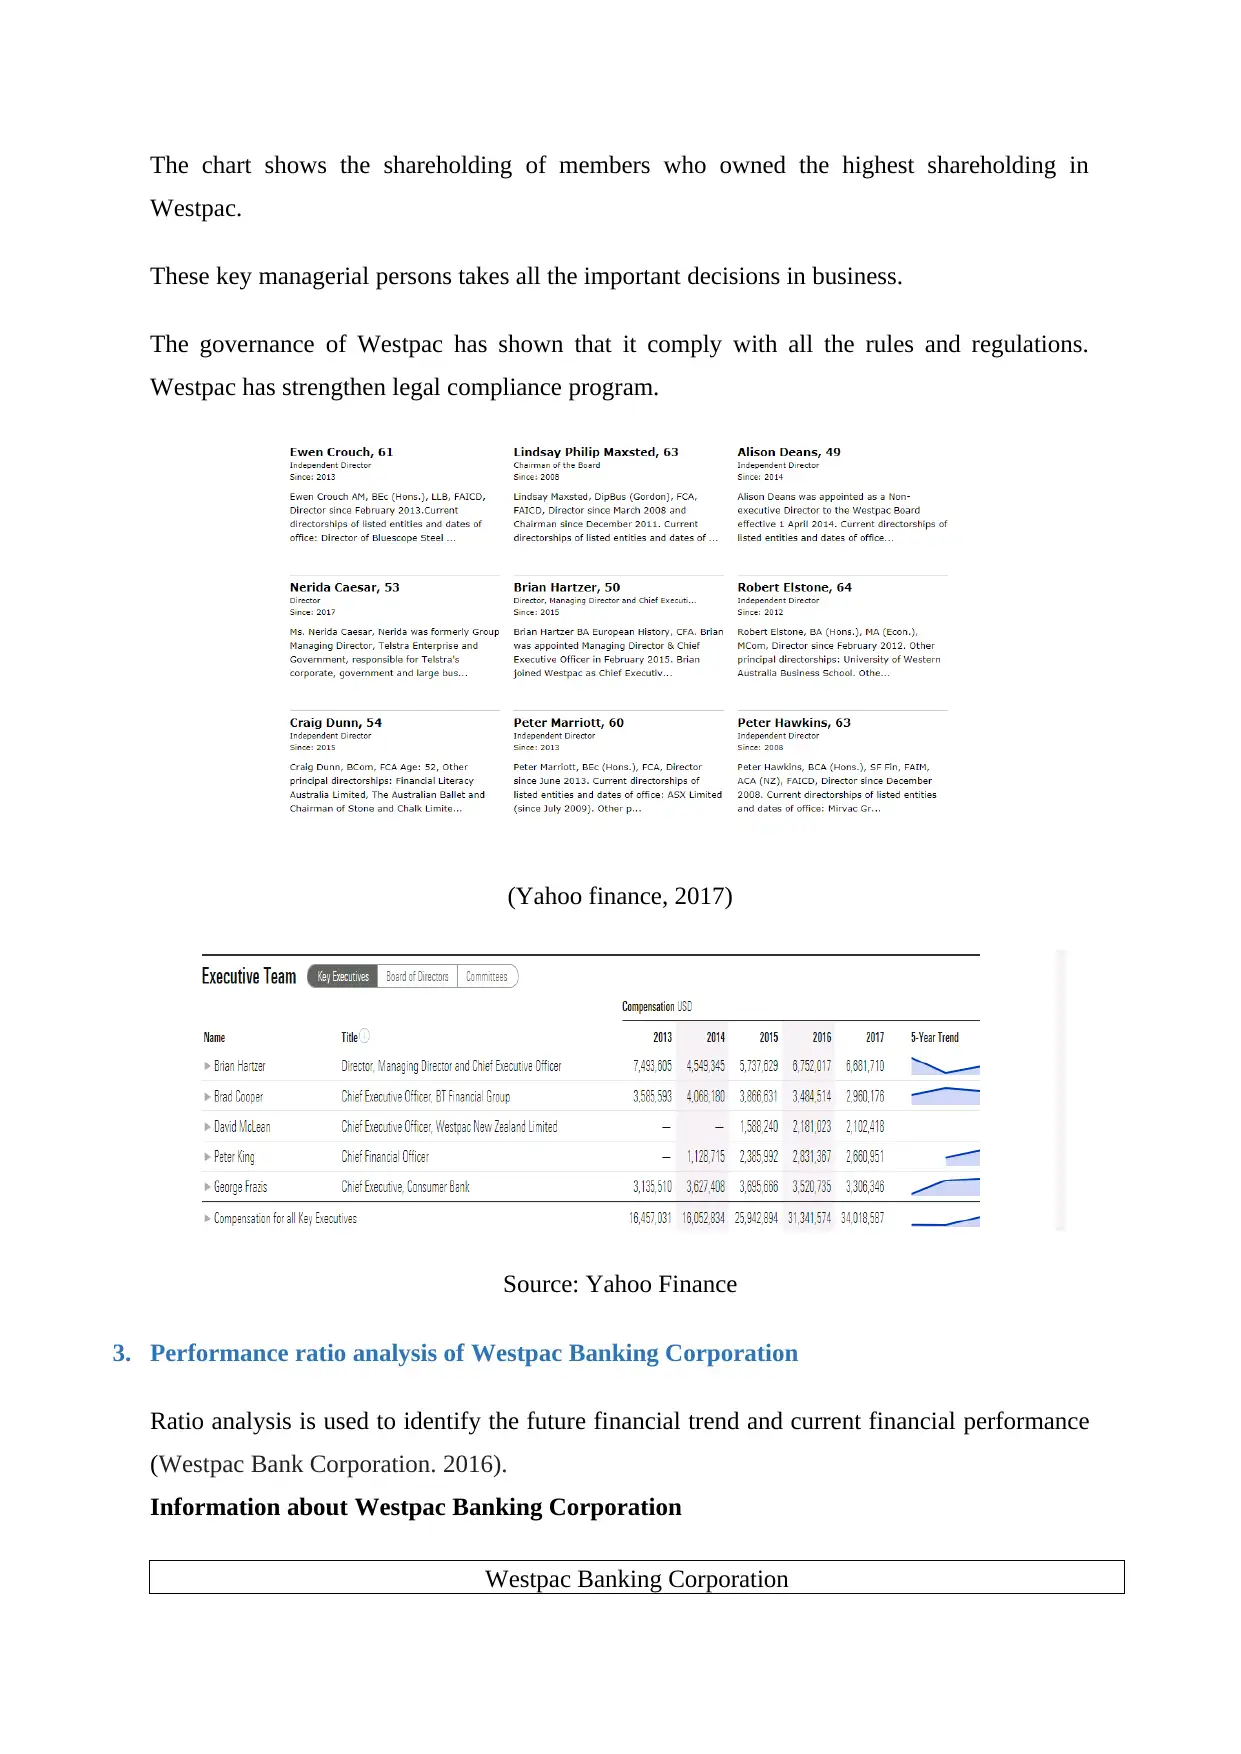
Source: Yahoo Finance
3. Performance ratio analysis of Westpac Banking Corporation
Ratio analysis is used to identify the future financial trend and current financial performance
(Westpac Bank Corporation. 2016).
Information about Westpac Banking Corporation
Westpac Banking Corporation
Westpac.
These key managerial persons takes all the important decisions in business.
The governance of Westpac has shown that it comply with all the rules and regulations.
Westpac has strengthen legal compliance program.
(Yahoo finance, 2017)
Source: Yahoo Finance
3. Performance ratio analysis of Westpac Banking Corporation
Ratio analysis is used to identify the future financial trend and current financial performance
(Westpac Bank Corporation. 2016).
Information about Westpac Banking Corporation
Westpac Banking Corporation
Paraphrase This Document
Need a fresh take? Get an instant paraphrase of this document with our AI Paraphraser
Financial analysis of Westpac Banking Corporation
5
Particulars (Amount in Million 2014 2015 2016 2017
AUD$
AU
D$
AU
D$
EBIT 13,548 14,267 15,148 15,516
Interest 18,706 18,028 16,674 15,716
Net profit 19,937 20,596 20,954 21,506
Total Assets 7,70,482 8,12,156 8,39,202 8,51,728
Total Liabilities 7,21,505 7,58,241 7,81,021 7,90,533
Shareholders' Equity 48,456 53,098 58,120 61,288
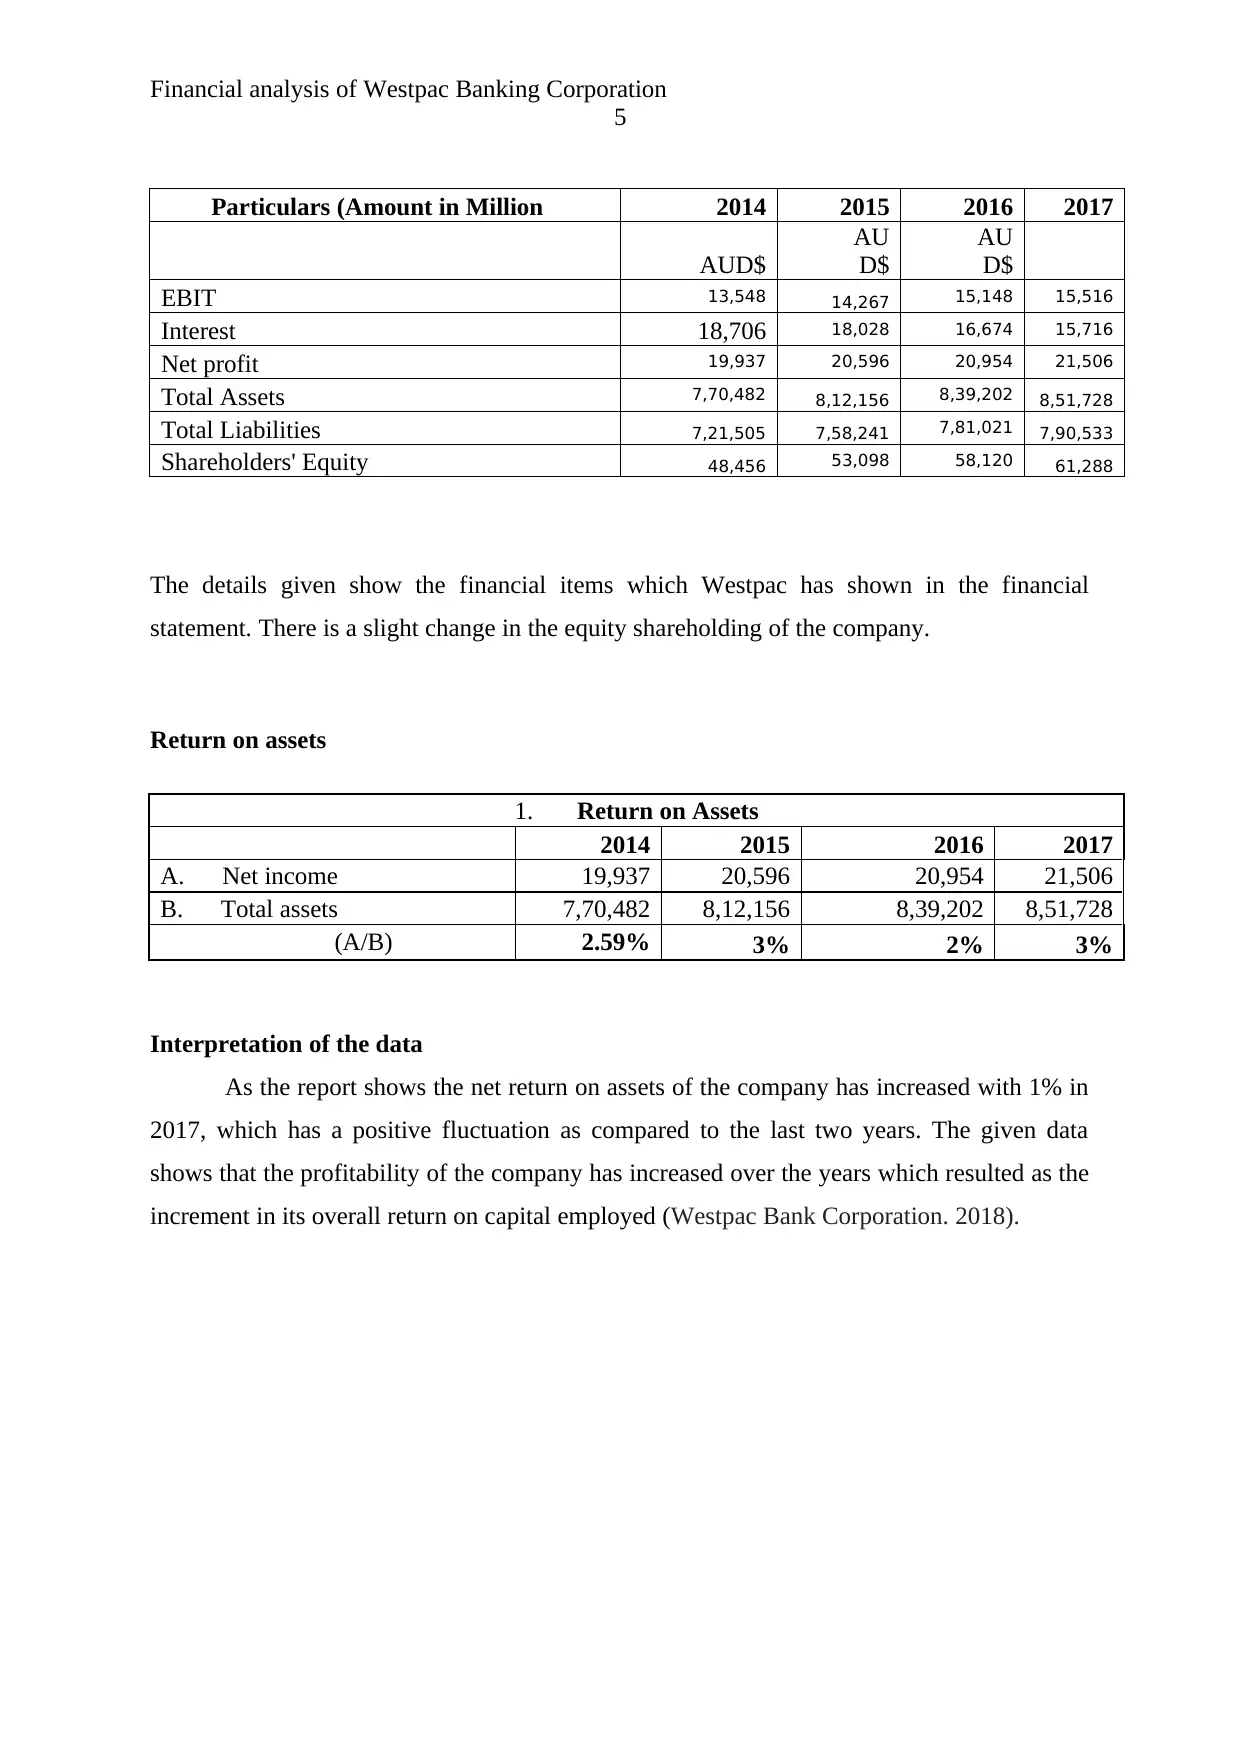
The details given show the financial items which Westpac has shown in the financial
statement. There is a slight change in the equity shareholding of the company.
Return on assets
1. Return on Assets
2014 2015 2016 2017
A. Net income 19,937 20,596 20,954 21,506
B. Total assets 7,70,482 8,12,156 8,39,202 8,51,728
(A/B) 2.59% 3% 2% 3%
Interpretation of the data
As the report shows the net return on assets of the company has increased with 1% in
2017, which has a positive fluctuation as compared to the last two years. The given data
shows that the profitability of the company has increased over the years which resulted as the
increment in its overall return on capital employed (Westpac Bank Corporation. 2018).
5
Particulars (Amount in Million 2014 2015 2016 2017
AUD$
AU
D$
AU
D$
EBIT 13,548 14,267 15,148 15,516
Interest 18,706 18,028 16,674 15,716
Net profit 19,937 20,596 20,954 21,506
Total Assets 7,70,482 8,12,156 8,39,202 8,51,728
Total Liabilities 7,21,505 7,58,241 7,81,021 7,90,533
Shareholders' Equity 48,456 53,098 58,120 61,288
The details given show the financial items which Westpac has shown in the financial
statement. There is a slight change in the equity shareholding of the company.
Return on assets
1. Return on Assets
2014 2015 2016 2017
A. Net income 19,937 20,596 20,954 21,506
B. Total assets 7,70,482 8,12,156 8,39,202 8,51,728
(A/B) 2.59% 3% 2% 3%
Interpretation of the data
As the report shows the net return on assets of the company has increased with 1% in
2017, which has a positive fluctuation as compared to the last two years. The given data
shows that the profitability of the company has increased over the years which resulted as the
increment in its overall return on capital employed (Westpac Bank Corporation. 2018).
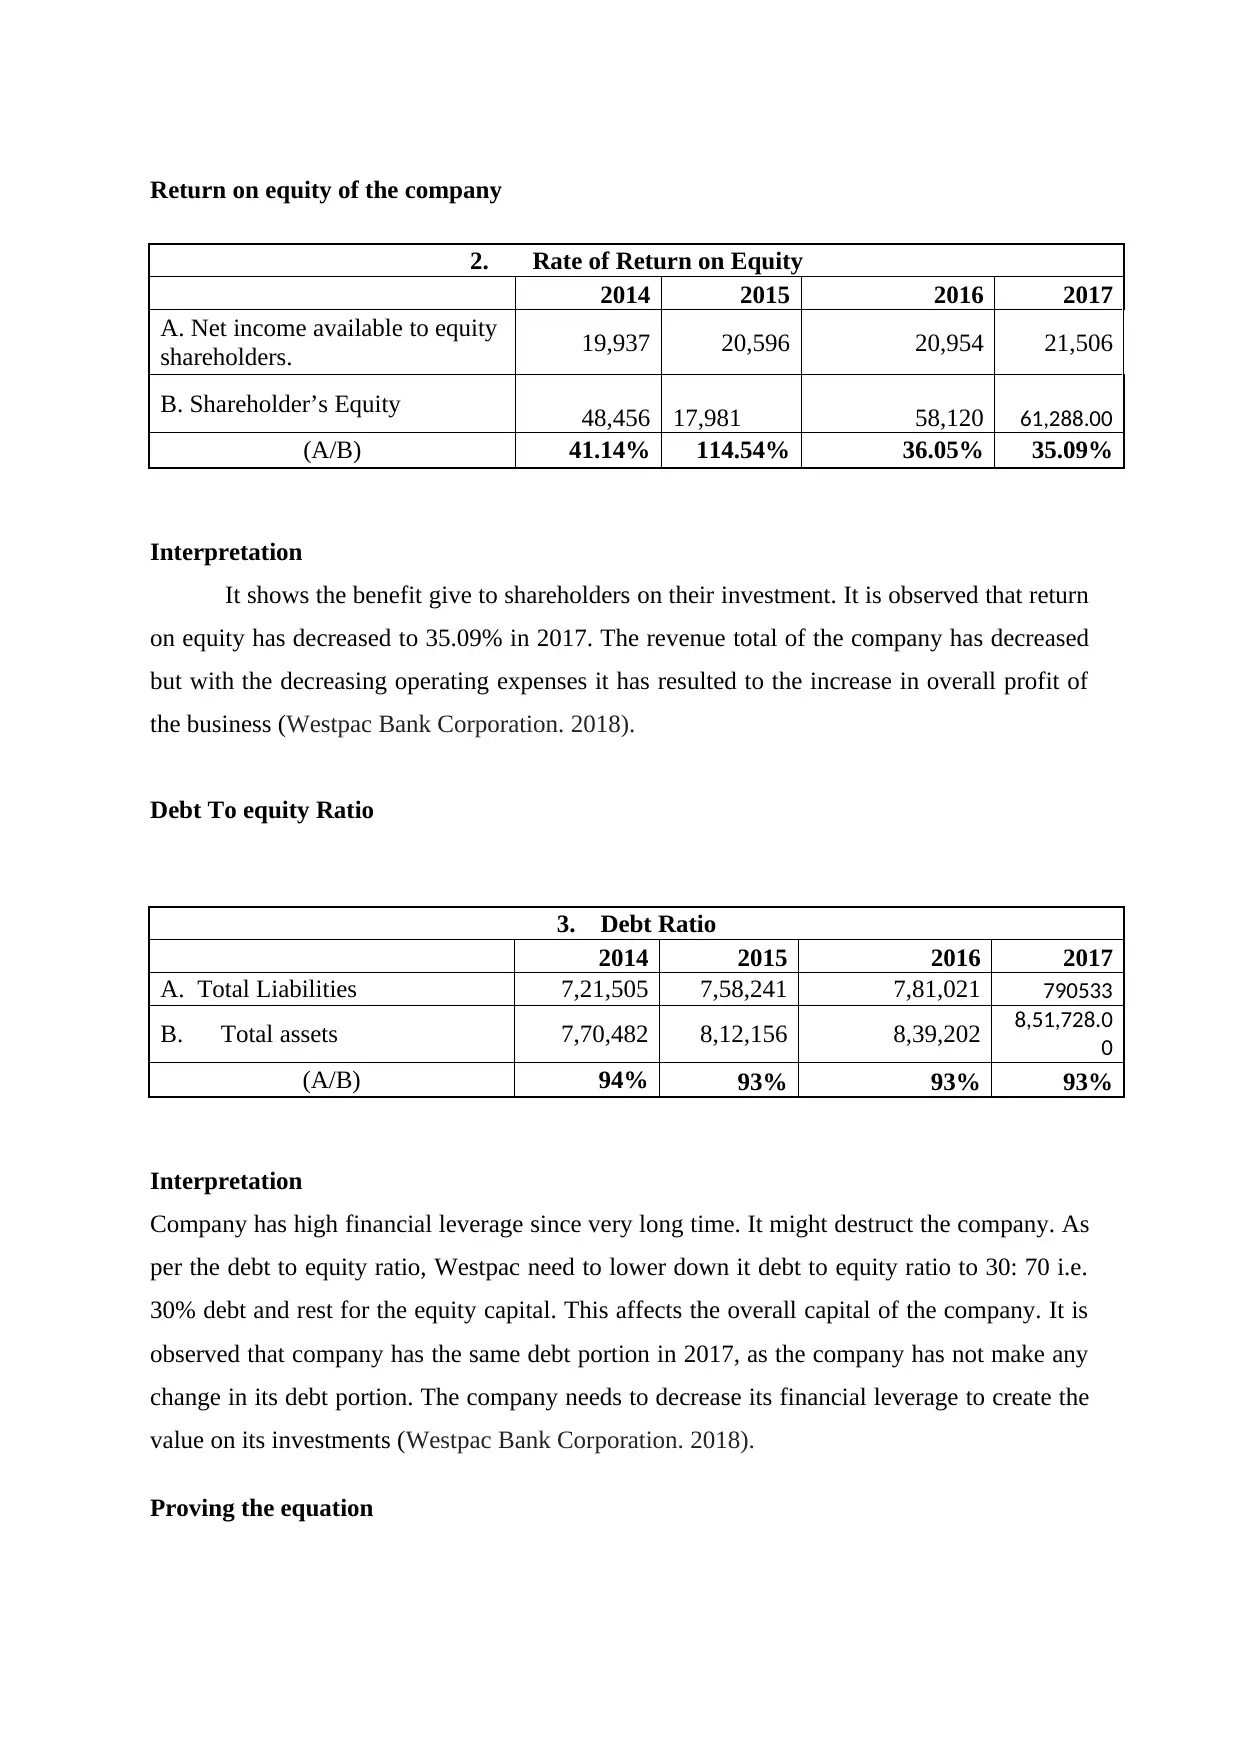
Return on equity of the company
2. Rate of Return on Equity
2014 2015 2016 2017
A. Net income available to equity
shareholders. 19,937 20,596 20,954 21,506
B. Shareholder’s Equity 48,456 17,981 58,120 61,288.00
(A/B) 41.14% 114.54% 36.05% 35.09%
Interpretation
It shows the benefit give to shareholders on their investment. It is observed that return
on equity has decreased to 35.09% in 2017. The revenue total of the company has decreased
but with the decreasing operating expenses it has resulted to the increase in overall profit of
the business (Westpac Bank Corporation. 2018).
Debt To equity Ratio
3. Debt Ratio
2014 2015 2016 2017
A. Total Liabilities 7,21,505 7,58,241 7,81,021 790533
B. Total assets 7,70,482 8,12,156 8,39,202 8,51,728.0
0
(A/B) 94% 93% 93% 93%
Interpretation
Company has high financial leverage since very long time. It might destruct the company. As
per the debt to equity ratio, Westpac need to lower down it debt to equity ratio to 30: 70 i.e.
30% debt and rest for the equity capital. This affects the overall capital of the company. It is
observed that company has the same debt portion in 2017, as the company has not make any
change in its debt portion. The company needs to decrease its financial leverage to create the
value on its investments (Westpac Bank Corporation. 2018).
Proving the equation
⊘ This is a preview!⊘
Do you want full access?
Subscribe today to unlock all pages.
Trusted by 1+ million students worldwide
Financial analysis of Westpac Banking Corporation
7
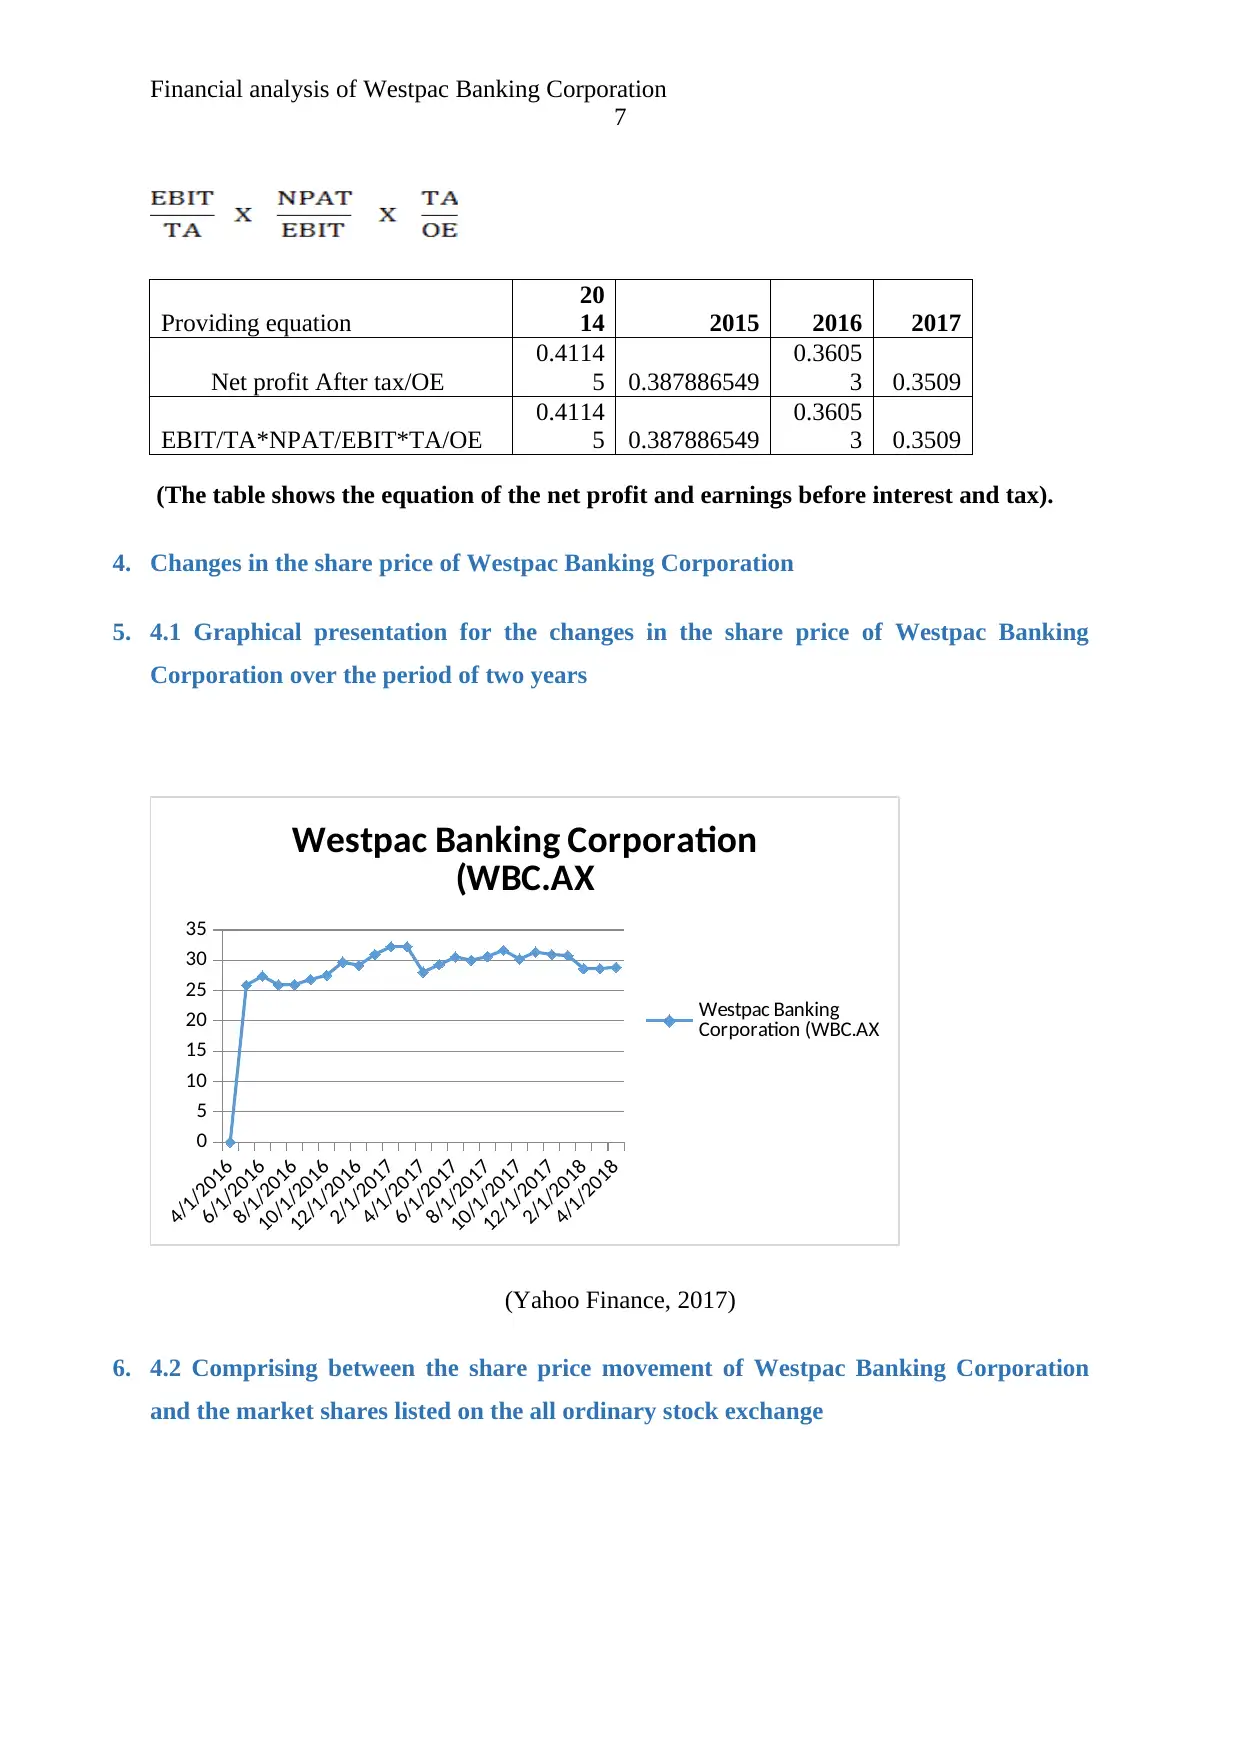
Providing equation
20
14 2015 2016 2017
Net profit After tax/OE
0.4114
5 0.387886549
0.3605
3 0.3509
EBIT/TA*NPAT/EBIT*TA/OE
0.4114
5 0.387886549
0.3605
3 0.3509
(The table shows the equation of the net profit and earnings before interest and tax).
4. Changes in the share price of Westpac Banking Corporation
5. 4.1 Graphical presentation for the changes in the share price of Westpac Banking
Corporation over the period of two years
4/1/2016
6/1/2016
8/1/2016
10/1/2016
12/1/2016
2/1/2017
4/1/2017
6/1/2017
8/1/2017
10/1/2017
12/1/2017
2/1/2018
4/1/2018
0
5
10
15
20
25
30
35
Westpac Banking Corporation
(WBC.AX
Westpac Banking
Corporation (WBC.AX
(Yahoo Finance, 2017)
6. 4.2 Comprising between the share price movement of Westpac Banking Corporation
and the market shares listed on the all ordinary stock exchange
7
Providing equation
20
14 2015 2016 2017
Net profit After tax/OE
0.4114
5 0.387886549
0.3605
3 0.3509
EBIT/TA*NPAT/EBIT*TA/OE
0.4114
5 0.387886549
0.3605
3 0.3509
(The table shows the equation of the net profit and earnings before interest and tax).
4. Changes in the share price of Westpac Banking Corporation
5. 4.1 Graphical presentation for the changes in the share price of Westpac Banking
Corporation over the period of two years
4/1/2016
6/1/2016
8/1/2016
10/1/2016
12/1/2016
2/1/2017
4/1/2017
6/1/2017
8/1/2017
10/1/2017
12/1/2017
2/1/2018
4/1/2018
0
5
10
15
20
25
30
35
Westpac Banking Corporation
(WBC.AX
Westpac Banking
Corporation (WBC.AX
(Yahoo Finance, 2017)
6. 4.2 Comprising between the share price movement of Westpac Banking Corporation
and the market shares listed on the all ordinary stock exchange
Paraphrase This Document
Need a fresh take? Get an instant paraphrase of this document with our AI Paraphraser
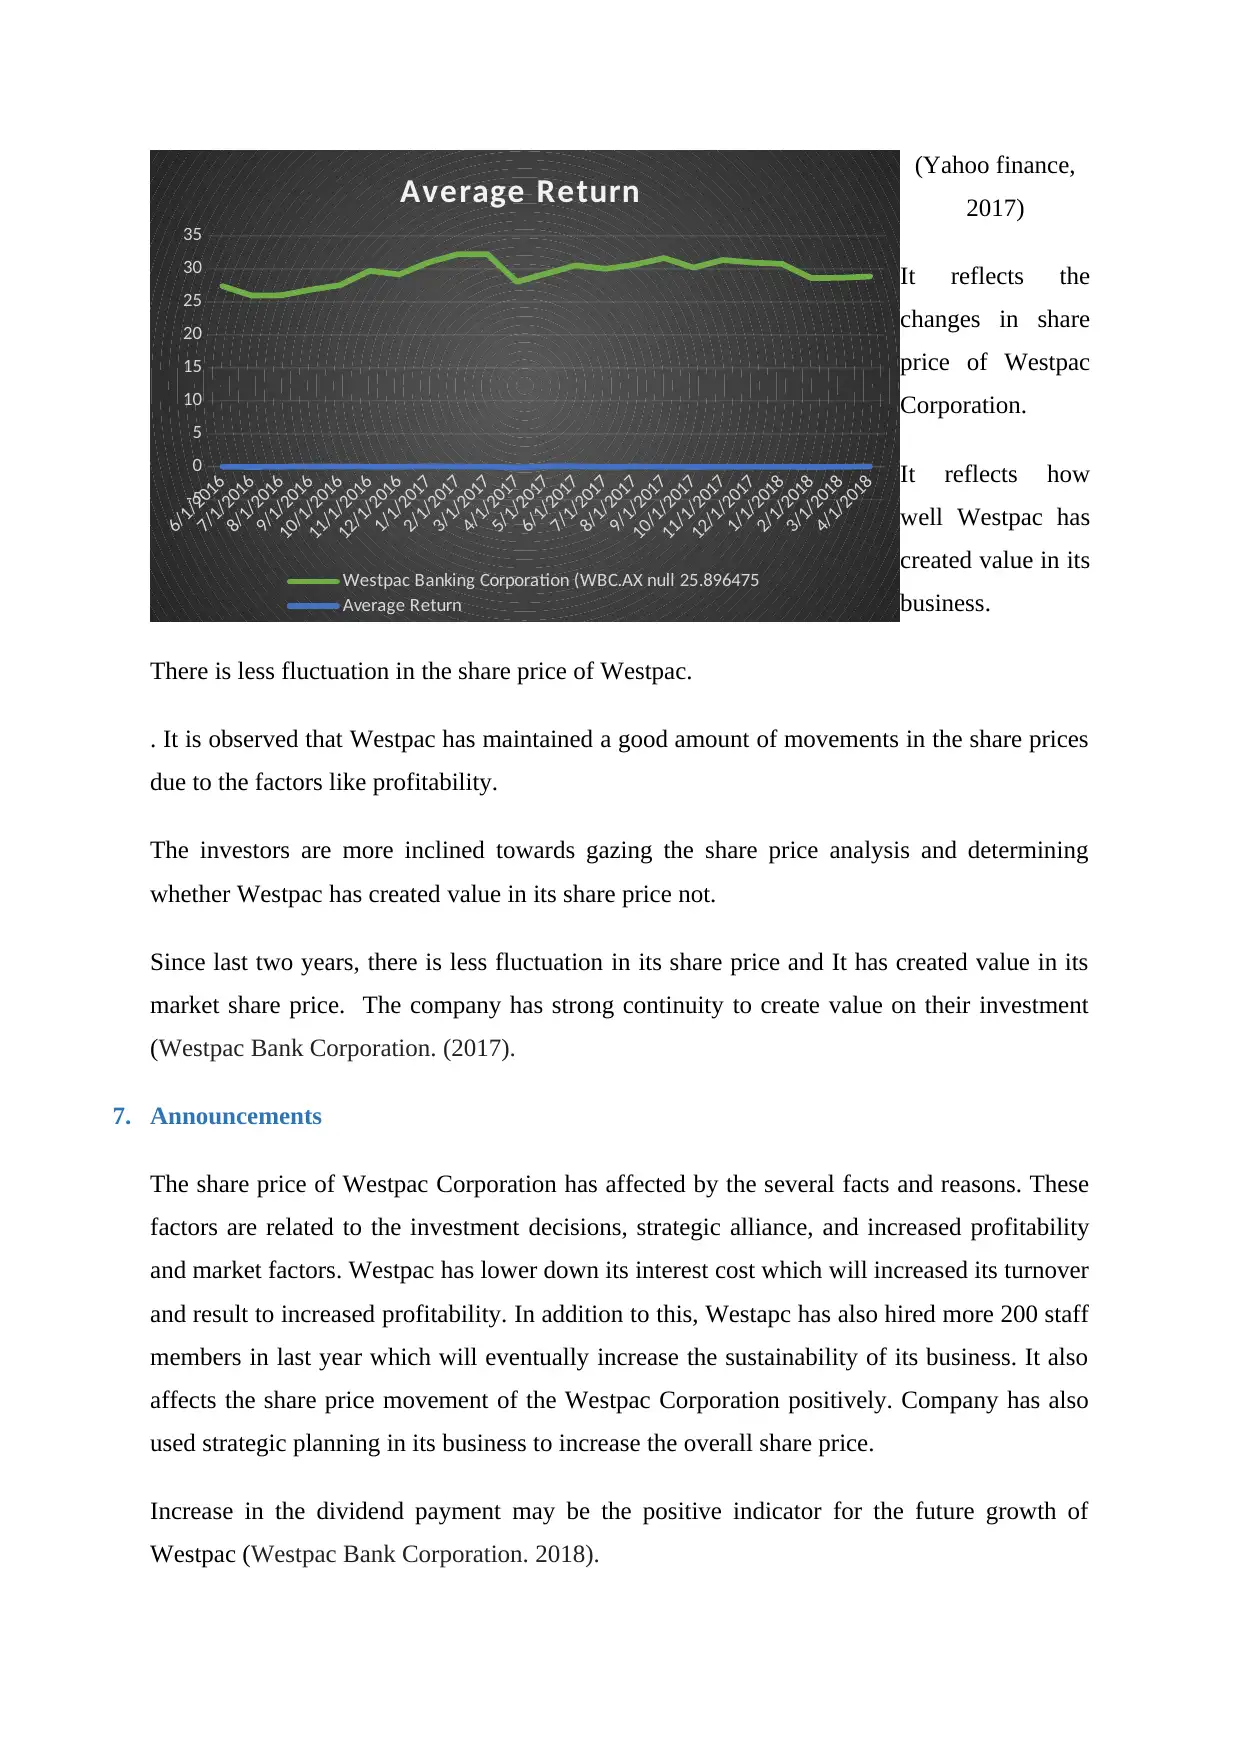
(Yahoo finance,
2017)
It reflects the
changes in share
price of Westpac
Corporation.
It reflects how
well Westpac has
created value in its
business.
There is less fluctuation in the share price of Westpac.
. It is observed that Westpac has maintained a good amount of movements in the share prices
due to the factors like profitability.
The investors are more inclined towards gazing the share price analysis and determining
whether Westpac has created value in its share price not.
Since last two years, there is less fluctuation in its share price and It has created value in its
market share price. The company has strong continuity to create value on their investment
(Westpac Bank Corporation. (2017).
7. Announcements
The share price of Westpac Corporation has affected by the several facts and reasons. These
factors are related to the investment decisions, strategic alliance, and increased profitability
and market factors. Westpac has lower down its interest cost which will increased its turnover
and result to increased profitability. In addition to this, Westapc has also hired more 200 staff
members in last year which will eventually increase the sustainability of its business. It also
affects the share price movement of the Westpac Corporation positively. Company has also
used strategic planning in its business to increase the overall share price.
Increase in the dividend payment may be the positive indicator for the future growth of
Westpac (Westpac Bank Corporation. 2018).
6/1/2016
7/1/2016
8/1/2016
9/1/2016
10/1/2016
11/1/2016
12/1/2016
1/1/2017
2/1/2017
3/1/2017
4/1/2017
5/1/2017
6/1/2017
7/1/2017
8/1/2017
9/1/2017
10/1/2017
11/1/2017
12/1/2017
1/1/2018
2/1/2018
3/1/2018
4/1/2018
-5
0
5
10
15
20
25
30
35
Average Return
Westpac Banking Corporation (WBC.AX null 25.896475
Average Return
Financial analysis of Westpac Banking Corporation
9
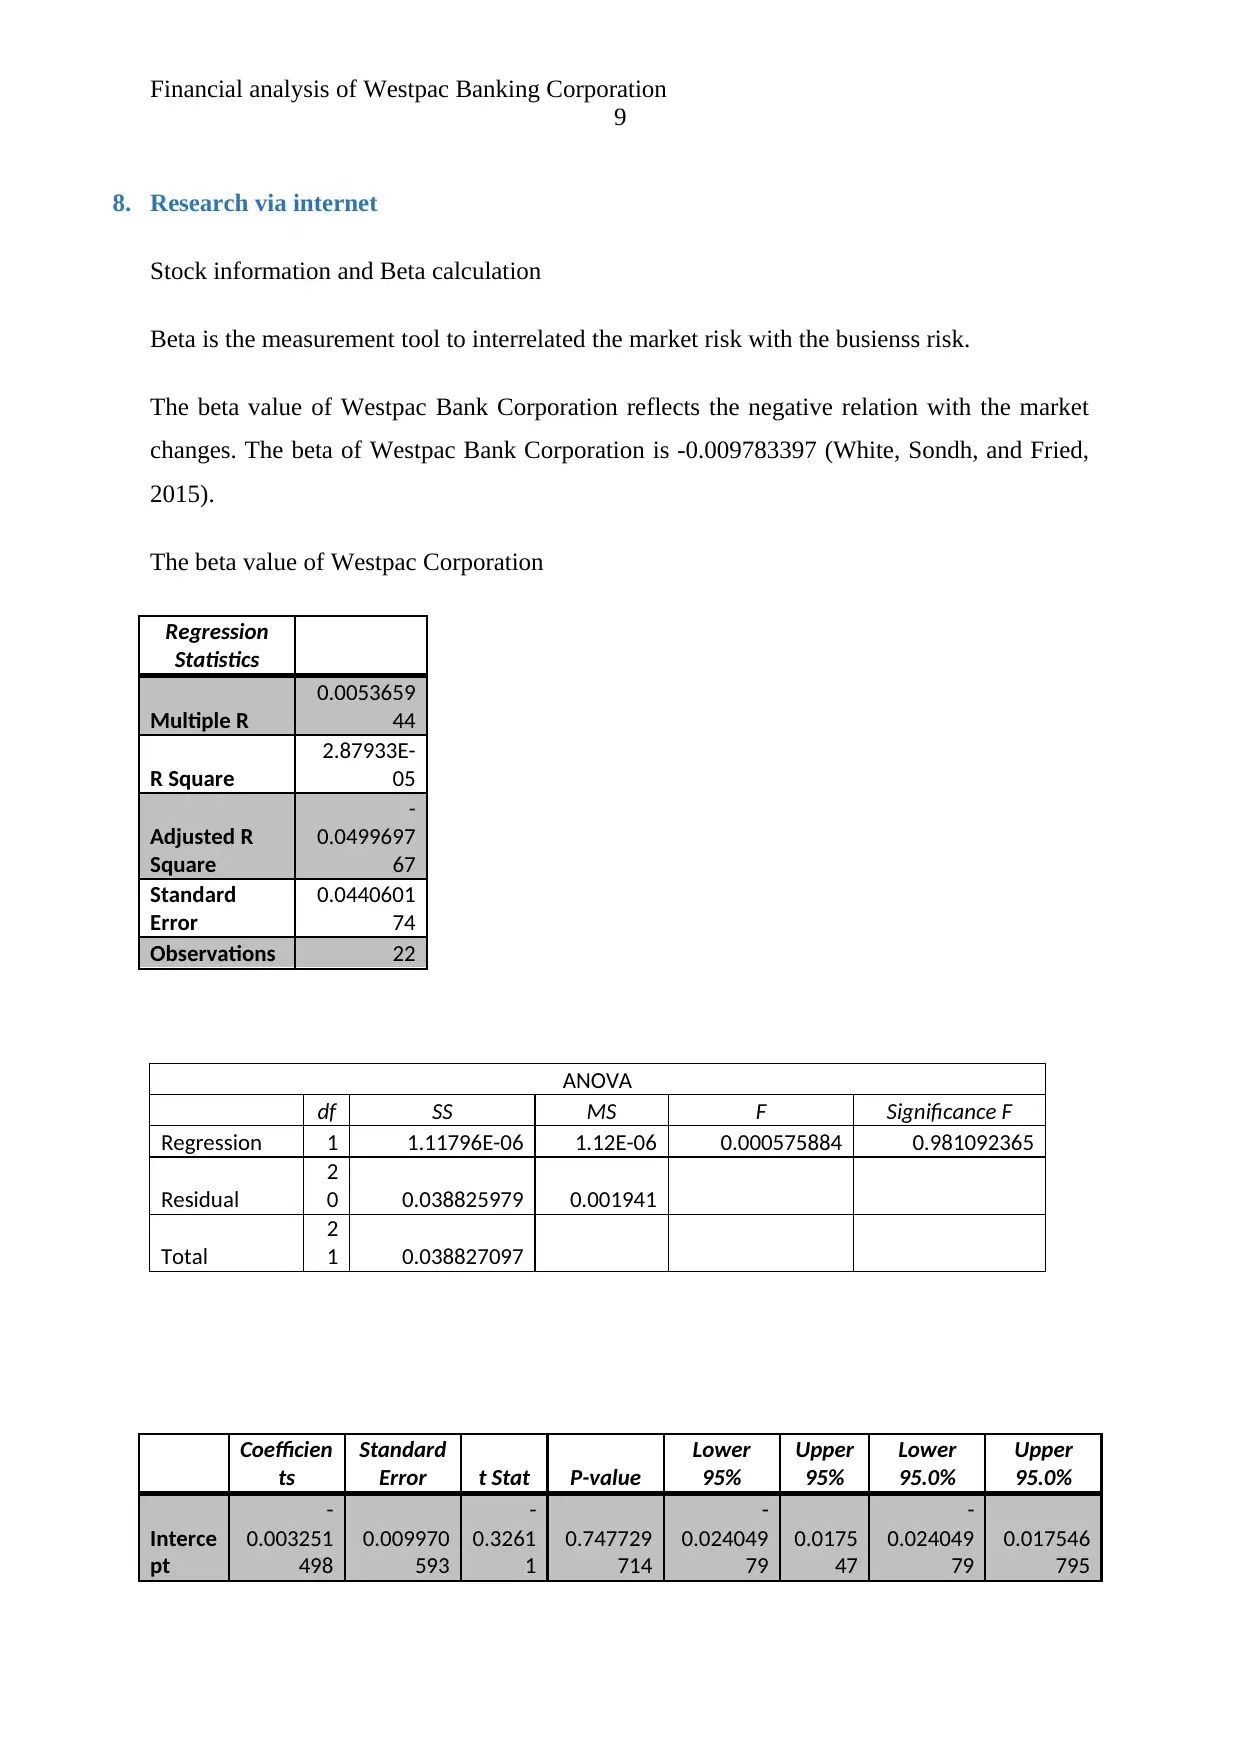
8. Research via internet
Stock information and Beta calculation
Beta is the measurement tool to interrelated the market risk with the busienss risk.
The beta value of Westpac Bank Corporation reflects the negative relation with the market
changes. The beta of Westpac Bank Corporation is -0.009783397 (White, Sondh, and Fried,
2015).
The beta value of Westpac Corporation
Regression
Statistics
Multiple R
0.0053659
44
R Square
2.87933E-
05
Adjusted R
Square
-
0.0499697
67
Standard
Error
0.0440601
74
Observations 22
ANOVA
df SS MS F Significance F
Regression 1 1.11796E-06 1.12E-06 0.000575884 0.981092365
Residual
2
0 0.038825979 0.001941
Total
2
1 0.038827097
Coefficien
ts
Standard
Error t Stat P-value
Lower
95%
Upper
95%
Lower
95.0%
Upper
95.0%
Interce
pt
-
0.003251
498
0.009970
593
-
0.3261
1
0.747729
714
-
0.024049
79
0.0175
47
-
0.024049
79
0.017546
795
9
8. Research via internet
Stock information and Beta calculation
Beta is the measurement tool to interrelated the market risk with the busienss risk.
The beta value of Westpac Bank Corporation reflects the negative relation with the market
changes. The beta of Westpac Bank Corporation is -0.009783397 (White, Sondh, and Fried,
2015).
The beta value of Westpac Corporation
Regression
Statistics
Multiple R
0.0053659
44
R Square
2.87933E-
05
Adjusted R
Square
-
0.0499697
67
Standard
Error
0.0440601
74
Observations 22
ANOVA
df SS MS F Significance F
Regression 1 1.11796E-06 1.12E-06 0.000575884 0.981092365
Residual
2
0 0.038825979 0.001941
Total
2
1 0.038827097
Coefficien
ts
Standard
Error t Stat P-value
Lower
95%
Upper
95%
Lower
95.0%
Upper
95.0%
Interce
pt
-
0.003251
498
0.009970
593
-
0.3261
1
0.747729
714
-
0.024049
79
0.0175
47
-
0.024049
79
0.017546
795
⊘ This is a preview!⊘
Do you want full access?
Subscribe today to unlock all pages.
Trusted by 1+ million students worldwide
X
Variab
le 1
-
0.009783
397
0.407682
76 -0.024
0.981092
365
-
0.860194
732
0.8406
28
-
0.860194
732
0.840627
937
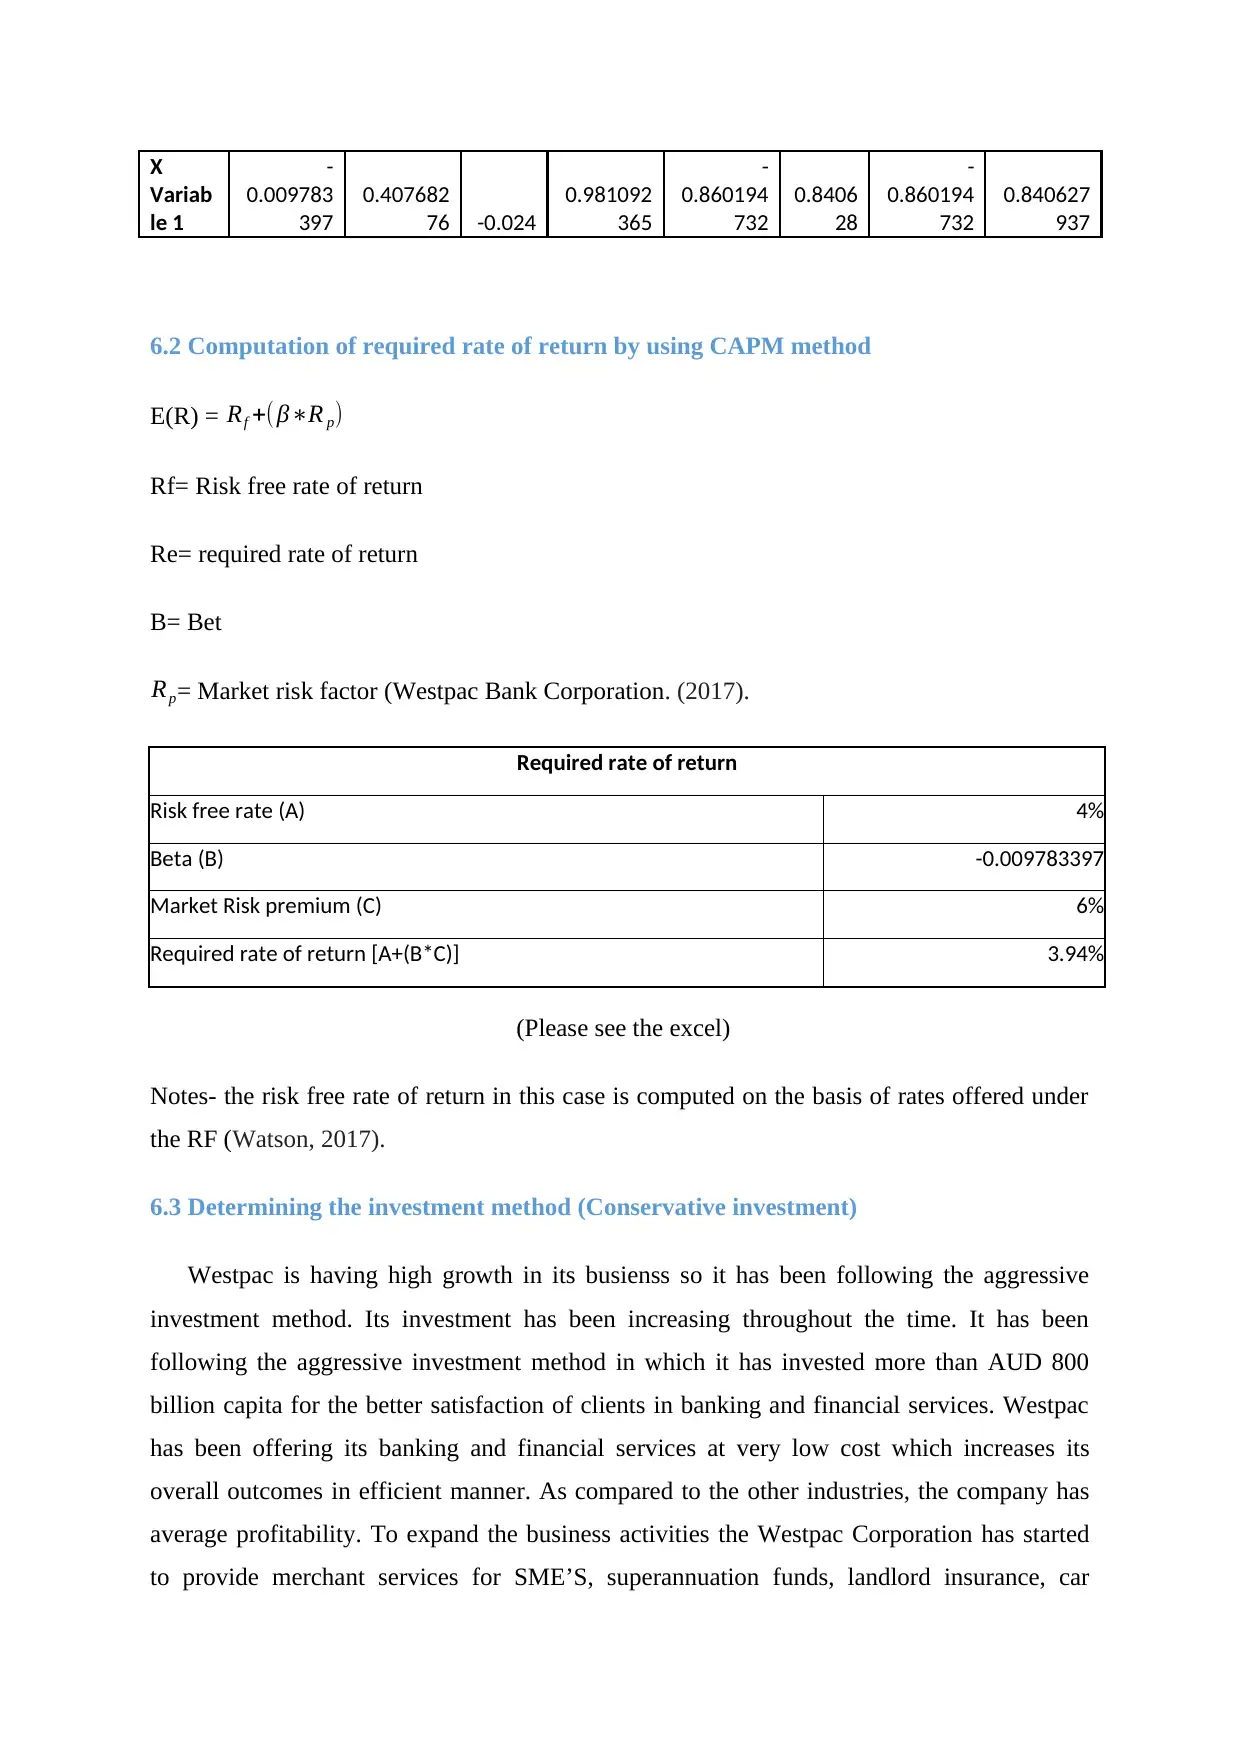
6.2 Computation of required rate of return by using CAPM method
E(R) = Rf +( β∗R p)
Rf= Risk free rate of return
Re= required rate of return
B= Bet
Rp= Market risk factor (Westpac Bank Corporation. (2017).
Required rate of return
Risk free rate (A) 4%
Beta (B) -0.009783397
Market Risk premium (C) 6%
Required rate of return [A+(B*C)] 3.94%
(Please see the excel)
Notes- the risk free rate of return in this case is computed on the basis of rates offered under
the RF (Watson, 2017).
6.3 Determining the investment method (Conservative investment)
Westpac is having high growth in its busienss so it has been following the aggressive
investment method. Its investment has been increasing throughout the time. It has been
following the aggressive investment method in which it has invested more than AUD 800
billion capita for the better satisfaction of clients in banking and financial services. Westpac
has been offering its banking and financial services at very low cost which increases its
overall outcomes in efficient manner. As compared to the other industries, the company has
average profitability. To expand the business activities the Westpac Corporation has started
to provide merchant services for SME’S, superannuation funds, landlord insurance, car
Variab
le 1
-
0.009783
397
0.407682
76 -0.024
0.981092
365
-
0.860194
732
0.8406
28
-
0.860194
732
0.840627
937
6.2 Computation of required rate of return by using CAPM method
E(R) = Rf +( β∗R p)
Rf= Risk free rate of return
Re= required rate of return
B= Bet
Rp= Market risk factor (Westpac Bank Corporation. (2017).
Required rate of return
Risk free rate (A) 4%
Beta (B) -0.009783397
Market Risk premium (C) 6%
Required rate of return [A+(B*C)] 3.94%
(Please see the excel)
Notes- the risk free rate of return in this case is computed on the basis of rates offered under
the RF (Watson, 2017).
6.3 Determining the investment method (Conservative investment)
Westpac is having high growth in its busienss so it has been following the aggressive
investment method. Its investment has been increasing throughout the time. It has been
following the aggressive investment method in which it has invested more than AUD 800
billion capita for the better satisfaction of clients in banking and financial services. Westpac
has been offering its banking and financial services at very low cost which increases its
overall outcomes in efficient manner. As compared to the other industries, the company has
average profitability. To expand the business activities the Westpac Corporation has started
to provide merchant services for SME’S, superannuation funds, landlord insurance, car
Paraphrase This Document
Need a fresh take? Get an instant paraphrase of this document with our AI Paraphraser
Financial analysis of Westpac Banking Corporation
11
insurance as well as other products. It has also undertaken the business of securitization and
value creation on their investments. The low WACC of Westpac is the trigger point for
following the aggressive investment method (Magnan, Menini, and Parbonetti, 2015).
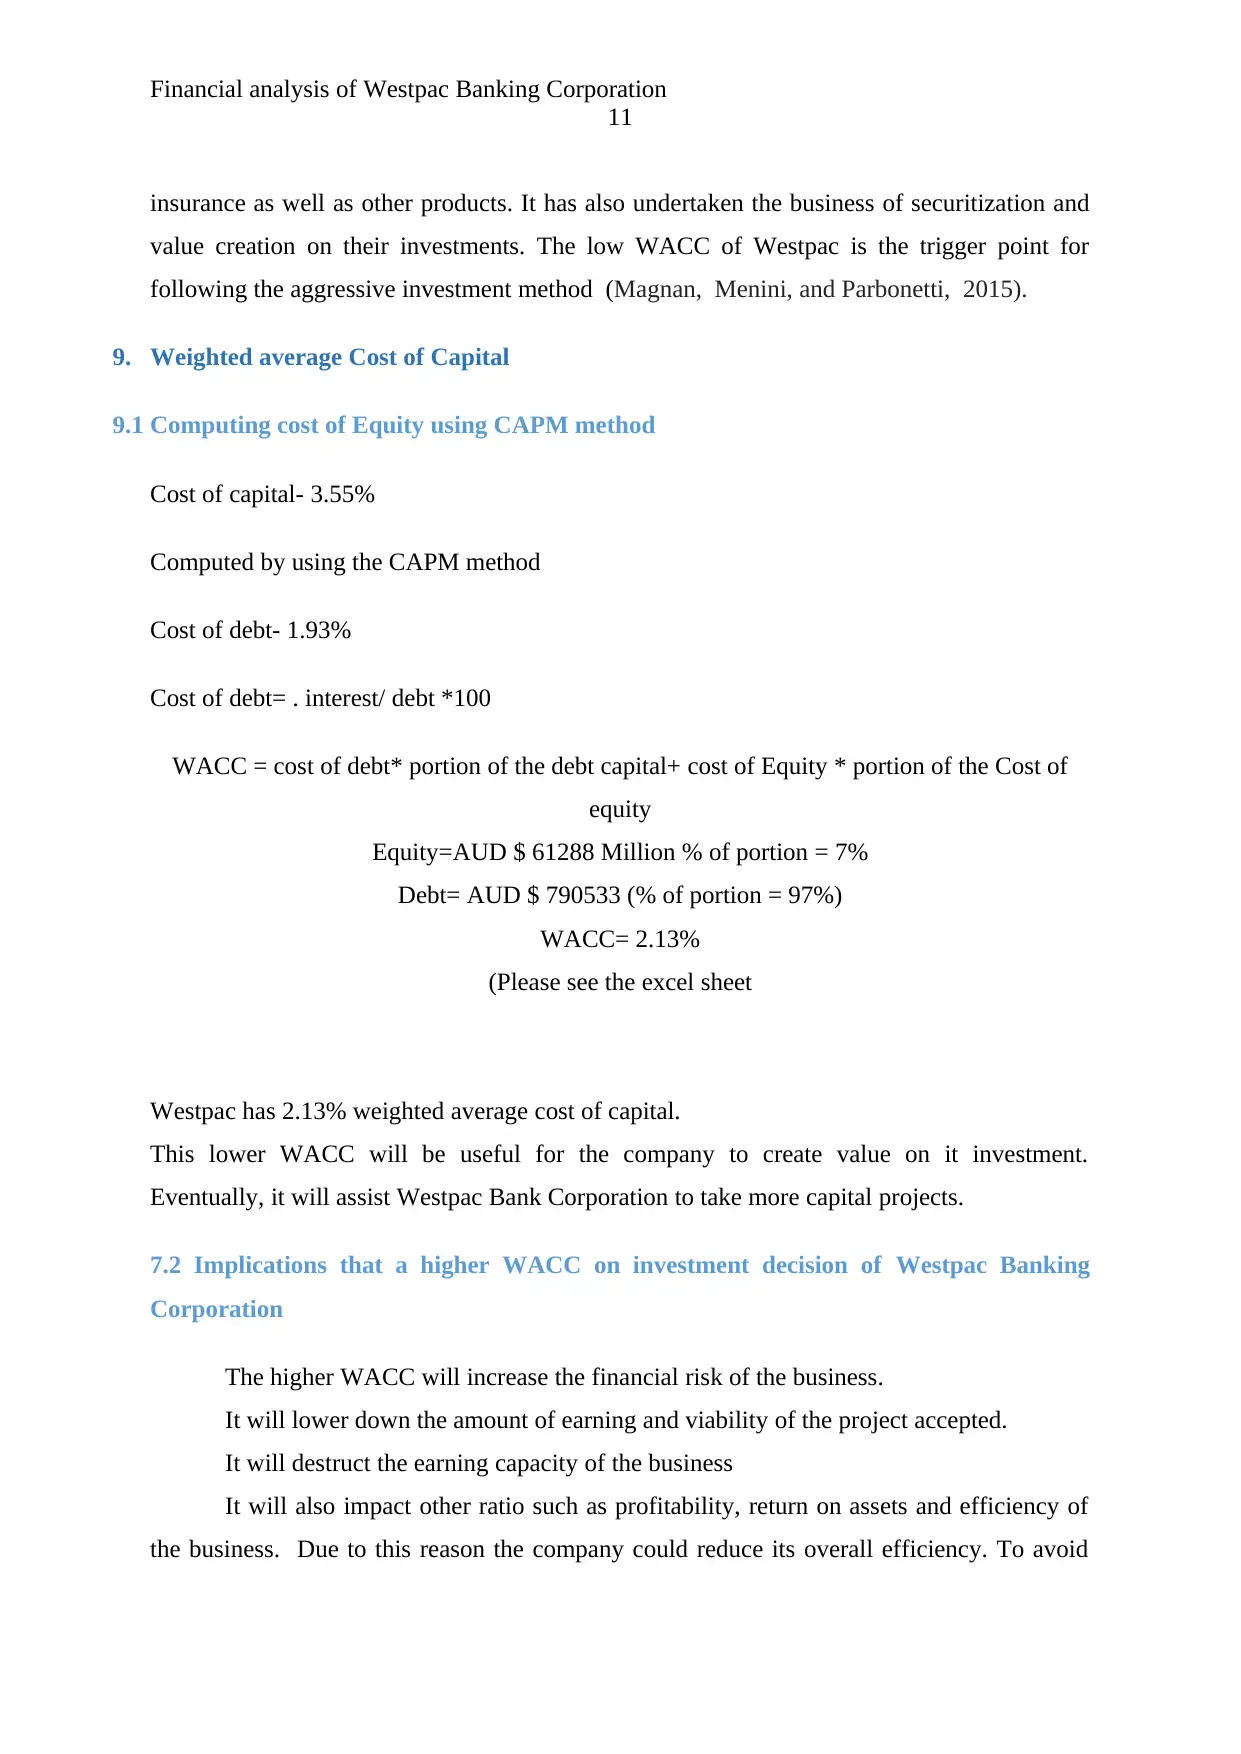
9. Weighted average Cost of Capital
9.1 Computing cost of Equity using CAPM method
Cost of capital- 3.55%
Computed by using the CAPM method
Cost of debt- 1.93%
Cost of debt= . interest/ debt *100
WACC = cost of debt* portion of the debt capital+ cost of Equity * portion of the Cost of
equity
Equity=AUD $ 61288 Million % of portion = 7%
Debt= AUD $ 790533 (% of portion = 97%)
WACC= 2.13%
(Please see the excel sheet
Westpac has 2.13% weighted average cost of capital.
This lower WACC will be useful for the company to create value on it investment.
Eventually, it will assist Westpac Bank Corporation to take more capital projects.
7.2 Implications that a higher WACC on investment decision of Westpac Banking
Corporation
The higher WACC will increase the financial risk of the business.
It will lower down the amount of earning and viability of the project accepted.
It will destruct the earning capacity of the business
It will also impact other ratio such as profitability, return on assets and efficiency of
the business. Due to this reason the company could reduce its overall efficiency. To avoid
11
insurance as well as other products. It has also undertaken the business of securitization and
value creation on their investments. The low WACC of Westpac is the trigger point for
following the aggressive investment method (Magnan, Menini, and Parbonetti, 2015).
9. Weighted average Cost of Capital
9.1 Computing cost of Equity using CAPM method
Cost of capital- 3.55%
Computed by using the CAPM method
Cost of debt- 1.93%
Cost of debt= . interest/ debt *100
WACC = cost of debt* portion of the debt capital+ cost of Equity * portion of the Cost of
equity
Equity=AUD $ 61288 Million % of portion = 7%
Debt= AUD $ 790533 (% of portion = 97%)
WACC= 2.13%
(Please see the excel sheet
Westpac has 2.13% weighted average cost of capital.
This lower WACC will be useful for the company to create value on it investment.
Eventually, it will assist Westpac Bank Corporation to take more capital projects.
7.2 Implications that a higher WACC on investment decision of Westpac Banking
Corporation
The higher WACC will increase the financial risk of the business.
It will lower down the amount of earning and viability of the project accepted.
It will destruct the earning capacity of the business
It will also impact other ratio such as profitability, return on assets and efficiency of
the business. Due to this reason the company could reduce its overall efficiency. To avoid
such situation and to reduce the WACC the company should accept the option of debt
funding (Magnan, Menini, and Parbonetti, 2015).
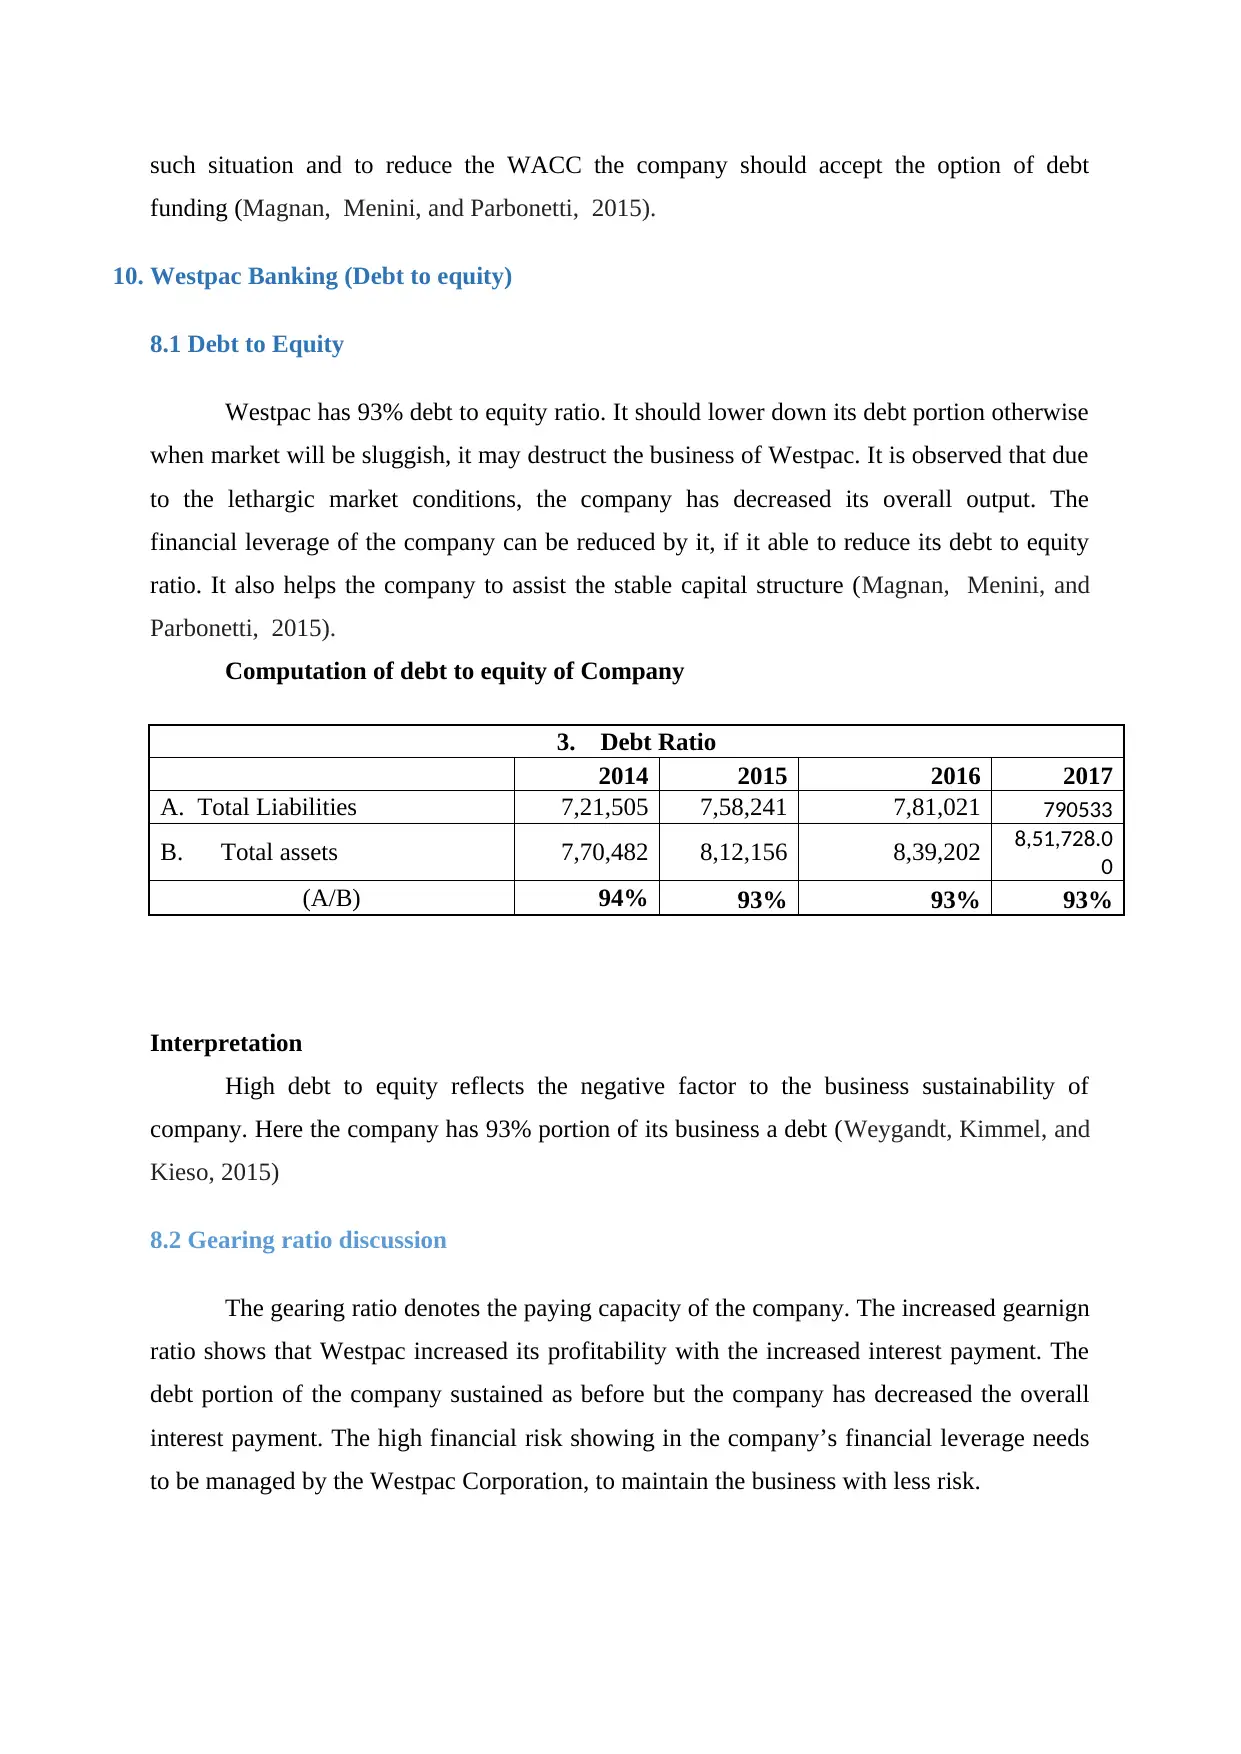
10. Westpac Banking (Debt to equity)
8.1 Debt to Equity
Westpac has 93% debt to equity ratio. It should lower down its debt portion otherwise
when market will be sluggish, it may destruct the business of Westpac. It is observed that due
to the lethargic market conditions, the company has decreased its overall output. The
financial leverage of the company can be reduced by it, if it able to reduce its debt to equity
ratio. It also helps the company to assist the stable capital structure (Magnan, Menini, and
Parbonetti, 2015).
Computation of debt to equity of Company
3. Debt Ratio
2014 2015 2016 2017
A. Total Liabilities 7,21,505 7,58,241 7,81,021 790533
B. Total assets 7,70,482 8,12,156 8,39,202 8,51,728.0
0
(A/B) 94% 93% 93% 93%
Interpretation
High debt to equity reflects the negative factor to the business sustainability of
company. Here the company has 93% portion of its business a debt (Weygandt, Kimmel, and
Kieso, 2015)
8.2 Gearing ratio discussion
The gearing ratio denotes the paying capacity of the company. The increased gearnign
ratio shows that Westpac increased its profitability with the increased interest payment. The
debt portion of the company sustained as before but the company has decreased the overall
interest payment. The high financial risk showing in the company’s financial leverage needs
to be managed by the Westpac Corporation, to maintain the business with less risk.
funding (Magnan, Menini, and Parbonetti, 2015).
10. Westpac Banking (Debt to equity)
8.1 Debt to Equity
Westpac has 93% debt to equity ratio. It should lower down its debt portion otherwise
when market will be sluggish, it may destruct the business of Westpac. It is observed that due
to the lethargic market conditions, the company has decreased its overall output. The
financial leverage of the company can be reduced by it, if it able to reduce its debt to equity
ratio. It also helps the company to assist the stable capital structure (Magnan, Menini, and
Parbonetti, 2015).
Computation of debt to equity of Company
3. Debt Ratio
2014 2015 2016 2017
A. Total Liabilities 7,21,505 7,58,241 7,81,021 790533
B. Total assets 7,70,482 8,12,156 8,39,202 8,51,728.0
0
(A/B) 94% 93% 93% 93%
Interpretation
High debt to equity reflects the negative factor to the business sustainability of
company. Here the company has 93% portion of its business a debt (Weygandt, Kimmel, and
Kieso, 2015)
8.2 Gearing ratio discussion
The gearing ratio denotes the paying capacity of the company. The increased gearnign
ratio shows that Westpac increased its profitability with the increased interest payment. The
debt portion of the company sustained as before but the company has decreased the overall
interest payment. The high financial risk showing in the company’s financial leverage needs
to be managed by the Westpac Corporation, to maintain the business with less risk.
⊘ This is a preview!⊘
Do you want full access?
Subscribe today to unlock all pages.
Trusted by 1+ million students worldwide
1 out of 20
Related Documents


Your All-in-One AI-Powered Toolkit for Academic Success.
+13062052269
info@desklib.com
Available 24*7 on WhatsApp / Email
![[object Object]](/_next/static/media/star-bottom.7253800d.svg)
Unlock your academic potential
Copyright © 2020–2026 A2Z Services. All Rights Reserved. Developed and managed by ZUCOL.