Financial Analysis of Whitebread PLC: Performance and Valuation Report
VerifiedAdded on 2020/01/07
|14
|5032
|163
Report
AI Summary
This report provides a comprehensive financial analysis of Whitebread PLC, a multinational hospitality company. It begins with a summary and recommendation, followed by strategic and accounting analysis, including a SWOT analysis. The report then delves into Whitebread's recent financial performance using value-based ratio analysis, focusing on ROE, RNOA, NIR, operating spread, and financial leverage. The core of the report is the determination of the intrinsic value of Whitebread's equity using both earnings-based and free cash flow valuation models, including a detailed calculation of the cost of equity and WACC. The analysis concludes by comparing the intrinsic value to the market price and discussing the advantages and limitations of the valuation models employed.

Financial Analysis
1
1
Paraphrase This Document
Need a fresh take? Get an instant paraphrase of this document with our AI Paraphraser
Table of Contents
INTRODUCTION ...............................................................................................................................3
1. Summary page of the report and recommendation......................................................................3
2. (a) Whitebread's strategic and accounting analysis.....................................................................3
(b) Whitebread's recent financial performance analysis on the basis of value based ratio analysis4
(c) Intrinsic value of the equity using earning -based valuation......................................................5
(d) Advantage and limitations of cash flow and enterprise-based valuation models.......................7
CONCLUSION....................................................................................................................................7
REFERENCES.....................................................................................................................................8
APPENDIX........................................................................................................................................10
2
INTRODUCTION
Financial analysis is the process through which firms can examine their financial
performance and thereby, take effective and strategic decisions. Whitebread PLC is a public limited
company that was established in the year 1742 and has multinational hotel, coffee shop as well as
restaurant. It is headquartered in Dunstable, United Kingdom. It operates in the leisure hospitality
industry, listed on London Stock Exchange. Present project report will address Whitebread's
strategic and financial analysis on the basis of value oriented ratios. Moreover, intrinsic value of
equity will be determined by using enterprise based value like abnormal operating profit and free
cash flow (FCF). At the end, the report will discuss advantages and limitations of cash flow as well
as earning based valuation models.
1. Summary page of the report and recommendation
In summary of the report, it can be recommended that Whitebread needs to enhance its net
operating profit margin by maintaining effective control over operating expenses and enlarging
revenues. It will help to improve RNOA and ROE to increase its operational performance. While,
valuation model reveals that company's equity share is overvalued because its intrinsic value is
£22.38 while its market price is £52.55 which has arisen a difference of £30.17 each share.
2. (a) Whitebread's strategic and accounting analysis
Whitebread Plc's vision is to provide exceptional hospitality and leisure services each and
every time. Its mission is to enhance its customer facility whereas its strategy is to deliver excellent
customer services by its motivated, trained and experienced workforce. It is based on customer
heartbeat business model in which it regularly focuses on customer needs and tries to create the best
value by satisfying their expectations (Park and Jang, 2013). Company's strategic analysis can be
conducted by SWOT analysis which helps to identify business position relatively to their
competitors.
Strengths Weaknesses
Large customer base.
Increased market share.
Innovative services.
Strong brand image.
Better supplier relationship.
International operations.
Difficult to launch new product.
Political upheaval.
Lack of brand awareness.
Changing customer taste and
preferences.
Excessive prices of Costa products.
3
⊘ This is a preview!⊘
Do you want full access?
Subscribe today to unlock all pages.
Trusted by 1+ million students worldwide
Opportunity Threats
It can maximize profitability by
implementing dynamic pricing model in
Premier Inn.
International expansion.
Maximizing hotel occupancy rates.
Control on product cost.
Fierce level of competition from
Starbucks, ACCOR and The Restaurant
Group Plc.
Market uncertainty may create adverse
impact on expansion program.
Accounting analysis: It is the process to analyse each and every item reported in the
financial statement. In the year 2015, its premier Inn's revenue has been increased by 15.3% while
restaurant's sales has been enhanced by 3.2%. Moreover, its occupancy rate has achieved the target
of 81.3% which is a sign of exceptional growth (Lyle, Callen and Elliott, 2013). Overall, its sales
has been increased from £2294.3m to £2608.1m and its net earning has been improved from
£323.4m to £366.1m in 2015. 13.7% growth in turnover and 1.09% growth in RNOA are a good
sign ofts performance and indicates that Whitbread is performing well in the market by rendering
the best services to its customers.
(b) Whitebread's recent financial performance analysis on the basis of value based ratio analysis
Ratio expresses relationship between two elements of financial statement. There are
different kinds of value based ratio which can be used to evaluate Whitebread's performance over
the period. It is a quantitative analysis that helps to examine business performance by comparing
ratios. Here, financial performance of Whitebread Plc has been examined on the basis of valued-
oriented ratios such as ROE, RNOA, NIR, operating spread and financial leverage (FLEV).
Return on equity (ROE): Shareholders often use ROW to measure Whitebread’s
performance. It can be calculated by determining return from both the operating and non-operating
ratios such as RNOA and FLEV*spread (Analysing and interpreting financial statement, n.d.).
Whitebread's ROE has risen from 18.9% to 19.5% in the year 2015 which is a good sign of
operational performance. Reasons behind this behaviour of ROE is given below:
Return on net operating assets (RNOA): Operating functions are the core activities of
Whitebread Plc. which are conducted to deliver exceptional services to the customers. It comprises
research and development, supply chain, selling products, marketing, promotion and after sales
services as well. It can be determined by dividing net operating profit after tax to the average net
4
Paraphrase This Document
Need a fresh take? Get an instant paraphrase of this document with our AI Paraphraser
operating assets. In 2013, RNOA was 15.9% that enhanced to 16.9% in 2014 while, in 2015, it has
been declined to 16.5% which is not good. Declined NOPM from 15.6% to 15.2% because of less
proportionate increase in OP from £357.6m to £395.3m comparatively less than increase in revenue
from £2294.3m to £2608.1 is the reason behind this (Feng and Wang, 2000). On contrary, ATO has
been improved from 1 to 1.09% which is a good sign and indicates that Whitebread Plc's managers
are using assets more efficiently as compared to PY.
Net interest rate after tax (NIR): It can be computed by dividing sum of net finance cost and
tax relief by average net debt. In the year 2013, it was 6.4% which has reduced to 5.7% in the year
2015. Decline in net finance cost to 37.1 and less net debt to 598.4 is the reason behind this
occurrence (Kumbirai and Webb, 2013). Thus, it is a good sign as Whitebread Plc has to pay less
amount of tax due to repayment of some debt which results in high profitability.
Operating spread: It is the difference between RNOA and NIR. Whitebread's operating
spread has been improved from 9.5% to 10.8% in the year 2015. Higher spread is good because it
shows that high profitability margin is available to the company (Heikal, Khaddafi and Ummah,
2014).
Financial leverage: It expresses relationship between debt and equity used by Whitebread
Plc in its capital structure. In 2013, it was 0.31 that has reduced to 0.27 in 2015. Repayment of debts
and excessive use of equity capital are the reason behind the declined leverage. It indicates less
financial risk but still, idle industrial ratio is 0.5:1. Thus, it can be suggested that Whitebread needs
to enhance the debt level so that it can enhance its ability to pay long term debts timely and
effectively.
(c) Intrinsic value of the equity using earning -based valuation
Intrinsic value is the value of company's security which can be determined by fundamental
analysis without taking into account the market based value that is also known as fundamental
value. This method evaluates Whitebread's security (equity) worth on the basis of potential cash
flows available for the investors (Gleason, Bruce Johnson and Li, 2013). In the present era, most of
the firms use enterprise based valuation to identify their share price on the basis of abnormal
operating profit and free cash flow.
According to Abnormal earning valuation model, equity price can be determined on the
basis of two elements that are book value and earnings. The method is also known as residual
income model. This method says that Whitebread's shareholders should pay more than book value
in case if earnings are higher than forecasted while if actual earnings are less than estimated then
investors should pay less than share book value (Imam, Chan and Shah, 2013). Alternatively, it can
5
be determined by using discounted cash flow. This method evaluates Whitebread's equity price
compared to their competitors. According to the method, intrinsic value can be identified on the
basis of projected cash flows for the future period. In such respect, abnormal earning (AE) is the
difference between actual and required earnings. It can be calculated through using following
formula:
AE = actual earnings t– required earnings t
OR
AE = NOPAT t– (r*BV t-1)
Here, NOPAT – Net operating profit after tax
r - Cost of equity
BV t-1- Equity book value at t-1
Cost of equity can be identified by Capital Assets Pricing Model (CAPM). It uses both the
expected return and risk associated with it to predict share price (Cui and et.al., 2012). As per this
model, cost of equity is determined by using following formula:
Cost of equity = Risk free rate + Beta value (Expected market return – risk free rate)
Ke = 1.79% + 0.8951 (3.59% – 1.79%)
Ke = 3.40%
This method considers time value of money through using risk free rate (rf). With the help of
this, Whitebread can determine weighted average cost of capital (WACC) (Magni, 2015). This rate
is used to compute present values of estimated free cash flows for the forthcoming years. With
reference to Whitebread Plc, its cost of debt (Kd) is 8.01% and cost of equity is 3.40%. Hence,
WACC will be as follows:
WACC = Ke*E+Kd*(1-Tc)*ND/(E+ND)
As per the appendix, it can be seen that WACC for Whitebread Plc is 4.08% while annual
WACC is 8.2%. Each year's net operating margin has been determined by dividing net operating
profit after tax with the sales revenue (Tanha and Foroutan, 2013). Whitebread's NOPM% is
15.59% and 15.16% for the year 2014 and 2015 respectively. While, WACC has been used to
determine PV of identified abnormal operating profit. Its total value of operation is 4683. Further,
its net operating assets has been discounted by using WACC so as to take into account the time
value of money (Tham and Vélez-Pareja, 2016). While, free cash flow (FCF) has been determined
by using following equation:
FCF = EBIT * (1-Tc)+depreciation and amortization – changes in working capital – CAPEX
Here, EBIT – Earning before interest and taxes
CAPEX – Capital expenditures
6
⊘ This is a preview!⊘
Do you want full access?
Subscribe today to unlock all pages.
Trusted by 1+ million students worldwide
Tc – Corporation tax rates
With reference to Whitebread Plc, its FCF are 185, 23, -43, 88, 158, 241, 170, 309, 367, 447
while PV of FCF at using 8.2% WACC is 21, -37, 70, 115, 163, 106, 178, 196 and 3871
respectively. This in turn, value from operations will be 4683. While, Whitebread's net debt is 4085
hence, total value of equity will be (4683-598) = 4085. Outstanding equity share is 182.50 hence,
per share price will be as under:
Intrinsic value of equity = 4085/182.50 = 22.38
While, on 26 February, 2015, its market value is 52.55 comparatively very high than
intrinsic value of 22.38. It indicates that Whitebread's share price is not correctly valued as it is
overvalued by 30.17. It implies that Whitebread's potential investors will not overpay for investing
in its equity.
(d) Advantage and limitations of cash flow and enterprise-based valuation models
Earning based valuation model is a method to identify intrinsic value of the share. It is based
on net earnings and book value, also EBITcalled discounted cash flow method.
Advantages:
It can be use to determine business value and can be easily applied to deal with complex
business situations. Moreover, it identify intrinsic value on the basis of projected earnings rather
than assets (Parikh, 2010). Shareholders can take effective investment decisions by comparing
values of different organizations identified on the basis of DCF method.
Limitations:
It is based on the cash flow projection while in the present age, market is highly volatile.
Thus, determination of correct intrinsic value is largely dependent upon accurate estimation of
future cash flows (Advantage and disadvantage of valuation models, n.d.). Moreover, technological
advancement, political fluctuations, economic cycle, competitions level etc have a direct impact on
potential cash flows. Thus, it is clear that projection of potential cash flows is very difficult task due
to unforeseen future events.
CONCLUSION
Present project report concluded that Whitebread's operational performance is good because
of higher ROE, operating spread and less NIR. While, management need to improve its RONA and
financial leverage by increasing turnover, controlling its overheads and larger use of debt funds than
equity. It will unable Whitebread to pay its long term debts timely and effectively. On contrary to it,
abnormal earning and FCF valuation method concluded that Whitebread's security price is
overvalued by 30.17 because its Intrinsic value is 22.38 while its market price is 52.55.
7
Paraphrase This Document
Need a fresh take? Get an instant paraphrase of this document with our AI Paraphraser
REFERENCES
Books and Journals
Feng, C.M. and Wang, R.T., 2000. Performance evaluation for airlines including the consideration
of financial ratios. Journal of Air Transport Management. 6(3). pp. 133-142.
Heikal, M., Khaddafi, M. and Ummah, A., 2014. Influence Analysis of Return on Assets (ROA),
Return on Equity (ROE), Net Profit Margin (NPM), Debt To Equity Ratio (DER), and
current ratio (CR), Against Corporate Profit Growth In Automotive In Indonesia Stock
Exchange. International Journal of Academic Research in Business and Social Sciences.
4(12). p. 101.
Kumbirai, M. and Webb, R., 2013. A financial ratio analysis of commercial bank performance in
South Africa. African Review of Economics and Finance. 2(1). pp. 30-53.
Lyle, M.R., Callen, J.L. and Elliott, R.J., 2013. Dynamic risk, accounting-based valuation and firm
fundamentals. Review of Accounting Studies. 18(4). pp.899-929.
Gleason, C.A., Bruce Johnson, W. and Li, H., 2013. Valuation model use and the price target
performance of Sell‐Side equity analysts*. Contemporary Accounting Research. 30(1).
pp.80-115.
Imam, S., Chan, J. and Shah, S.Z.A., 2013. Equity valuation models and target price accuracy in
Europe: Evidence from equity reports. International Review of Financial Analysis. 28. pp.9-
19.
Chen, L.H. and et.al., 2013. Accounting conservatism, earnings persistence, and pricing multiples
on earnings. Accounting Horizons. 28(2). pp.233-260.
Magni, C.A., 2015. Investment, financing and the role of ROA and WACC in value creation.
European Journal of Operational Research. 244(3). pp.855-866.
Tham, J. and Vélez-Pareja, I., 2016. Diferencias entre WACC deflactado y WACC real: use el
deflactado. Cuadernos Latinoamericanos de Administración. 7(13). pp.7-13.
Tanha, F.H. and Foroutan, M., 2013. How to get correct result from weighted average cost of capital
(WACC) formula and avoid a common pitfall in calculating WACC: An analysis of Miller
(2009) and Pierru's (2009) articles. African Journal of Business Management. 7(22).
pp.2079.
Park, K. and Jang, S.S., 2013. Capital structure, free cash flow, diversification and firm
performance: A holistic analysis. International Journal of Hospitality Management. 33.
pp.51-63.
Cui, X. and et.al., 2012. Better than Dynamic Mean‐Variance: Time Inconsistency and Free Cash
8
Flow Stream. Mathematical Finance. 22(2). pp.346-378.
Online
Advantage and disadvantage of valuation models, n.d. [Pdf]. Available through:
<http://www.bmioa.com/docs/bv004.pdf>. [Accessed on 21st May, 2016].
Analysing and interpreting financial statement, n.d. [Pdf]. Available through:
<http://faculty.babson.edu/halsey/acc7500/DuPont%20analysis%20%96%20operating
%20method.pdf>. [Accessed on 21st May, 2016]
Parikh, V., 2010. Advantage and disadvantage of DCF method. [Online]. Available through:
<http://www.letslearnfinance.com/advantages-and-disadvantages-of-dcf-method.html>.
[Accessed on 21st May, 2016].
9
⊘ This is a preview!⊘
Do you want full access?
Subscribe today to unlock all pages.
Trusted by 1+ million students worldwide
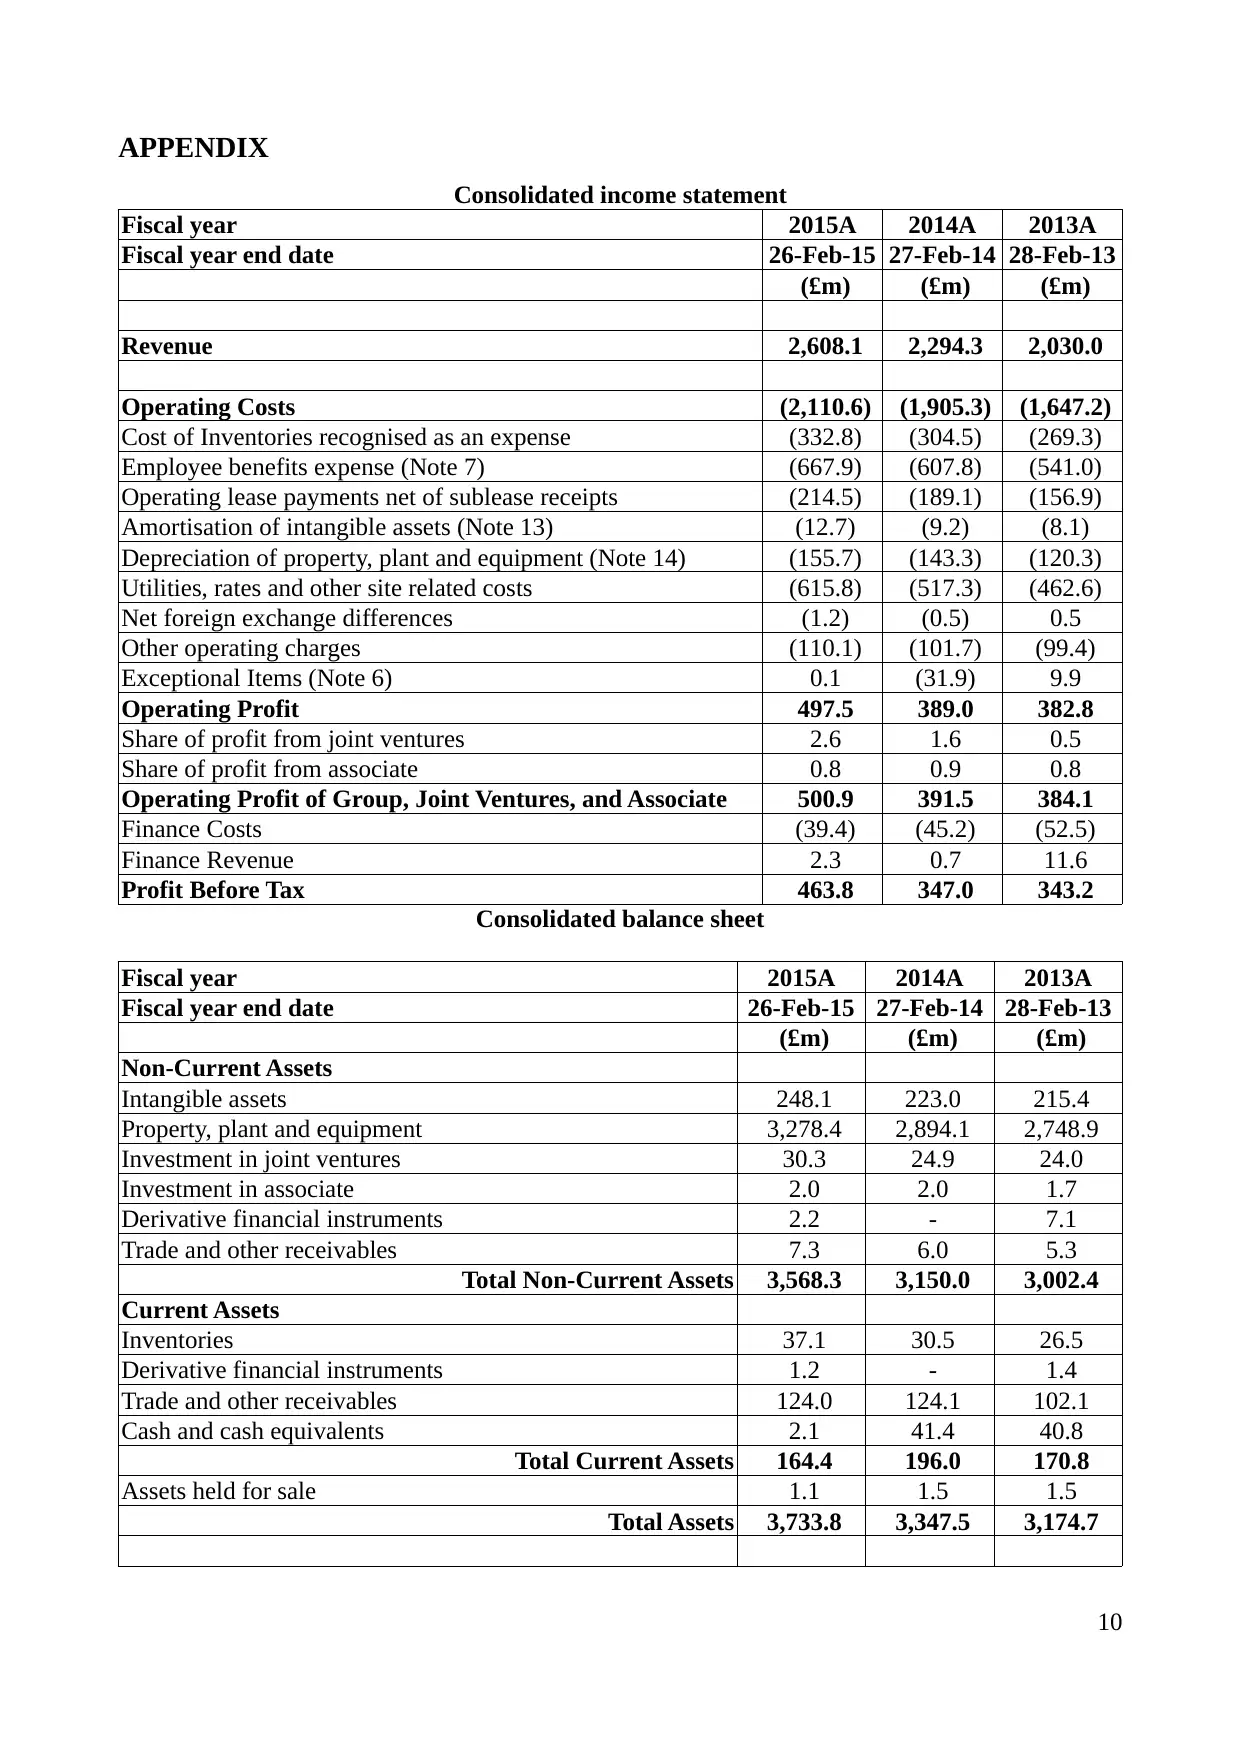
APPENDIX
Consolidated income statement
Fiscal year 2015A 2014A 2013A
Fiscal year end date 26-Feb-15 27-Feb-14 28-Feb-13
(£m) (£m) (£m)
Revenue 2,608.1 2,294.3 2,030.0
Operating Costs (2,110.6) (1,905.3) (1,647.2)
Cost of Inventories recognised as an expense (332.8) (304.5) (269.3)
Employee benefits expense (Note 7) (667.9) (607.8) (541.0)
Operating lease payments net of sublease receipts (214.5) (189.1) (156.9)
Amortisation of intangible assets (Note 13) (12.7) (9.2) (8.1)
Depreciation of property, plant and equipment (Note 14) (155.7) (143.3) (120.3)
Utilities, rates and other site related costs (615.8) (517.3) (462.6)
Net foreign exchange differences (1.2) (0.5) 0.5
Other operating charges (110.1) (101.7) (99.4)
Exceptional Items (Note 6) 0.1 (31.9) 9.9
Operating Profit 497.5 389.0 382.8
Share of profit from joint ventures 2.6 1.6 0.5
Share of profit from associate 0.8 0.9 0.8
Operating Profit of Group, Joint Ventures, and Associate 500.9 391.5 384.1
Finance Costs (39.4) (45.2) (52.5)
Finance Revenue 2.3 0.7 11.6
Profit Before Tax 463.8 347.0 343.2
Consolidated balance sheet
Fiscal year 2015A 2014A 2013A
Fiscal year end date 26-Feb-15 27-Feb-14 28-Feb-13
(£m) (£m) (£m)
Non-Current Assets
Intangible assets 248.1 223.0 215.4
Property, plant and equipment 3,278.4 2,894.1 2,748.9
Investment in joint ventures 30.3 24.9 24.0
Investment in associate 2.0 2.0 1.7
Derivative financial instruments 2.2 - 7.1
Trade and other receivables 7.3 6.0 5.3
Total Non-Current Assets 3,568.3 3,150.0 3,002.4
Current Assets
Inventories 37.1 30.5 26.5
Derivative financial instruments 1.2 - 1.4
Trade and other receivables 124.0 124.1 102.1
Cash and cash equivalents 2.1 41.4 40.8
Total Current Assets 164.4 196.0 170.8
Assets held for sale 1.1 1.5 1.5
Total Assets 3,733.8 3,347.5 3,174.7
10
Paraphrase This Document
Need a fresh take? Get an instant paraphrase of this document with our AI Paraphraser
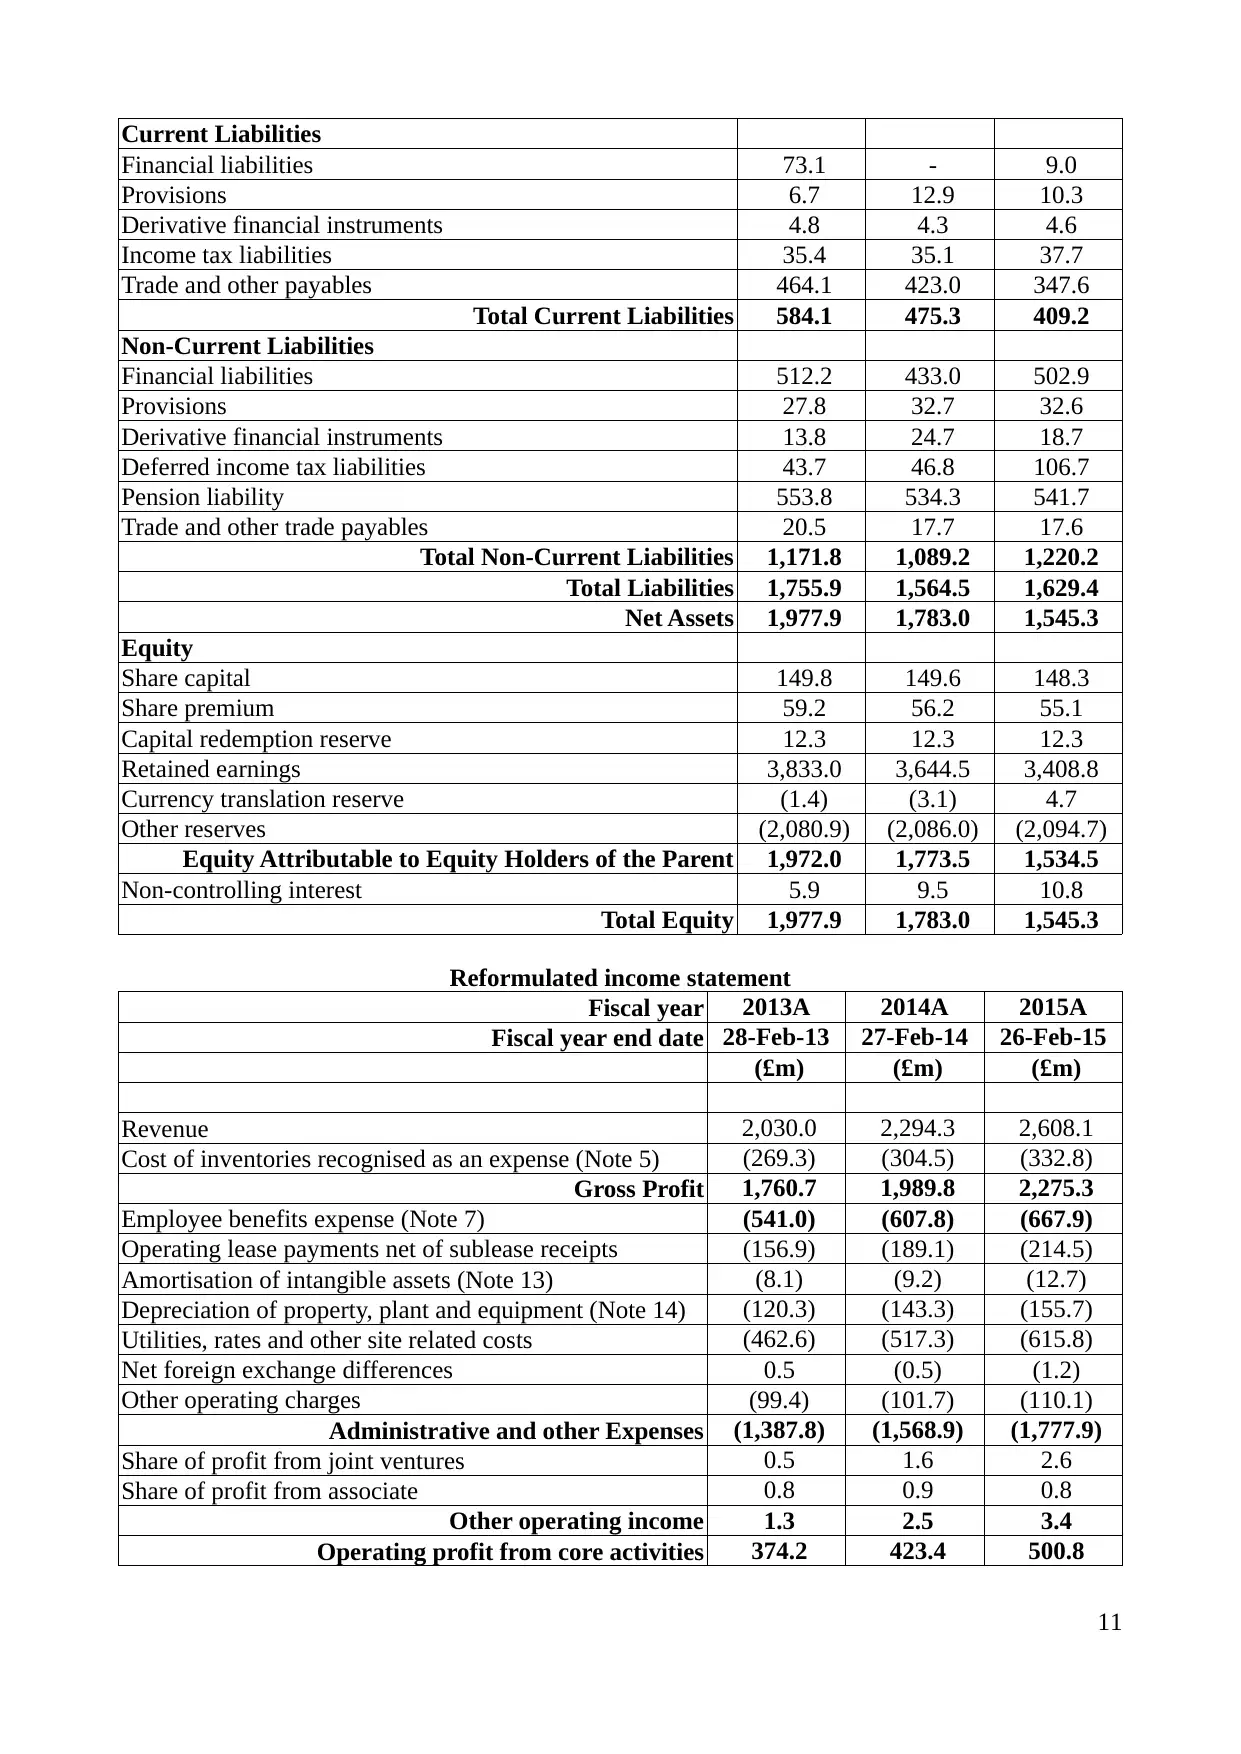
Current Liabilities
Financial liabilities 73.1 - 9.0
Provisions 6.7 12.9 10.3
Derivative financial instruments 4.8 4.3 4.6
Income tax liabilities 35.4 35.1 37.7
Trade and other payables 464.1 423.0 347.6
Total Current Liabilities 584.1 475.3 409.2
Non-Current Liabilities
Financial liabilities 512.2 433.0 502.9
Provisions 27.8 32.7 32.6
Derivative financial instruments 13.8 24.7 18.7
Deferred income tax liabilities 43.7 46.8 106.7
Pension liability 553.8 534.3 541.7
Trade and other trade payables 20.5 17.7 17.6
Total Non-Current Liabilities 1,171.8 1,089.2 1,220.2
Total Liabilities 1,755.9 1,564.5 1,629.4
Net Assets 1,977.9 1,783.0 1,545.3
Equity
Share capital 149.8 149.6 148.3
Share premium 59.2 56.2 55.1
Capital redemption reserve 12.3 12.3 12.3
Retained earnings 3,833.0 3,644.5 3,408.8
Currency translation reserve (1.4) (3.1) 4.7
Other reserves (2,080.9) (2,086.0) (2,094.7)
Equity Attributable to Equity Holders of the Parent 1,972.0 1,773.5 1,534.5
Non-controlling interest 5.9 9.5 10.8
Total Equity 1,977.9 1,783.0 1,545.3
Reformulated income statement
Fiscal year 2013A 2014A 2015A
Fiscal year end date 28-Feb-13 27-Feb-14 26-Feb-15
(£m) (£m) (£m)
Revenue 2,030.0 2,294.3 2,608.1
Cost of inventories recognised as an expense (Note 5) (269.3) (304.5) (332.8)
Gross Profit 1,760.7 1,989.8 2,275.3
Employee benefits expense (Note 7) (541.0) (607.8) (667.9)
Operating lease payments net of sublease receipts (156.9) (189.1) (214.5)
Amortisation of intangible assets (Note 13) (8.1) (9.2) (12.7)
Depreciation of property, plant and equipment (Note 14) (120.3) (143.3) (155.7)
Utilities, rates and other site related costs (462.6) (517.3) (615.8)
Net foreign exchange differences 0.5 (0.5) (1.2)
Other operating charges (99.4) (101.7) (110.1)
Administrative and other Expenses (1,387.8) (1,568.9) (1,777.9)
Share of profit from joint ventures 0.5 1.6 2.6
Share of profit from associate 0.8 0.9 0.8
Other operating income 1.3 2.5 3.4
Operating profit from core activities 374.2 423.4 500.8
11
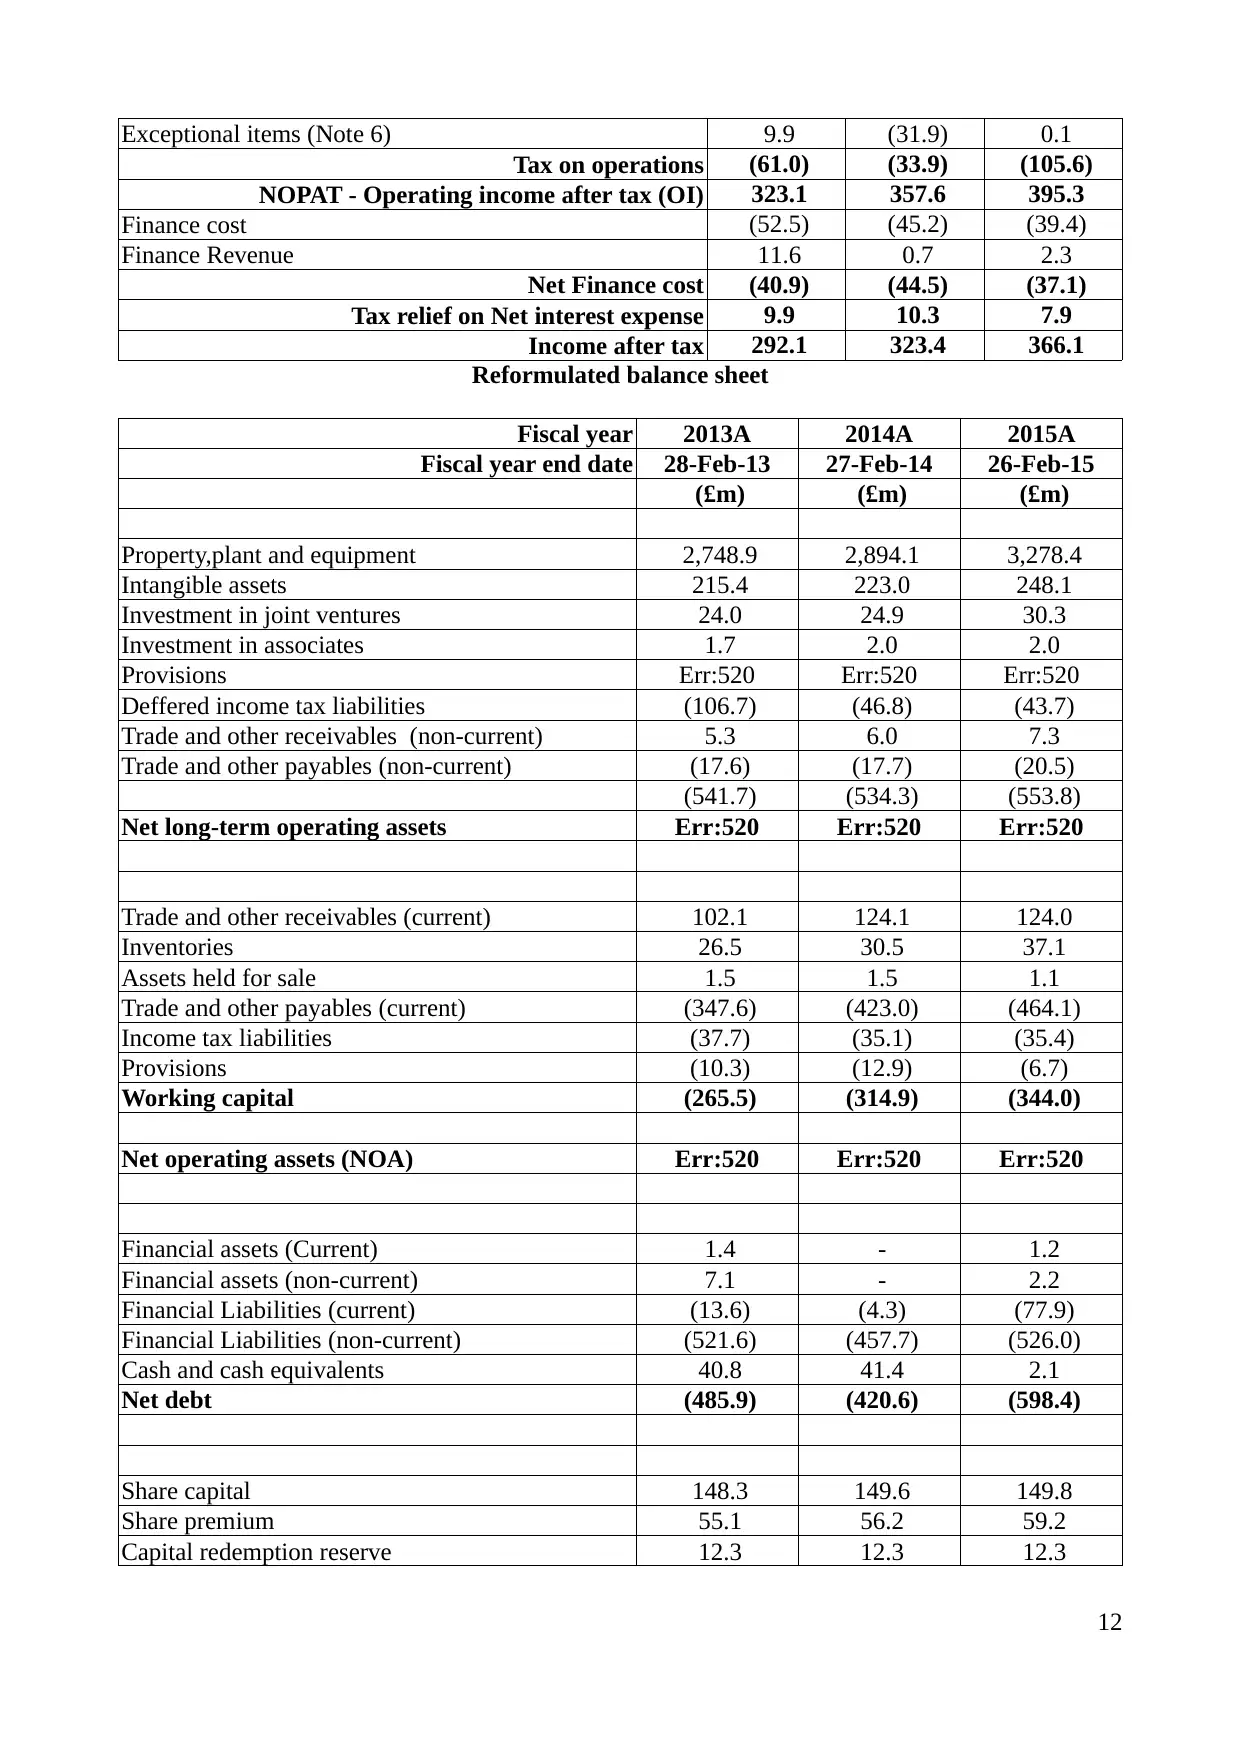
Exceptional items (Note 6) 9.9 (31.9) 0.1
Tax on operations (61.0) (33.9) (105.6)
NOPAT - Operating income after tax (OI) 323.1 357.6 395.3
Finance cost (52.5) (45.2) (39.4)
Finance Revenue 11.6 0.7 2.3
Net Finance cost (40.9) (44.5) (37.1)
Tax relief on Net interest expense 9.9 10.3 7.9
Income after tax 292.1 323.4 366.1
Reformulated balance sheet
Fiscal year 2013A 2014A 2015A
Fiscal year end date 28-Feb-13 27-Feb-14 26-Feb-15
(£m) (£m) (£m)
Property,plant and equipment 2,748.9 2,894.1 3,278.4
Intangible assets 215.4 223.0 248.1
Investment in joint ventures 24.0 24.9 30.3
Investment in associates 1.7 2.0 2.0
Provisions Err:520 Err:520 Err:520
Deffered income tax liabilities (106.7) (46.8) (43.7)
Trade and other receivables (non-current) 5.3 6.0 7.3
Trade and other payables (non-current) (17.6) (17.7) (20.5)
(541.7) (534.3) (553.8)
Net long-term operating assets Err:520 Err:520 Err:520
Trade and other receivables (current) 102.1 124.1 124.0
Inventories 26.5 30.5 37.1
Assets held for sale 1.5 1.5 1.1
Trade and other payables (current) (347.6) (423.0) (464.1)
Income tax liabilities (37.7) (35.1) (35.4)
Provisions (10.3) (12.9) (6.7)
Working capital (265.5) (314.9) (344.0)
Net operating assets (NOA) Err:520 Err:520 Err:520
Financial assets (Current) 1.4 - 1.2
Financial assets (non-current) 7.1 - 2.2
Financial Liabilities (current) (13.6) (4.3) (77.9)
Financial Liabilities (non-current) (521.6) (457.7) (526.0)
Cash and cash equivalents 40.8 41.4 2.1
Net debt (485.9) (420.6) (598.4)
Share capital 148.3 149.6 149.8
Share premium 55.1 56.2 59.2
Capital redemption reserve 12.3 12.3 12.3
12
⊘ This is a preview!⊘
Do you want full access?
Subscribe today to unlock all pages.
Trusted by 1+ million students worldwide
1 out of 14
Related Documents


Your All-in-One AI-Powered Toolkit for Academic Success.
+13062052269
info@desklib.com
Available 24*7 on WhatsApp / Email
![[object Object]](/_next/static/media/star-bottom.7253800d.svg)
Unlock your academic potential
Copyright © 2020–2026 A2Z Services. All Rights Reserved. Developed and managed by ZUCOL.