Comprehensive Financial Statement Analysis: Woolworths Group Report

Verified

Added on  2019/10/30

|21
|3261
|127
Report
AI Summary
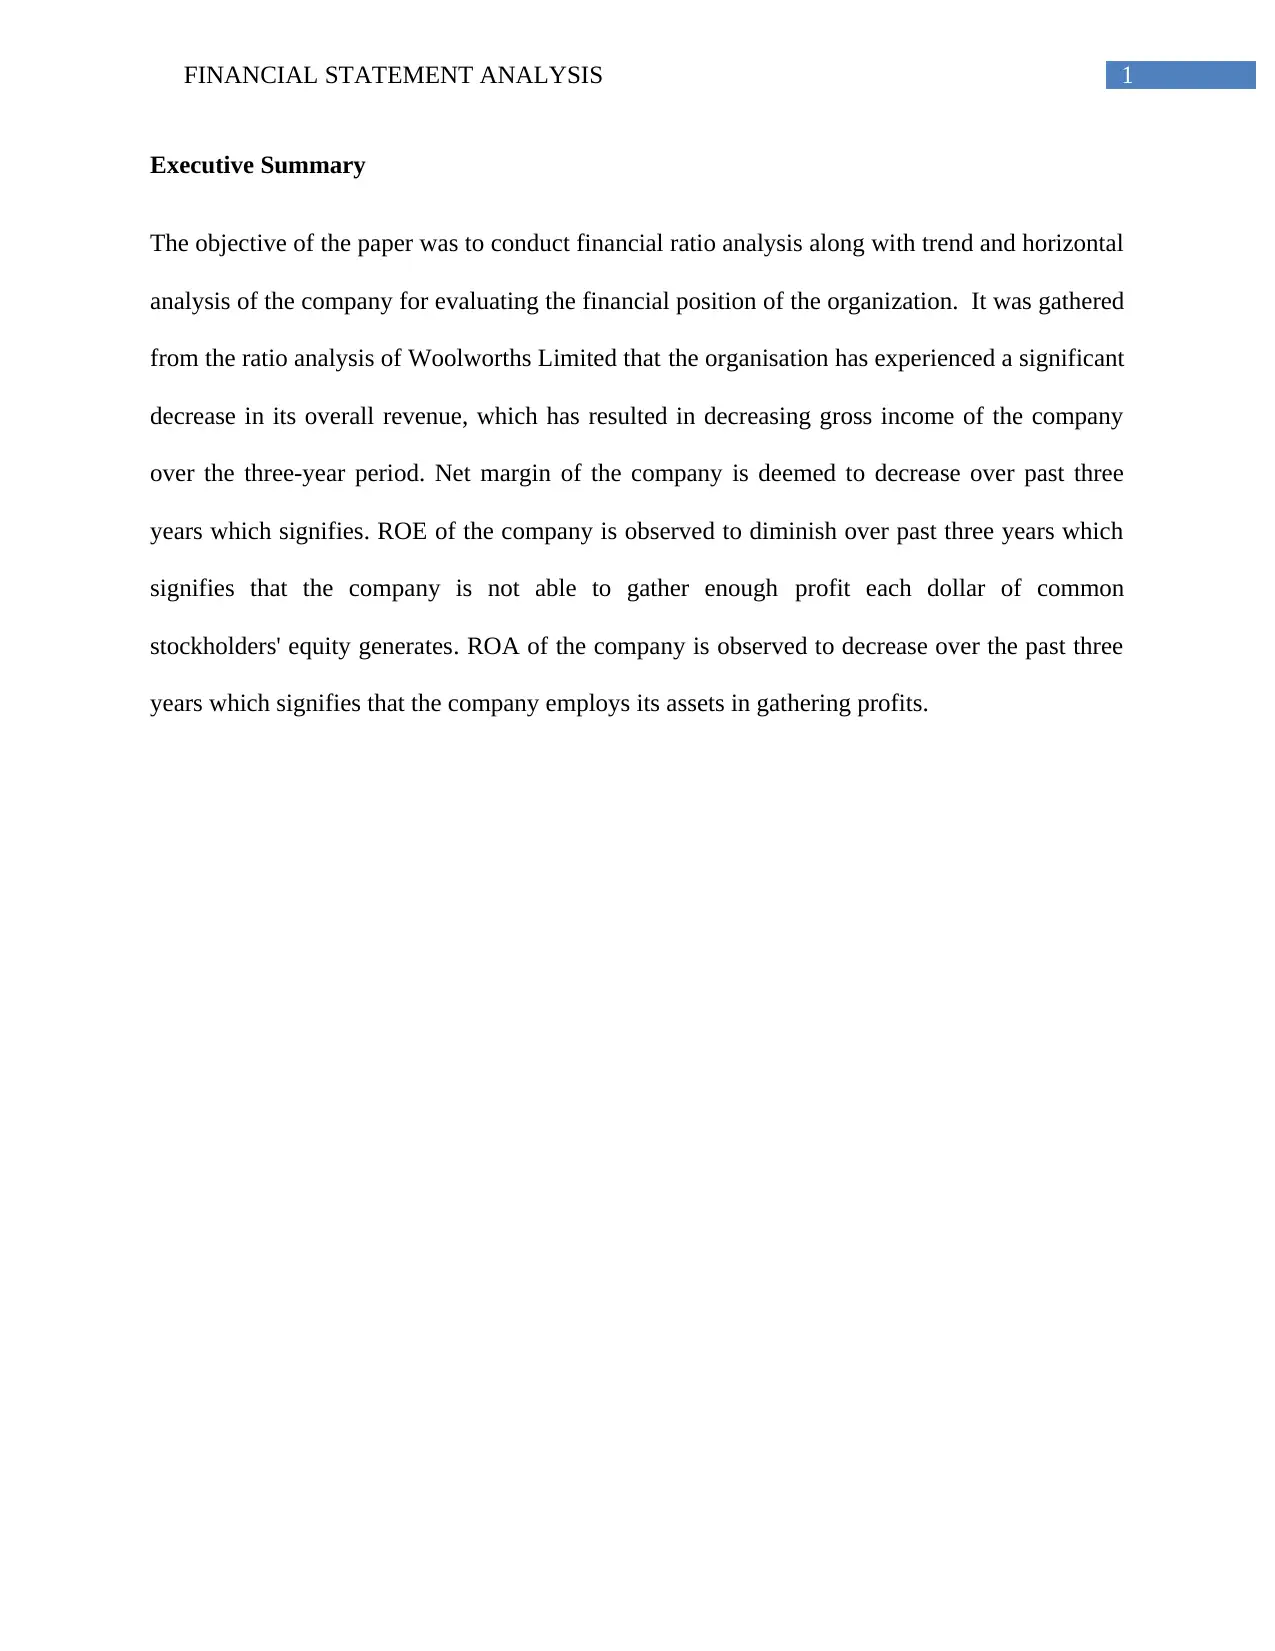
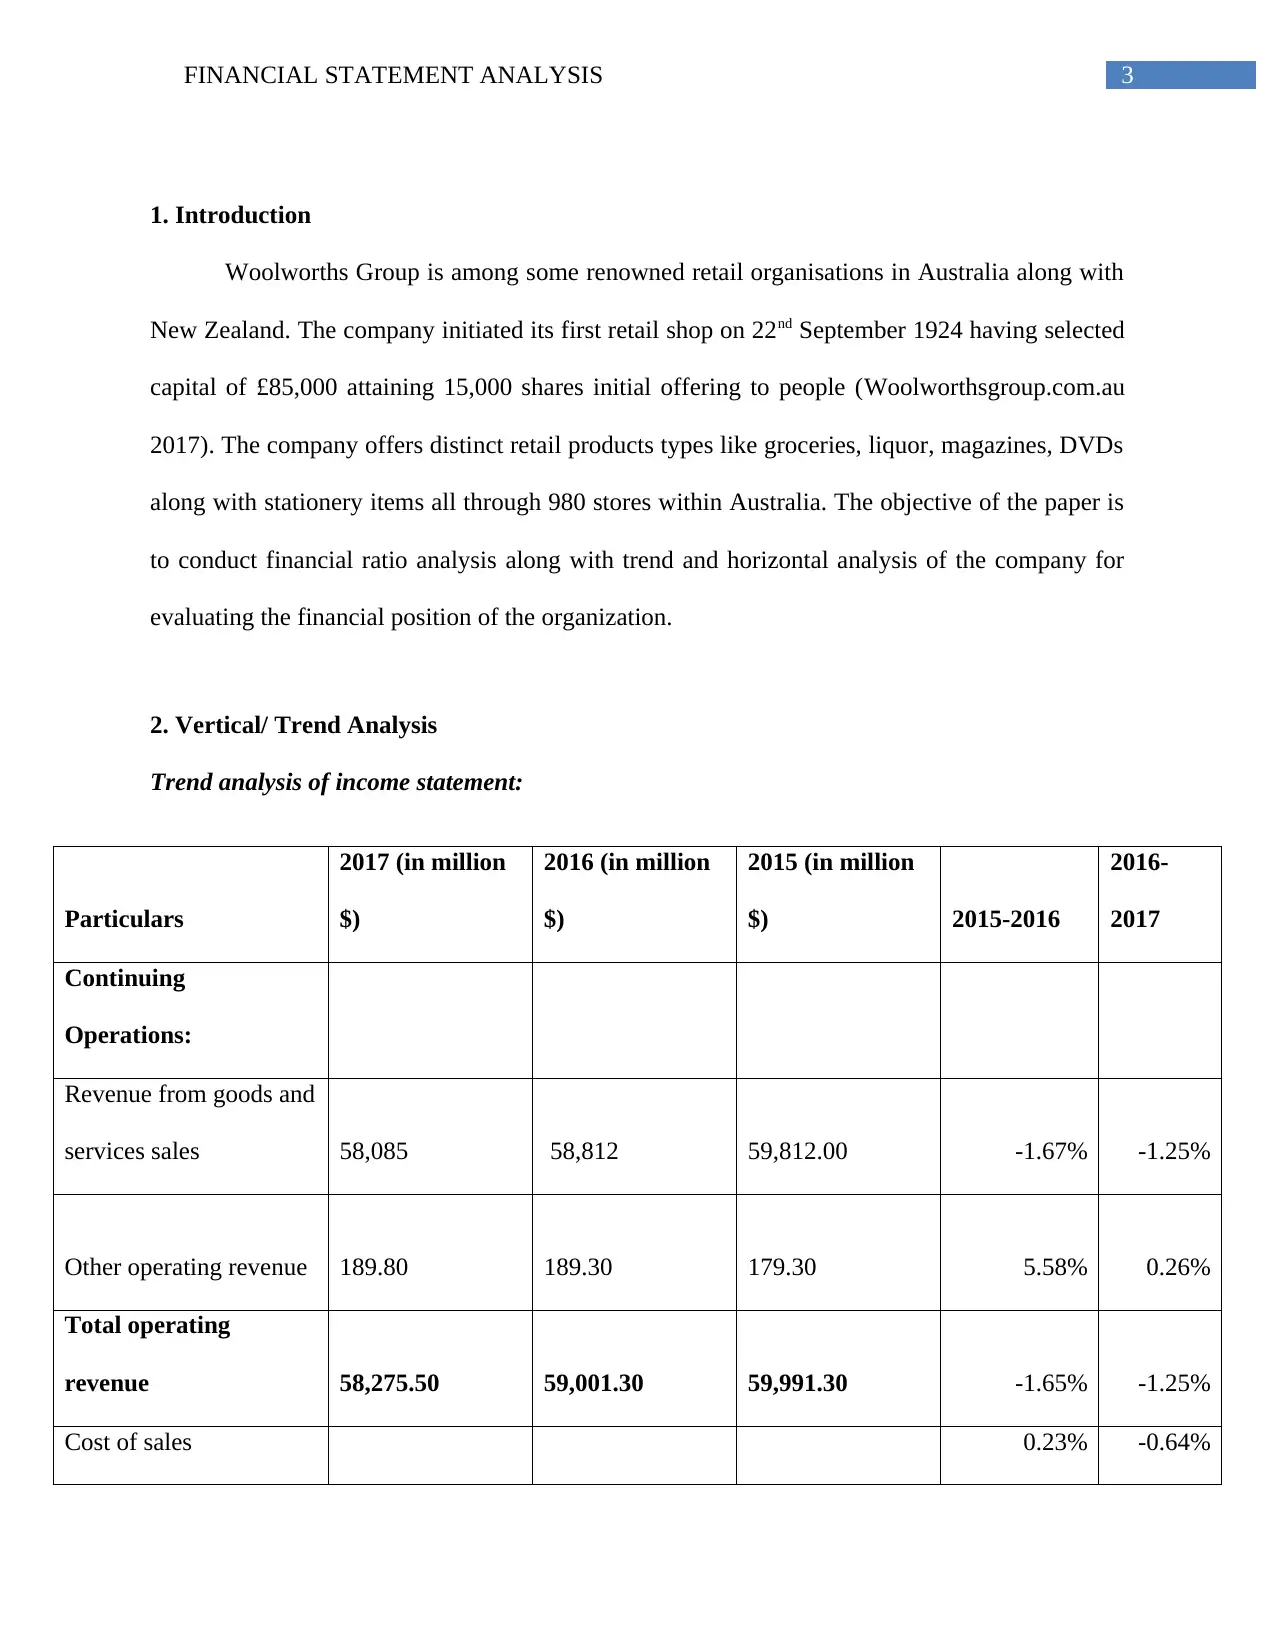
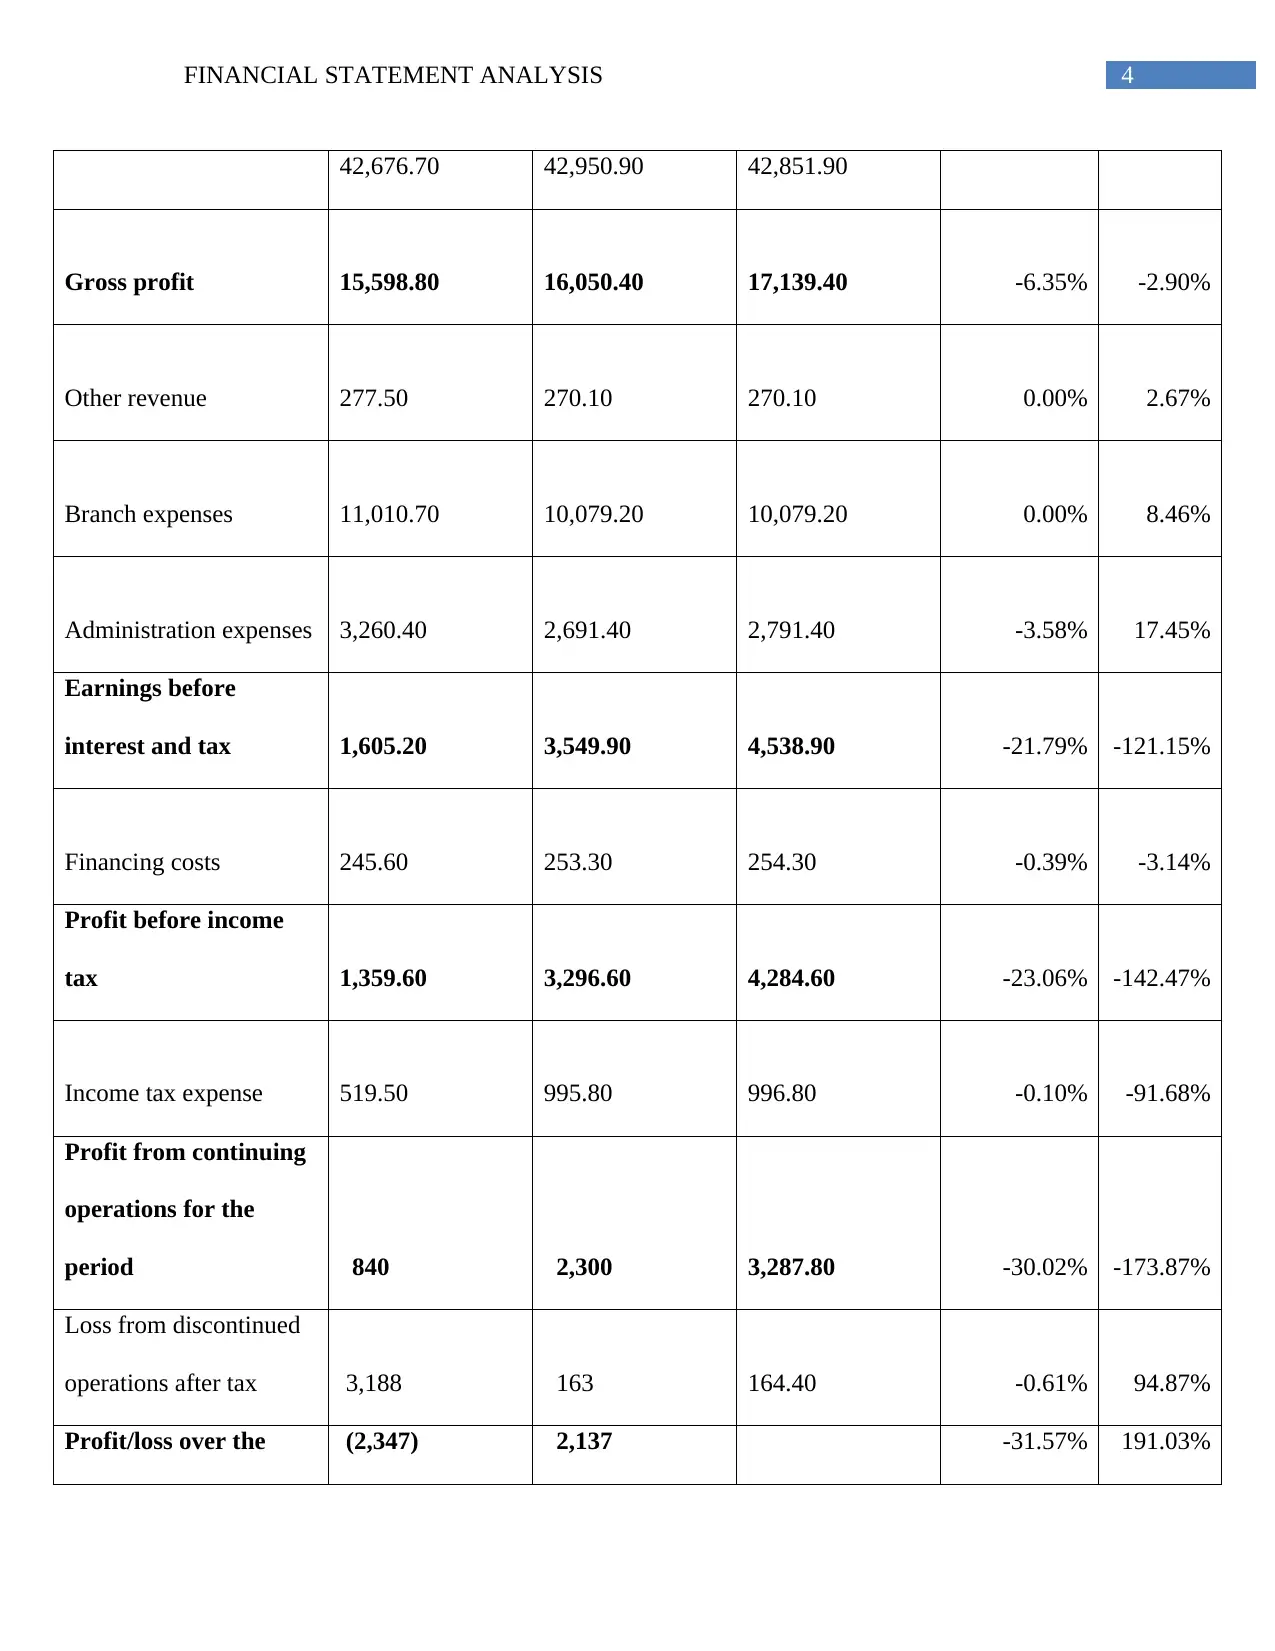
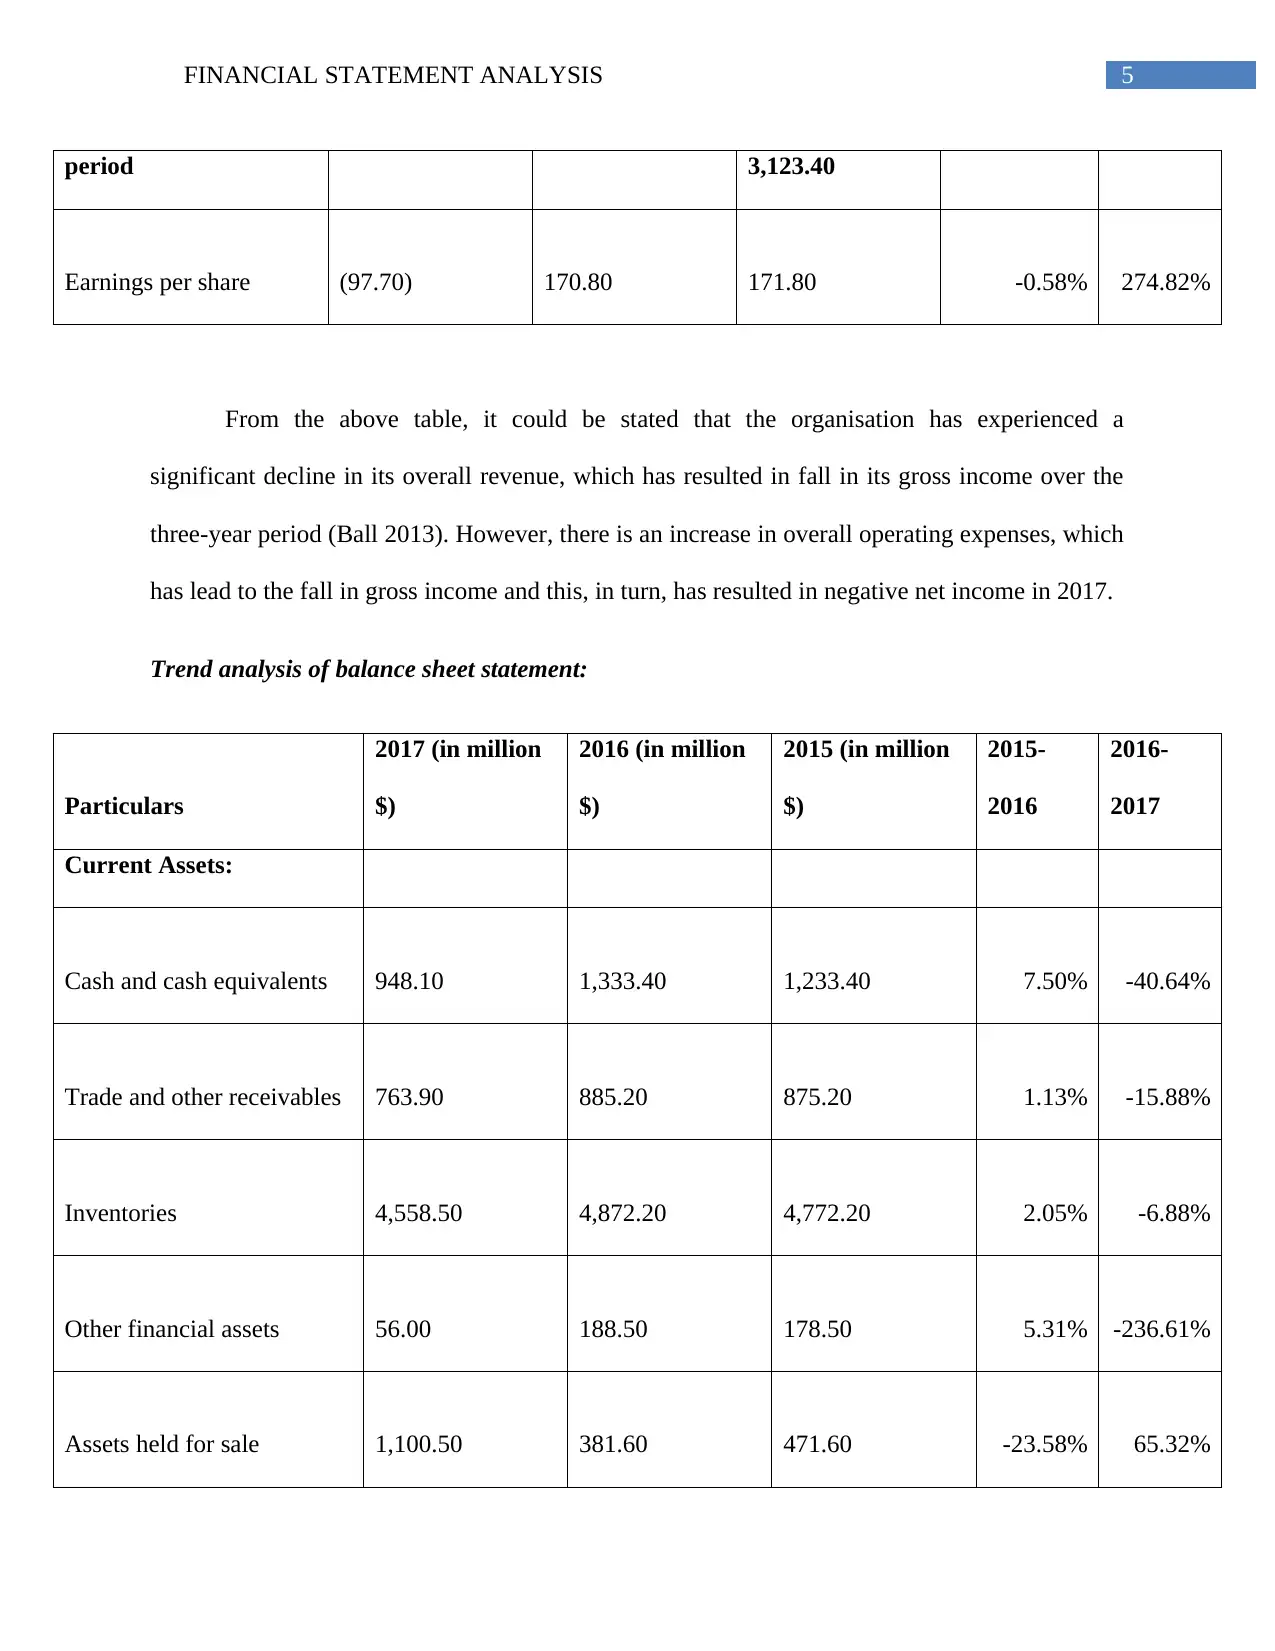
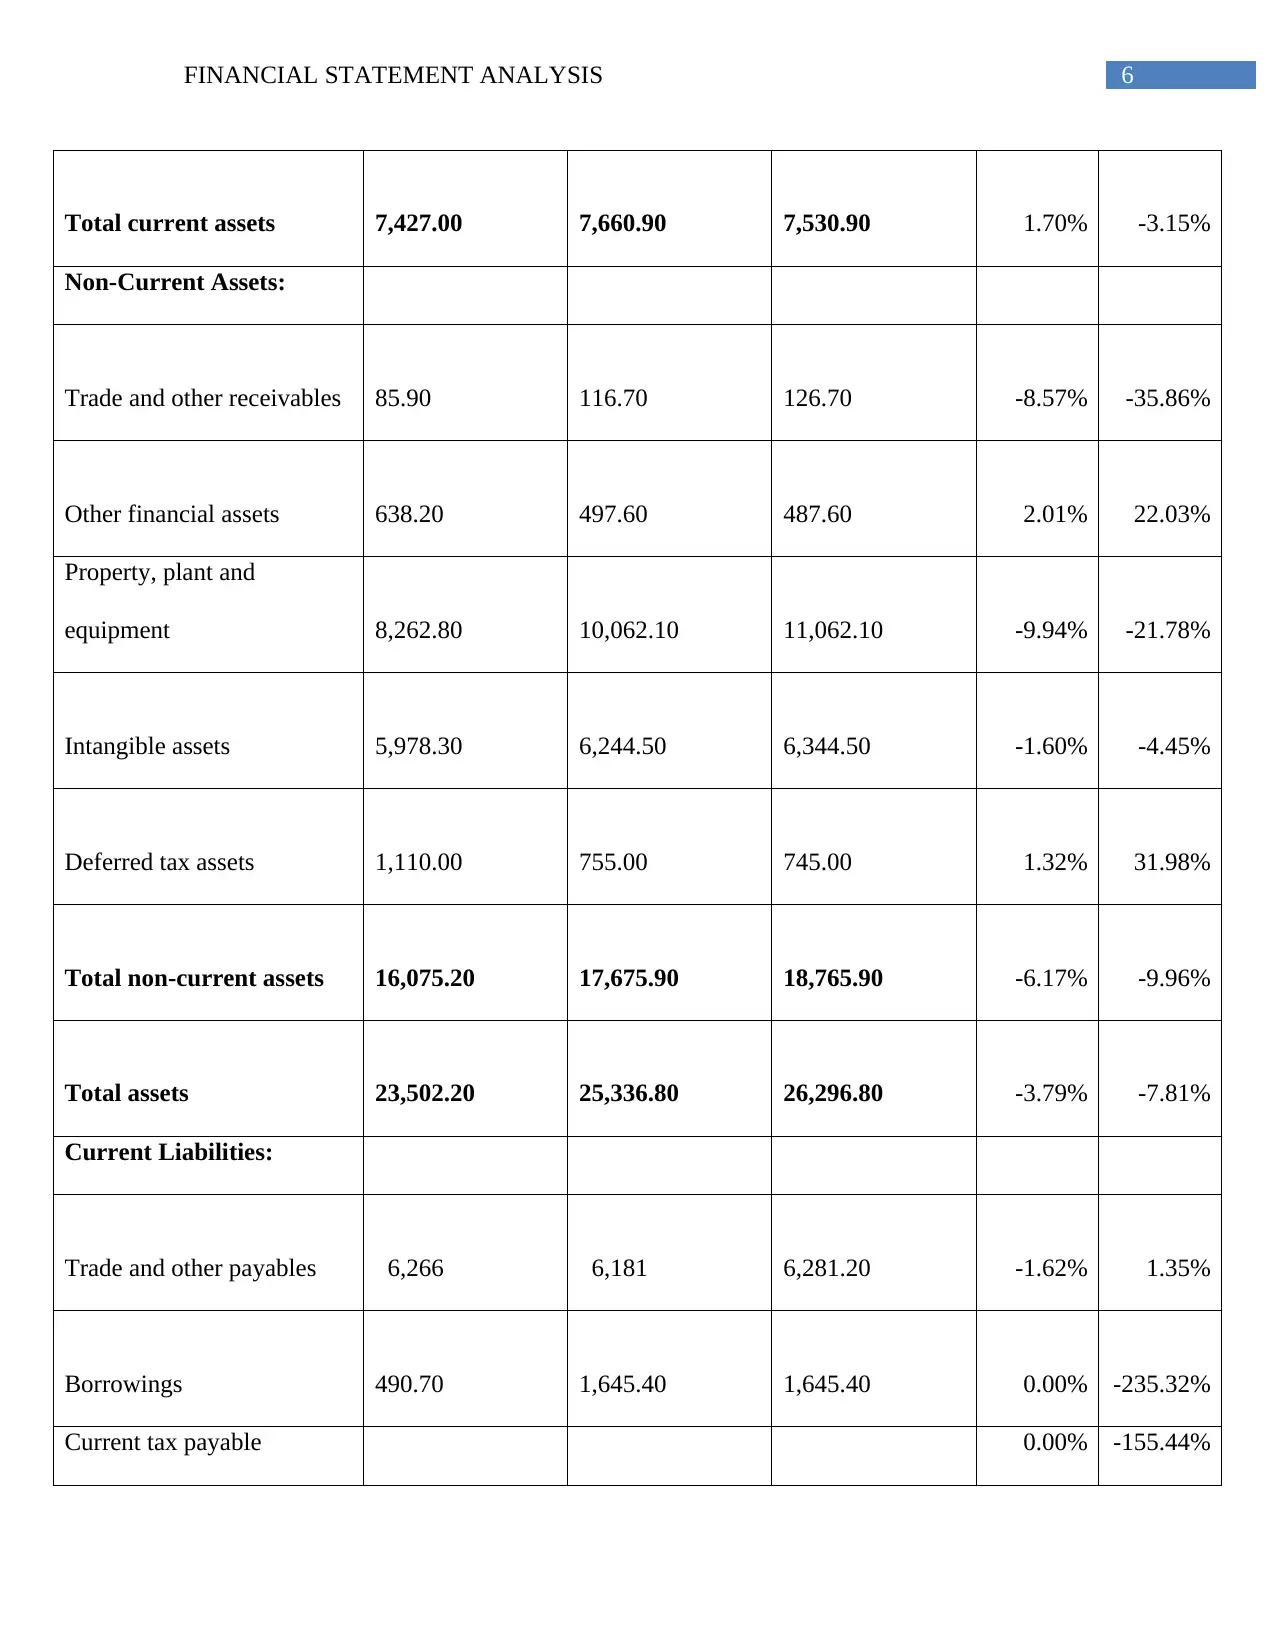
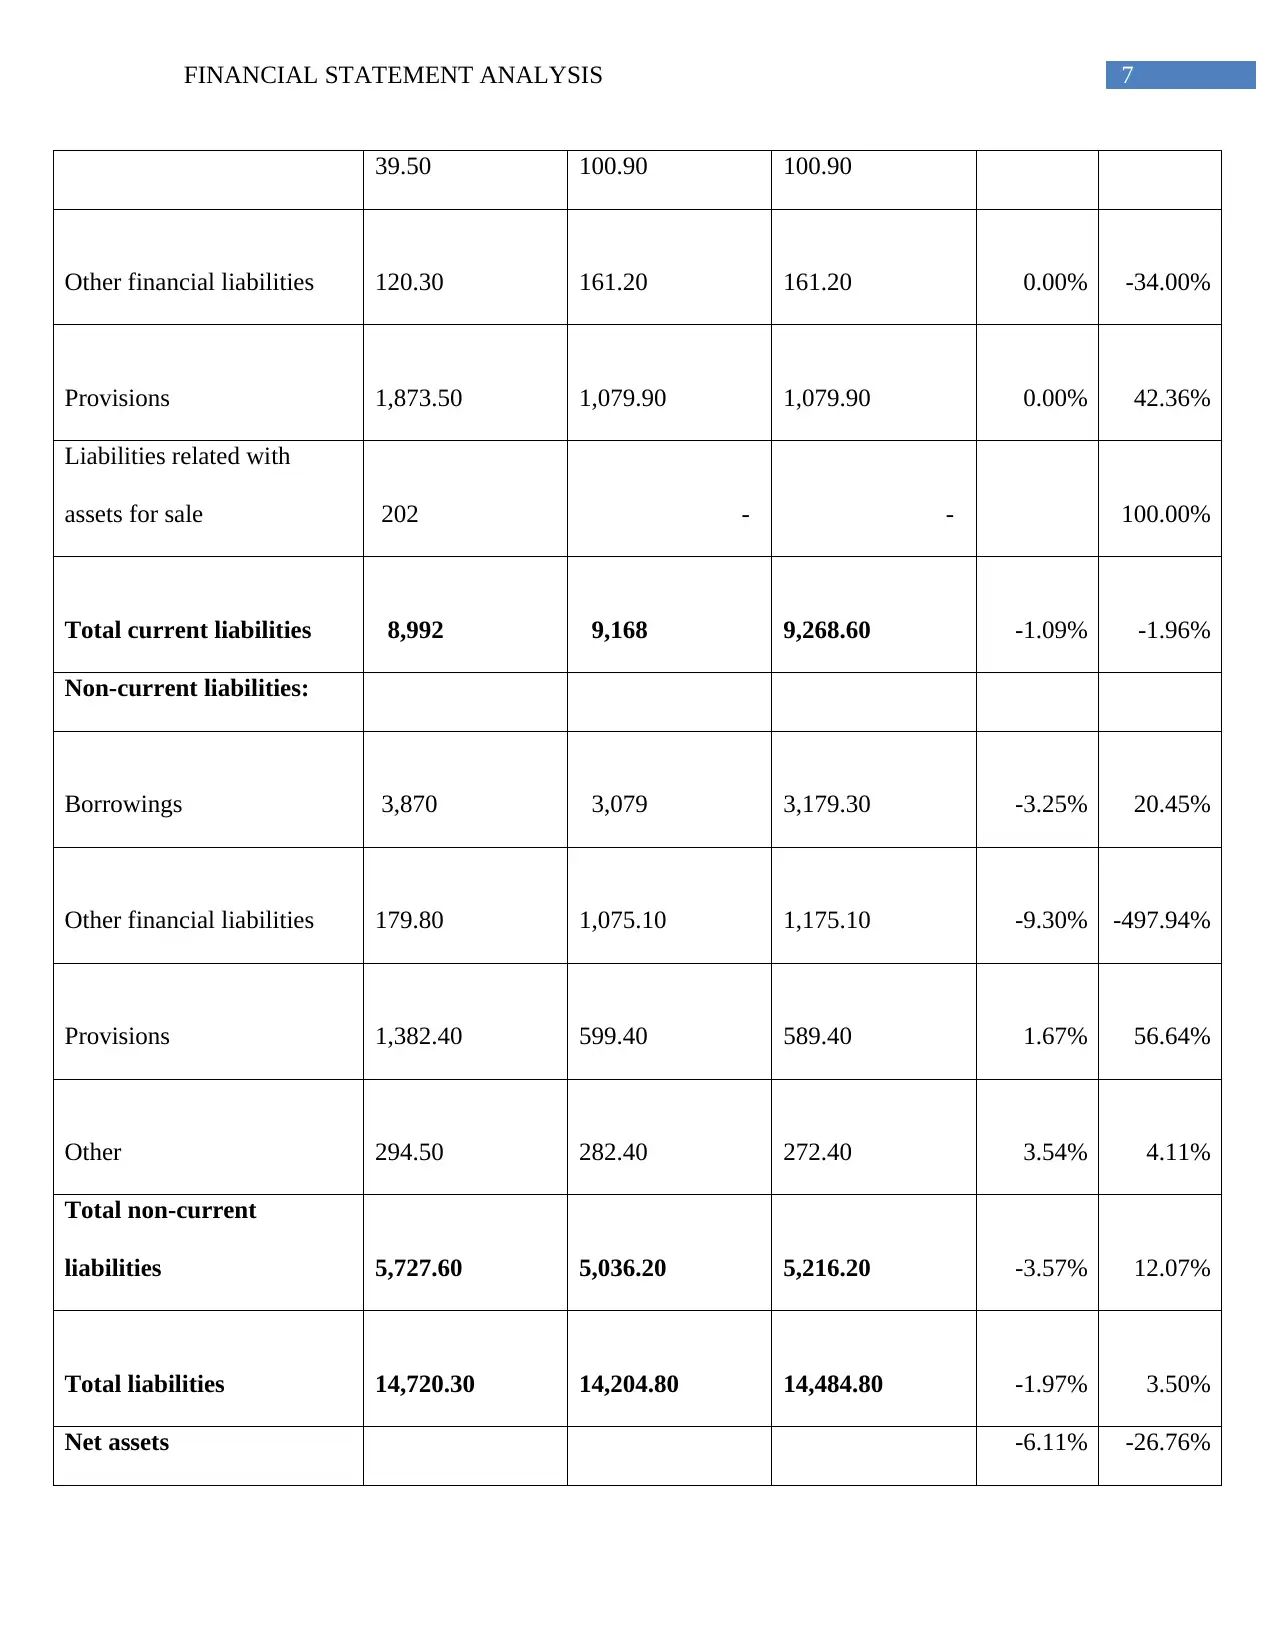
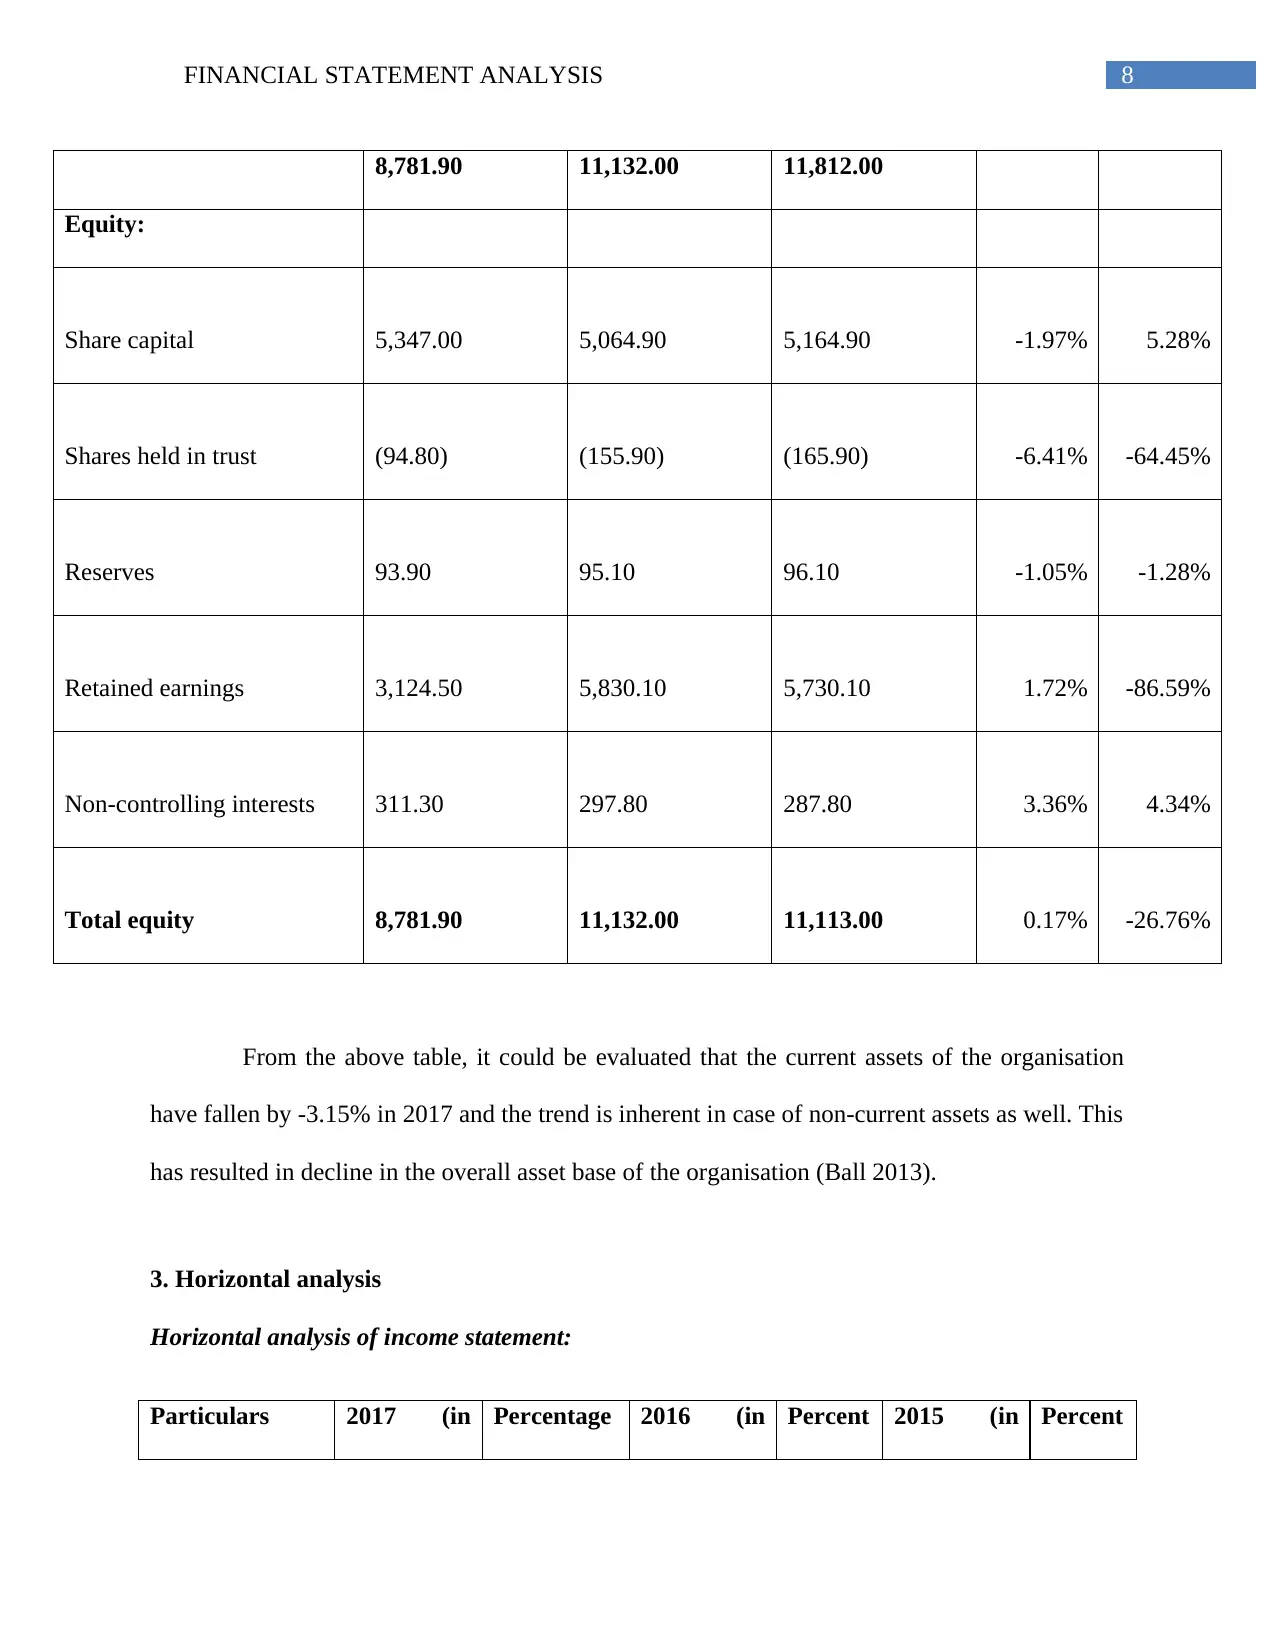
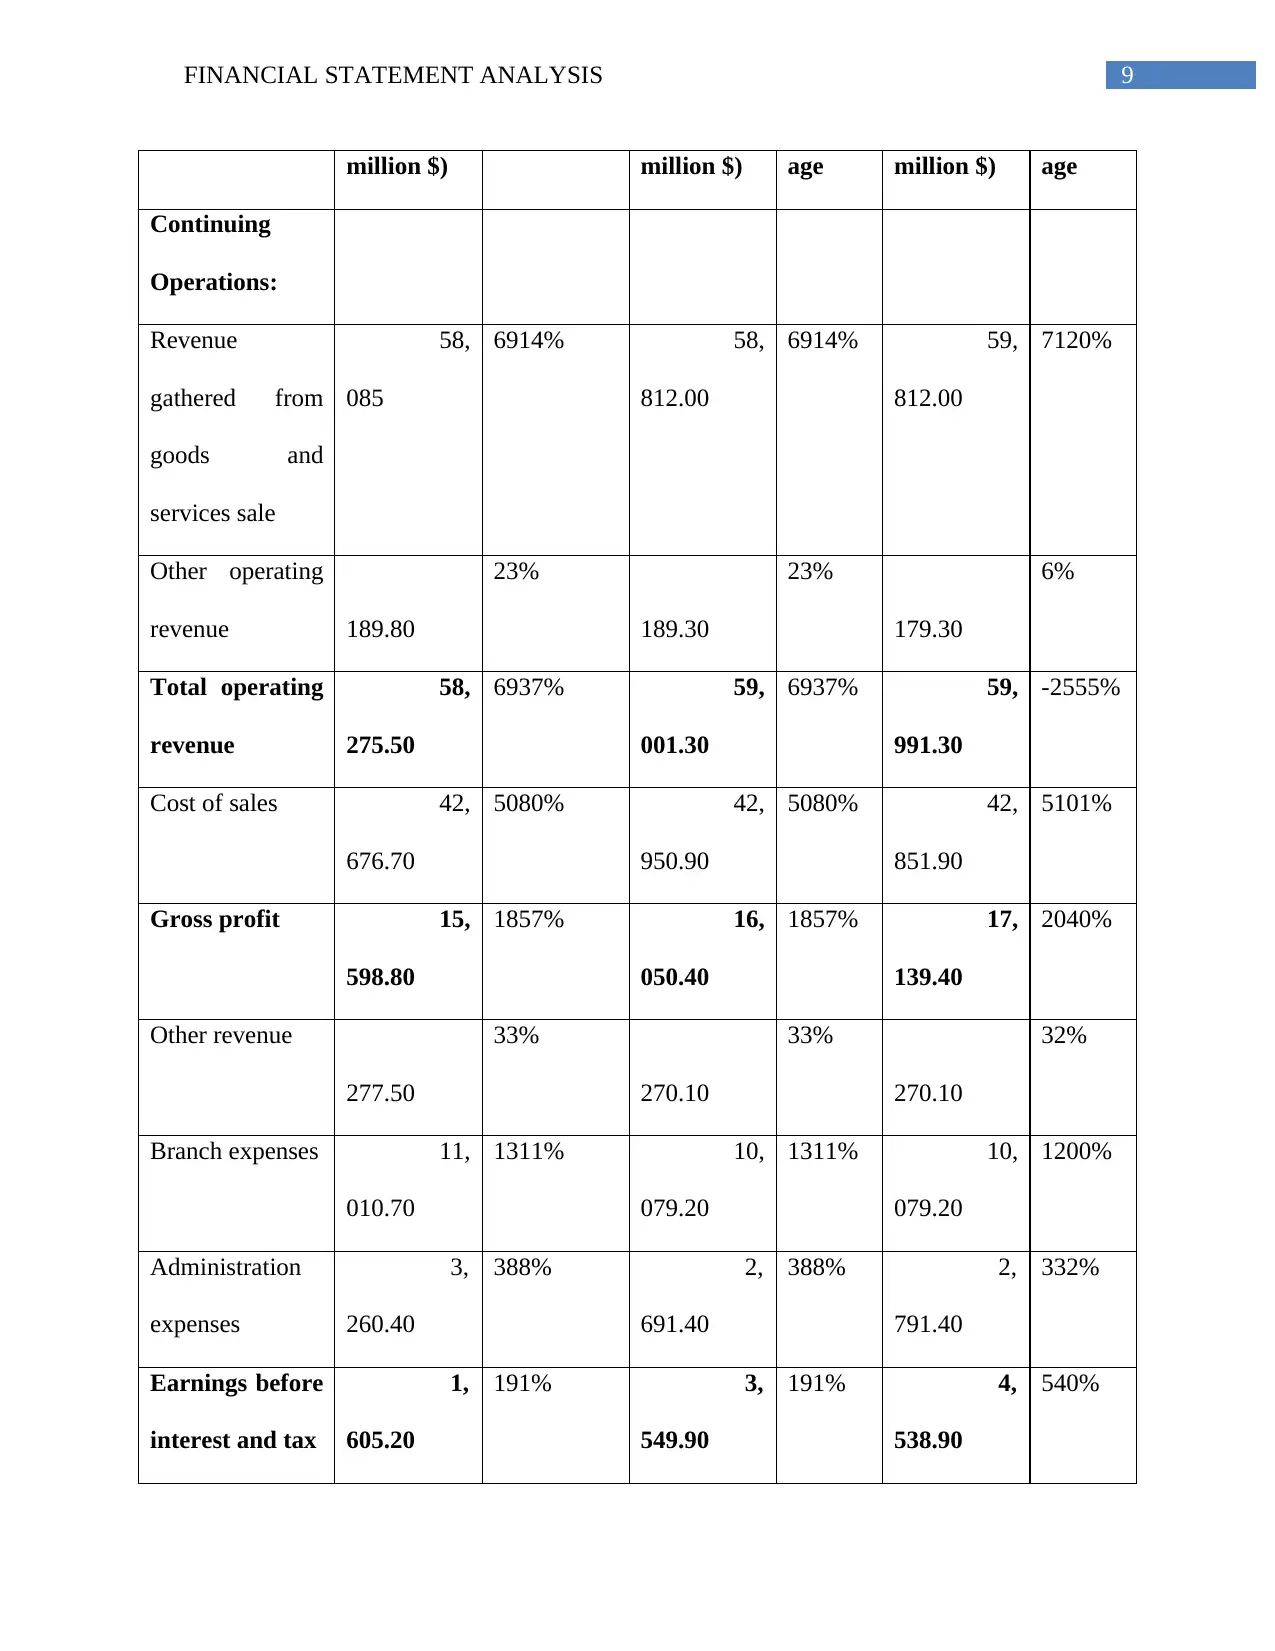
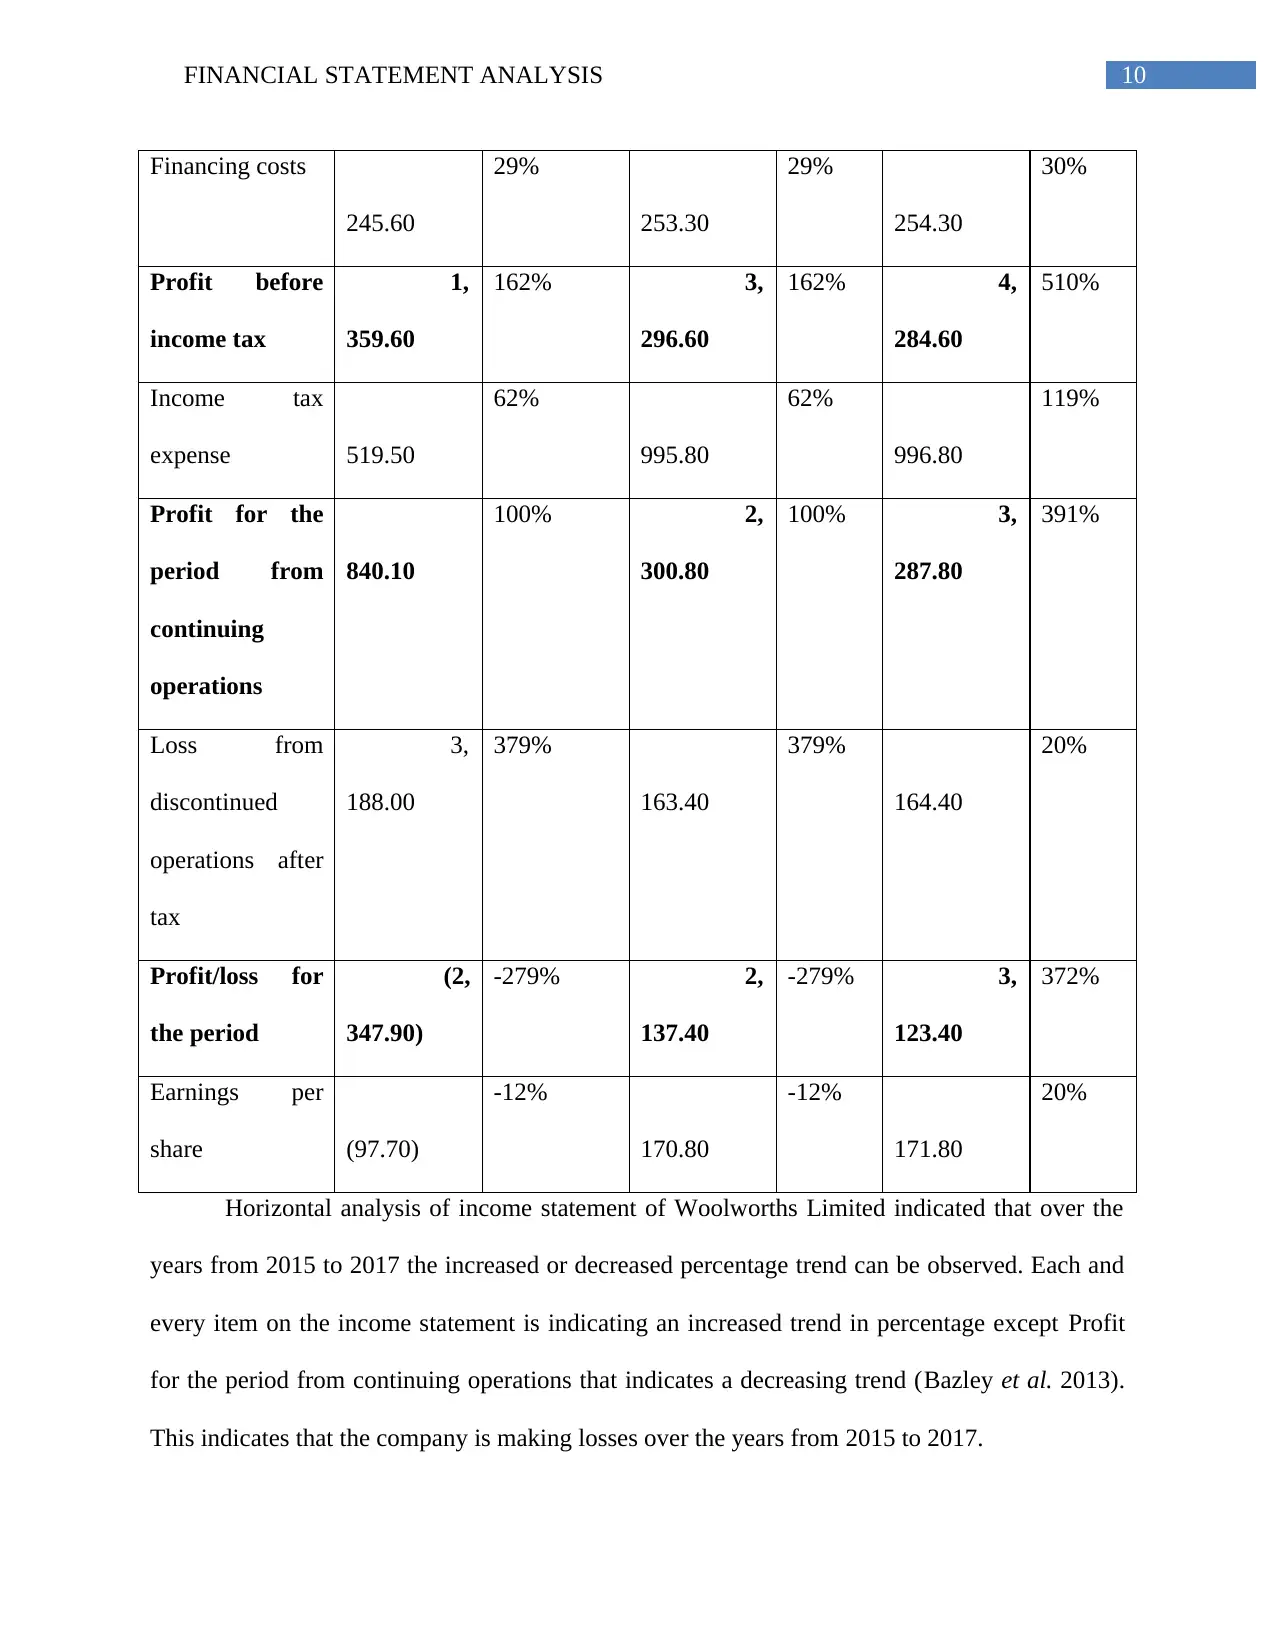
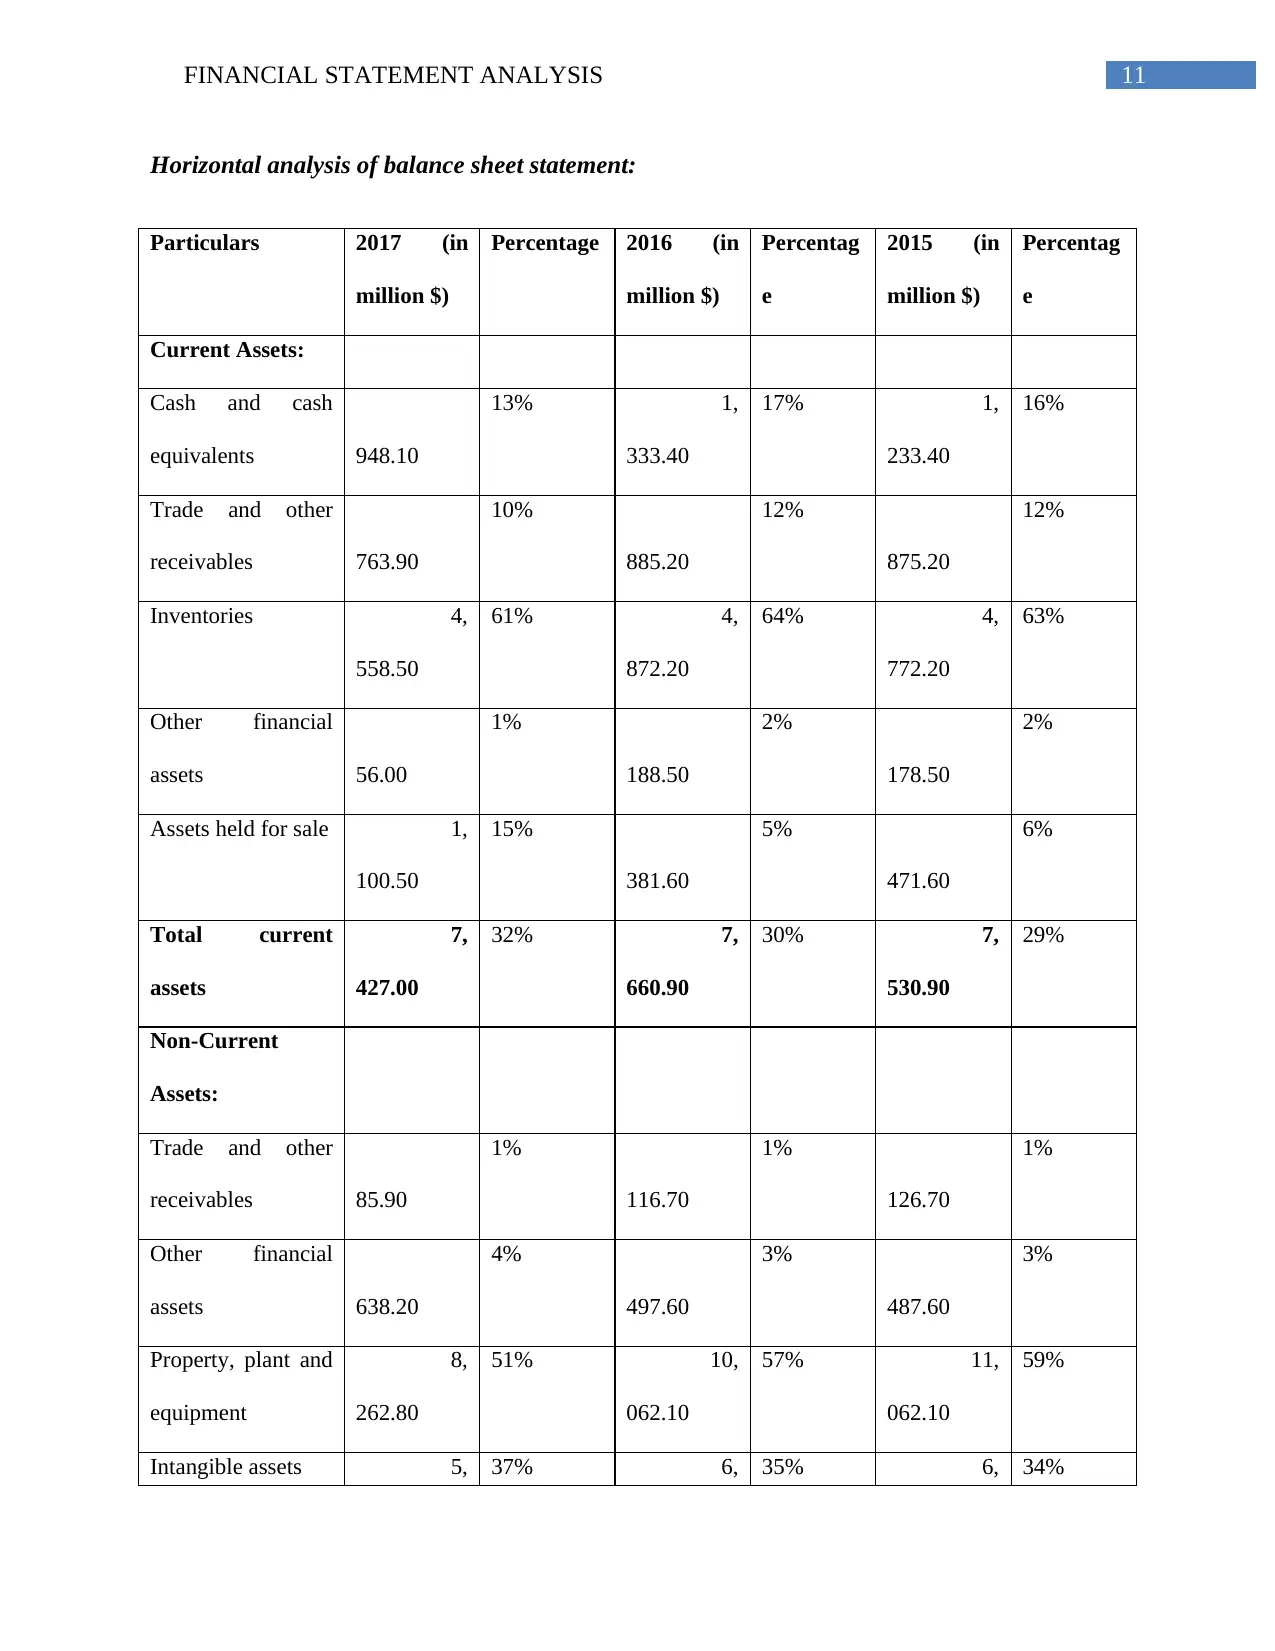
This report provides a detailed financial analysis of Woolworths Group, examining its financial performance from 2015 to 2017. The analysis encompasses trend and horizontal analyses of the income statement and balance sheet, revealing significant declines in revenue and asset values. Ratio analysis, including profitability, liquidity, efficiency, and solvency ratios, further evaluates the company's financial position. Key findings indicate decreasing operating and net margins, declining ROE and ROA, and a decrease in the current ratio. Efficiency ratios show a decrease in inventory turnover, and debtors' turnover. The report concludes that the company experienced a decline in financial performance during the analyzed period. All the data, tables and figures are included in the report. The assignment is contributed by a student to be published on the website Desklib, a platform which provides all the necessary AI based study tools for students.
Document Page
Running head: FINANCIAL STATEMENT ANALYSIS
Financial Statement Analysis of Woolworths
Name of the University:
Name of the Student:
Authors Note:
tabler-icon-diamond-filled.svg

Paraphrase This Document

Need a fresh take? Get an instant paraphrase of this document with our AI Paraphraser
Document Page
1FINANCIAL STATEMENT ANALYSIS
Executive Summary
The objective of the paper was to conduct financial ratio analysis along with trend and horizontal
analysis of the company for evaluating the financial position of the organization. It was gathered
from the ratio analysis of Woolworths Limited that the organisation has experienced a significant
decrease in its overall revenue, which has resulted in decreasing gross income of the company
over the three-year period. Net margin of the company is deemed to decrease over past three
years which signifies. ROE of the company is observed to diminish over past three years which
signifies that the company is not able to gather enough profit each dollar of common
stockholders' equity generates. ROA of the company is observed to decrease over the past three
years which signifies that the company employs its assets in gathering profits.
Document Page
2FINANCIAL STATEMENT ANALYSIS
Table of Contents
1. Introduction..................................................................................................................................3
2. Vertical/ Trend Analysis..............................................................................................................3
3. Horizontal analysis......................................................................................................................8
4. Ratio analysis.............................................................................................................................14
5. Conclusion.................................................................................................................................21
References......................................................................................................................................22
Document Page
3FINANCIAL STATEMENT ANALYSIS
1. Introduction
Woolworths Group is among some renowned retail organisations in Australia along with
New Zealand. The company initiated its first retail shop on 22nd September 1924 having selected
capital of £85,000 attaining 15,000 shares initial offering to people (Woolworthsgroup.com.au
2017). The company offers distinct retail products types like groceries, liquor, magazines, DVDs
along with stationery items all through 980 stores within Australia. The objective of the paper is
to conduct financial ratio analysis along with trend and horizontal analysis of the company for
evaluating the financial position of the organization.
2. Vertical/ Trend Analysis
Trend analysis of income statement:
Particulars
2017 (in million
$)
2016 (in million
$)
2015 (in million
$) 2015-2016
2016-
2017
Continuing
Operations:
Revenue from goods and
services sales 58,085 58,812 59,812.00 -1.67% -1.25%
Other operating revenue 189.80 189.30 179.30 5.58% 0.26%
Total operating
revenue 58,275.50 59,001.30 59,991.30 -1.65% -1.25%
Cost of sales 0.23% -0.64%
tabler-icon-diamond-filled.svg

Paraphrase This Document

Need a fresh take? Get an instant paraphrase of this document with our AI Paraphraser
Document Page
4FINANCIAL STATEMENT ANALYSIS
42,676.70 42,950.90 42,851.90
Gross profit 15,598.80 16,050.40 17,139.40 -6.35% -2.90%
Other revenue 277.50 270.10 270.10 0.00% 2.67%
Branch expenses 11,010.70 10,079.20 10,079.20 0.00% 8.46%
Administration expenses 3,260.40 2,691.40 2,791.40 -3.58% 17.45%
Earnings before
interest and tax 1,605.20 3,549.90 4,538.90 -21.79% -121.15%
Financing costs 245.60 253.30 254.30 -0.39% -3.14%
Profit before income
tax 1,359.60 3,296.60 4,284.60 -23.06% -142.47%
Income tax expense 519.50 995.80 996.80 -0.10% -91.68%
Profit from continuing
operations for the
period 840 2,300 3,287.80 -30.02% -173.87%
Loss from discontinued
operations after tax 3,188 163 164.40 -0.61% 94.87%
Profit/loss over the (2,347) 2,137 -31.57% 191.03%
Document Page
5FINANCIAL STATEMENT ANALYSIS
period 3,123.40
Earnings per share (97.70) 170.80 171.80 -0.58% 274.82%
From the above table, it could be stated that the organisation has experienced a
significant decline in its overall revenue, which has resulted in fall in its gross income over the
three-year period (Ball 2013). However, there is an increase in overall operating expenses, which
has lead to the fall in gross income and this, in turn, has resulted in negative net income in 2017.
Trend analysis of balance sheet statement:
Particulars
2017 (in million
$)
2016 (in million
$)
2015 (in million
$)
2015-
2016
2016-
2017
Current Assets:
Cash and cash equivalents 948.10 1,333.40 1,233.40 7.50% -40.64%
Trade and other receivables 763.90 885.20 875.20 1.13% -15.88%
Inventories 4,558.50 4,872.20 4,772.20 2.05% -6.88%
Other financial assets 56.00 188.50 178.50 5.31% -236.61%
Assets held for sale 1,100.50 381.60 471.60 -23.58% 65.32%
Document Page
6FINANCIAL STATEMENT ANALYSIS
Total current assets 7,427.00 7,660.90 7,530.90 1.70% -3.15%
Non-Current Assets:
Trade and other receivables 85.90 116.70 126.70 -8.57% -35.86%
Other financial assets 638.20 497.60 487.60 2.01% 22.03%
Property, plant and
equipment 8,262.80 10,062.10 11,062.10 -9.94% -21.78%
Intangible assets 5,978.30 6,244.50 6,344.50 -1.60% -4.45%
Deferred tax assets 1,110.00 755.00 745.00 1.32% 31.98%
Total non-current assets 16,075.20 17,675.90 18,765.90 -6.17% -9.96%
Total assets 23,502.20 25,336.80 26,296.80 -3.79% -7.81%
Current Liabilities:
Trade and other payables 6,266 6,181 6,281.20 -1.62% 1.35%
Borrowings 490.70 1,645.40 1,645.40 0.00% -235.32%
Current tax payable 0.00% -155.44%
tabler-icon-diamond-filled.svg

Paraphrase This Document

Need a fresh take? Get an instant paraphrase of this document with our AI Paraphraser
Document Page
7FINANCIAL STATEMENT ANALYSIS
39.50 100.90 100.90
Other financial liabilities 120.30 161.20 161.20 0.00% -34.00%
Provisions 1,873.50 1,079.90 1,079.90 0.00% 42.36%
Liabilities related with
assets for sale 202 - - 100.00%
Total current liabilities 8,992 9,168 9,268.60 -1.09% -1.96%
Non-current liabilities:
Borrowings 3,870 3,079 3,179.30 -3.25% 20.45%
Other financial liabilities 179.80 1,075.10 1,175.10 -9.30% -497.94%
Provisions 1,382.40 599.40 589.40 1.67% 56.64%
Other 294.50 282.40 272.40 3.54% 4.11%
Total non-current
liabilities 5,727.60 5,036.20 5,216.20 -3.57% 12.07%
Total liabilities 14,720.30 14,204.80 14,484.80 -1.97% 3.50%
Net assets -6.11% -26.76%
Document Page
8FINANCIAL STATEMENT ANALYSIS
8,781.90 11,132.00 11,812.00
Equity:
Share capital 5,347.00 5,064.90 5,164.90 -1.97% 5.28%
Shares held in trust (94.80) (155.90) (165.90) -6.41% -64.45%
Reserves 93.90 95.10 96.10 -1.05% -1.28%
Retained earnings 3,124.50 5,830.10 5,730.10 1.72% -86.59%
Non-controlling interests 311.30 297.80 287.80 3.36% 4.34%
Total equity 8,781.90 11,132.00 11,113.00 0.17% -26.76%
From the above table, it could be evaluated that the current assets of the organisation
have fallen by -3.15% in 2017 and the trend is inherent in case of non-current assets as well. This
has resulted in decline in the overall asset base of the organisation (Ball 2013).
3. Horizontal analysis
Horizontal analysis of income statement:
Particulars 2017 (in Percentage 2016 (in Percent 2015 (in Percent
Document Page
9FINANCIAL STATEMENT ANALYSIS
million $) million $) age million $) age
Continuing
Operations:
Revenue
gathered from
goods and
services sale
58,
085
6914% 58,
812.00
6914% 59,
812.00
7120%
Other operating
revenue 189.80
23%
189.30
23%
179.30
6%
Total operating
revenue
58,
275.50
6937% 59,
001.30
6937% 59,
991.30
-2555%
Cost of sales 42,
676.70
5080% 42,
950.90
5080% 42,
851.90
5101%
Gross profit 15,
598.80
1857% 16,
050.40
1857% 17,
139.40
2040%
Other revenue
277.50
33%
270.10
33%
270.10
32%
Branch expenses 11,
010.70
1311% 10,
079.20
1311% 10,
079.20
1200%
Administration
expenses
3,
260.40
388% 2,
691.40
388% 2,
791.40
332%
Earnings before
interest and tax
1,
605.20
191% 3,
549.90
191% 4,
538.90
540%
tabler-icon-diamond-filled.svg

Paraphrase This Document

Need a fresh take? Get an instant paraphrase of this document with our AI Paraphraser
Document Page
10FINANCIAL STATEMENT ANALYSIS
Financing costs
245.60
29%
253.30
29%
254.30
30%
Profit before
income tax
1,
359.60
162% 3,
296.60
162% 4,
284.60
510%
Income tax
expense 519.50
62%
995.80
62%
996.80
119%
Profit for the
period from
continuing
operations
840.10
100% 2,
300.80
100% 3,
287.80
391%
Loss from
discontinued
operations after
tax
3,
188.00
379%
163.40
379%
164.40
20%
Profit/loss for
the period
(2,
347.90)
-279% 2,
137.40
-279% 3,
123.40
372%
Earnings per
share (97.70)
-12%
170.80
-12%
171.80
20%
Horizontal analysis of income statement of Woolworths Limited indicated that over the
years from 2015 to 2017 the increased or decreased percentage trend can be observed. Each and
every item on the income statement is indicating an increased trend in percentage except Profit
for the period from continuing operations that indicates a decreasing trend (Bazley et al. 2013).
This indicates that the company is making losses over the years from 2015 to 2017.
Document Page
11FINANCIAL STATEMENT ANALYSIS
Horizontal analysis of balance sheet statement:
Particulars 2017 (in
million $)
Percentage 2016 (in
million $)
Percentag
e
2015 (in
million $)
Percentag
e
Current Assets:
Cash and cash
equivalents 948.10
13% 1,
333.40
17% 1,
233.40
16%
Trade and other
receivables 763.90
10%
885.20
12%
875.20
12%
Inventories 4,
558.50
61% 4,
872.20
64% 4,
772.20
63%
Other financial
assets 56.00
1%
188.50
2%
178.50
2%
Assets held for sale 1,
100.50
15%
381.60
5%
471.60
6%
Total current
assets
7,
427.00
32% 7,
660.90
30% 7,
530.90
29%
Non-Current
Assets:
Trade and other
receivables 85.90
1%
116.70
1%
126.70
1%
Other financial
assets 638.20
4%
497.60
3%
487.60
3%
Property, plant and
equipment
8,
262.80
51% 10,
062.10
57% 11,
062.10
59%
Intangible assets 5, 37% 6, 35% 6, 34%
chevron_up_icon
1 out of 21
circle_padding
hide_on_mobile
zoom_out_icon
[object Object]