Project Report: Financial Analysis of Woolworths Limited
VerifiedAdded on 2021/05/31
|20
|5801
|183
Project
AI Summary
This project report conducts a thorough financial analysis of Woolworths Limited, an Australian retail company. The report begins with a company description, including its history, operations, and key financial figures from 2017. It then examines the ownership and governance structure, highlighting major stakeholders and key personnel. The core of the report focuses on the company's financial performance, evaluating short-term and long-term solvency, asset utilization, and profitability ratios. Specific ratios such as current ratio, acid test ratio, gearing ratio, interest coverage ratio, inventory turnover, and return on capital employed (ROCE) are calculated and analyzed. The report also investigates changes in stock price, significant factors influencing the company, and calculations of CAPM and WACC. Furthermore, it assesses debt ratios and dividend policy, culminating in recommendations and a conclusion regarding the overall financial health and management of Woolworths. The analysis relies on data from the company's annual reports and other financial sources.
Running Head: Finance for business
1
Project Report: Finance for business
1
Project Report: Finance for business
Paraphrase This Document
Need a fresh take? Get an instant paraphrase of this document with our AI Paraphraser
Finance for business
2
Contents
Introduction.......................................................................................................................3
1. Description of company................................................................................................3
2. Ownership governance structure..................................................................................3
3. Performance Key ratios................................................................................................5
4. Changes in stock price................................................................................................10
5. Significant factors.......................................................................................................10
6. Calculation of CAPM and beta values........................................................................11
7. WACC calculations....................................................................................................11
8. Debt ratios...................................................................................................................12
9. Dividend policy..........................................................................................................13
10. Recommendation and Conclusion............................................................................13
References.......................................................................................................................15
Appendix.........................................................................................................................16
Finance for business
3
Introduction:
Financial management of an organization is done by the financial department of an
organization. In the report, financial management process of Woolworths has been evaluated.
In the report, firstly, the description about the company has been given. Further, the structure
of the ownership and the stakeholders has been evaluation. In order to assess the financial
position and financial performance of the company, performance ratios of the company have
been evaluated. The stock price of the organization has also been evaluated to recognize the
market place of the company. Lastly, the WACC, divided policy and debt ratios of the
company has been calculated to measure the performance of the company.
1. Description of company:
Woolworths limited is an Australian company. The company is registered in the
Australian stock exchange. The symbol ticket of the company is “WOW”. The company is
operating its business in the retail industry of Australia. It has been established in 1924 by 5
founders Percy Christmas, Stanley Chatterton, Cecil Scott Waine, George Creed and Ernest
Williams. The current headquarter of the company is in New South Wales, Australia. Mainly,
the company is serving its services in Australia, New Zealand and India (Home, 2018). The
annual report (2017) of the company explains that the total number of employees of the
company is 2,05,000. The main divisions of the business are petrol, liquor, supermarkets,
home improvements, general merchandise, hotel and gambling etc. The net income and net
profit of the company is $ 55669 million and $ 1534 million in 2017.
2. Ownership governance structure:
Ownership government structure of a business explains about the system of rules,
processes and practices which is used by the companies to control and direct the process of
the company. Corporate governance involves essentially in balancing the company’s interest
in managing the stakeholders of the company such as management, shareholders, customers,
suppliers, government, financiers and community. In case of ownership structure, the
shareholders interest in an organization is evaluated. The ownership governance structure is
as follows:
a) Main Substantial stakeholders:
⊘ This is a preview!⊘
Do you want full access?
Subscribe today to unlock all pages.
Trusted by 1+ million students worldwide
Finance for business
4
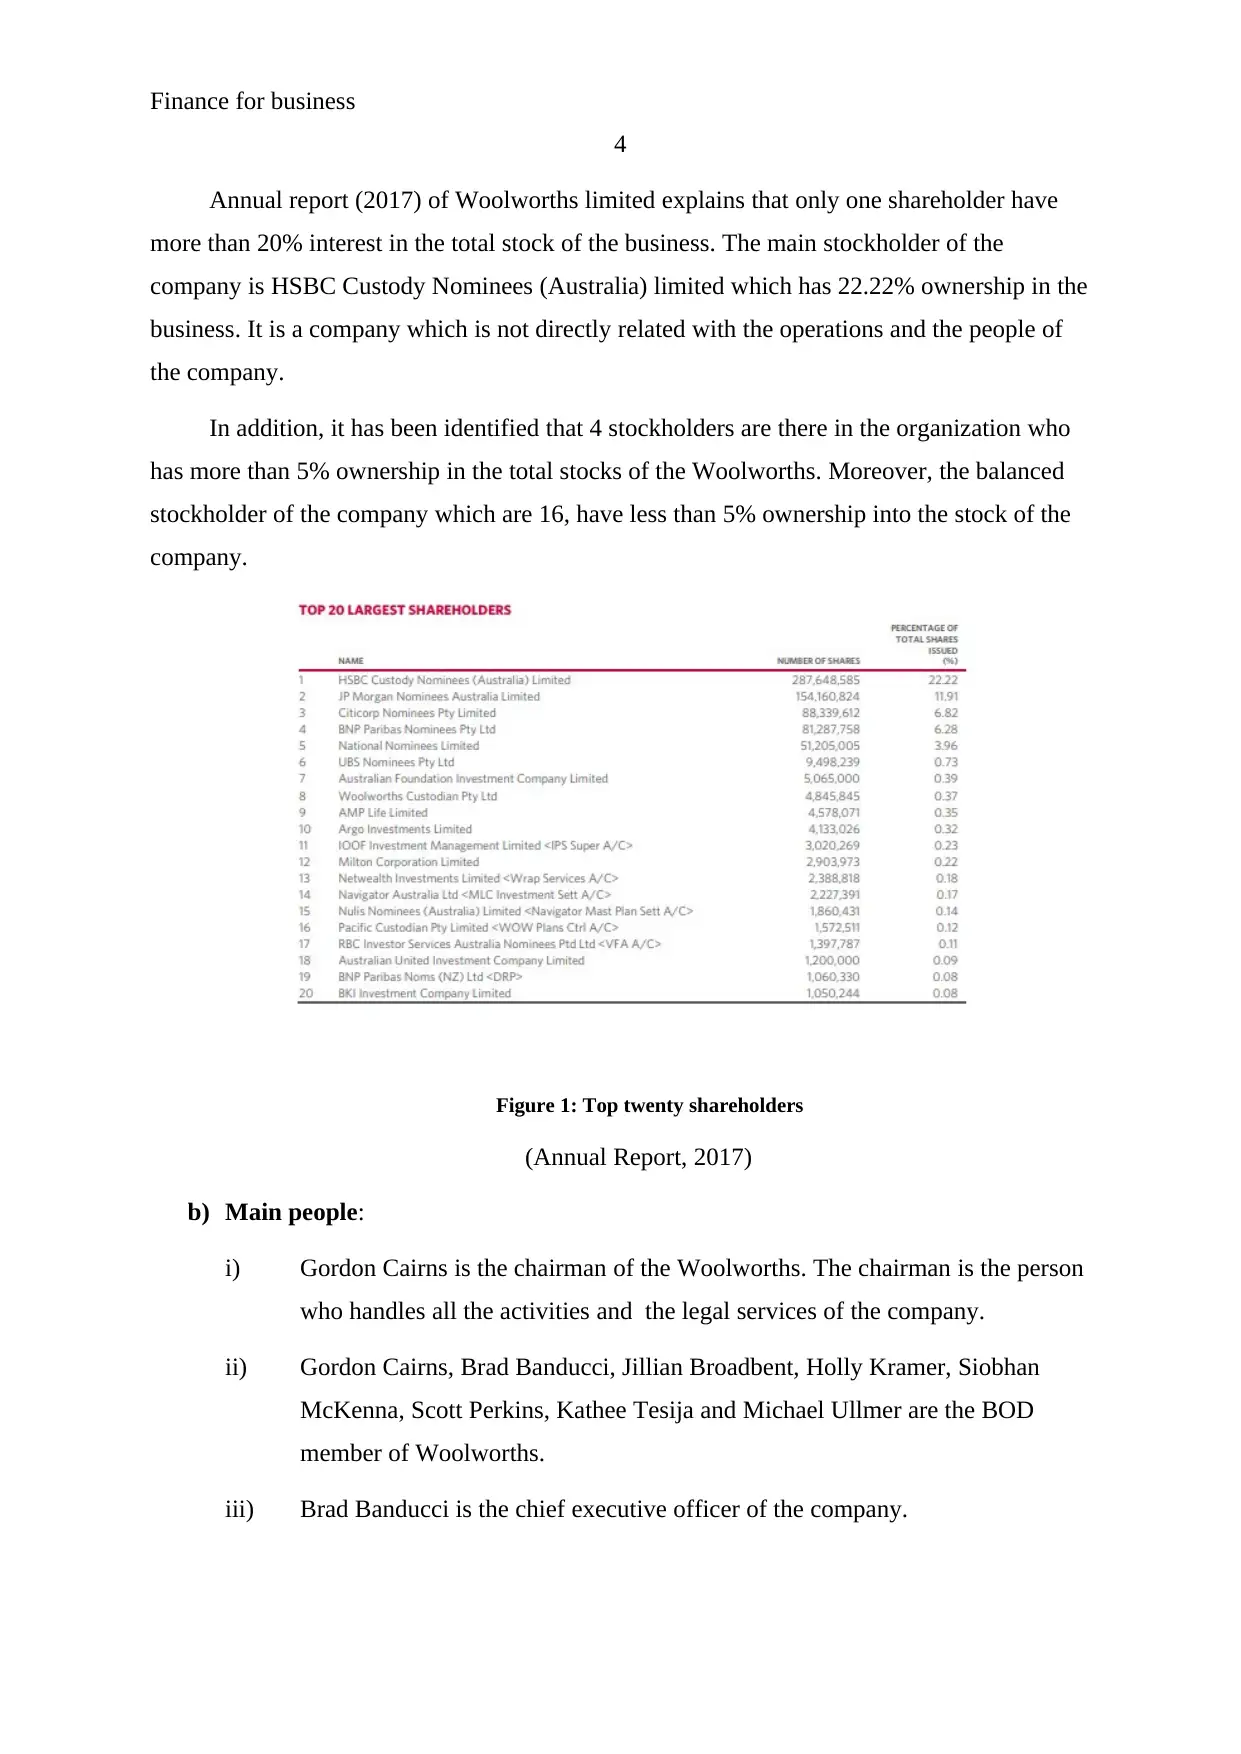
Annual report (2017) of Woolworths limited explains that only one shareholder have
more than 20% interest in the total stock of the business. The main stockholder of the
company is HSBC Custody Nominees (Australia) limited which has 22.22% ownership in the
business. It is a company which is not directly related with the operations and the people of
the company.
In addition, it has been identified that 4 stockholders are there in the organization who
has more than 5% ownership in the total stocks of the Woolworths. Moreover, the balanced
stockholder of the company which are 16, have less than 5% ownership into the stock of the
company.
Figure 1: Top twenty shareholders
(Annual Report, 2017)
b) Main people:
i) Gordon Cairns is the chairman of the Woolworths. The chairman is the person
who handles all the activities and the legal services of the company.
ii) Gordon Cairns, Brad Banducci, Jillian Broadbent, Holly Kramer, Siobhan
McKenna, Scott Perkins, Kathee Tesija and Michael Ullmer are the BOD
member of Woolworths.
iii) Brad Banducci is the chief executive officer of the company.
4
Annual report (2017) of Woolworths limited explains that only one shareholder have
more than 20% interest in the total stock of the business. The main stockholder of the
company is HSBC Custody Nominees (Australia) limited which has 22.22% ownership in the
business. It is a company which is not directly related with the operations and the people of
the company.
In addition, it has been identified that 4 stockholders are there in the organization who
has more than 5% ownership in the total stocks of the Woolworths. Moreover, the balanced
stockholder of the company which are 16, have less than 5% ownership into the stock of the
company.
Figure 1: Top twenty shareholders
(Annual Report, 2017)
b) Main people:
i) Gordon Cairns is the chairman of the Woolworths. The chairman is the person
who handles all the activities and the legal services of the company.
ii) Gordon Cairns, Brad Banducci, Jillian Broadbent, Holly Kramer, Siobhan
McKenna, Scott Perkins, Kathee Tesija and Michael Ullmer are the BOD
member of Woolworths.
iii) Brad Banducci is the chief executive officer of the company.
Paraphrase This Document
Need a fresh take? Get an instant paraphrase of this document with our AI Paraphraser
Finance for business
5
iv) There is only one stockholder of the company who is not directly related with
the operations and the people of the company (AFR, 2018).
v) Further, it has been found that the top 4 stockholder who has more than 5%
ownership of the company are not among the key members of the company.
3. Performance Key ratios:
Ratios are the tool of an organization which explains about the financial performance of
an organization. Ratio study is evaluated by the financial analyst and the financial manager of
the company to measure the performance of the organization so that the relevant changes
could be done in the organization for the betterment of the business.
In the report, performance key ratios of Woolworths have been evaluated to measure
the performance of the company. Short term solvency position, asset utilization position,
profitability ratios, long term solvency position and market value ratios have been calculated
to measure the performance of an organization. The performance ratios of the company are as
follows:
a. Short term solvency position:
Short term solvency ratios of a business express about the short-term debt obligation of
the business. It evaluates that whether the organization is able to meet all its short term debt
obligation of the company at the time of liquidation. This ratio measures the liquidity position
of an organization.
In case of Woolworths, current ratio and acid test ratio have been calculated to
measure the short term solvency position of the business. Current ratio measures the current
assets and current liabilities of the company to measure that whether the company would be
able to meet all its short term debt obligation according to the current assets. The current ratio
of the company briefs that the current ratio level of the company has been lowered in 2017 to
0.79. It express that the organization is required to improve the level of current assets to
administer the risk position (Hogarth and Makridakis, 2011).
Further, quick ratio measures the liquidity position of an organization on the basis of
quick assets of the company. It measures that whether the company would be able to pay all
the current liabilities on the basis of those assets which could be liquidated at any times. The
acid test ratio of the business explains that company’s position has been better from last year.
Finance for business
6
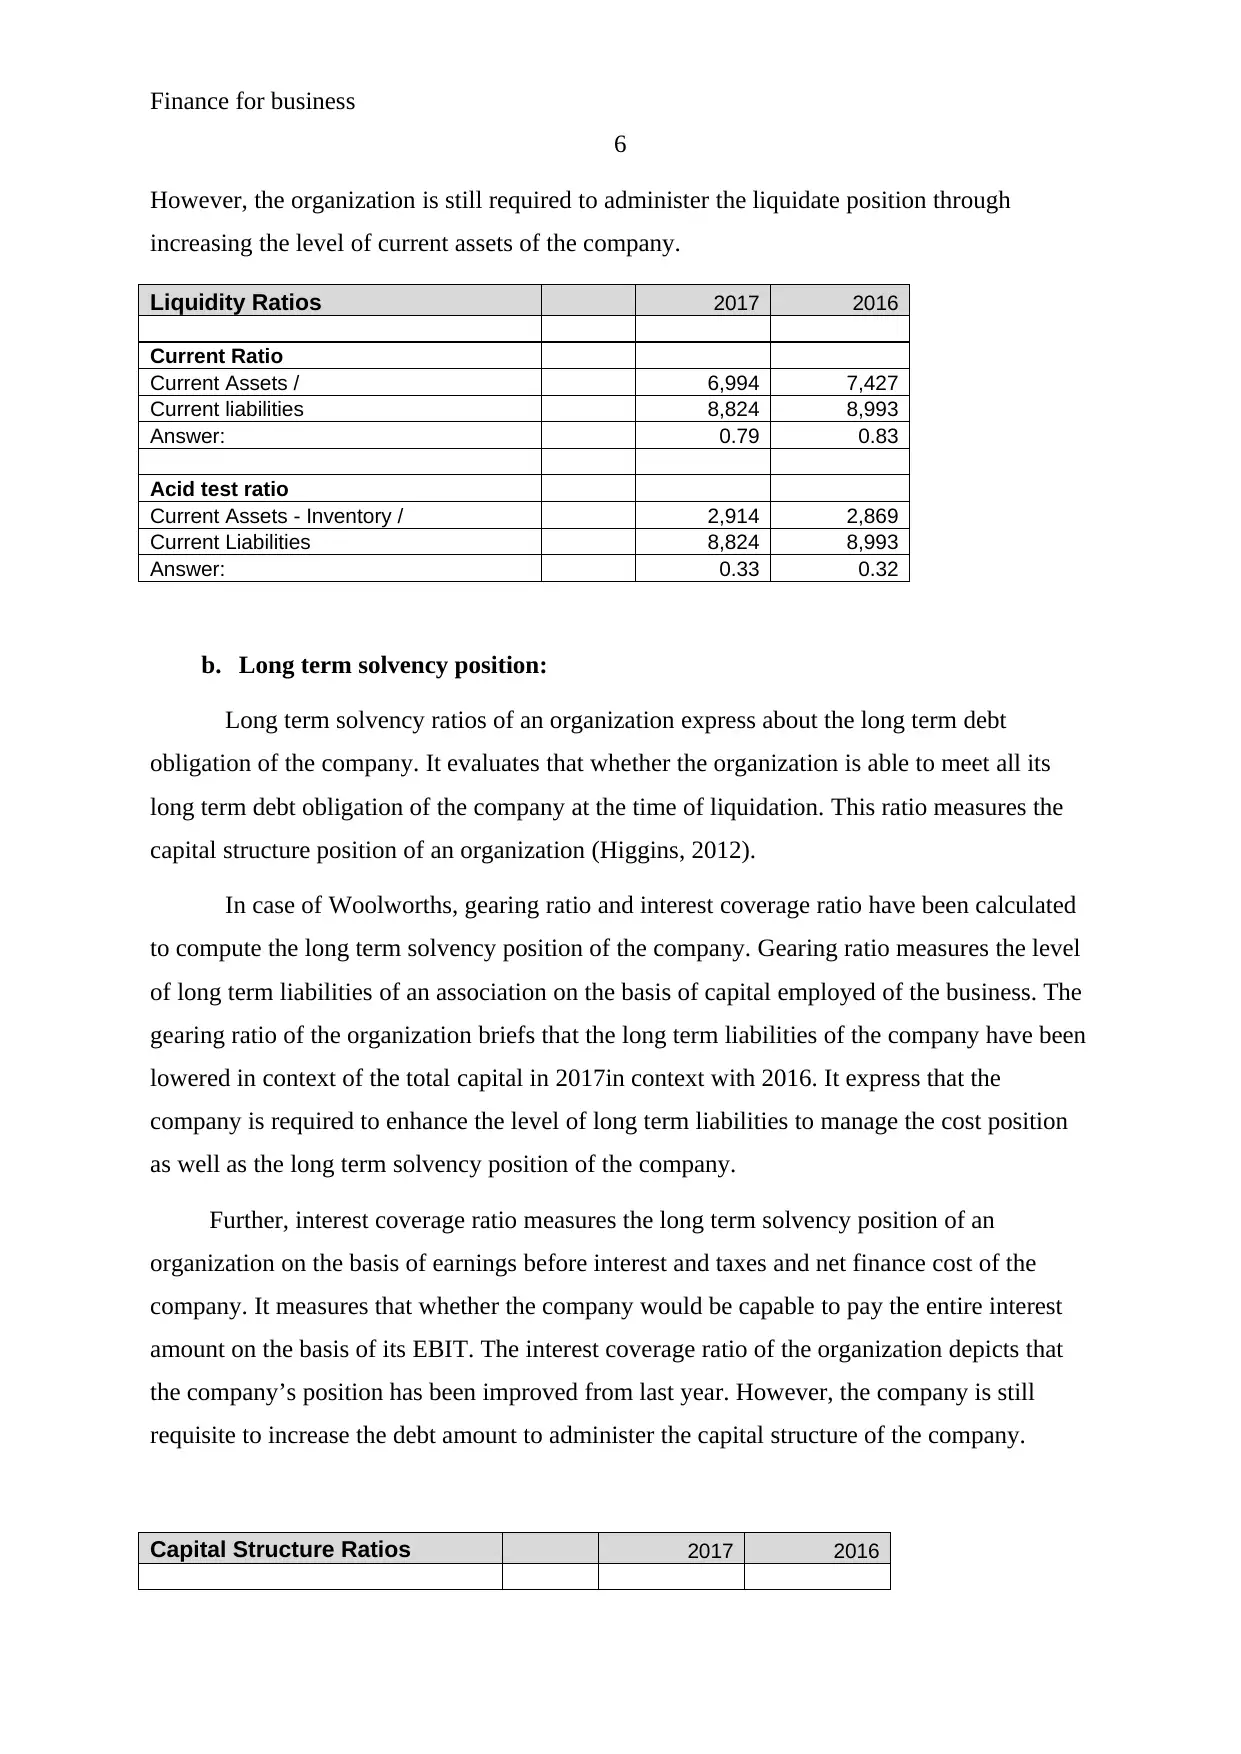
However, the organization is still required to administer the liquidate position through
increasing the level of current assets of the company.
Liquidity Ratios 2017 2016
Current Ratio
Current Assets / 6,994 7,427
Current liabilities 8,824 8,993
Answer: 0.79 0.83
Acid test ratio
Current Assets - Inventory / 2,914 2,869
Current Liabilities 8,824 8,993
Answer: 0.33 0.32
b. Long term solvency position:
Long term solvency ratios of an organization express about the long term debt
obligation of the company. It evaluates that whether the organization is able to meet all its
long term debt obligation of the company at the time of liquidation. This ratio measures the
capital structure position of an organization (Higgins, 2012).
In case of Woolworths, gearing ratio and interest coverage ratio have been calculated
to compute the long term solvency position of the company. Gearing ratio measures the level
of long term liabilities of an association on the basis of capital employed of the business. The
gearing ratio of the organization briefs that the long term liabilities of the company have been
lowered in context of the total capital in 2017in context with 2016. It express that the
company is required to enhance the level of long term liabilities to manage the cost position
as well as the long term solvency position of the company.
Further, interest coverage ratio measures the long term solvency position of an
organization on the basis of earnings before interest and taxes and net finance cost of the
company. It measures that whether the company would be capable to pay the entire interest
amount on the basis of its EBIT. The interest coverage ratio of the organization depicts that
the company’s position has been improved from last year. However, the company is still
requisite to increase the debt amount to administer the capital structure of the company.
Capital Structure Ratios 2017 2016
6
However, the organization is still required to administer the liquidate position through
increasing the level of current assets of the company.
Liquidity Ratios 2017 2016
Current Ratio
Current Assets / 6,994 7,427
Current liabilities 8,824 8,993
Answer: 0.79 0.83
Acid test ratio
Current Assets - Inventory / 2,914 2,869
Current Liabilities 8,824 8,993
Answer: 0.33 0.32
b. Long term solvency position:
Long term solvency ratios of an organization express about the long term debt
obligation of the company. It evaluates that whether the organization is able to meet all its
long term debt obligation of the company at the time of liquidation. This ratio measures the
capital structure position of an organization (Higgins, 2012).
In case of Woolworths, gearing ratio and interest coverage ratio have been calculated
to compute the long term solvency position of the company. Gearing ratio measures the level
of long term liabilities of an association on the basis of capital employed of the business. The
gearing ratio of the organization briefs that the long term liabilities of the company have been
lowered in context of the total capital in 2017in context with 2016. It express that the
company is required to enhance the level of long term liabilities to manage the cost position
as well as the long term solvency position of the company.
Further, interest coverage ratio measures the long term solvency position of an
organization on the basis of earnings before interest and taxes and net finance cost of the
company. It measures that whether the company would be capable to pay the entire interest
amount on the basis of its EBIT. The interest coverage ratio of the organization depicts that
the company’s position has been improved from last year. However, the company is still
requisite to increase the debt amount to administer the capital structure of the company.
Capital Structure Ratios 2017 2016
⊘ This is a preview!⊘
Do you want full access?
Subscribe today to unlock all pages.
Trusted by 1+ million students worldwide
Finance for business
7
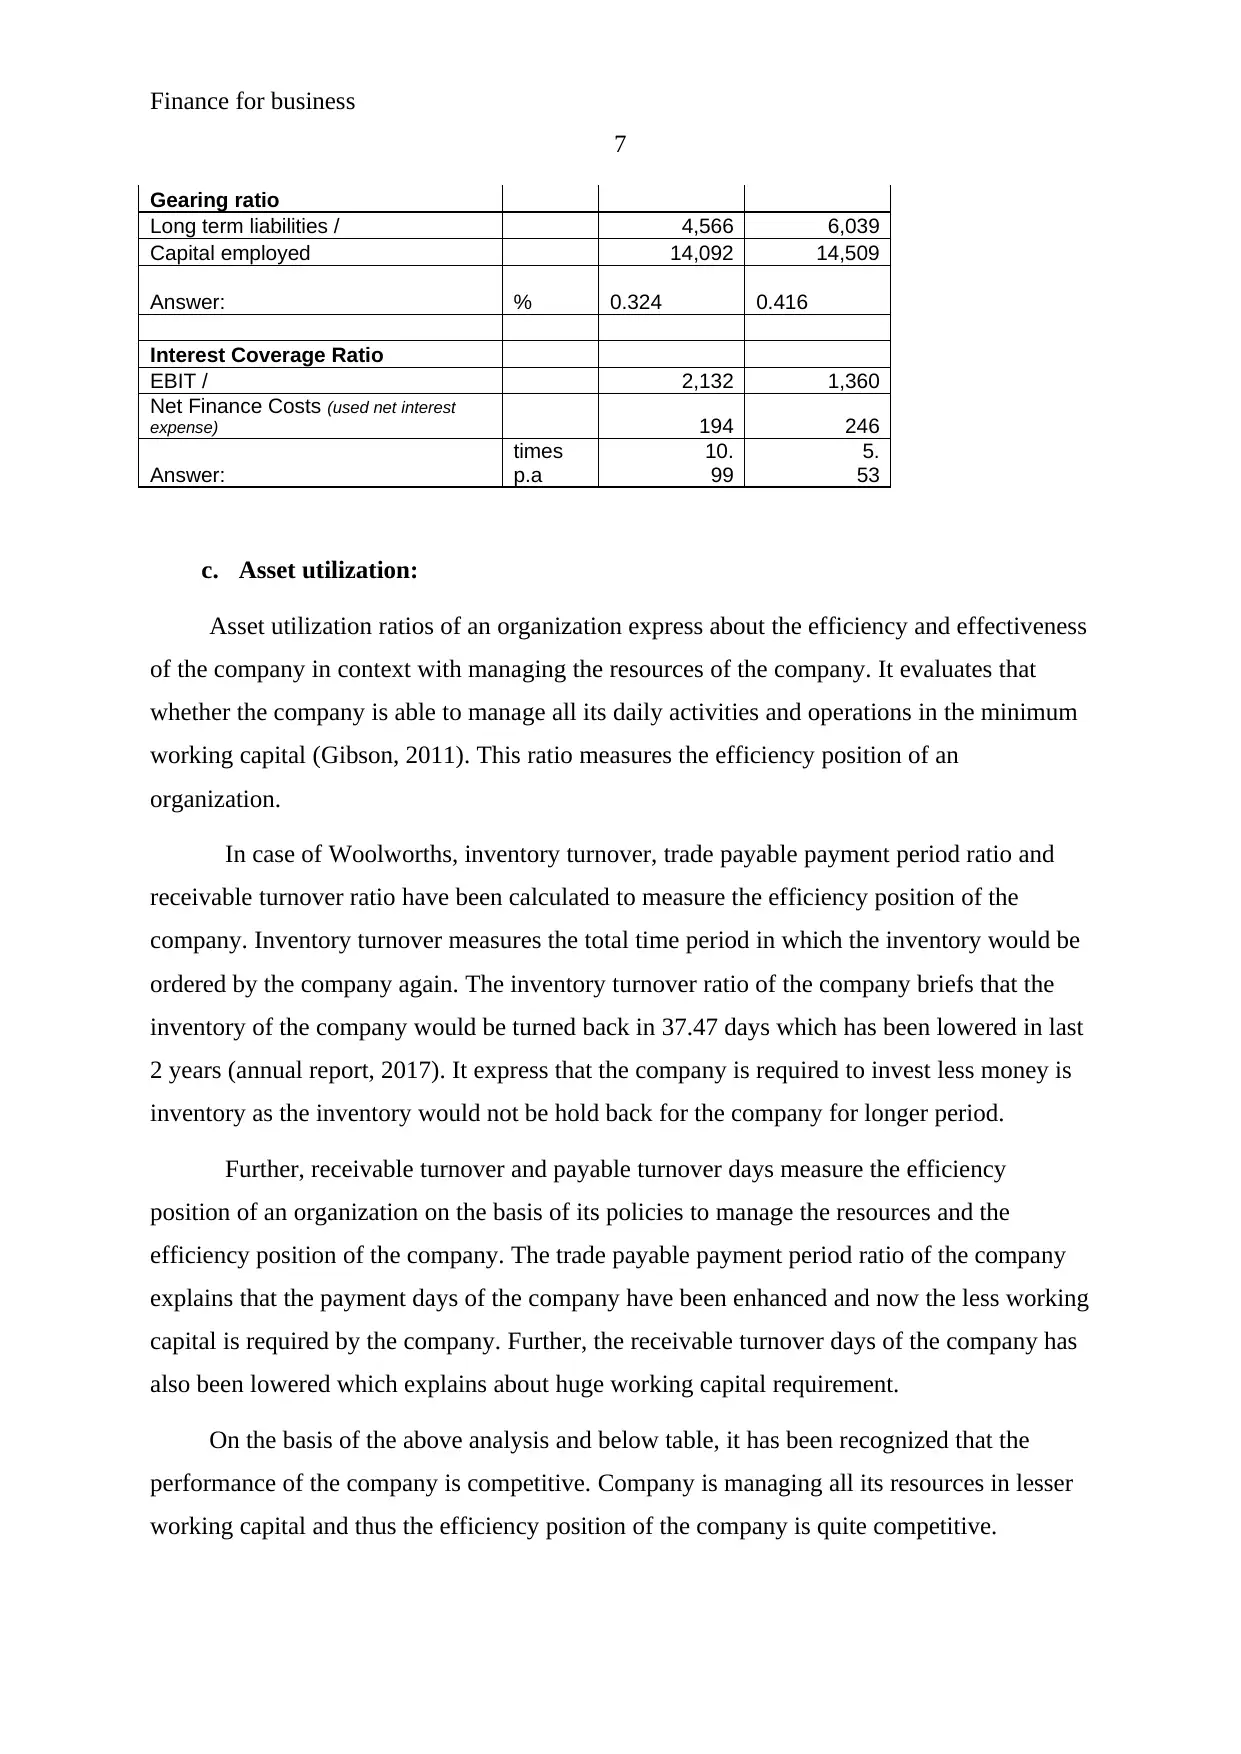
Gearing ratio
Long term liabilities / 4,566 6,039
Capital employed 14,092 14,509
Answer: % 0.324 0.416
Interest Coverage Ratio
EBIT / 2,132 1,360
Net Finance Costs (used net interest
expense) 194 246
Answer:
times
p.a
10.
99
5.
53
c. Asset utilization:
Asset utilization ratios of an organization express about the efficiency and effectiveness
of the company in context with managing the resources of the company. It evaluates that
whether the company is able to manage all its daily activities and operations in the minimum
working capital (Gibson, 2011). This ratio measures the efficiency position of an
organization.
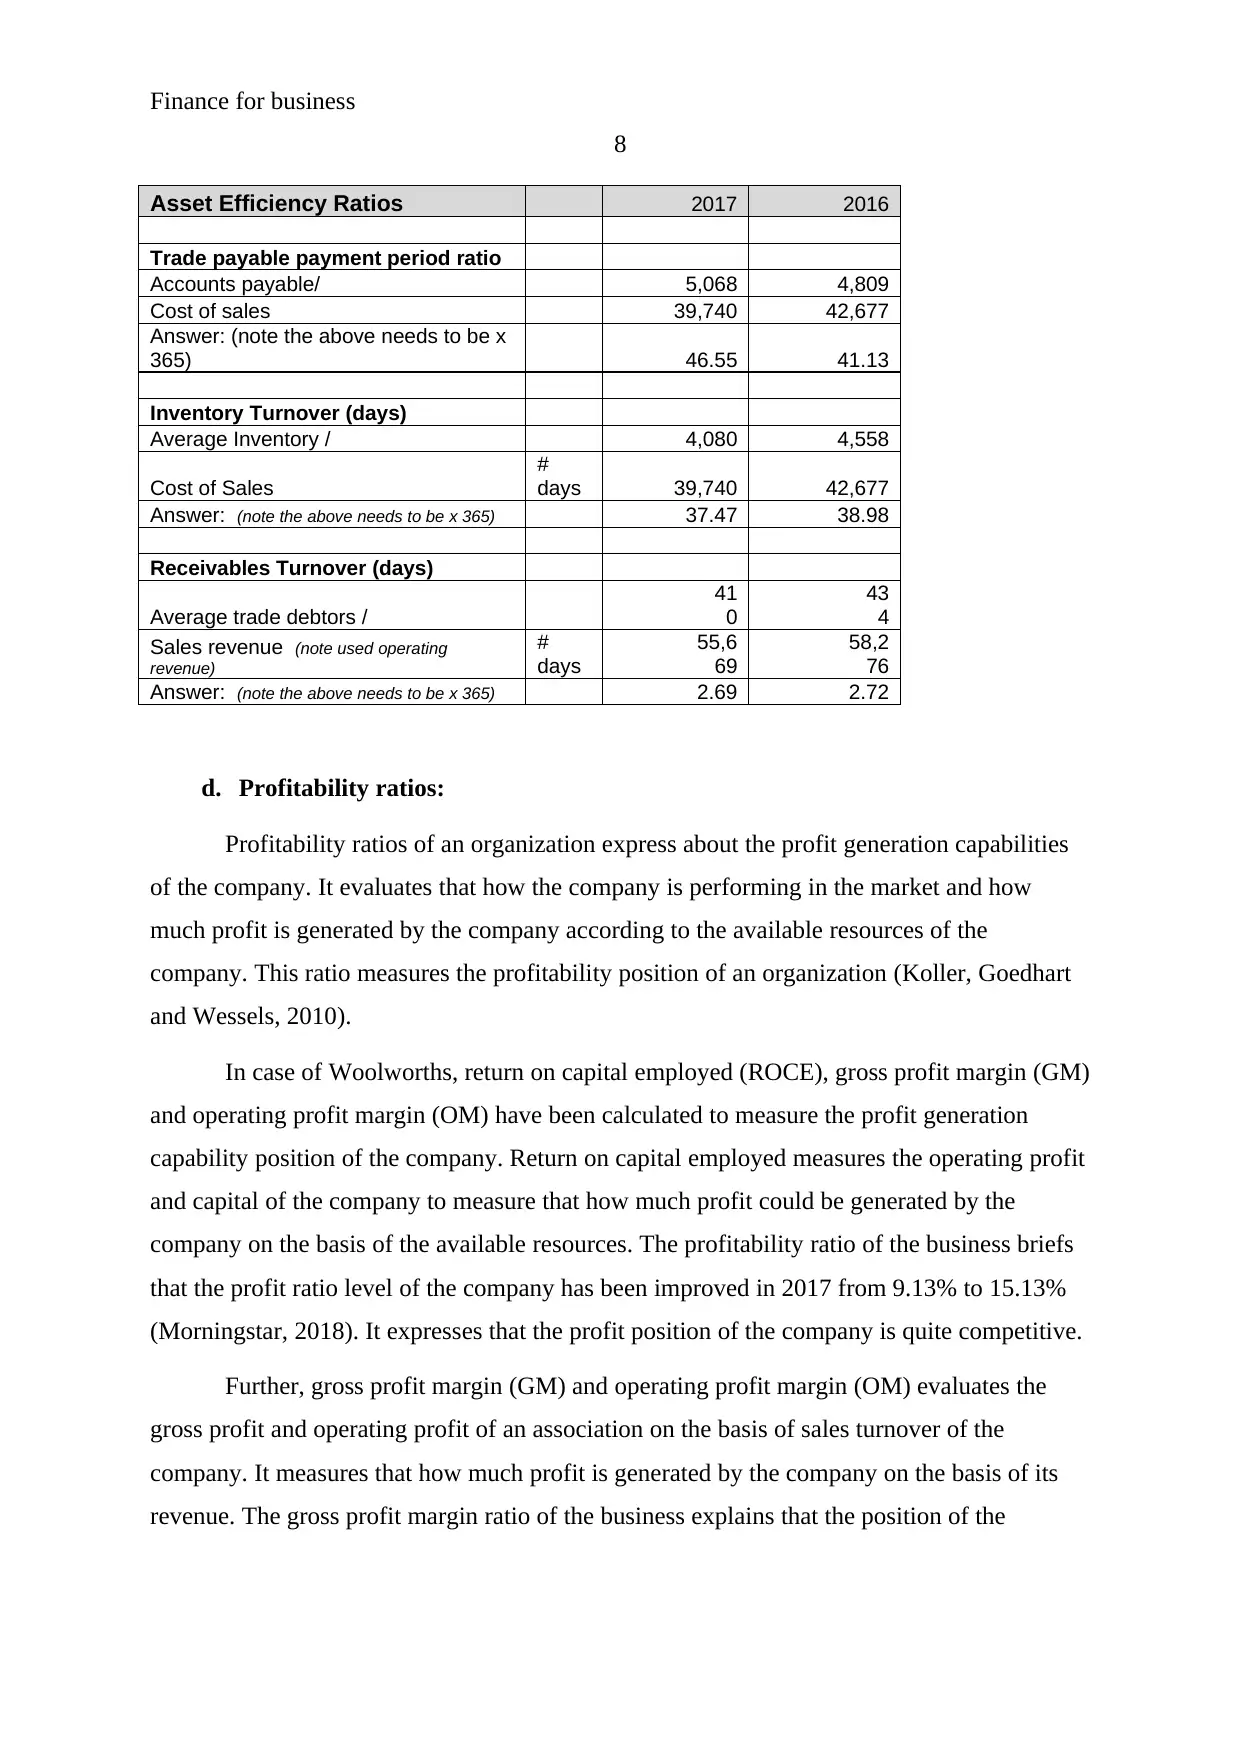
In case of Woolworths, inventory turnover, trade payable payment period ratio and
receivable turnover ratio have been calculated to measure the efficiency position of the
company. Inventory turnover measures the total time period in which the inventory would be
ordered by the company again. The inventory turnover ratio of the company briefs that the
inventory of the company would be turned back in 37.47 days which has been lowered in last
2 years (annual report, 2017). It express that the company is required to invest less money is
inventory as the inventory would not be hold back for the company for longer period.
Further, receivable turnover and payable turnover days measure the efficiency
position of an organization on the basis of its policies to manage the resources and the
efficiency position of the company. The trade payable payment period ratio of the company
explains that the payment days of the company have been enhanced and now the less working
capital is required by the company. Further, the receivable turnover days of the company has
also been lowered which explains about huge working capital requirement.
On the basis of the above analysis and below table, it has been recognized that the
performance of the company is competitive. Company is managing all its resources in lesser
working capital and thus the efficiency position of the company is quite competitive.
7
Gearing ratio
Long term liabilities / 4,566 6,039
Capital employed 14,092 14,509
Answer: % 0.324 0.416
Interest Coverage Ratio
EBIT / 2,132 1,360
Net Finance Costs (used net interest
expense) 194 246
Answer:
times
p.a
10.
99
5.
53
c. Asset utilization:
Asset utilization ratios of an organization express about the efficiency and effectiveness
of the company in context with managing the resources of the company. It evaluates that
whether the company is able to manage all its daily activities and operations in the minimum
working capital (Gibson, 2011). This ratio measures the efficiency position of an
organization.
In case of Woolworths, inventory turnover, trade payable payment period ratio and
receivable turnover ratio have been calculated to measure the efficiency position of the
company. Inventory turnover measures the total time period in which the inventory would be
ordered by the company again. The inventory turnover ratio of the company briefs that the
inventory of the company would be turned back in 37.47 days which has been lowered in last
2 years (annual report, 2017). It express that the company is required to invest less money is
inventory as the inventory would not be hold back for the company for longer period.
Further, receivable turnover and payable turnover days measure the efficiency
position of an organization on the basis of its policies to manage the resources and the
efficiency position of the company. The trade payable payment period ratio of the company
explains that the payment days of the company have been enhanced and now the less working
capital is required by the company. Further, the receivable turnover days of the company has
also been lowered which explains about huge working capital requirement.
On the basis of the above analysis and below table, it has been recognized that the
performance of the company is competitive. Company is managing all its resources in lesser
working capital and thus the efficiency position of the company is quite competitive.
Paraphrase This Document
Need a fresh take? Get an instant paraphrase of this document with our AI Paraphraser
Finance for business
8
Asset Efficiency Ratios 2017 2016
Trade payable payment period ratio
Accounts payable/ 5,068 4,809
Cost of sales 39,740 42,677
Answer: (note the above needs to be x
365) 46.55 41.13
Inventory Turnover (days)
Average Inventory / 4,080 4,558
Cost of Sales
#
days 39,740 42,677
Answer: (note the above needs to be x 365) 37.47 38.98
Receivables Turnover (days)
Average trade debtors /
41
0
43
4
Sales revenue (note used operating
revenue)
#
days
55,6
69
58,2
76
Answer: (note the above needs to be x 365) 2.69 2.72
d. Profitability ratios:
Profitability ratios of an organization express about the profit generation capabilities
of the company. It evaluates that how the company is performing in the market and how
much profit is generated by the company according to the available resources of the
company. This ratio measures the profitability position of an organization (Koller, Goedhart
and Wessels, 2010).
In case of Woolworths, return on capital employed (ROCE), gross profit margin (GM)
and operating profit margin (OM) have been calculated to measure the profit generation
capability position of the company. Return on capital employed measures the operating profit
and capital of the company to measure that how much profit could be generated by the
company on the basis of the available resources. The profitability ratio of the business briefs
that the profit ratio level of the company has been improved in 2017 from 9.13% to 15.13%
(Morningstar, 2018). It expresses that the profit position of the company is quite competitive.
Further, gross profit margin (GM) and operating profit margin (OM) evaluates the
gross profit and operating profit of an association on the basis of sales turnover of the
company. It measures that how much profit is generated by the company on the basis of its
revenue. The gross profit margin ratio of the business explains that the position of the
8
Asset Efficiency Ratios 2017 2016
Trade payable payment period ratio
Accounts payable/ 5,068 4,809
Cost of sales 39,740 42,677
Answer: (note the above needs to be x
365) 46.55 41.13
Inventory Turnover (days)
Average Inventory / 4,080 4,558
Cost of Sales
#
days 39,740 42,677
Answer: (note the above needs to be x 365) 37.47 38.98
Receivables Turnover (days)
Average trade debtors /
41
0
43
4
Sales revenue (note used operating
revenue)
#
days
55,6
69
58,2
76
Answer: (note the above needs to be x 365) 2.69 2.72
d. Profitability ratios:
Profitability ratios of an organization express about the profit generation capabilities
of the company. It evaluates that how the company is performing in the market and how
much profit is generated by the company according to the available resources of the
company. This ratio measures the profitability position of an organization (Koller, Goedhart
and Wessels, 2010).
In case of Woolworths, return on capital employed (ROCE), gross profit margin (GM)
and operating profit margin (OM) have been calculated to measure the profit generation
capability position of the company. Return on capital employed measures the operating profit
and capital of the company to measure that how much profit could be generated by the
company on the basis of the available resources. The profitability ratio of the business briefs
that the profit ratio level of the company has been improved in 2017 from 9.13% to 15.13%
(Morningstar, 2018). It expresses that the profit position of the company is quite competitive.
Further, gross profit margin (GM) and operating profit margin (OM) evaluates the
gross profit and operating profit of an association on the basis of sales turnover of the
company. It measures that how much profit is generated by the company on the basis of its
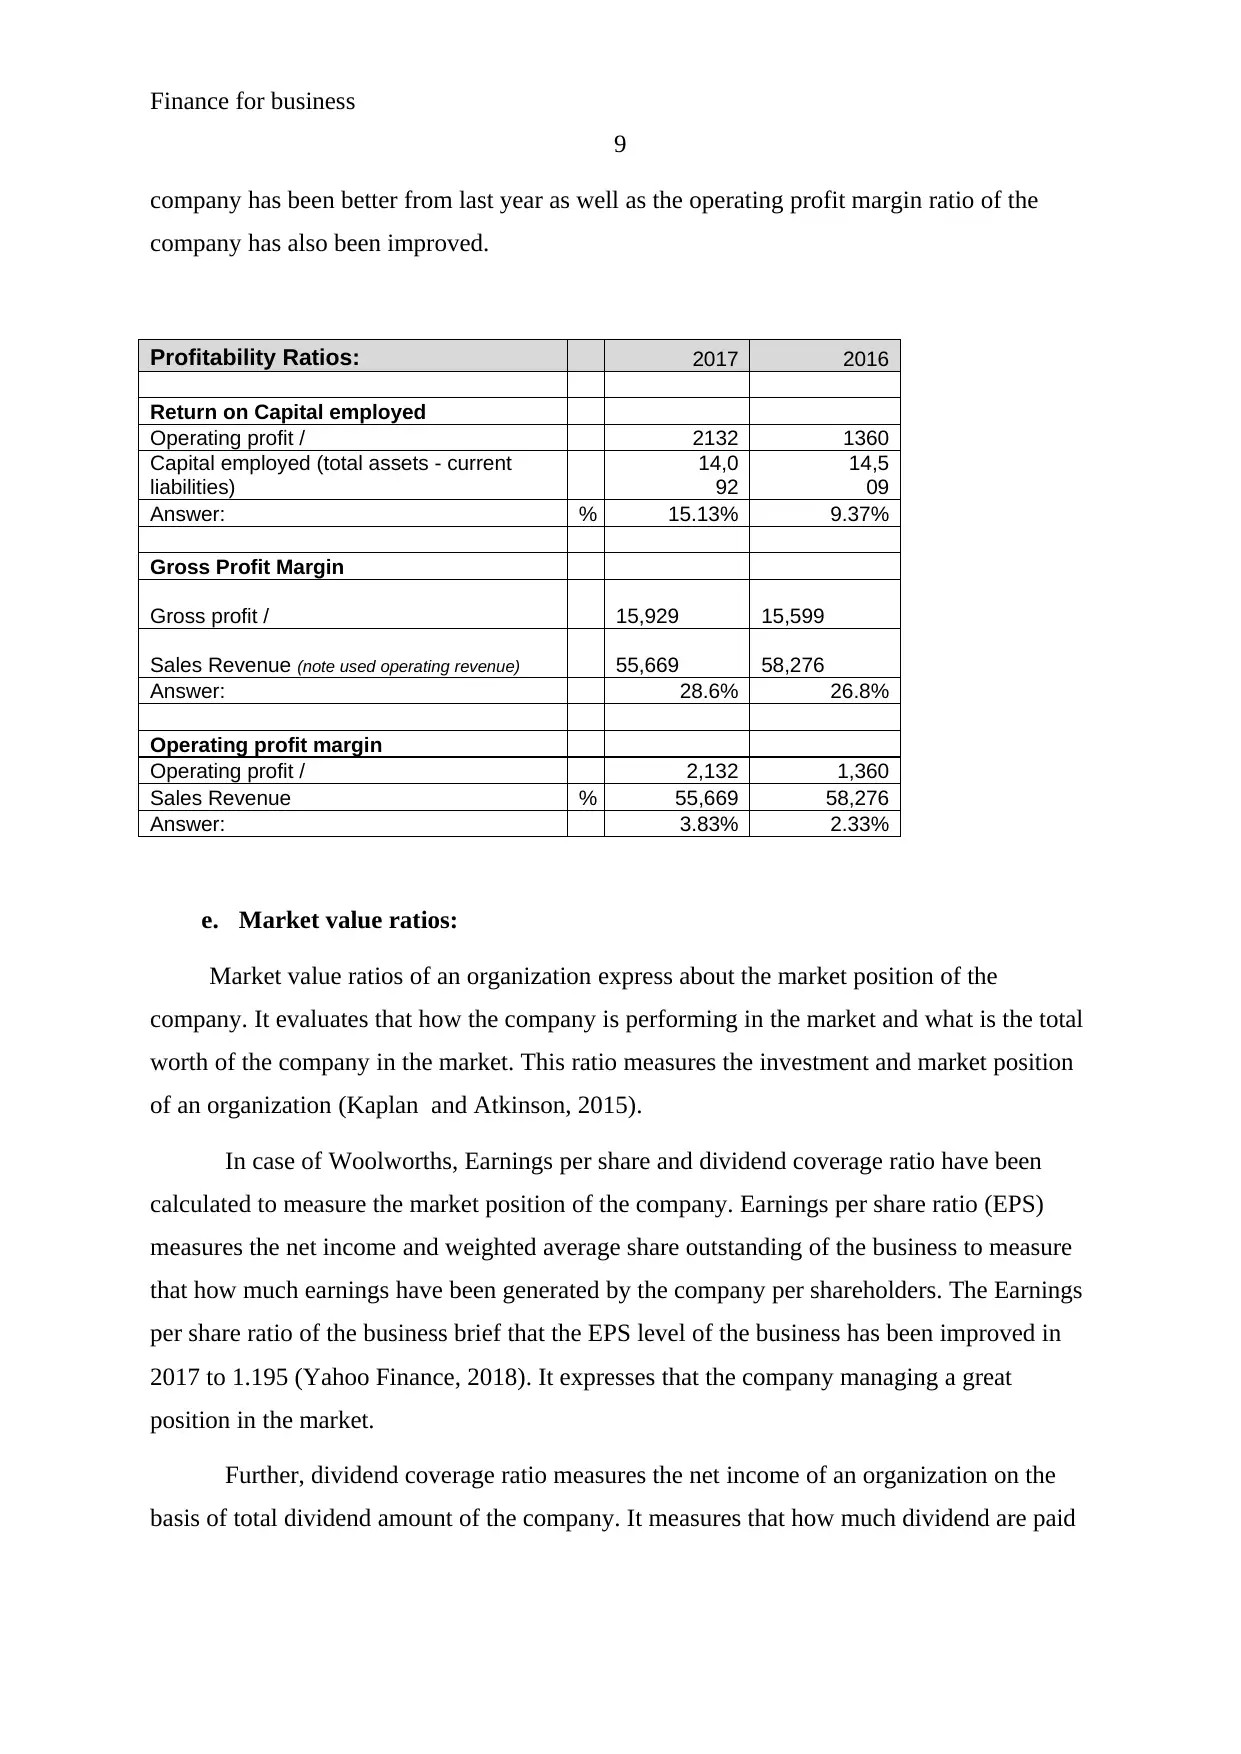
revenue. The gross profit margin ratio of the business explains that the position of the
Finance for business
9
company has been better from last year as well as the operating profit margin ratio of the
company has also been improved.
Profitability Ratios: 2017 2016
Return on Capital employed
Operating profit / 2132 1360
Capital employed (total assets - current
liabilities)
14,0
92
14,5
09
Answer: % 15.13% 9.37%
Gross Profit Margin
Gross profit / 15,929 15,599
Sales Revenue (note used operating revenue) 55,669 58,276
Answer: 28.6% 26.8%
Operating profit margin
Operating profit / 2,132 1,360
Sales Revenue % 55,669 58,276
Answer: 3.83% 2.33%
e. Market value ratios:
Market value ratios of an organization express about the market position of the
company. It evaluates that how the company is performing in the market and what is the total
worth of the company in the market. This ratio measures the investment and market position
of an organization (Kaplan and Atkinson, 2015).
In case of Woolworths, Earnings per share and dividend coverage ratio have been
calculated to measure the market position of the company. Earnings per share ratio (EPS)
measures the net income and weighted average share outstanding of the business to measure
that how much earnings have been generated by the company per shareholders. The Earnings
per share ratio of the business brief that the EPS level of the business has been improved in
2017 to 1.195 (Yahoo Finance, 2018). It expresses that the company managing a great
position in the market.
Further, dividend coverage ratio measures the net income of an organization on the
basis of total dividend amount of the company. It measures that how much dividend are paid
⊘ This is a preview!⊘
Do you want full access?
Subscribe today to unlock all pages.
Trusted by 1+ million students worldwide
Finance for business
10
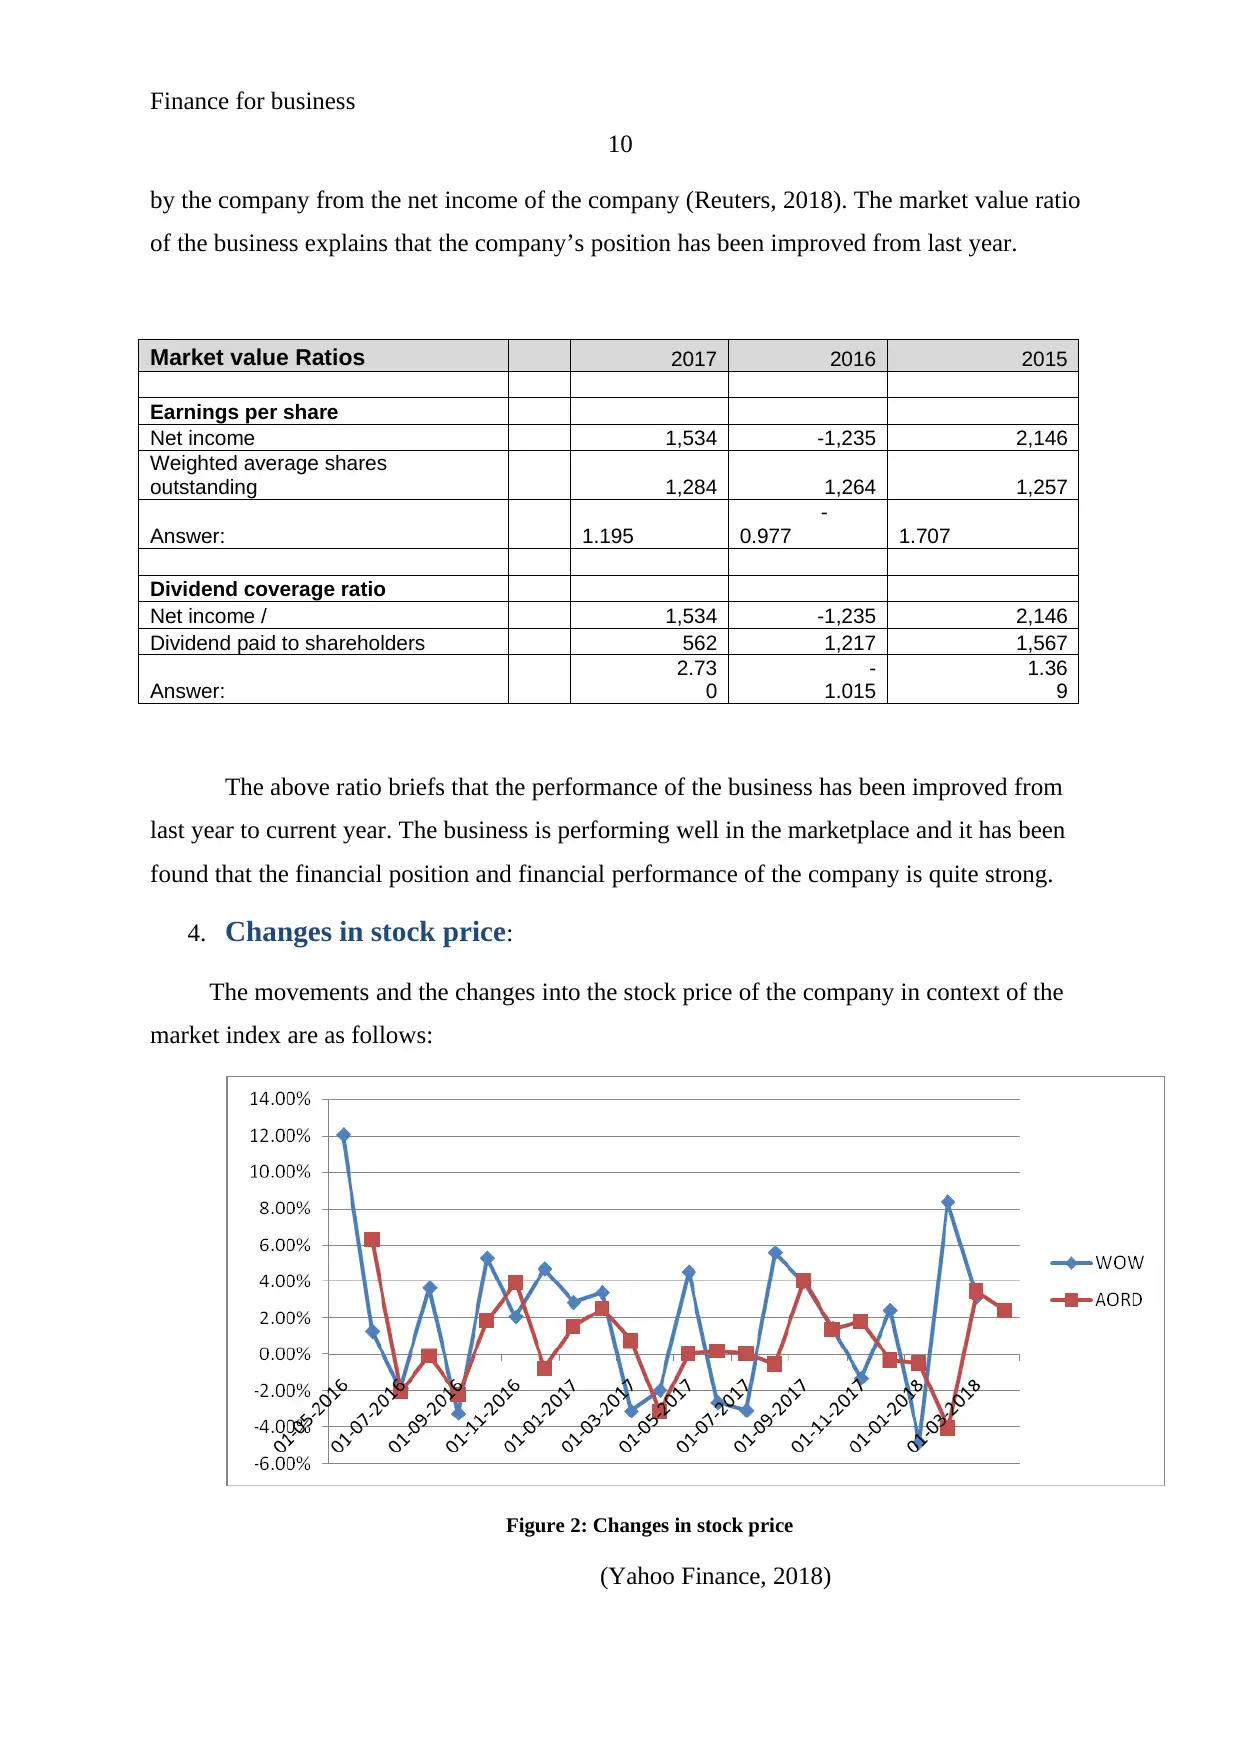
by the company from the net income of the company (Reuters, 2018). The market value ratio
of the business explains that the company’s position has been improved from last year.
Market value Ratios 2017 2016 2015
Earnings per share
Net income 1,534 -1,235 2,146
Weighted average shares
outstanding 1,284 1,264 1,257
Answer: 1.195
-
0.977 1.707
Dividend coverage ratio
Net income / 1,534 -1,235 2,146
Dividend paid to shareholders 562 1,217 1,567
Answer:
2.73
0
-
1.015
1.36
9
The above ratio briefs that the performance of the business has been improved from
last year to current year. The business is performing well in the marketplace and it has been
found that the financial position and financial performance of the company is quite strong.
4. Changes in stock price:
The movements and the changes into the stock price of the company in context of the
market index are as follows:
Figure 2: Changes in stock price
(Yahoo Finance, 2018)
10
by the company from the net income of the company (Reuters, 2018). The market value ratio
of the business explains that the company’s position has been improved from last year.
Market value Ratios 2017 2016 2015
Earnings per share
Net income 1,534 -1,235 2,146
Weighted average shares
outstanding 1,284 1,264 1,257
Answer: 1.195
-
0.977 1.707
Dividend coverage ratio
Net income / 1,534 -1,235 2,146
Dividend paid to shareholders 562 1,217 1,567
Answer:
2.73
0
-
1.015
1.36
9
The above ratio briefs that the performance of the business has been improved from
last year to current year. The business is performing well in the marketplace and it has been
found that the financial position and financial performance of the company is quite strong.
4. Changes in stock price:
The movements and the changes into the stock price of the company in context of the
market index are as follows:
Figure 2: Changes in stock price
(Yahoo Finance, 2018)
Paraphrase This Document
Need a fresh take? Get an instant paraphrase of this document with our AI Paraphraser
Finance for business
11
Report:
The above given figure 2 explains that the movement in the stock price of WOW and
AORD both are quits fluctuate in nature. On the basis of the above figures, it has been
evaluated that the both stocks are getting change rapidly. With the increment in the stock
price of WOW, the stock price of AORD has also been higher and with the decrement
changes into the WOW, the stock price of AORD has also been higher. \
The calculation briefs that the covariance among both the stock price movement is
0.007 which explains that the covariance among both the stock are quite competitive. The
movement in the stock price of both the stocks explain that the volatility of the stock is quite
higher and the changes into the stock price of WOW directly affect the stock price of AORD.
5. Significant factors:
For identifying the busines performance and the fianncial position of WOW, various
nws articles, fianncial analyst report, jounral articles and recente books have been studied.
On the basis of these study material, it has been found that the stock price of the company is
highly volatile in nature in last 2 years. Currently, the stock price of the company is $ 28.74
which has been higher from $ 19.1 in 2016. Howvere, the various ups and downs have come
into the stock price of the company in last 2 years.
Such as, on 30-4-2017, the WOW stock price has been lower due to the chnages into
the economical factors (FT, 2018). Further, it has been recognized that on 30-9-2017, the
stock price of the company has been enhnaced by 5.59% due to the announcement of the
dividend amount in the market (AFR, 2018). Further, on 31-1-2018, the stock price of the
company has been enhanced by 5.45% and the AORD prices have been lowerd by -0.48%
which has taken place due to few internal chnages into the company (Bloomberg, 2018). In
adiition, it has been found that all of these movements have taken place due to continuos
chnages into the internal and external factors of the industry (Yahoo finance, 2018).
6. Calculation of CAPM and beta values:
Beta:
Beta of an organization explains about the risk position of the company in context
with the market index. In case of Woolworths, the beta of the company is 1.235.
Required rate of return:
Finance for business
12
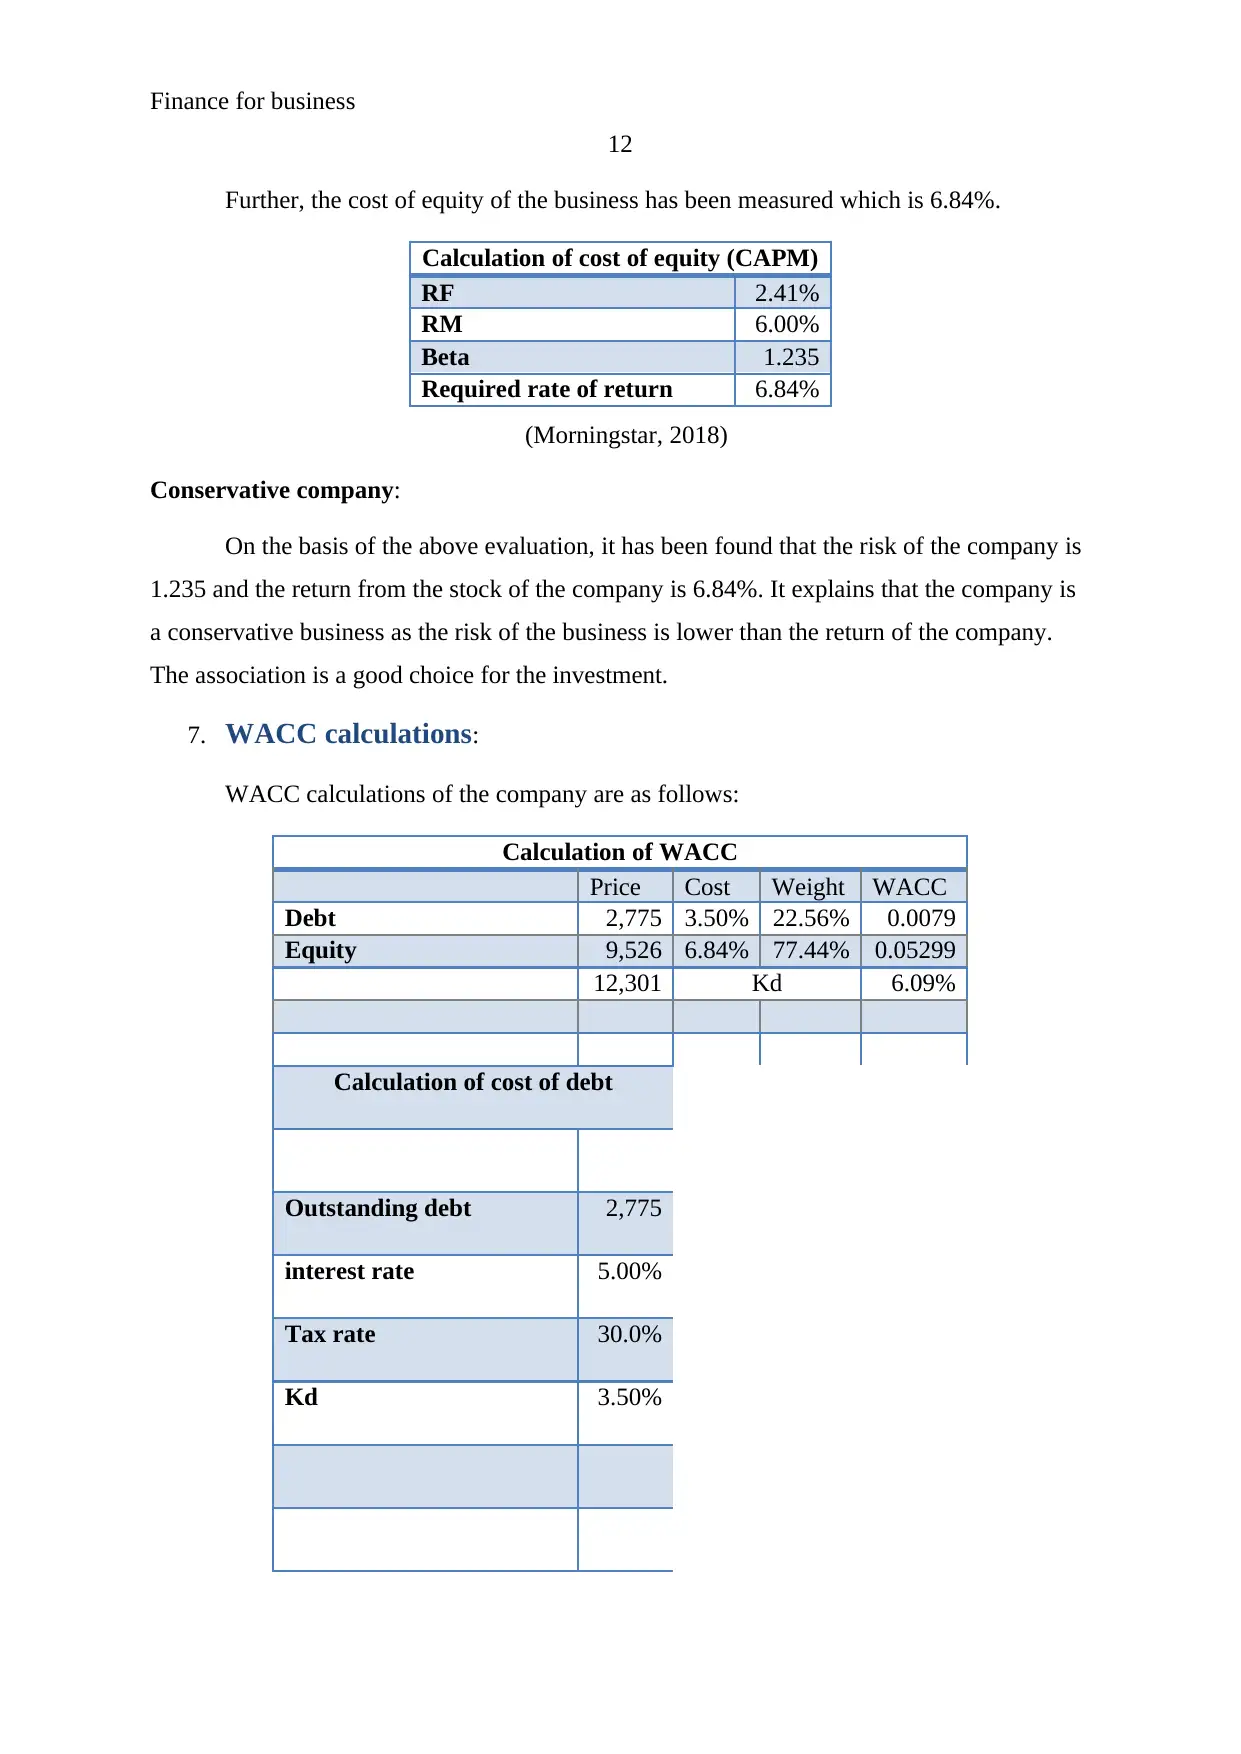
Further, the cost of equity of the business has been measured which is 6.84%.
Calculation of cost of equity (CAPM)
RF 2.41%
RM 6.00%
Beta 1.235
Required rate of return 6.84%
(Morningstar, 2018)
Conservative company:
On the basis of the above evaluation, it has been found that the risk of the company is
1.235 and the return from the stock of the company is 6.84%. It explains that the company is
a conservative business as the risk of the business is lower than the return of the company.
The association is a good choice for the investment.
7. WACC calculations:
WACC calculations of the company are as follows:
Calculation of WACC
Price Cost Weight WACC
Debt 2,775 3.50% 22.56% 0.0079
Equity 9,526 6.84% 77.44% 0.05299
12,301 Kd 6.09%
Calculation of cost of debt
Outstanding debt 2,775
interest rate 5.00%
Tax rate 30.0%
Kd 3.50%
12
Further, the cost of equity of the business has been measured which is 6.84%.
Calculation of cost of equity (CAPM)
RF 2.41%
RM 6.00%
Beta 1.235
Required rate of return 6.84%
(Morningstar, 2018)
Conservative company:
On the basis of the above evaluation, it has been found that the risk of the company is
1.235 and the return from the stock of the company is 6.84%. It explains that the company is
a conservative business as the risk of the business is lower than the return of the company.
The association is a good choice for the investment.
7. WACC calculations:
WACC calculations of the company are as follows:
Calculation of WACC
Price Cost Weight WACC
Debt 2,775 3.50% 22.56% 0.0079
Equity 9,526 6.84% 77.44% 0.05299
12,301 Kd 6.09%
Calculation of cost of debt
Outstanding debt 2,775
interest rate 5.00%
Tax rate 30.0%
Kd 3.50%
⊘ This is a preview!⊘
Do you want full access?
Subscribe today to unlock all pages.
Trusted by 1+ million students worldwide
1 out of 20
Related Documents


Your All-in-One AI-Powered Toolkit for Academic Success.
+13062052269
info@desklib.com
Available 24*7 on WhatsApp / Email
![[object Object]](/_next/static/media/star-bottom.7253800d.svg)
Unlock your academic potential
Copyright © 2020–2026 A2Z Services. All Rights Reserved. Developed and managed by ZUCOL.