JCU Finance Report: Woolworths Limited Financial Analysis 2017-2018
VerifiedAdded on 2022/10/02
|38
|5008
|339
Report
AI Summary
This report provides a detailed financial analysis of Woolworths Limited, focusing on the 2017 and 2018 financial years. It examines the company's performance through various lenses, including liquidity, profitability, efficiency, financing, and investment analysis. The report delves into key financial ratios, vertical and horizontal analyses of financial statements, and market share dynamics within the Australian retail landscape. It also considers competitive influences and the impact of discontinued operations, such as the Masters Home Improvement venture. Appendices include comparisons of financial performance and position, ratio summaries, and market share data. The analysis aims to provide insights into Woolworths' financial health, sustainability, and its position within the competitive market. The report concludes with a summary of the key findings and their implications for investors and stakeholders. This report is a comprehensive analysis of the company's financial performance and market position, providing valuable insights for investors and stakeholders.
1. Executive summary............................................................................................................................2
2. Introduction........................................................................................................................................3
3. Woolworths Limited – By Numbers..................................................................................................4
3.1 Liquidity analysis........................................................................................................................4
3.2 Profitability analysis....................................................................................................................4
3.3 Efficiency analysis......................................................................................................................5
3.4 Financing analysis.......................................................................................................................5
3.5 Investment analysis.....................................................................................................................5
4. Competitive Influences and Market Share.........................................................................................7
5. Discontinued Operations....................................................................................................................9
6. Vertical and horizontal analysis:........................................................................................................9
7. Conclusion........................................................................................................................................13
8. Reference List...................................................................................................................................14
9. Appendices.......................................................................................................................................18
Appendix 1 - Woolworths Limited Statement of Financial Performance Comparison FY14 to FY18
..............................................................................................................................................................18
Appendix 1 (continued).......................................................................................................................19
Appendix 2 - Woolworths Limited Statement of Financial Position Comparison FY14 to FY18.....20
Appendix 3 – Summary of Key Financial Statement Ratios (Woolworths Limited 5 year
comparison)..........................................................................................................................................21
Appendix 4 – Current Ratio................................................................................................................21
1
Paraphrase This Document
Need a fresh take? Get an instant paraphrase of this document with our AI Paraphraser
Appendix 5 – Acid Test Ratio.............................................................................................................22
Appendix 6 – Profit Margin Ratio.......................................................................................................22
Appendix 7 – Gross Profit Margin Ratio............................................................................................23
Appendix 8 – Inventory Turnover Ratio.............................................................................................23
Appendix 9 – Debt to Equity Ratio.....................................................................................................24
Appendix 10 – Earnings Per Share (Diluted)......................................................................................24
Appendix 12 – Cash Trend..................................................................................................................25
Appendix 13 – Share Market Price.....................................................................................................25
Appendix 14 – Woolworths Group Core Businesses and Brands.......................................................26
Appendix 15 – Market share in Supermarkets and Grocery Stores industry in Australia..................26
Appendix 16 – Market share in the Department Stores industry in Australia....................................27
Appendix 17 – Market share in Liquor Retailing industry in Australia..............................................28
Appendix 18 – Market share in Pubs, Bars and Nightclubs industry in Australia..............................29
1. Executive summary
The company chosen for the purposes of this assignment is Woolworths Limited which is the company
dealing in the groceries. It is an Australian company and is a supermarket. The report aims at
discussing the liquidity, capital, solvency and the efficiency analysis of the company undertaken for
review. Further, this report talks about the share price of the company along with its cash trends and
market shares in the different industries. The report further undertakes the vertical and the horizontal
2
analysis of the statement of profit and loss along with the statement of financial position. In this report,
the above stated analysis has been done on the basis of each item that has been contained in the profit
and loss account and the statement of financial position. The report also throws light on the various
ratios that have been calculated for the purposes of this assignment and then discusses the results from
those ratios. The analysis done in the following sections is of an utmost importance for the investors
since they would want to invest into the company which would give them profits.
3
⊘ This is a preview!⊘
Do you want full access?
Subscribe today to unlock all pages.
Trusted by 1+ million students worldwide
2. Introduction
Beyond a shadow of a doubt, Woolworths Group (Woolworths) is an excellent example of a
perfectly developing, strong, and Australia-wide recognizable business. Since its opening in 1924
(Woolworths Group, 2019) the company has become a multi-branch commercial group encompassing
not only the huge retail chain known to every Australian but also a full range of businesses operating a
number of brands and reaching 28 million customers nationwide (Woolworths Group, 2019).
The group's history predominantly seems to be a series of investment successes; however, they did
not avoid some flawed decisions resulting in serious business consequences. We are referring here to
the spectacular fall of Masters, the home improvement chain (Knight, 2016, Hatch, 2016), which will
be discussed in later in this report.
This report will provide an analysis of the Woolworths Group with a particular focus on the
2016/2017 and 2017/2018 financial years (at a consolidated level). It will further use financial metrics,
ratios and trend data to determine the health and sustainability of the organisation.
4
Paraphrase This Document
Need a fresh take? Get an instant paraphrase of this document with our AI Paraphraser
3. Woolworths Limited – By Numbers
The following section of the report will provide a detailed analysis of the consolidated statements
of financial performance (see appendix 1) and financial position (see appendix 2) of Woolworths as
published on its’ website (Woolworths Annual Reports, 2019). Please refer to appendix 3 for the
‘Summary of Key Financial Statement Ratios’ which have been calculated per the information from
appendix 1 and appendix 2.
Additionally, while the report parameters stipulate a comparison between the 2016/17 and 2017/18
reporting periods, all ratio data has been calculated across a 5 year period ending with the 2017/18
reporting period to further critically analyse trends.
3.1 Liquidity analysis
In the analysis of Woolworths’ ability to convert current assets into cash to cover current
liabilities, it was noted per appendix 4 that the organisation maintained a current ratio of 0.78 for
2017/18 (0.80 in 2016/17).
Per an inspection of the 2017/18 financial position statement, it was observed that there was a
movement increase of $244 mil in current liabilities largely driven by an increase in short term
borrowings and trade and other payables. Inversly, while cash under current assets had increased
(see appendix 12), available for sale assets had reduced by $423 mil. The result of these
movements left Woolworths in a less than desireable position if its’ short term commitments
were to be called. In further reference to appendix 4, it can also be noted that this declining short
term liquidity issue has been gradually intesifying for the past 5 years despite the balance of
physical cash and equivalents increasing.
5
Per appendix 5, the acid test ratio also indicates that the cash balance as at 30/6/2018 would not
be sufficient to cover current liabilities despite improving from the balance of closing cash at
30/6/2017.
3.2 Profitability analysis
In the context of Woolworths, due to the size and nature of the organisation and the number of
subsidiaries it operates, profitability may be distinguished separately between continued
operations only and the consolidation of continued and discontinued operations.
From a review of the profit margin ratio (including discontinued operations after tax) per
appendix 6, there was a noted improvement of 0.26% at the close of 30/6/2018 (ending on
3.15%). The reasons for this improvement will be discussed later in this report but from a brief
look at the performance statement (appendix 1), there was an increase in sales of $1,885 mil with
cost of sales staying relatively comparable year on year (see appendix 7). This is in part due to
less wastage of inventory (appendix 8) and due to Woolworths simply maintaining a more
competitve foot print in the market and attracting more consumers.
3.3 Efficiency analysis
Feeding into the above observation of a growing profit margin, Woolworth’s has seen an increase
in its’ inventory turnover from turning over stock 8.92 times a year in 2016/17 to 9.54 times a
year in 2017/18. This 6.95% increase indicates that stock control improvements have been
implemented during the year resulting in much less wastage occurring and more efficient usage.
This can be further corroborated by the fact that the cost of sales year on year (see appendix 1)
has maintained a relatively low increase when compared to the increase of sales year on year.
6
⊘ This is a preview!⊘
Do you want full access?
Subscribe today to unlock all pages.
Trusted by 1+ million students worldwide
3.4 Financing analysis
It was noted that at 30/6/2018, overall debt held by Woolworths Limited when compared to total
equity (see appendix 9) had decreased from 28.12% in 2016/17 to 20.27%. From this and the
increase in cash as noted above in 3.1, it appears that Woolworths is aiming to move into a more
self-sustaining business model with a decreasing reliance on external debt financing from banks
and private lending institutions. Alternatively, it could also be improving its current debt
leverage standing for a future acquisition or venture that may require considerable financing and
risk, as such it has become conservative temporarily in this respect.
3.5 Investment analysis
In order to assess the strength of Woolworths from an investment perspective, according to
Yahoo Finance (2019) the closing adjusted share price for Woolworths Limited was $29.07 at
30/06/2018. This was an increase of $5.59 per share (where the adjusted closing share price was
$23.48 at 30/06/2017); also refer appendix 13.
The diluted earnings per share ratio (appendix 10) corroborates this increase in the value of the
organisations’ shares further and indicates that due to a number of financial factors stemming
from an increase in sales year on year as well as an overall increase in total comprehensive
income (being up $158 mil in 2017/18 when compared to 2016/2017 – see appendix 1).
It must further be noted that when we look at the share price of Woolworths Limited over a 5
year period, the group appears to still be in somewhat of a recovery period due to the disolution
of Masters Homewares in in the 2015/16 financial year. As such the steep incline in price may
also be the organisation adjusting itself back to a more normalised position. This fundamentally
means that the current trend of an ever growing share price as well as significant increases year
on year in profit may gradually decline in future reporting periods.
7
Paraphrase This Document
Need a fresh take? Get an instant paraphrase of this document with our AI Paraphraser
4. Competitive Influences and Market Share
Woolworths Group is composed of three major businesses, Australian Food, New Zealand Food
and Endeavour Drinks. In addition to this there are two portfolio businesses, Big W and Australian
Leisure and Hospitality Group (AHL Group).Woolworths derives its revenue from the retail of
supermarket food, liquor, and general merchandise, and the operation of hotels (IBISWorld, 2019). The
table per appendix 14 shows the group’s core businesses and brands they own (not to mention a suite of
more than seventy subsidiaries controlled by the group – IBISWorld, 2019).
Woolworths operates businesses in various branches of industry (IBISWorld, 2019). Below is the
analysis of those industries that Woolworths Group is recognised as one of the major players (see
appendix 15).
Supermarkets and grocery stores in Australia – Woolworths, along with its major rival Coles
Group Limited hold over two thirds of the total market share. ALDI stores and Metcash Limited
operating IGA markets are another two major players. The industry with high concentration
level encompassing 1,946 enterprises (Youl, 2018). Appendix 15 shows the market share break
down.
Department Stores in Australia – Woolworths’ portfolio business BIG W has a market share of
19.2%. Woolworths Company’s primary rivals are Wesfarmers Limited, operating Kmart, and
Target, Myer Holdings Limited operating Myer stores, and Osiris Holdings Pty Ltd, operator of
David Jones stores. The industry with high concentration level encompassing 120 businesses
(Do, 2019) (See appendix 16).
Liquor Retailing in Australia – A significant part of Woolworths Endeavour Drinks business
participate in the industry predominantly through Dan Murphy’s chain, and BWS stores. Coles
8
Group Limited again hold a major share with their portfolio including Liquorland, and Metcash
Limited operating Independent Brands Australia. The industry with high concentration level
encompassing 2,322 businesses (Reeves, 2019) (see appendix 17).
Pubs, Bars and Nightclubs in Australia – participation in the industry primarily through the
Australian Leisure and Hospitality Group. Woolworths’s market share is estimated at a level of
9.2%, no other competitors hold over a 5% market share. It should be noted that some of the
larger competitors are Australian Venue Co Limited operating Spirit Hotels and Hemmes
Trading Pty Ltd with Merivale. The industry with low concentration level encompassing 6,357
enterprises (Reeves, 2019) (see appendix 18).
Woolworths Group competes directly with other Australian giants Wesfarmers and Coles
Group1as the major retailers in the supermarkets and grocery stores, department stores and liquor
retailing industries. Woolworths now has no presence in the home improvements industry since 2016
when Woolworths sold-off its share in Home Timber & Hardware, and closed its Masters Home
Improvement stores (Youren, 2019).
1 Since Coles Group has been demerged from Wesfarmers, currently they hold 15 percent of interest in Coles Group
(Wesfarmers.com.au, n.d.).
9
⊘ This is a preview!⊘
Do you want full access?
Subscribe today to unlock all pages.
Trusted by 1+ million students worldwide
5. Discontinued Operations
In 2009 Woolworths launched a significant investment into the Hardware Industry when it set out
to replicate their success in the supermarket industry and compete against Bunnings, the dominant
player in the market (Evans, 2016). Woolworths partnered with US hardware chain Lowe’s, and both
had invested nearly $3 billion, to open Masters Home Improvement Australia; in 2016 and still no
returns, the joint venture was considered a substantial failure in Australian market (Stewart, 2016) and
Woolworths made the decision to exit the market. There were several reasons why the Woolworths’s
hardware business was not successful (Stewart, 2016, Mitchell, n.d.), these include:
Flawed concept (opened to many stores within a short time frame and in the wrong locations);
Wrong strategy (too much emphasis on challenging Bunnings instead of watching over Coles);
Incorrect product range (e.g. selling inappropriate products due to the time of year);
Lowe’s did not understand the Australian market;
Miscalculated Bunnings’ business response;
Overly optimistic outlook; and
The flawed organisational culture at the workplace
Shopping Experience
Masters stores ceased trading in December 2016 (Woolwothsgroup.com, 2016) with the portfolio
business, in 2015/2016 producing a loss before interest and income tax (LBIT) of $233 million
(Woolworths Annual Report 2016). This followed an LBIT of $245 million in 2014/2015, $176 million
in 2013/2014 and $156million in 2012/2013.
10
Paraphrase This Document
Need a fresh take? Get an instant paraphrase of this document with our AI Paraphraser
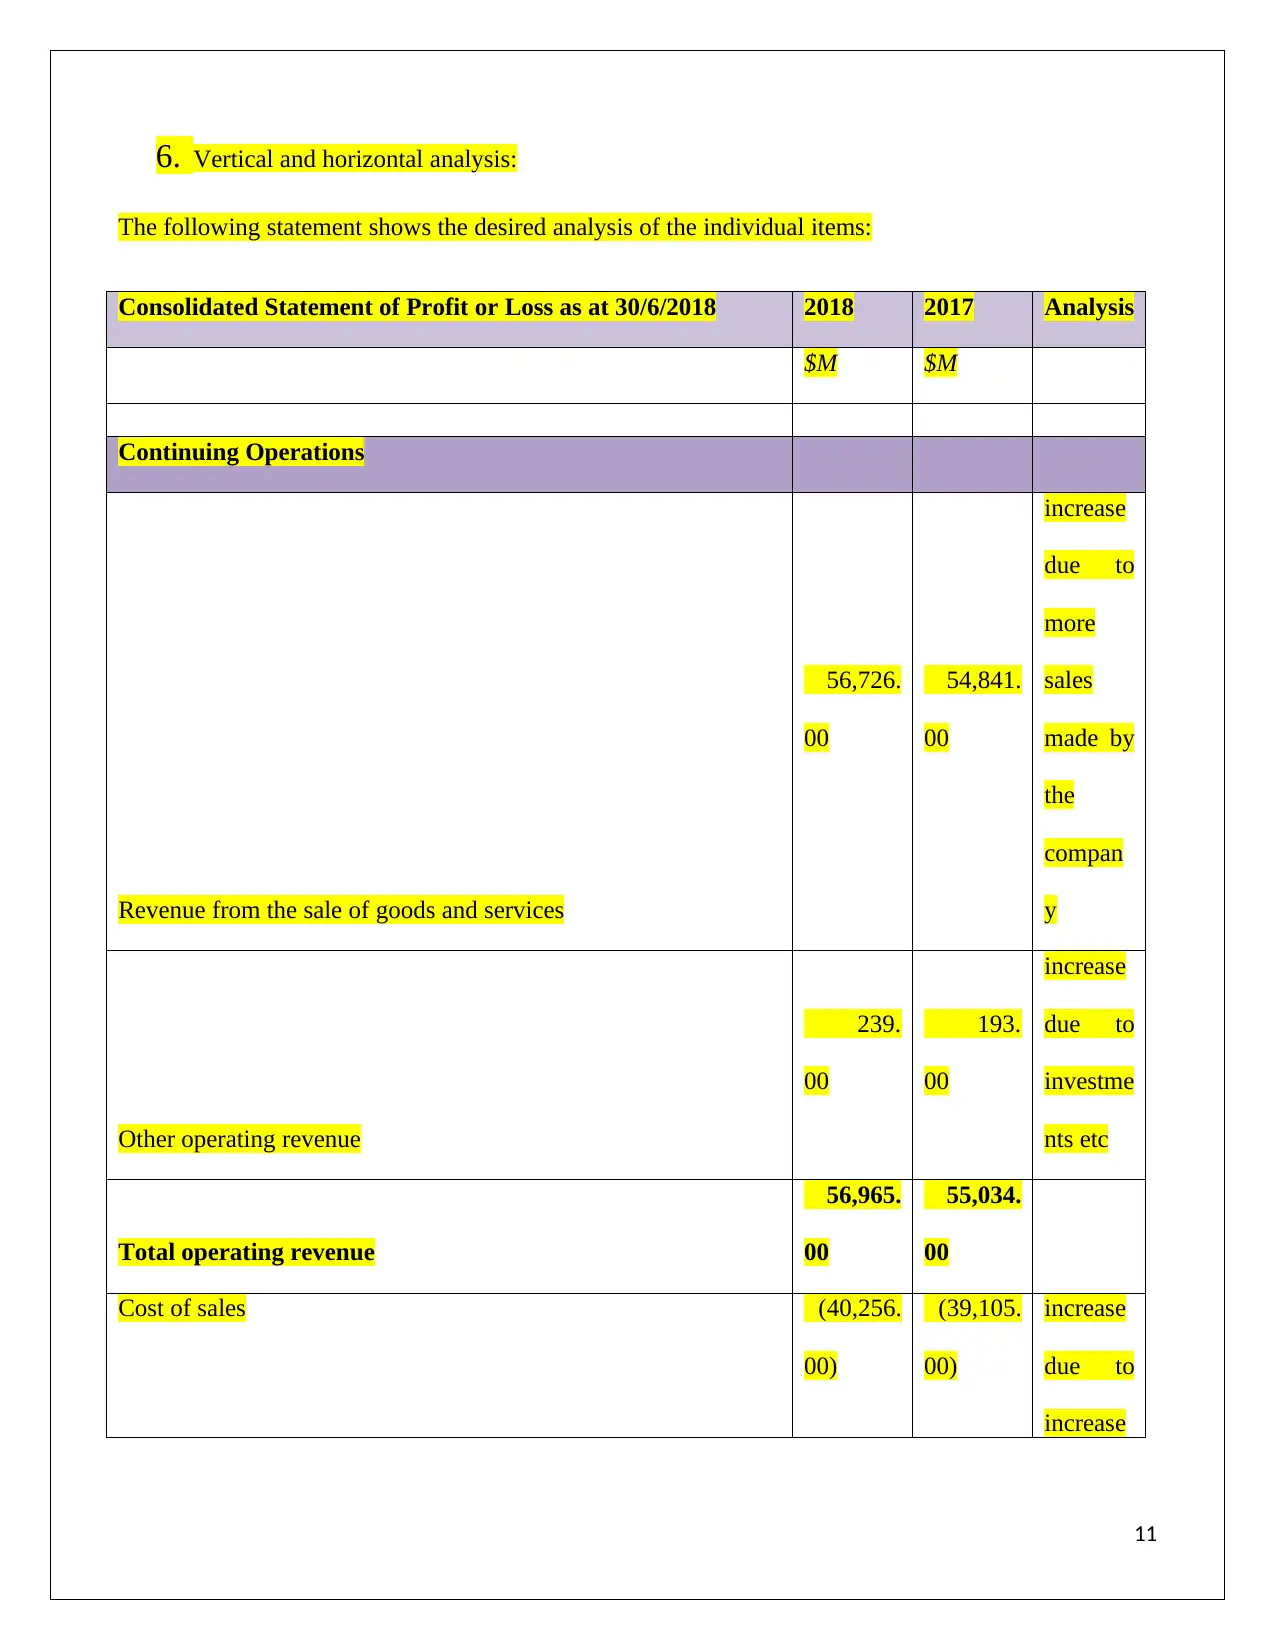
6. Vertical and horizontal analysis:
The following statement shows the desired analysis of the individual items:
Consolidated Statement of Profit or Loss as at 30/6/2018 2018 2017 Analysis
$M $M
Continuing Operations
Revenue from the sale of goods and services
56,726.
00
54,841.
00
increase
due to
more
sales
made by
the
compan
y
Other operating revenue
239.
00
193.
00
increase
due to
investme
nts etc
Total operating revenue
56,965.
00
55,034.
00
Cost of sales (40,256.
00)
(39,105.
00)
increase
due to
increase
11
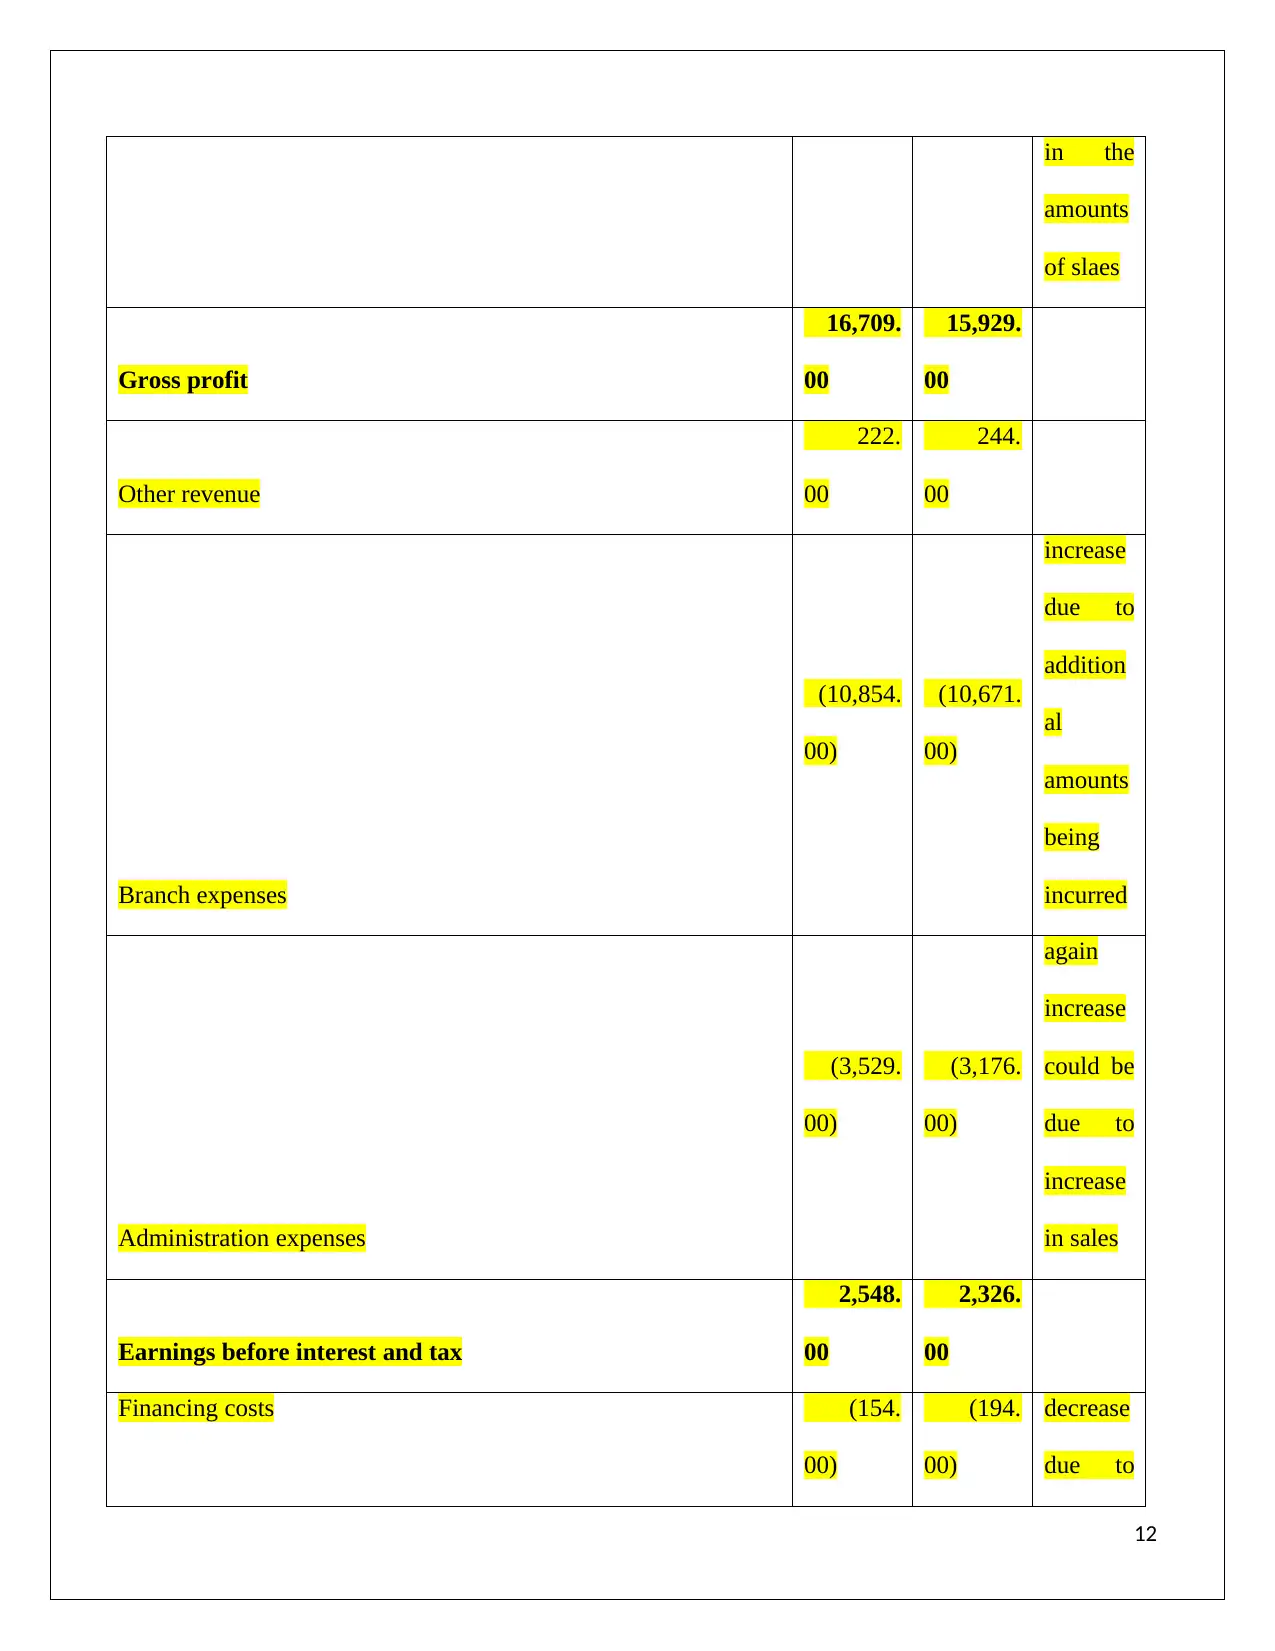
in the
amounts
of slaes
Gross profit
16,709.
00
15,929.
00
Other revenue
222.
00
244.
00
Branch expenses
(10,854.
00)
(10,671.
00)
increase
due to
addition
al
amounts
being
incurred
Administration expenses
(3,529.
00)
(3,176.
00)
again
increase
could be
due to
increase
in sales
Earnings before interest and tax
2,548.
00
2,326.
00
Financing costs (154.
00)
(194.
00)
decrease
due to
12
amounts
of slaes
Gross profit
16,709.
00
15,929.
00
Other revenue
222.
00
244.
00
Branch expenses
(10,854.
00)
(10,671.
00)
increase
due to
addition
al
amounts
being
incurred
Administration expenses
(3,529.
00)
(3,176.
00)
again
increase
could be
due to
increase
in sales
Earnings before interest and tax
2,548.
00
2,326.
00
Financing costs (154.
00)
(194.
00)
decrease
due to
12
⊘ This is a preview!⊘
Do you want full access?
Subscribe today to unlock all pages.
Trusted by 1+ million students worldwide
1 out of 38
Related Documents


Your All-in-One AI-Powered Toolkit for Academic Success.
+13062052269
info@desklib.com
Available 24*7 on WhatsApp / Email
![[object Object]](/_next/static/media/star-bottom.7253800d.svg)
Unlock your academic potential
Copyright © 2020–2026 A2Z Services. All Rights Reserved. Developed and managed by ZUCOL.