Financial Analysis Report: Woolworths Performance and Recommendations
VerifiedAdded on 2022/08/21
|11
|2253
|22
Report
AI Summary
This report provides a detailed financial analysis of Woolworths, examining its performance over a five-year period in comparison to industry standards and its competitor, Wesfarmers. The analysis covers key financial areas including profitability, liquidity, efficiency, and capital structure. Various financial tools like trend analysis, DuPont analysis, and market value ratios are employed to identify strengths, weaknesses, and overall financial performance within the retail industry. The report highlights a decline in Woolworths' current ratio and a constant return on equity, indicating potential issues in liquidity and profitability. The efficiency ratio shows improvement, suggesting effective asset utilization. The analysis also includes peer group comparison and trend analysis to determine future movements. Based on the findings, the report concludes with recommendations for Woolworths to improve its profit margins and overall financial health, emphasizing the need to enhance its profitability and liquidity positions. The company's market condition is analyzed using P/E ratio, with suggestions to improve earnings per share for shareholders.
RUNNING HEAD: FINANCIAL MANAGEMENT
0
Financial Management
0
Financial Management
Paraphrase This Document
Need a fresh take? Get an instant paraphrase of this document with our AI Paraphraser
Financial Management
1
Executive Summary
The aim of this report is to analyse the profitability, liquidity, efficiency and capital structure
of Woolworths in comparison with industry aggregate and its competitor Wesfarmers.
Further, the report includes trend analysis, DuPont analysis and market value ratio of the
company in order to identify strengths and weaknesses and financial performance of the
company in the retail industry. At last, few recommendations are given considering the poor
profitability and return on equity of Woolworths. Recommendations are that the company
should increase its profit margin that helps Woolworths to increase its profitability and return
on equity.
Financial Management
2
Table of Contents
Introduction................................................................................................................................3
Theories......................................................................................................................................3
Liquidity Analysis..................................................................................................................3
Profitability Analysis..............................................................................................................4
Capital Structure.....................................................................................................................4
Efficiency Analysis................................................................................................................5
Analysis......................................................................................................................................5
Conclusion and Recommendations............................................................................................8
References................................................................................................................................10
⊘ This is a preview!⊘
Do you want full access?
Subscribe today to unlock all pages.
Trusted by 1+ million students worldwide
Financial Management
3
Introduction
Financial management is considered as the management of planning, organizing, controlling
the activities related to finances of business that includes the procurement of funds, utilization
of funds and investment of funds. In simple terms, it is managing finances in the business in
order to get maximum return. The objective of this report is to analyze how Woolworths
perform as compared to its competitor and industry standard. Further, analysis is done using
tools such as DuPont analysis, ratio analysis, and trend analysis. At last, by considering
information or weak and strong areas of Woolworths few recommendations are given.
Woolworths is an Australian company that offers groceries, magazines, DVD’s, household,
beauty and health products. The company has 981 supermarkets and 43 convenience stores
across. Wesfarmers is the biggest competitor of Woolworths in the retail industry
(Woolworths,2020).
Theories
The analysis of Woolworths is done for 5 years in order to analyze the performance and
growth of the company in the retail industry. For that different parameters are taken into
considerations that are efficiency, profitability, and capital structure and liquidity position of
the company.
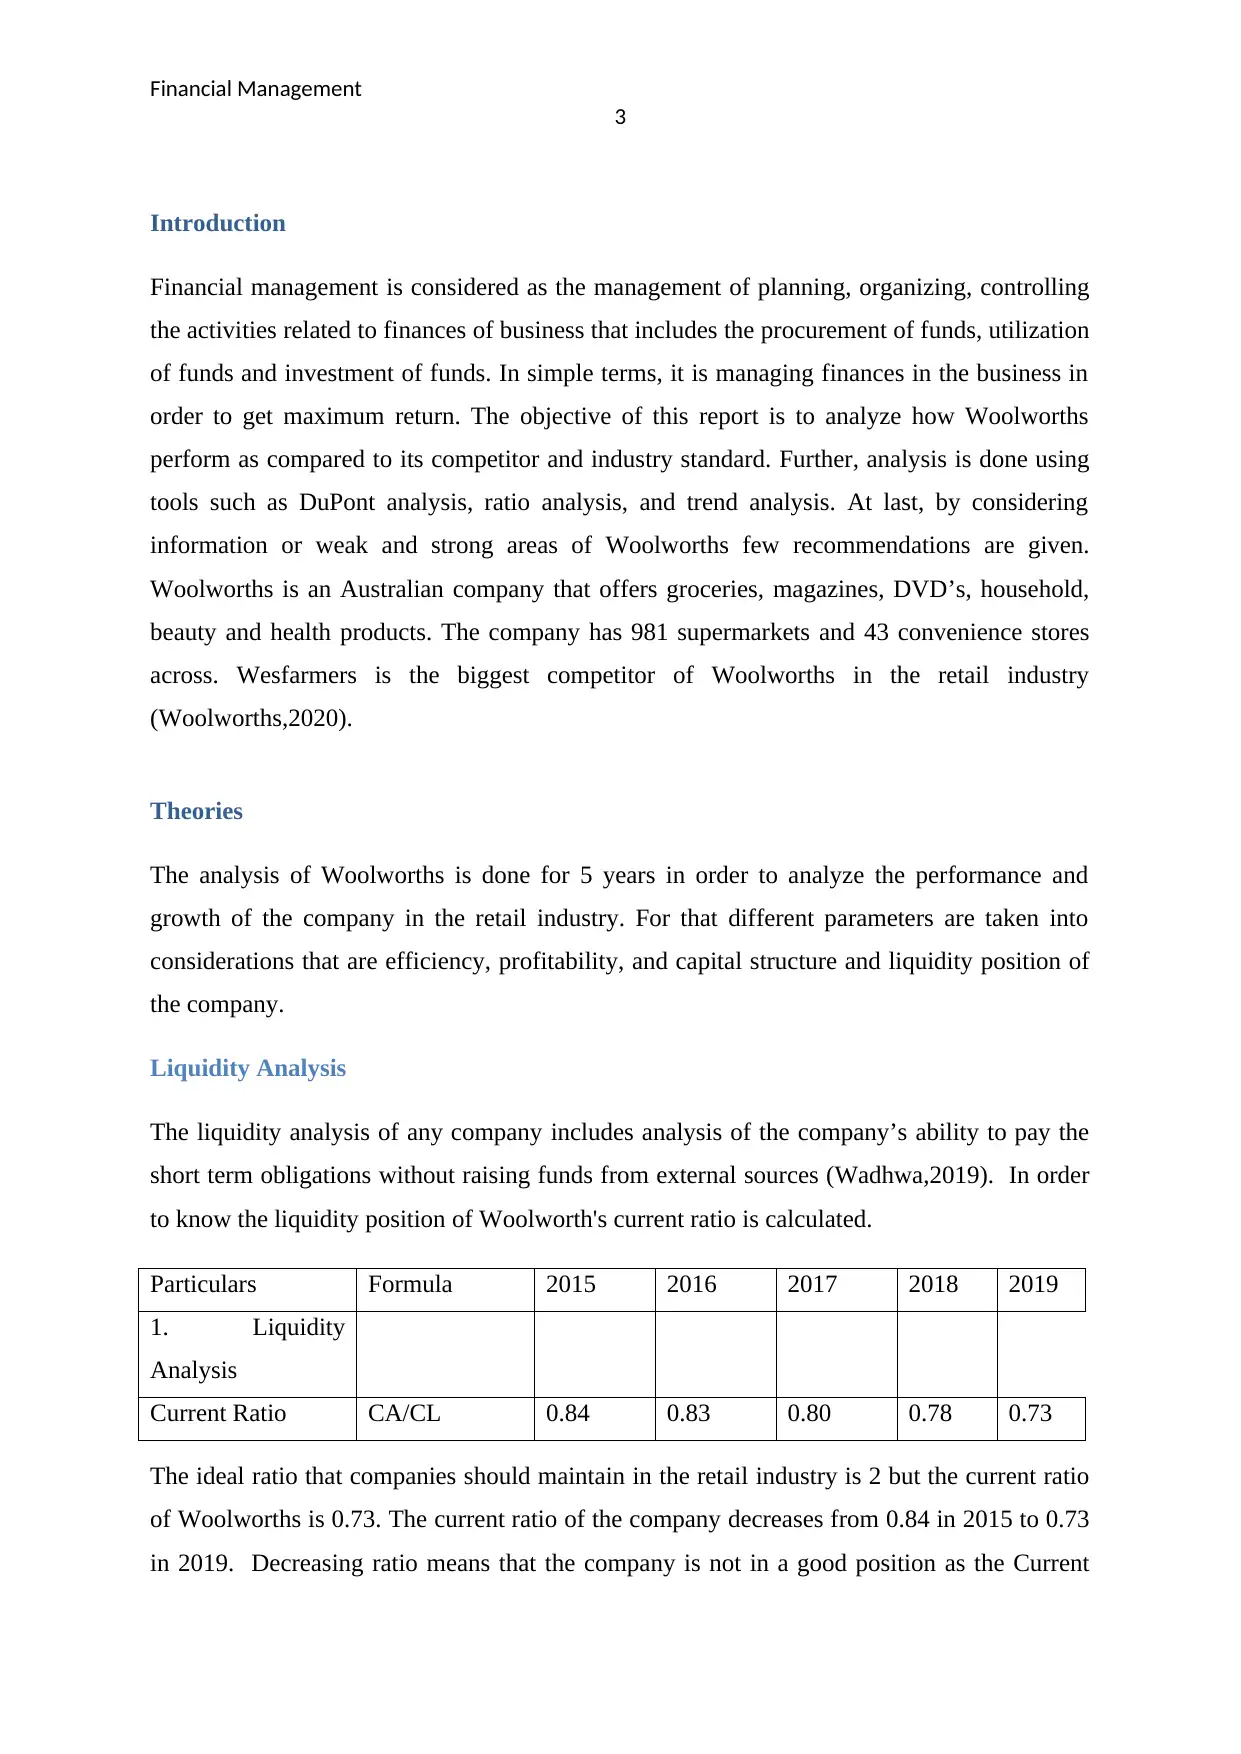
Liquidity Analysis
The liquidity analysis of any company includes analysis of the company’s ability to pay the
short term obligations without raising funds from external sources (Wadhwa,2019). In order
to know the liquidity position of Woolworth's current ratio is calculated.
Particulars Formula 2015 2016 2017 2018 2019
1. Liquidity
Analysis
Current Ratio CA/CL 0.84 0.83 0.80 0.78 0.73
The ideal ratio that companies should maintain in the retail industry is 2 but the current ratio
of Woolworths is 0.73. The current ratio of the company decreases from 0.84 in 2015 to 0.73
in 2019. Decreasing ratio means that the company is not in a good position as the Current
3
Introduction
Financial management is considered as the management of planning, organizing, controlling
the activities related to finances of business that includes the procurement of funds, utilization
of funds and investment of funds. In simple terms, it is managing finances in the business in
order to get maximum return. The objective of this report is to analyze how Woolworths
perform as compared to its competitor and industry standard. Further, analysis is done using
tools such as DuPont analysis, ratio analysis, and trend analysis. At last, by considering
information or weak and strong areas of Woolworths few recommendations are given.
Woolworths is an Australian company that offers groceries, magazines, DVD’s, household,
beauty and health products. The company has 981 supermarkets and 43 convenience stores
across. Wesfarmers is the biggest competitor of Woolworths in the retail industry
(Woolworths,2020).
Theories
The analysis of Woolworths is done for 5 years in order to analyze the performance and
growth of the company in the retail industry. For that different parameters are taken into
considerations that are efficiency, profitability, and capital structure and liquidity position of
the company.
Liquidity Analysis
The liquidity analysis of any company includes analysis of the company’s ability to pay the
short term obligations without raising funds from external sources (Wadhwa,2019). In order
to know the liquidity position of Woolworth's current ratio is calculated.
Particulars Formula 2015 2016 2017 2018 2019
1. Liquidity
Analysis
Current Ratio CA/CL 0.84 0.83 0.80 0.78 0.73
The ideal ratio that companies should maintain in the retail industry is 2 but the current ratio
of Woolworths is 0.73. The current ratio of the company decreases from 0.84 in 2015 to 0.73
in 2019. Decreasing ratio means that the company is not in a good position as the Current
Paraphrase This Document
Need a fresh take? Get an instant paraphrase of this document with our AI Paraphraser
Financial Management
4
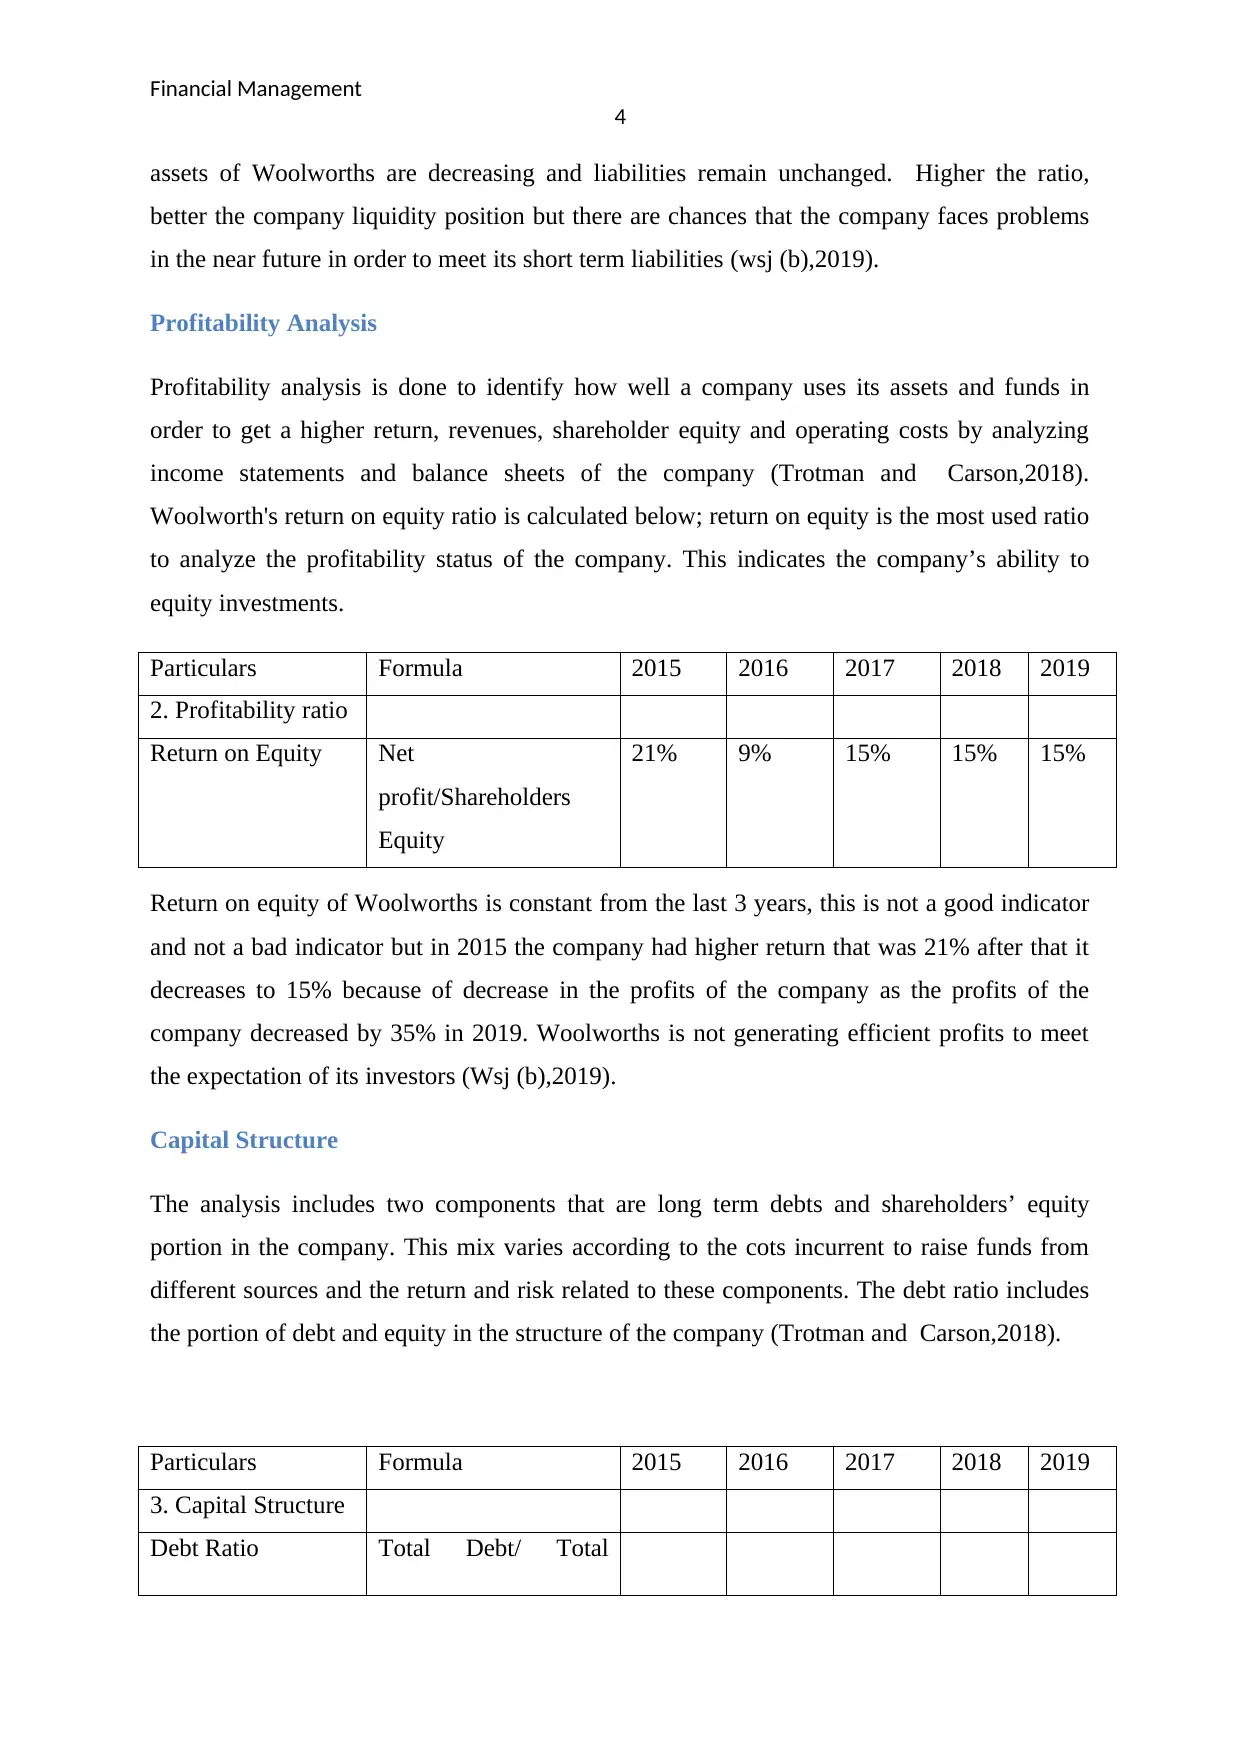
assets of Woolworths are decreasing and liabilities remain unchanged. Higher the ratio,
better the company liquidity position but there are chances that the company faces problems
in the near future in order to meet its short term liabilities (wsj (b),2019).
Profitability Analysis
Profitability analysis is done to identify how well a company uses its assets and funds in
order to get a higher return, revenues, shareholder equity and operating costs by analyzing
income statements and balance sheets of the company (Trotman and Carson,2018).
Woolworth's return on equity ratio is calculated below; return on equity is the most used ratio
to analyze the profitability status of the company. This indicates the company’s ability to
equity investments.
Particulars Formula 2015 2016 2017 2018 2019
2. Profitability ratio
Return on Equity Net
profit/Shareholders
Equity
21% 9% 15% 15% 15%
Return on equity of Woolworths is constant from the last 3 years, this is not a good indicator
and not a bad indicator but in 2015 the company had higher return that was 21% after that it
decreases to 15% because of decrease in the profits of the company as the profits of the
company decreased by 35% in 2019. Woolworths is not generating efficient profits to meet
the expectation of its investors (Wsj (b),2019).
Capital Structure
The analysis includes two components that are long term debts and shareholders’ equity
portion in the company. This mix varies according to the cots incurrent to raise funds from
different sources and the return and risk related to these components. The debt ratio includes
the portion of debt and equity in the structure of the company (Trotman and Carson,2018).
Particulars Formula 2015 2016 2017 2018 2019
3. Capital Structure
Debt Ratio Total Debt/ Total
4
assets of Woolworths are decreasing and liabilities remain unchanged. Higher the ratio,
better the company liquidity position but there are chances that the company faces problems
in the near future in order to meet its short term liabilities (wsj (b),2019).
Profitability Analysis
Profitability analysis is done to identify how well a company uses its assets and funds in
order to get a higher return, revenues, shareholder equity and operating costs by analyzing
income statements and balance sheets of the company (Trotman and Carson,2018).
Woolworth's return on equity ratio is calculated below; return on equity is the most used ratio
to analyze the profitability status of the company. This indicates the company’s ability to
equity investments.
Particulars Formula 2015 2016 2017 2018 2019
2. Profitability ratio
Return on Equity Net
profit/Shareholders
Equity
21% 9% 15% 15% 15%
Return on equity of Woolworths is constant from the last 3 years, this is not a good indicator
and not a bad indicator but in 2015 the company had higher return that was 21% after that it
decreases to 15% because of decrease in the profits of the company as the profits of the
company decreased by 35% in 2019. Woolworths is not generating efficient profits to meet
the expectation of its investors (Wsj (b),2019).
Capital Structure
The analysis includes two components that are long term debts and shareholders’ equity
portion in the company. This mix varies according to the cots incurrent to raise funds from
different sources and the return and risk related to these components. The debt ratio includes
the portion of debt and equity in the structure of the company (Trotman and Carson,2018).
Particulars Formula 2015 2016 2017 2018 2019
3. Capital Structure
Debt Ratio Total Debt/ Total
Financial Management
5
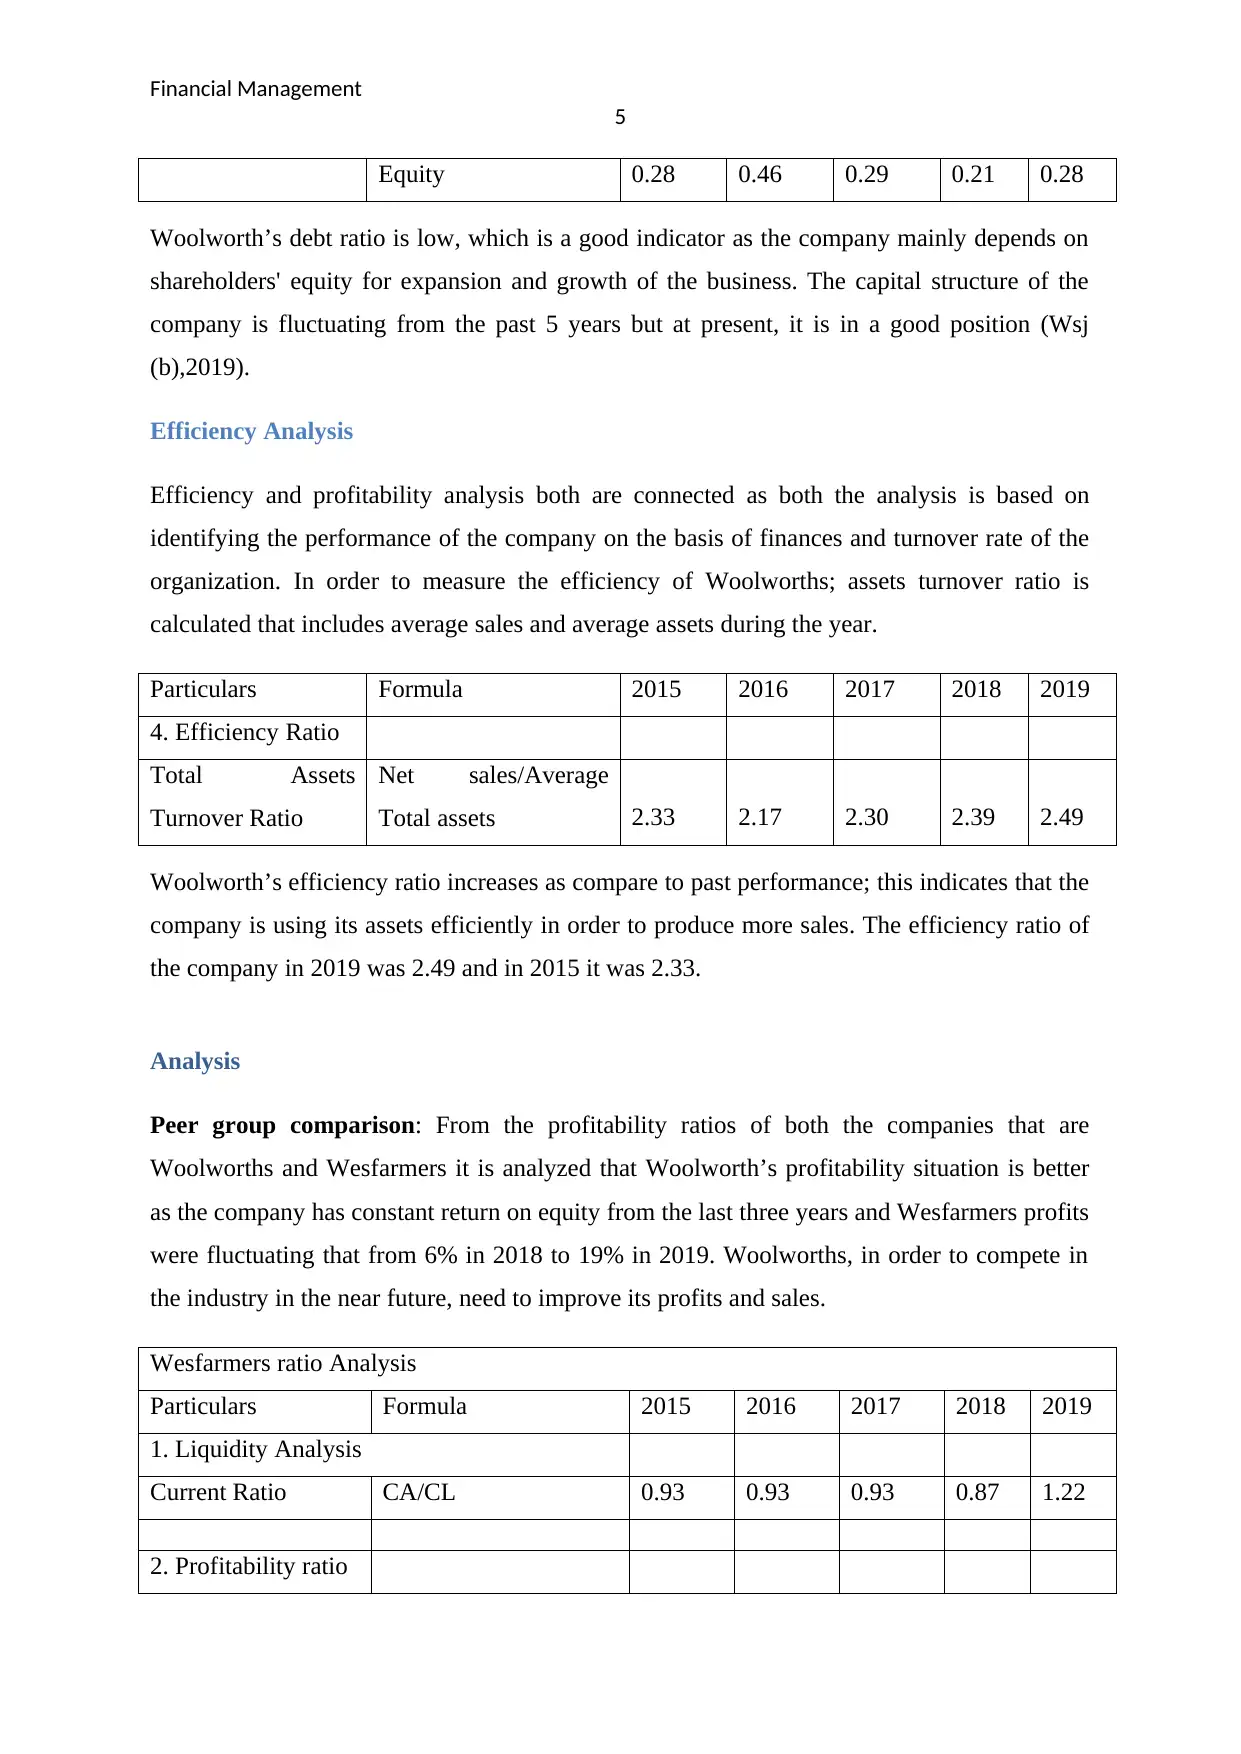
Equity 0.28 0.46 0.29 0.21 0.28
Woolworth’s debt ratio is low, which is a good indicator as the company mainly depends on
shareholders' equity for expansion and growth of the business. The capital structure of the
company is fluctuating from the past 5 years but at present, it is in a good position (Wsj
(b),2019).
Efficiency Analysis
Efficiency and profitability analysis both are connected as both the analysis is based on
identifying the performance of the company on the basis of finances and turnover rate of the
organization. In order to measure the efficiency of Woolworths; assets turnover ratio is
calculated that includes average sales and average assets during the year.
Particulars Formula 2015 2016 2017 2018 2019
4. Efficiency Ratio
Total Assets
Turnover Ratio
Net sales/Average
Total assets 2.33 2.17 2.30 2.39 2.49
Woolworth’s efficiency ratio increases as compare to past performance; this indicates that the
company is using its assets efficiently in order to produce more sales. The efficiency ratio of
the company in 2019 was 2.49 and in 2015 it was 2.33.
Analysis
Peer group comparison: From the profitability ratios of both the companies that are
Woolworths and Wesfarmers it is analyzed that Woolworth’s profitability situation is better
as the company has constant return on equity from the last three years and Wesfarmers profits
were fluctuating that from 6% in 2018 to 19% in 2019. Woolworths, in order to compete in
the industry in the near future, need to improve its profits and sales.
Wesfarmers ratio Analysis
Particulars Formula 2015 2016 2017 2018 2019
1. Liquidity Analysis
Current Ratio CA/CL 0.93 0.93 0.93 0.87 1.22
2. Profitability ratio
5
Equity 0.28 0.46 0.29 0.21 0.28
Woolworth’s debt ratio is low, which is a good indicator as the company mainly depends on
shareholders' equity for expansion and growth of the business. The capital structure of the
company is fluctuating from the past 5 years but at present, it is in a good position (Wsj
(b),2019).
Efficiency Analysis
Efficiency and profitability analysis both are connected as both the analysis is based on
identifying the performance of the company on the basis of finances and turnover rate of the
organization. In order to measure the efficiency of Woolworths; assets turnover ratio is
calculated that includes average sales and average assets during the year.
Particulars Formula 2015 2016 2017 2018 2019
4. Efficiency Ratio
Total Assets
Turnover Ratio
Net sales/Average
Total assets 2.33 2.17 2.30 2.39 2.49
Woolworth’s efficiency ratio increases as compare to past performance; this indicates that the
company is using its assets efficiently in order to produce more sales. The efficiency ratio of
the company in 2019 was 2.49 and in 2015 it was 2.33.
Analysis
Peer group comparison: From the profitability ratios of both the companies that are
Woolworths and Wesfarmers it is analyzed that Woolworth’s profitability situation is better
as the company has constant return on equity from the last three years and Wesfarmers profits
were fluctuating that from 6% in 2018 to 19% in 2019. Woolworths, in order to compete in
the industry in the near future, need to improve its profits and sales.
Wesfarmers ratio Analysis
Particulars Formula 2015 2016 2017 2018 2019
1. Liquidity Analysis
Current Ratio CA/CL 0.93 0.93 0.93 0.87 1.22
2. Profitability ratio
⊘ This is a preview!⊘
Do you want full access?
Subscribe today to unlock all pages.
Trusted by 1+ million students worldwide
Financial Management
6
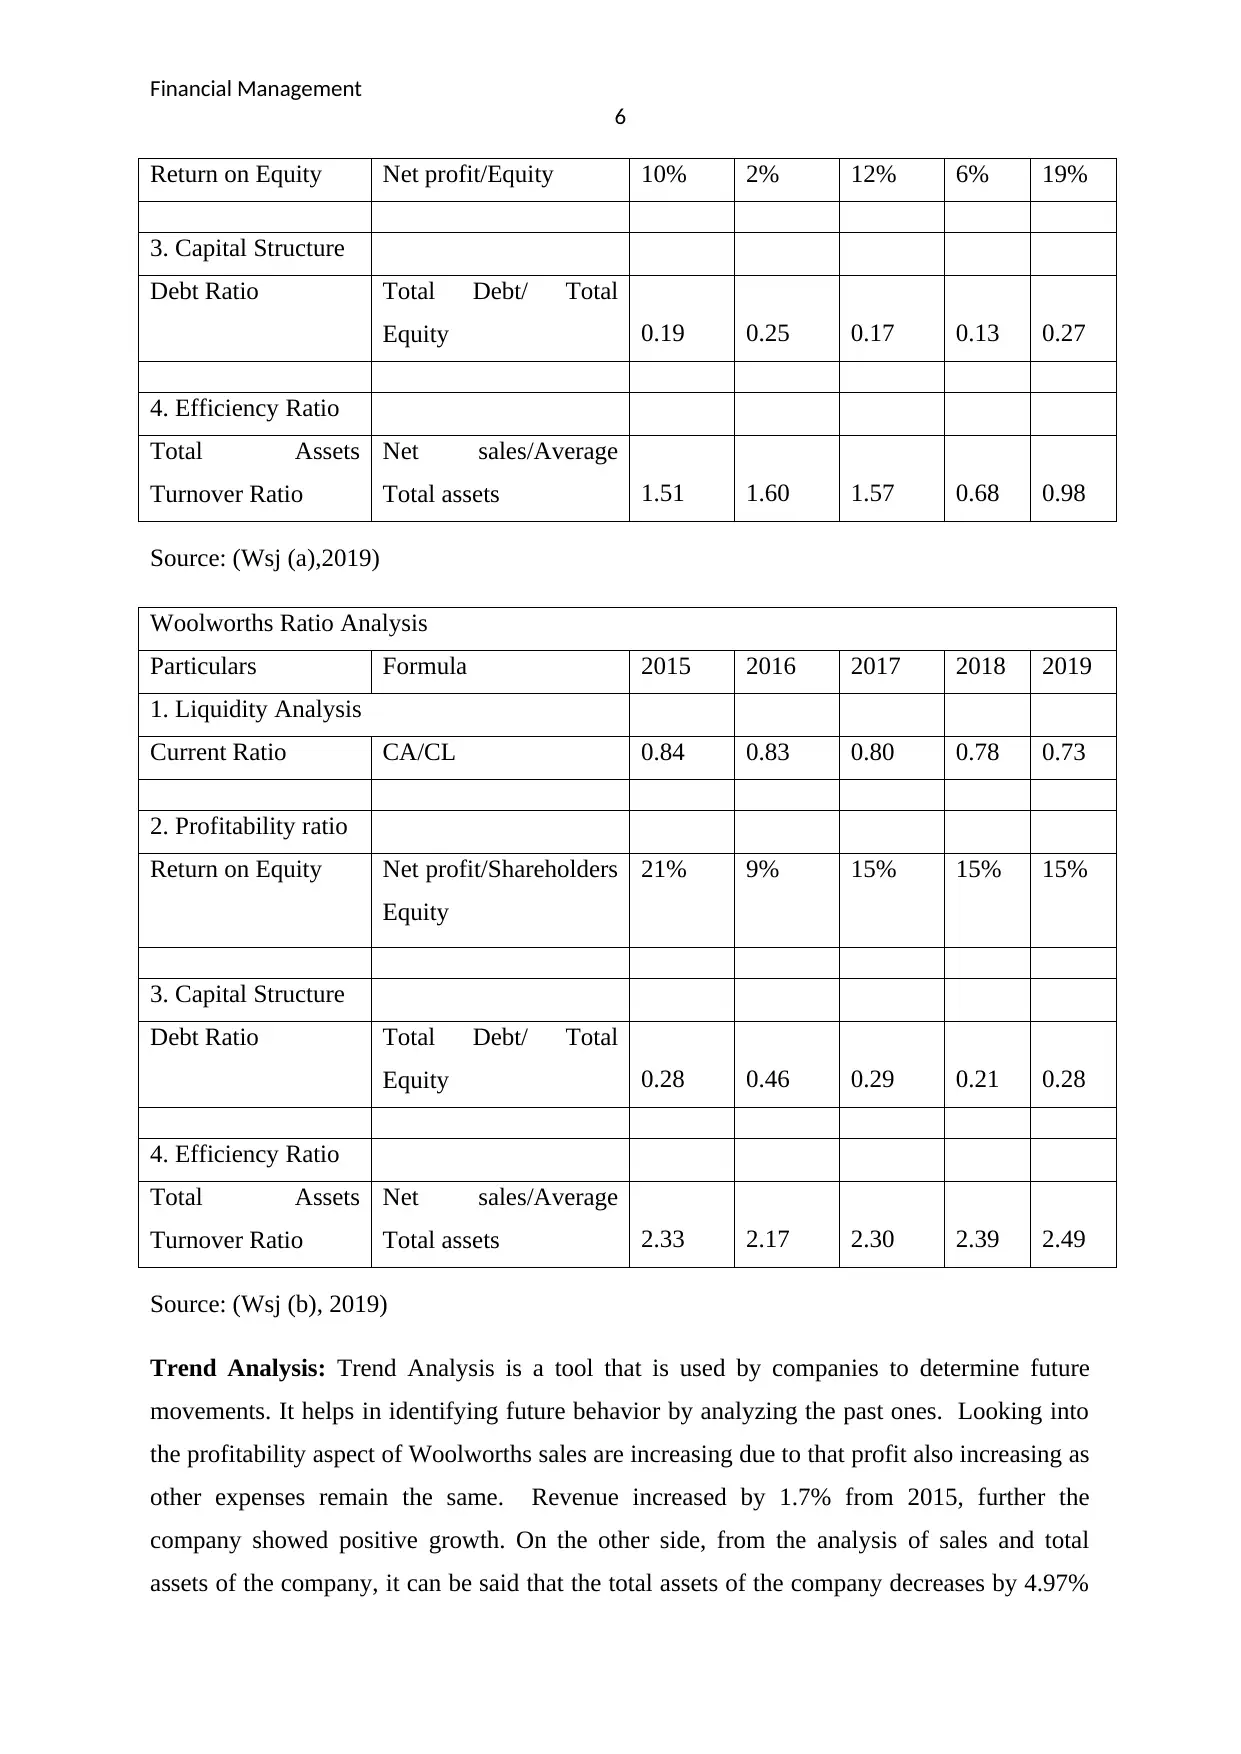
Return on Equity Net profit/Equity 10% 2% 12% 6% 19%
3. Capital Structure
Debt Ratio Total Debt/ Total
Equity 0.19 0.25 0.17 0.13 0.27
4. Efficiency Ratio
Total Assets
Turnover Ratio
Net sales/Average
Total assets 1.51 1.60 1.57 0.68 0.98
Source: (Wsj (a),2019)
Woolworths Ratio Analysis
Particulars Formula 2015 2016 2017 2018 2019
1. Liquidity Analysis
Current Ratio CA/CL 0.84 0.83 0.80 0.78 0.73
2. Profitability ratio
Return on Equity Net profit/Shareholders
Equity
21% 9% 15% 15% 15%
3. Capital Structure
Debt Ratio Total Debt/ Total
Equity 0.28 0.46 0.29 0.21 0.28
4. Efficiency Ratio
Total Assets
Turnover Ratio
Net sales/Average
Total assets 2.33 2.17 2.30 2.39 2.49
Source: (Wsj (b), 2019)
Trend Analysis: Trend Analysis is a tool that is used by companies to determine future
movements. It helps in identifying future behavior by analyzing the past ones. Looking into
the profitability aspect of Woolworths sales are increasing due to that profit also increasing as
other expenses remain the same. Revenue increased by 1.7% from 2015, further the
company showed positive growth. On the other side, from the analysis of sales and total
assets of the company, it can be said that the total assets of the company decreases by 4.97%
6
Return on Equity Net profit/Equity 10% 2% 12% 6% 19%
3. Capital Structure
Debt Ratio Total Debt/ Total
Equity 0.19 0.25 0.17 0.13 0.27
4. Efficiency Ratio
Total Assets
Turnover Ratio
Net sales/Average
Total assets 1.51 1.60 1.57 0.68 0.98
Source: (Wsj (a),2019)
Woolworths Ratio Analysis
Particulars Formula 2015 2016 2017 2018 2019
1. Liquidity Analysis
Current Ratio CA/CL 0.84 0.83 0.80 0.78 0.73
2. Profitability ratio
Return on Equity Net profit/Shareholders
Equity
21% 9% 15% 15% 15%
3. Capital Structure
Debt Ratio Total Debt/ Total
Equity 0.28 0.46 0.29 0.21 0.28
4. Efficiency Ratio
Total Assets
Turnover Ratio
Net sales/Average
Total assets 2.33 2.17 2.30 2.39 2.49
Source: (Wsj (b), 2019)
Trend Analysis: Trend Analysis is a tool that is used by companies to determine future
movements. It helps in identifying future behavior by analyzing the past ones. Looking into
the profitability aspect of Woolworths sales are increasing due to that profit also increasing as
other expenses remain the same. Revenue increased by 1.7% from 2015, further the
company showed positive growth. On the other side, from the analysis of sales and total
assets of the company, it can be said that the total assets of the company decreases by 4.97%
Paraphrase This Document
Need a fresh take? Get an instant paraphrase of this document with our AI Paraphraser
Financial Management
7
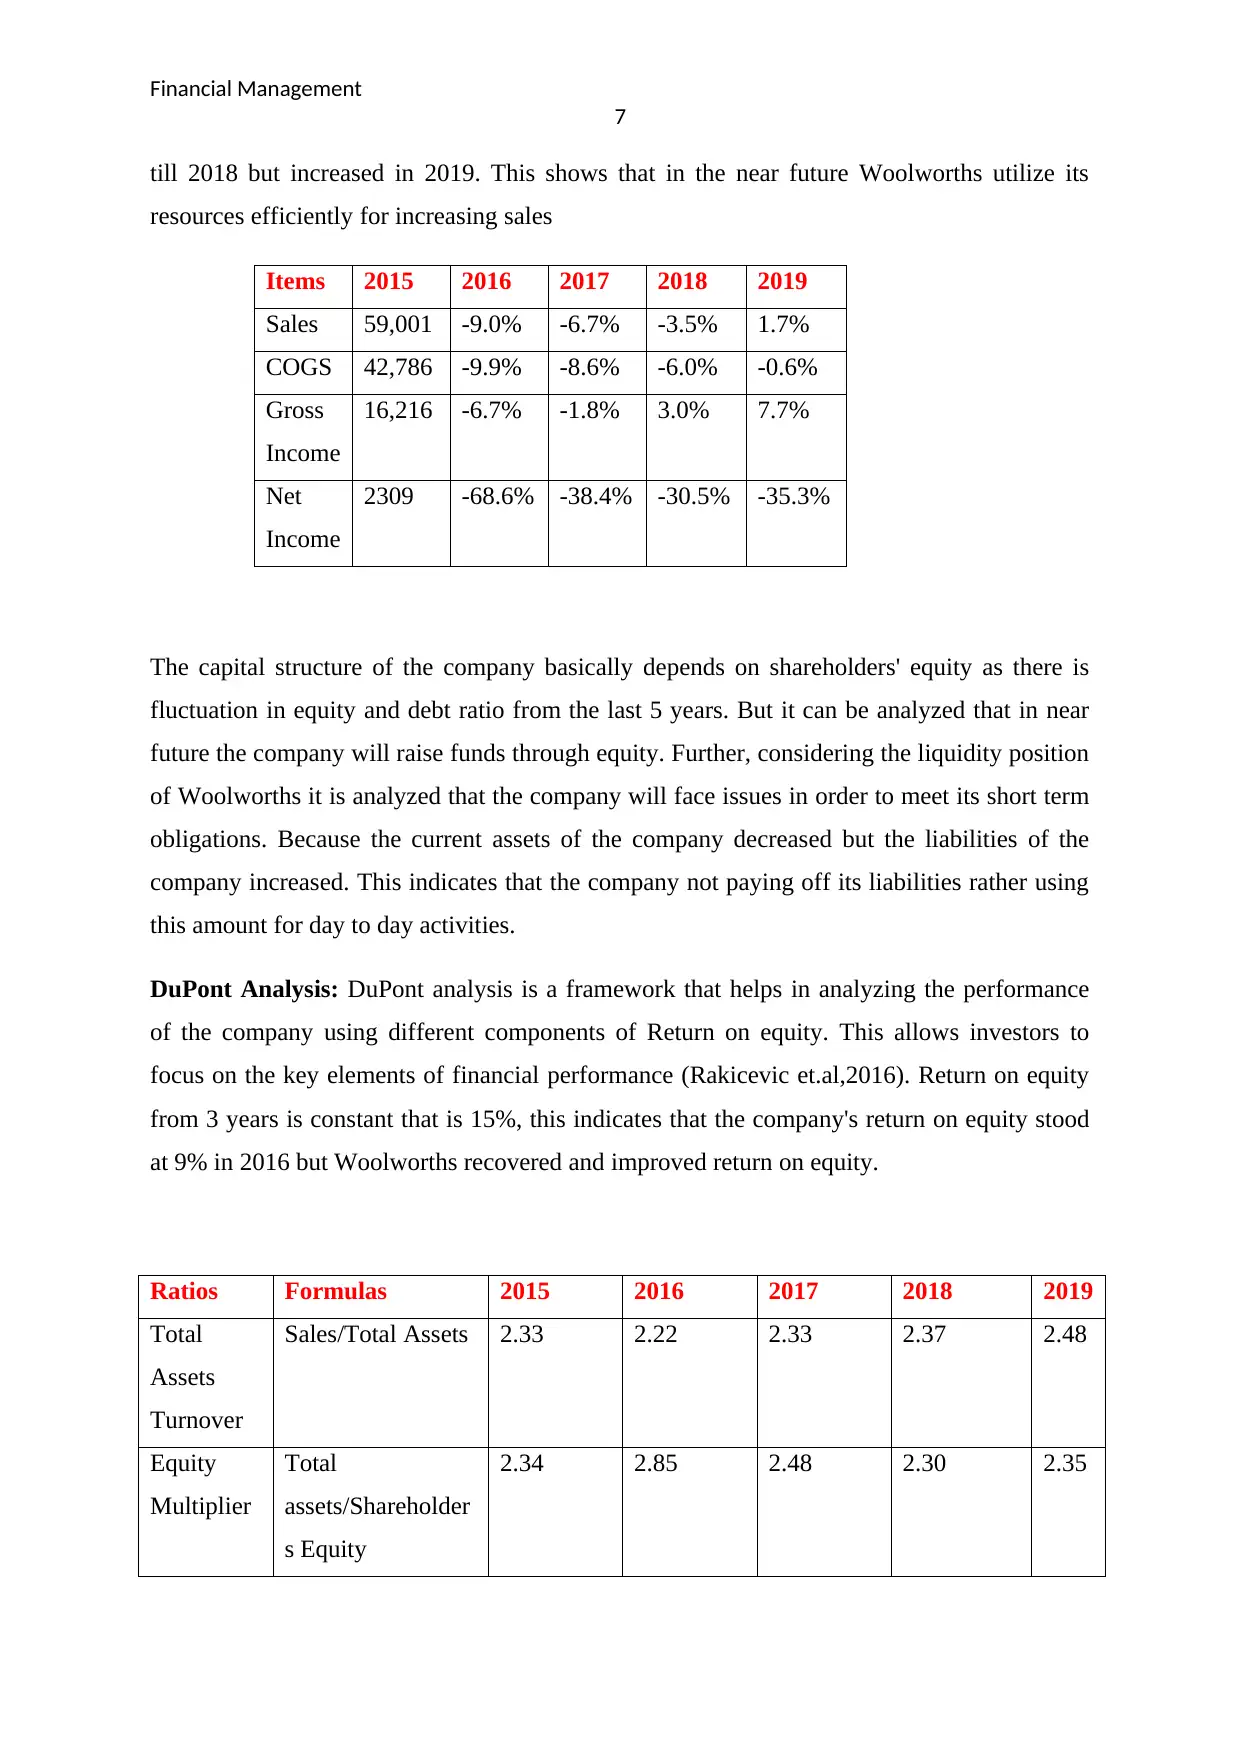
till 2018 but increased in 2019. This shows that in the near future Woolworths utilize its
resources efficiently for increasing sales
Items 2015 2016 2017 2018 2019
Sales 59,001 -9.0% -6.7% -3.5% 1.7%
COGS 42,786 -9.9% -8.6% -6.0% -0.6%
Gross
Income
16,216 -6.7% -1.8% 3.0% 7.7%
Net
Income
2309 -68.6% -38.4% -30.5% -35.3%
The capital structure of the company basically depends on shareholders' equity as there is
fluctuation in equity and debt ratio from the last 5 years. But it can be analyzed that in near
future the company will raise funds through equity. Further, considering the liquidity position
of Woolworths it is analyzed that the company will face issues in order to meet its short term
obligations. Because the current assets of the company decreased but the liabilities of the
company increased. This indicates that the company not paying off its liabilities rather using
this amount for day to day activities.
DuPont Analysis: DuPont analysis is a framework that helps in analyzing the performance
of the company using different components of Return on equity. This allows investors to
focus on the key elements of financial performance (Rakicevic et.al,2016). Return on equity
from 3 years is constant that is 15%, this indicates that the company's return on equity stood
at 9% in 2016 but Woolworths recovered and improved return on equity.
Ratios Formulas 2015 2016 2017 2018 2019
Total
Assets
Turnover
Sales/Total Assets 2.33 2.22 2.33 2.37 2.48
Equity
Multiplier
Total
assets/Shareholder
s Equity
2.34 2.85 2.48 2.30 2.35
7
till 2018 but increased in 2019. This shows that in the near future Woolworths utilize its
resources efficiently for increasing sales
Items 2015 2016 2017 2018 2019
Sales 59,001 -9.0% -6.7% -3.5% 1.7%
COGS 42,786 -9.9% -8.6% -6.0% -0.6%
Gross
Income
16,216 -6.7% -1.8% 3.0% 7.7%
Net
Income
2309 -68.6% -38.4% -30.5% -35.3%
The capital structure of the company basically depends on shareholders' equity as there is
fluctuation in equity and debt ratio from the last 5 years. But it can be analyzed that in near
future the company will raise funds through equity. Further, considering the liquidity position
of Woolworths it is analyzed that the company will face issues in order to meet its short term
obligations. Because the current assets of the company decreased but the liabilities of the
company increased. This indicates that the company not paying off its liabilities rather using
this amount for day to day activities.
DuPont Analysis: DuPont analysis is a framework that helps in analyzing the performance
of the company using different components of Return on equity. This allows investors to
focus on the key elements of financial performance (Rakicevic et.al,2016). Return on equity
from 3 years is constant that is 15%, this indicates that the company's return on equity stood
at 9% in 2016 but Woolworths recovered and improved return on equity.
Ratios Formulas 2015 2016 2017 2018 2019
Total
Assets
Turnover
Sales/Total Assets 2.33 2.22 2.33 2.37 2.48
Equity
Multiplier
Total
assets/Shareholder
s Equity
2.34 2.85 2.48 2.30 2.35
Financial Management
8
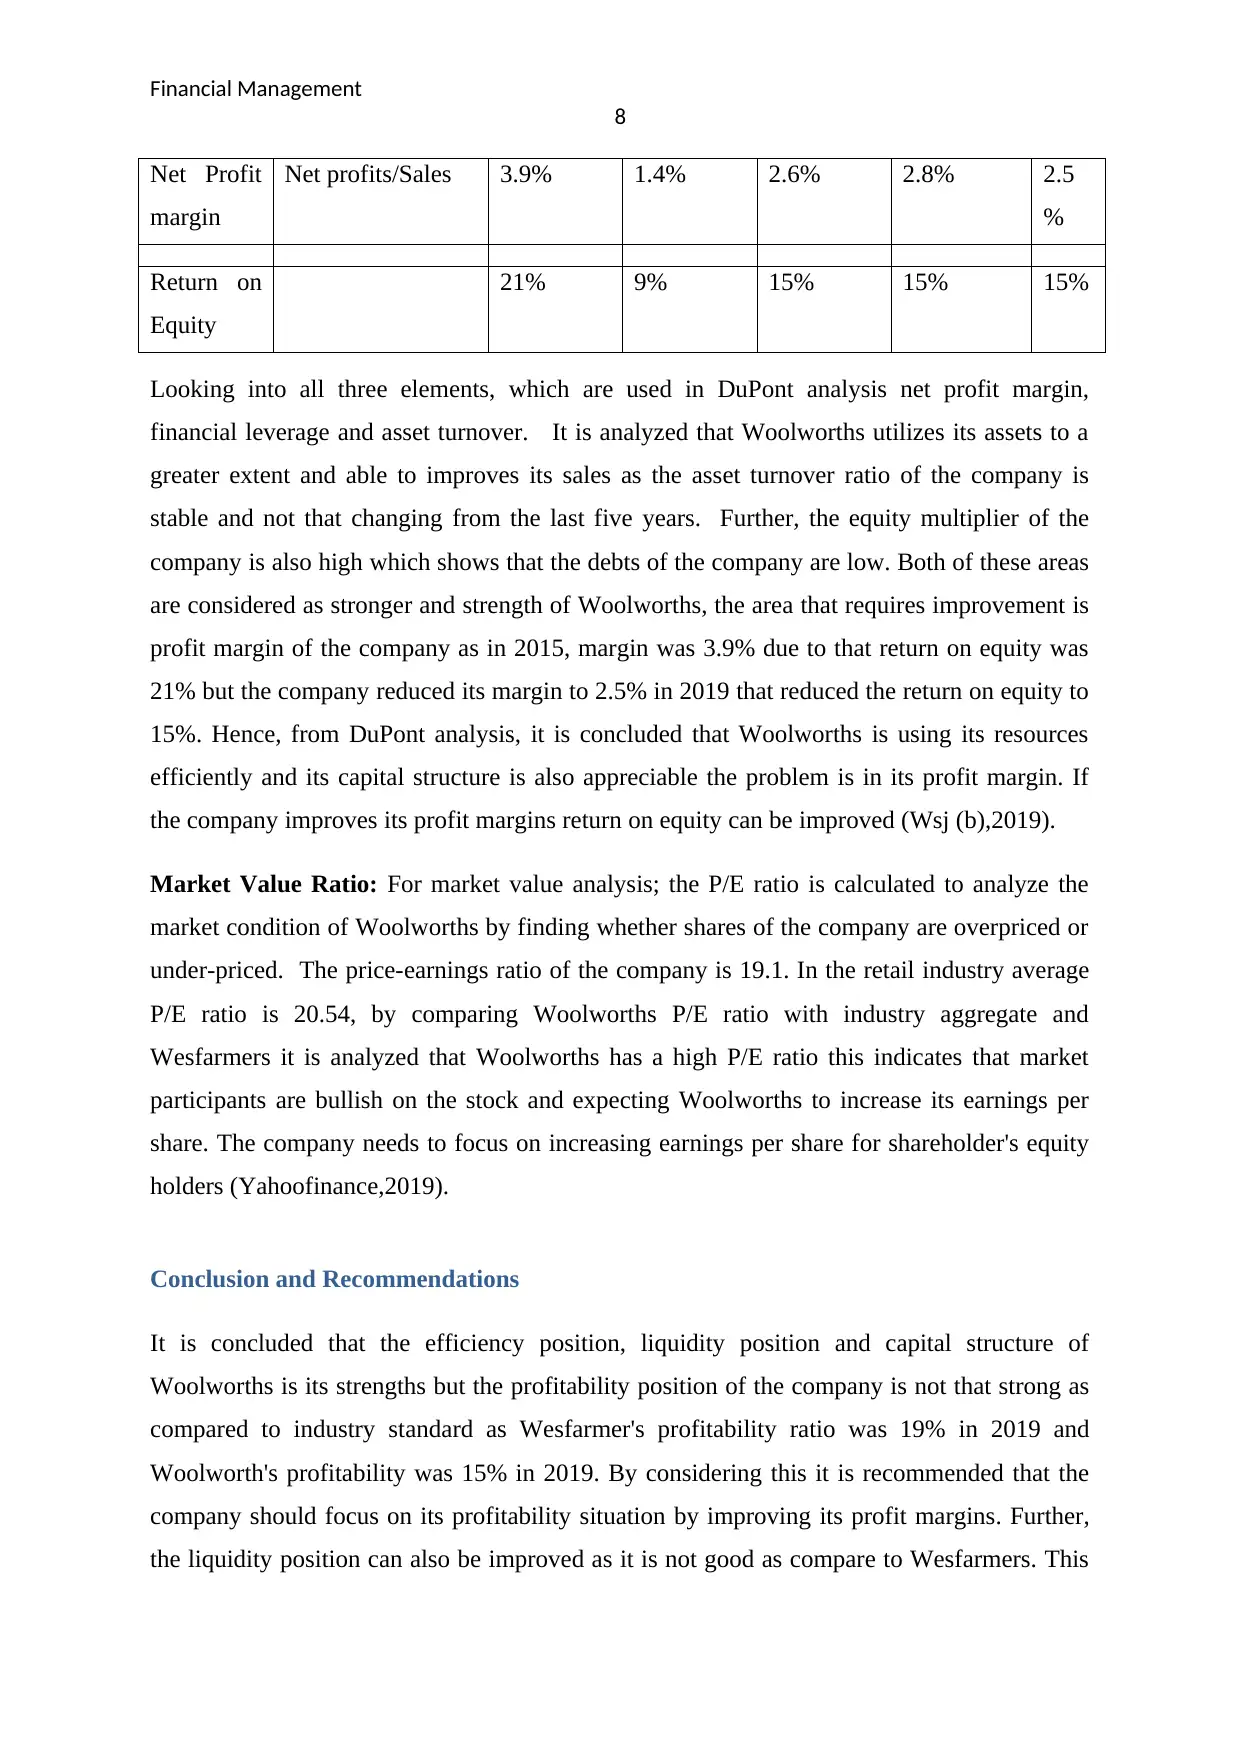
Net Profit
margin
Net profits/Sales 3.9% 1.4% 2.6% 2.8% 2.5
%
Return on
Equity
21% 9% 15% 15% 15%
Looking into all three elements, which are used in DuPont analysis net profit margin,
financial leverage and asset turnover. It is analyzed that Woolworths utilizes its assets to a
greater extent and able to improves its sales as the asset turnover ratio of the company is
stable and not that changing from the last five years. Further, the equity multiplier of the
company is also high which shows that the debts of the company are low. Both of these areas
are considered as stronger and strength of Woolworths, the area that requires improvement is
profit margin of the company as in 2015, margin was 3.9% due to that return on equity was
21% but the company reduced its margin to 2.5% in 2019 that reduced the return on equity to
15%. Hence, from DuPont analysis, it is concluded that Woolworths is using its resources
efficiently and its capital structure is also appreciable the problem is in its profit margin. If
the company improves its profit margins return on equity can be improved (Wsj (b),2019).
Market Value Ratio: For market value analysis; the P/E ratio is calculated to analyze the
market condition of Woolworths by finding whether shares of the company are overpriced or
under-priced. The price-earnings ratio of the company is 19.1. In the retail industry average
P/E ratio is 20.54, by comparing Woolworths P/E ratio with industry aggregate and
Wesfarmers it is analyzed that Woolworths has a high P/E ratio this indicates that market
participants are bullish on the stock and expecting Woolworths to increase its earnings per
share. The company needs to focus on increasing earnings per share for shareholder's equity
holders (Yahoofinance,2019).
Conclusion and Recommendations
It is concluded that the efficiency position, liquidity position and capital structure of
Woolworths is its strengths but the profitability position of the company is not that strong as
compared to industry standard as Wesfarmer's profitability ratio was 19% in 2019 and
Woolworth's profitability was 15% in 2019. By considering this it is recommended that the
company should focus on its profitability situation by improving its profit margins. Further,
the liquidity position can also be improved as it is not good as compare to Wesfarmers. This
8
Net Profit
margin
Net profits/Sales 3.9% 1.4% 2.6% 2.8% 2.5
%
Return on
Equity
21% 9% 15% 15% 15%
Looking into all three elements, which are used in DuPont analysis net profit margin,
financial leverage and asset turnover. It is analyzed that Woolworths utilizes its assets to a
greater extent and able to improves its sales as the asset turnover ratio of the company is
stable and not that changing from the last five years. Further, the equity multiplier of the
company is also high which shows that the debts of the company are low. Both of these areas
are considered as stronger and strength of Woolworths, the area that requires improvement is
profit margin of the company as in 2015, margin was 3.9% due to that return on equity was
21% but the company reduced its margin to 2.5% in 2019 that reduced the return on equity to
15%. Hence, from DuPont analysis, it is concluded that Woolworths is using its resources
efficiently and its capital structure is also appreciable the problem is in its profit margin. If
the company improves its profit margins return on equity can be improved (Wsj (b),2019).
Market Value Ratio: For market value analysis; the P/E ratio is calculated to analyze the
market condition of Woolworths by finding whether shares of the company are overpriced or
under-priced. The price-earnings ratio of the company is 19.1. In the retail industry average
P/E ratio is 20.54, by comparing Woolworths P/E ratio with industry aggregate and
Wesfarmers it is analyzed that Woolworths has a high P/E ratio this indicates that market
participants are bullish on the stock and expecting Woolworths to increase its earnings per
share. The company needs to focus on increasing earnings per share for shareholder's equity
holders (Yahoofinance,2019).
Conclusion and Recommendations
It is concluded that the efficiency position, liquidity position and capital structure of
Woolworths is its strengths but the profitability position of the company is not that strong as
compared to industry standard as Wesfarmer's profitability ratio was 19% in 2019 and
Woolworth's profitability was 15% in 2019. By considering this it is recommended that the
company should focus on its profitability situation by improving its profit margins. Further,
the liquidity position can also be improved as it is not good as compare to Wesfarmers. This
⊘ This is a preview!⊘
Do you want full access?
Subscribe today to unlock all pages.
Trusted by 1+ million students worldwide
Financial Management
9
can be done by increasing its current assets and by paying short term obligations. At last,
from trend analysis, it is analyzed that Woolworth's condition will improve in near future and
from DuPont analysis, it is analyzed that the company needs to increase its profit margins that
will resultant in stable market condition, high earnings per share and improve profitability
position of the company.
Paraphrase This Document
Need a fresh take? Get an instant paraphrase of this document with our AI Paraphraser
Financial Management
10
References
Rakićević, A., Milošević, P., Petrović, B. and Radojević, D.G., 2016. DuPont financial ratio
analysis using logical aggregation. In Soft computing applications (pp. 727-739). Springer,
Cham.
Trotman, K. and Carson, E., 2018. Financial accounting: an integrated approach. Cengage
AU.
Woolworths, 2020. About us. Accessed From: https://www.woolworths.com.au/
Wsj(a), 2019. Financial statement of Wesfarmers. Accessed From:
https://www.wsj.com/market-data/quotes/AU/XASX/WES/financials/annual/income-
statement
Wsj(b),2019. Financial statement of Woolworths. Accessed From:
https://www.wsj.com/market-data/quotes/AU/XASX/WOW/financials/annual/income-
statement
Yahoofinance,2019. Financial analysis. Accessed From:
https://au.finance.yahoo.com/quote/WOW.AX/financials?p=WOW.AX
1 out of 11
Related Documents


Your All-in-One AI-Powered Toolkit for Academic Success.
+13062052269
info@desklib.com
Available 24*7 on WhatsApp / Email
![[object Object]](/_next/static/media/star-bottom.7253800d.svg)
Unlock your academic potential
Copyright © 2020–2026 A2Z Services. All Rights Reserved. Developed and managed by ZUCOL.