Financial Analysis of Woolworths: Performance and Ratios
VerifiedAdded on 2022/08/26
|13
|2088
|35
Report
AI Summary
This report presents a comprehensive financial analysis of Woolworths, a major Australian firm, over a five-year period. The analysis employs ratio analysis to assess the company's capital structure, efficiency, profitability, and liquidity. Key financial ratios such as debt ratio, asset turnover ratio, return on equity (ROE), and current ratio are calculated and compared to industry standards. The report also includes a DuPont analysis to dissect the factors influencing ROE. Furthermore, the relationship between capital structure and profitability is examined, along with an analysis of the price-to-earnings ratio. The findings reveal trends in Woolworths' financial performance, highlighting areas of strength and weakness, and offering insights into the company's financial health and strategic decisions. The analysis concludes with recommendations for the firm's financial management.
Running head: FINANCIAL MANAGEMENT
Financial Management
Name of the Student:
Name of the University:
Author’s Note:
Financial Management
Name of the Student:
Name of the University:
Author’s Note:
Paraphrase This Document
Need a fresh take? Get an instant paraphrase of this document with our AI Paraphraser
1FINANCIAL MANAGEMENT
Executive Summary
The assignment aims at analyzing the Woolworths Firm for a trend period of five years whereby
important aspects of the firm has been taken into consideration. Factors like profitability, capital
structure, liquidity and efficiency were some of the key points that have been analyzed for the
firm. The analysis reflecting the ROE of the firm has been done with the help of the Du Pont
Analysis over a five year trend period. In all of the financial ratio’s that have been analyzed the
answers that have been derived for the firm was well compared with the industry average ratio’s
for getting an comparison of the firm performance with the industry levels.
2FINANCIAL MANAGEMENT
Table of Contents
Introduction......................................................................................................................................3
Discussion and Analysis..................................................................................................................3
Ratio Analysis..............................................................................................................................3
Capital Structure Ratio............................................................................................................3
Efficiency Ratio.......................................................................................................................4
Profitability Ratio....................................................................................................................4
Liquidity Ratio.........................................................................................................................5
Du Pont Analysis.........................................................................................................................6
Capital Structure and Profitability Relationship..........................................................................7
Price to Earning’s Ratio...............................................................................................................7
Conclusion.......................................................................................................................................8
References........................................................................................................................................9
Appendix........................................................................................................................................11
1) Ratio Analysis.......................................................................................................................11
⊘ This is a preview!⊘
Do you want full access?
Subscribe today to unlock all pages.
Trusted by 1+ million students worldwide
3FINANCIAL MANAGEMENT
Introduction
The financial analysis of the firm has been done for the Woolworths Firm that is a major
Australian firm with an extensive operations spread in Australia and New Zealand. The firm
analyzed is regarded as the second largest organization when viewed in terms of revenue
reported. The firm is listed in the Australian Stock Exchange with its ticker symbol as WOW.
The current share price of the firm is around A$41.32. The financial analysis of the firm has been
done using ratio analysis a quantitative assessment tool in which we would be considering data
for the firm for a sum of five years (Haskins 2017). Liquidity, Profitability, Efficiency and
Capital Structure of the firm were some of the key aspects that were analyzed. Other aspects like
Du Pont Analysis and Price to Earnings were some of the crucial aspects that were in particular
taken into consideration in order to get the quantitative analysis with respect to firm.
Discussion and Analysis
Ratio Analysis
Capital Structure Ratio
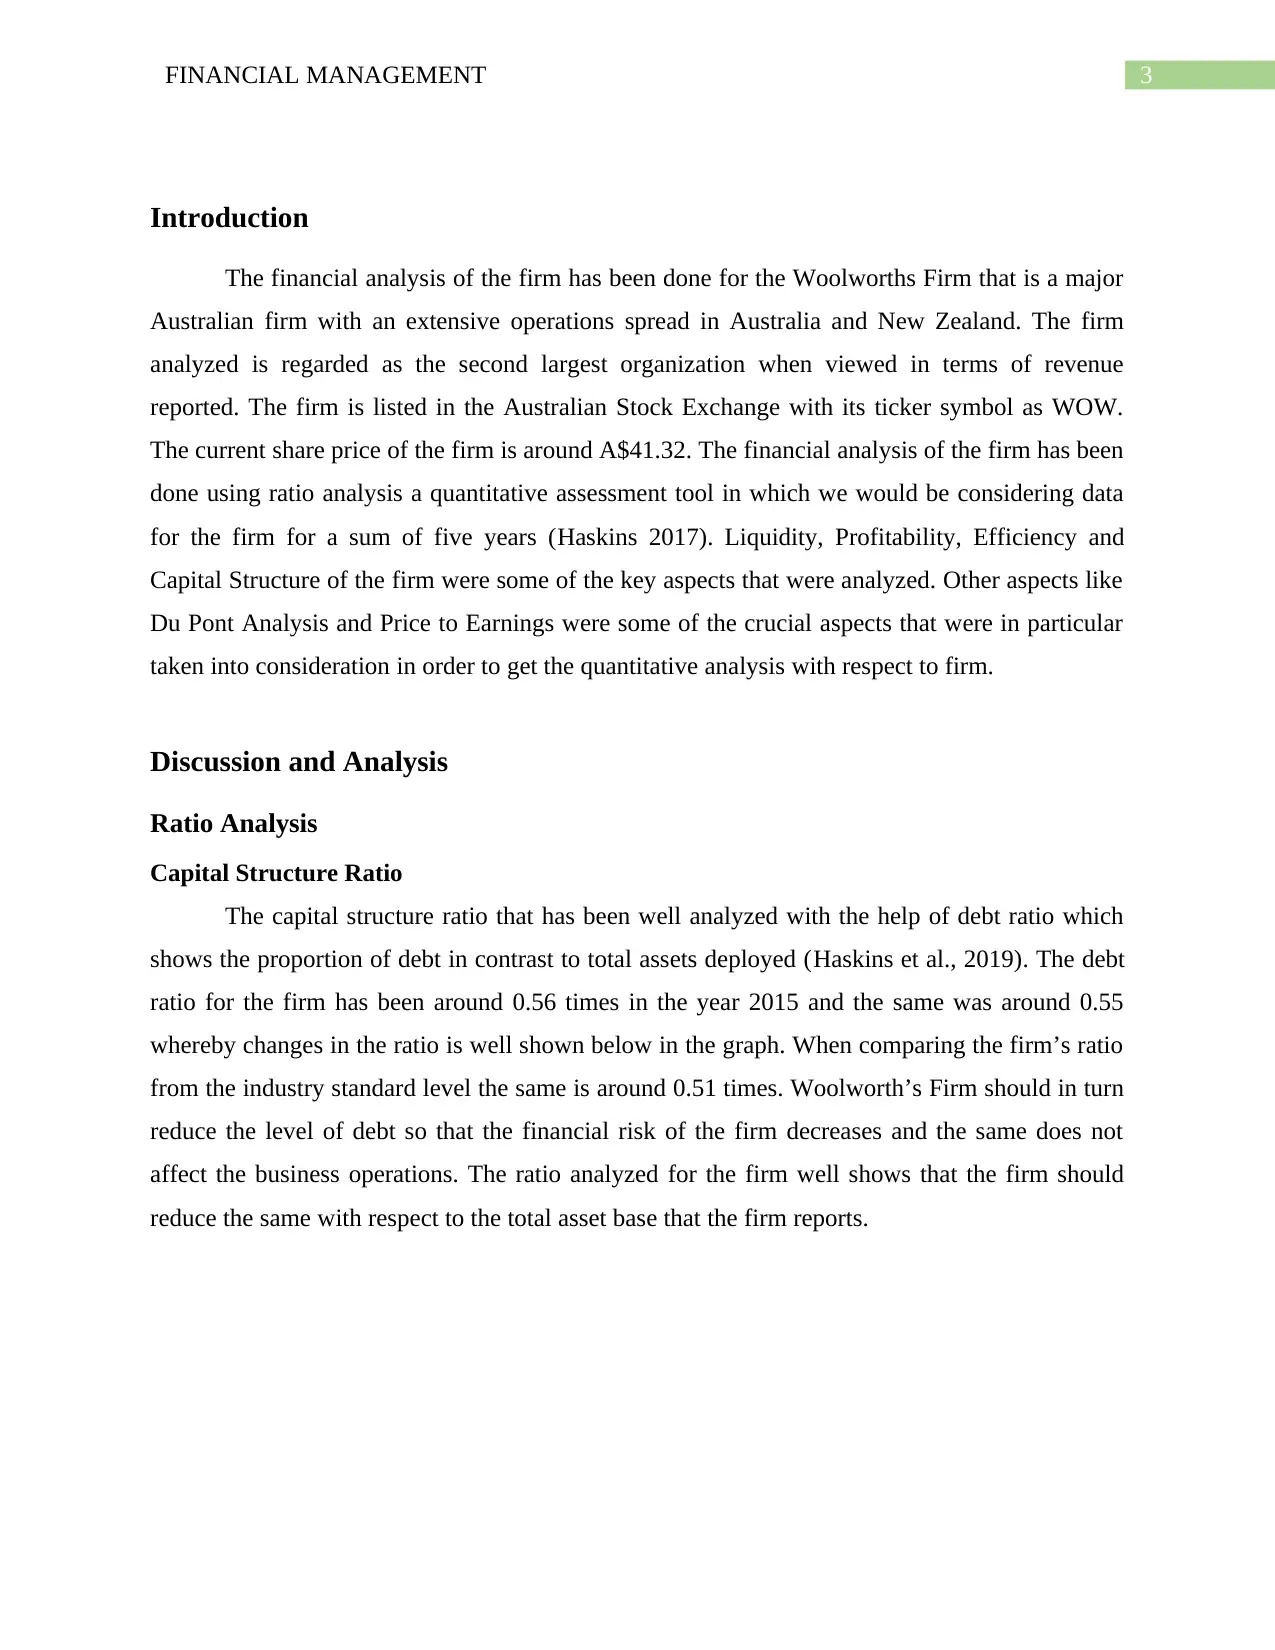
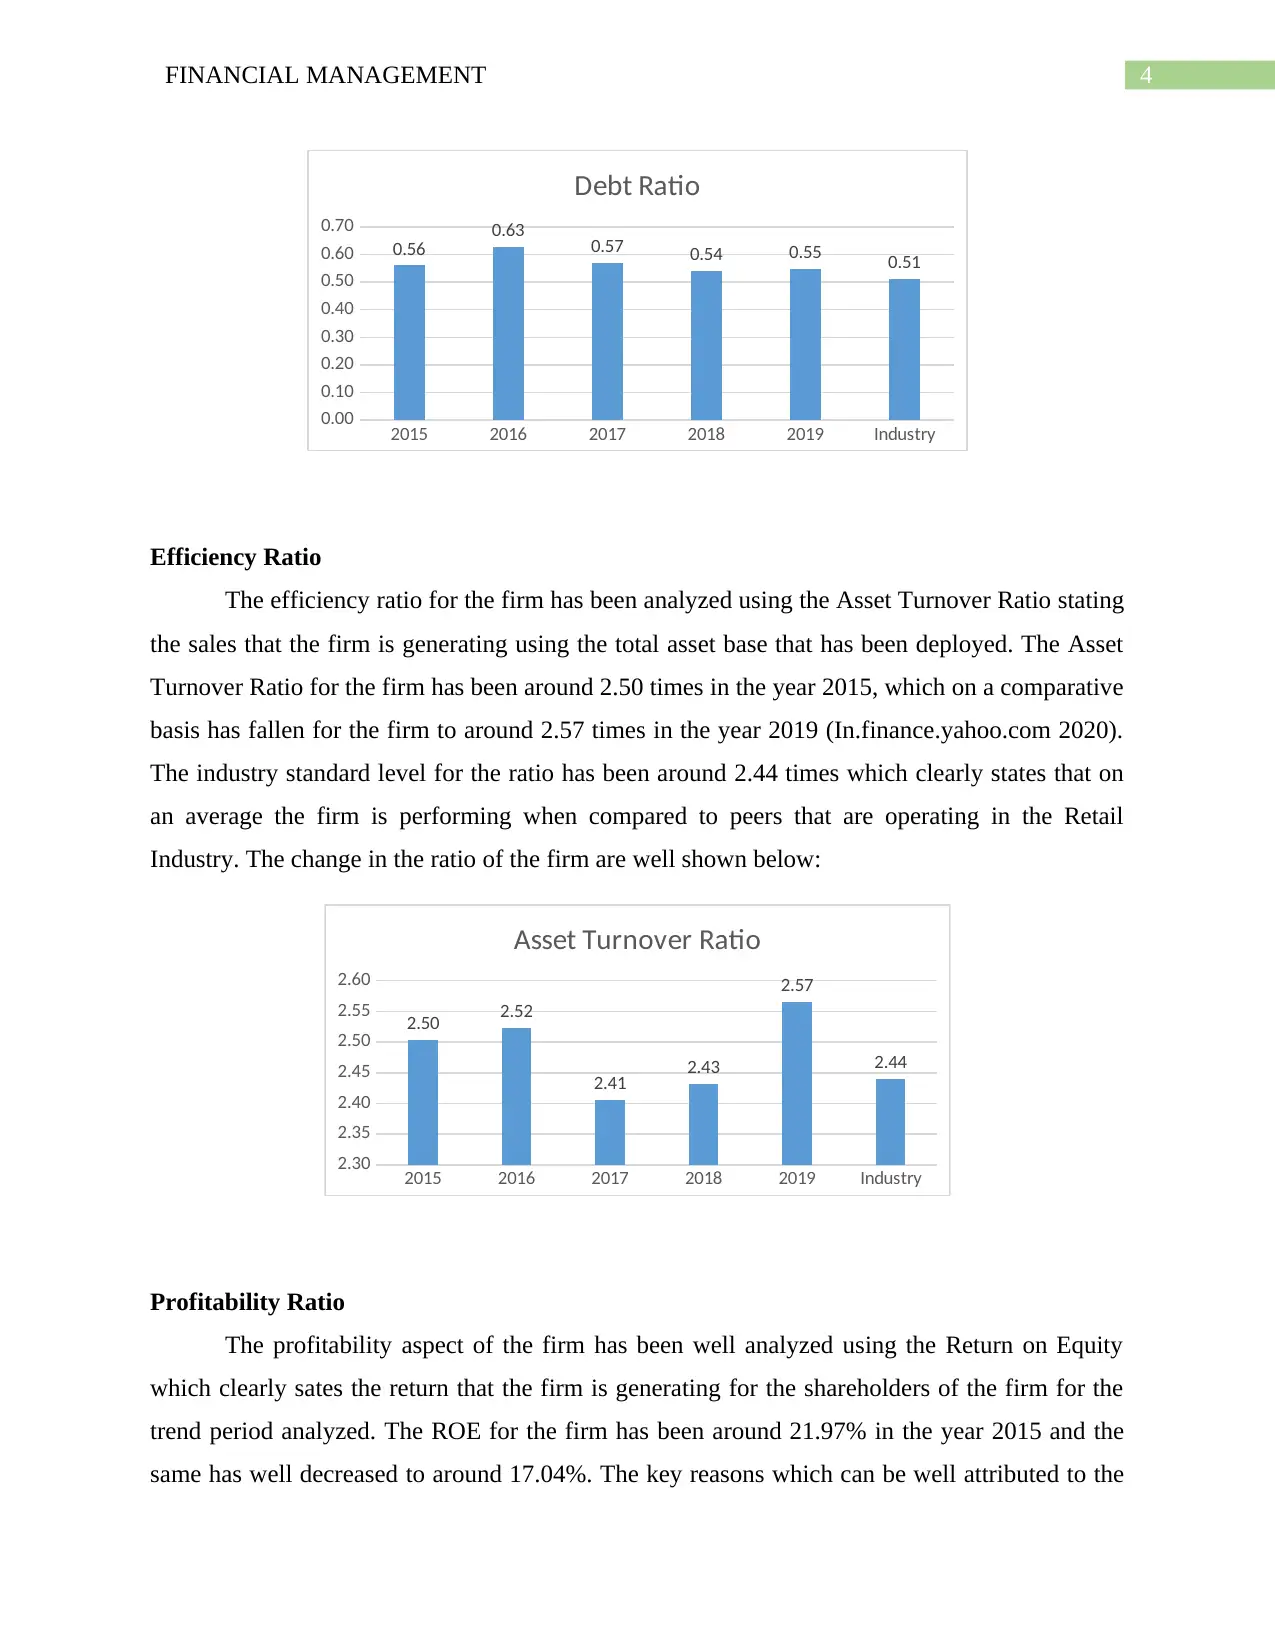
The capital structure ratio that has been well analyzed with the help of debt ratio which
shows the proportion of debt in contrast to total assets deployed (Haskins et al., 2019). The debt
ratio for the firm has been around 0.56 times in the year 2015 and the same was around 0.55
whereby changes in the ratio is well shown below in the graph. When comparing the firm’s ratio
from the industry standard level the same is around 0.51 times. Woolworth’s Firm should in turn
reduce the level of debt so that the financial risk of the firm decreases and the same does not
affect the business operations. The ratio analyzed for the firm well shows that the firm should
reduce the same with respect to the total asset base that the firm reports.
Introduction
The financial analysis of the firm has been done for the Woolworths Firm that is a major
Australian firm with an extensive operations spread in Australia and New Zealand. The firm
analyzed is regarded as the second largest organization when viewed in terms of revenue
reported. The firm is listed in the Australian Stock Exchange with its ticker symbol as WOW.
The current share price of the firm is around A$41.32. The financial analysis of the firm has been
done using ratio analysis a quantitative assessment tool in which we would be considering data
for the firm for a sum of five years (Haskins 2017). Liquidity, Profitability, Efficiency and
Capital Structure of the firm were some of the key aspects that were analyzed. Other aspects like
Du Pont Analysis and Price to Earnings were some of the crucial aspects that were in particular
taken into consideration in order to get the quantitative analysis with respect to firm.
Discussion and Analysis
Ratio Analysis
Capital Structure Ratio
The capital structure ratio that has been well analyzed with the help of debt ratio which
shows the proportion of debt in contrast to total assets deployed (Haskins et al., 2019). The debt
ratio for the firm has been around 0.56 times in the year 2015 and the same was around 0.55
whereby changes in the ratio is well shown below in the graph. When comparing the firm’s ratio
from the industry standard level the same is around 0.51 times. Woolworth’s Firm should in turn
reduce the level of debt so that the financial risk of the firm decreases and the same does not
affect the business operations. The ratio analyzed for the firm well shows that the firm should
reduce the same with respect to the total asset base that the firm reports.
Paraphrase This Document
Need a fresh take? Get an instant paraphrase of this document with our AI Paraphraser
4FINANCIAL MANAGEMENT
2015 2016 2017 2018 2019 Industry
0.00
0.10
0.20
0.30
0.40
0.50
0.60
0.70
0.56 0.63 0.57 0.54 0.55 0.51
Debt Ratio
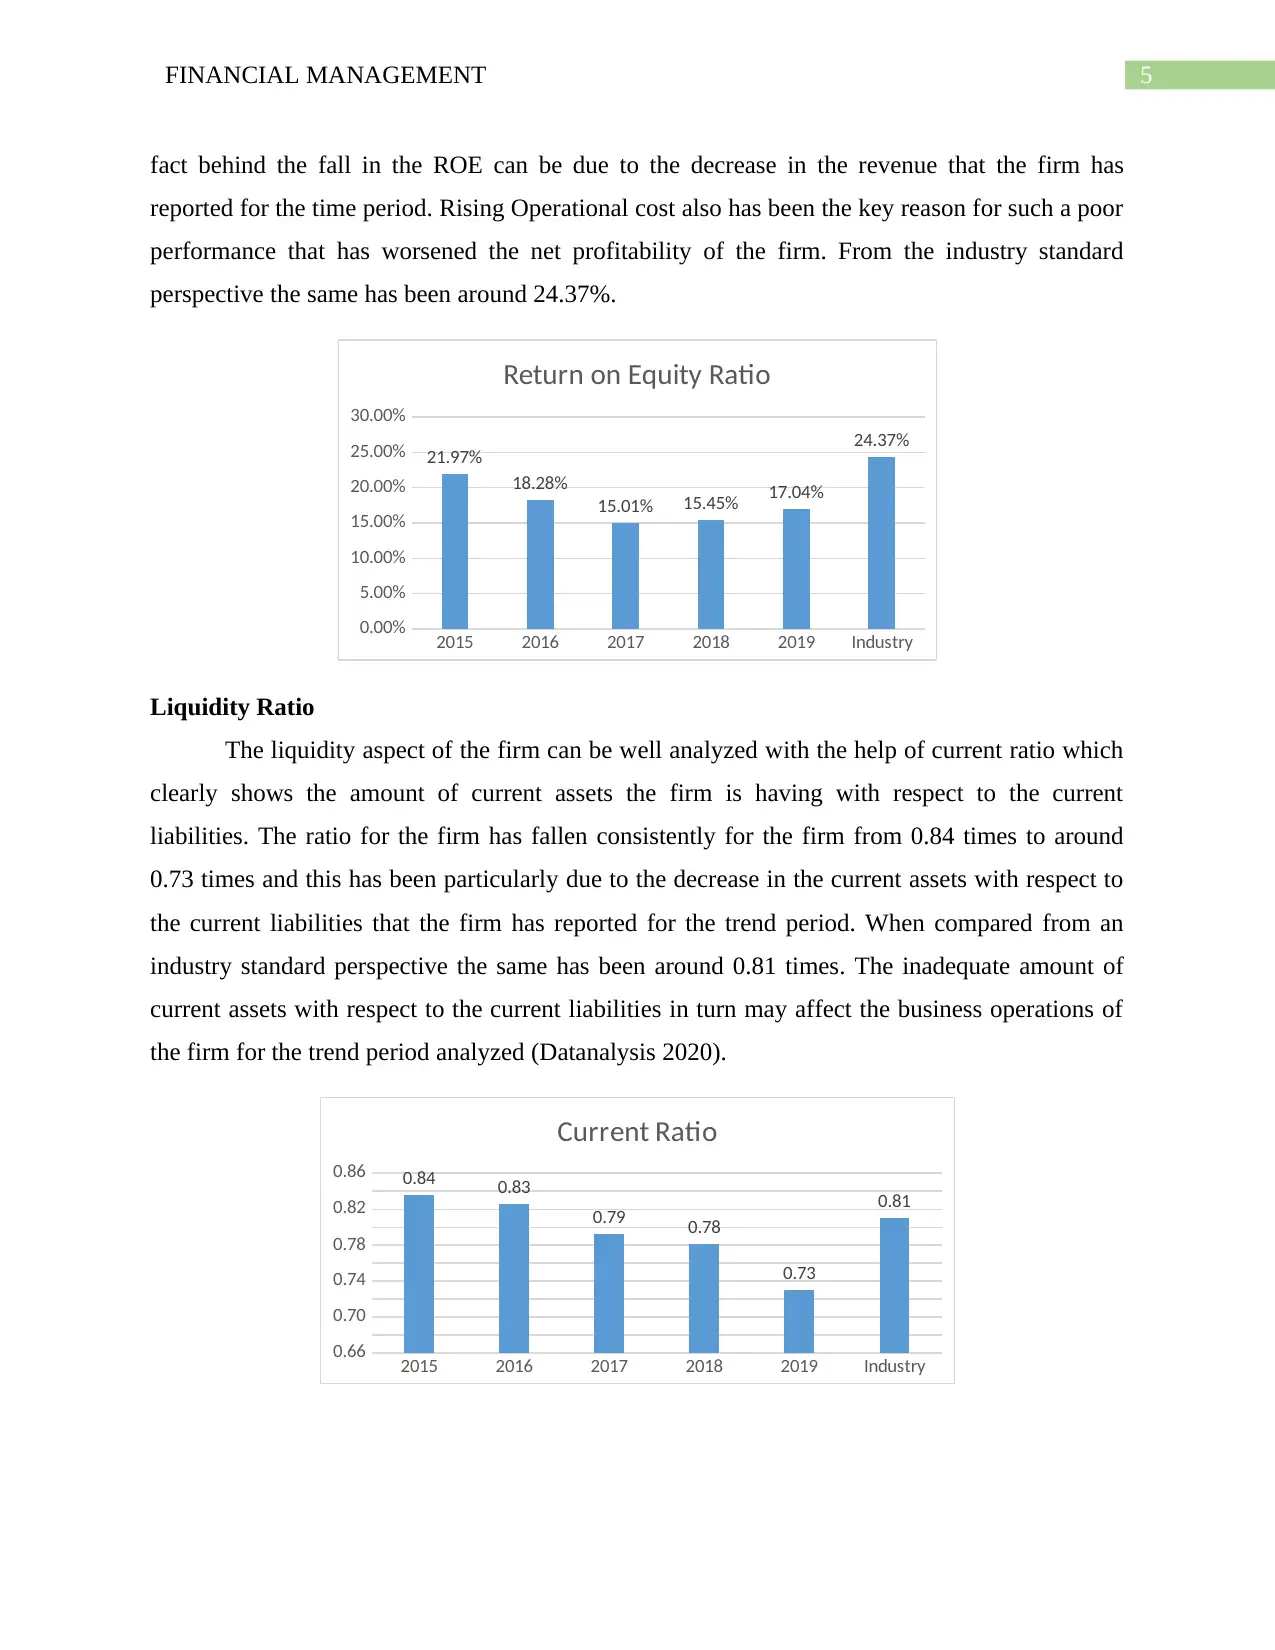
Efficiency Ratio
The efficiency ratio for the firm has been analyzed using the Asset Turnover Ratio stating
the sales that the firm is generating using the total asset base that has been deployed. The Asset
Turnover Ratio for the firm has been around 2.50 times in the year 2015, which on a comparative
basis has fallen for the firm to around 2.57 times in the year 2019 (In.finance.yahoo.com 2020).
The industry standard level for the ratio has been around 2.44 times which clearly states that on
an average the firm is performing when compared to peers that are operating in the Retail
Industry. The change in the ratio of the firm are well shown below:
2015 2016 2017 2018 2019 Industry
2.30
2.35
2.40
2.45
2.50
2.55
2.60
2.50 2.52
2.41 2.43
2.57
2.44
Asset Turnover Ratio
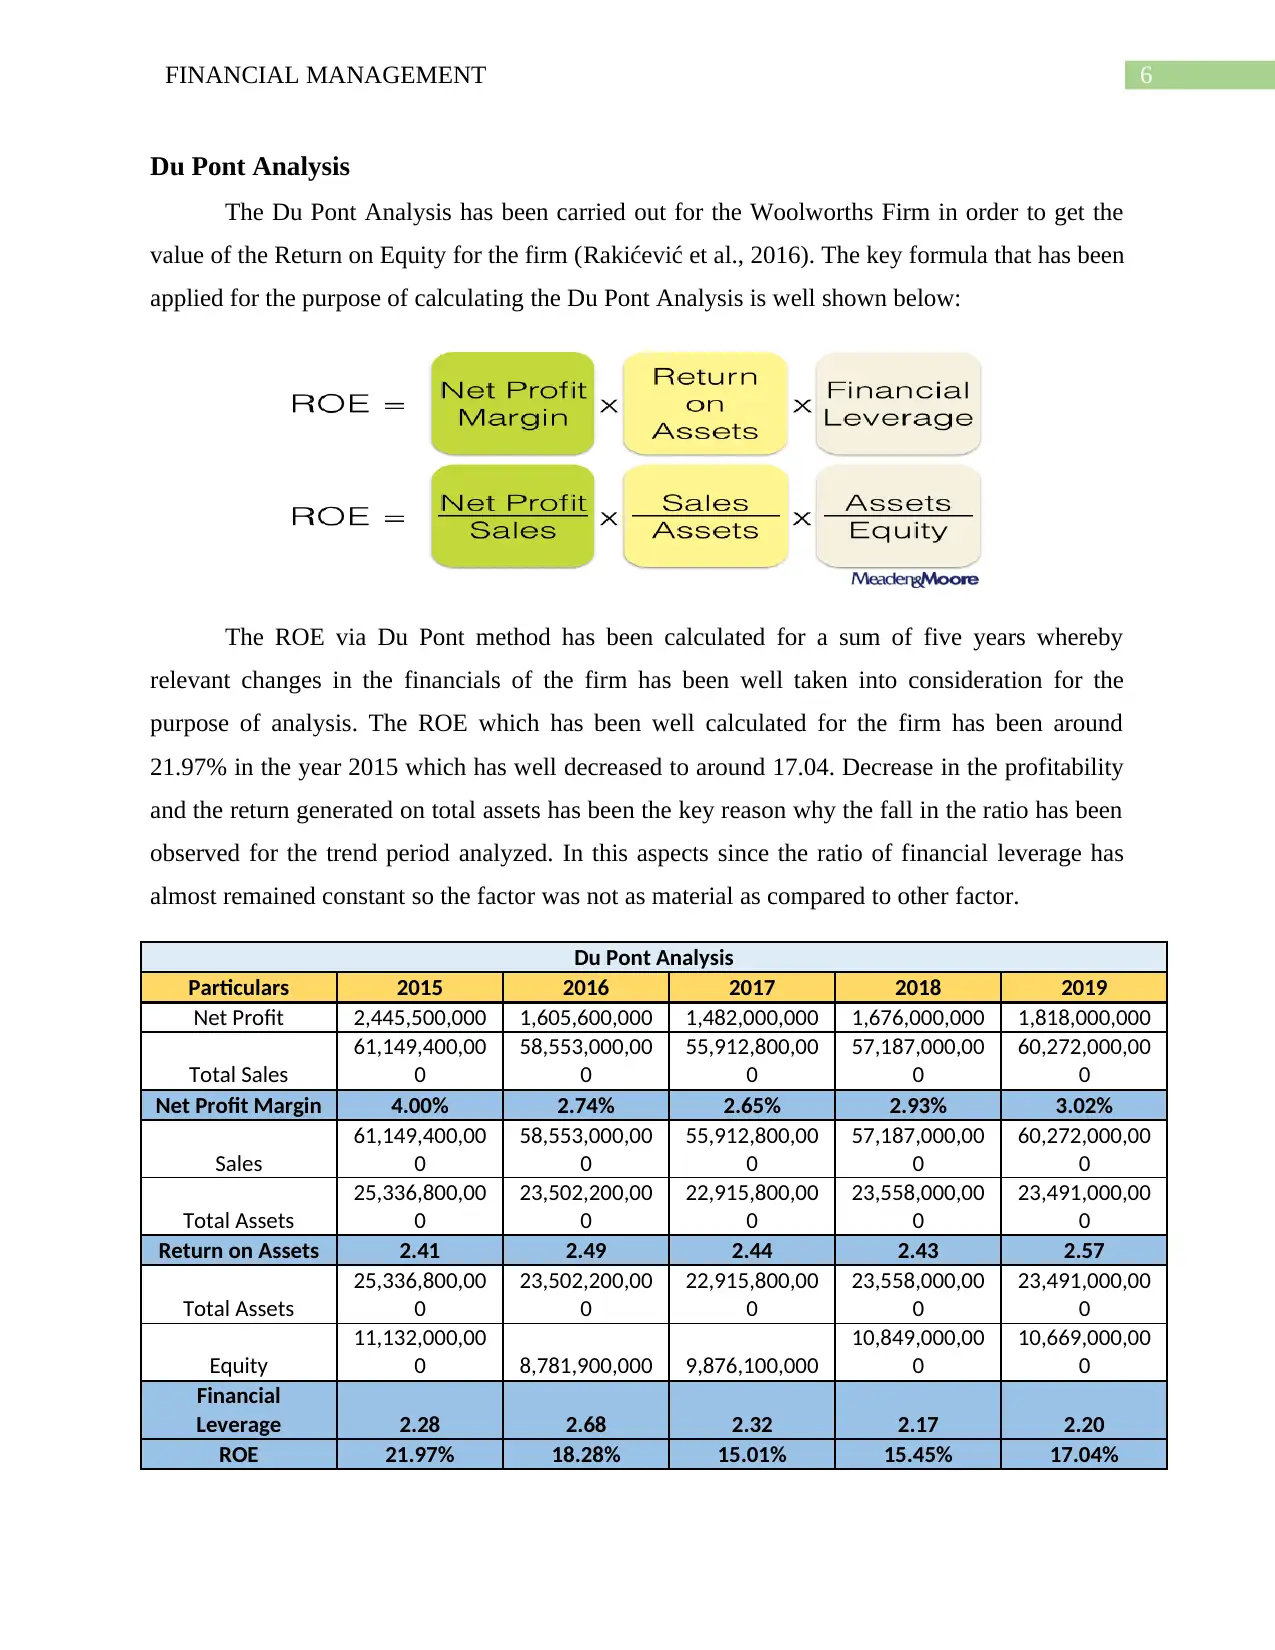
Profitability Ratio
The profitability aspect of the firm has been well analyzed using the Return on Equity
which clearly sates the return that the firm is generating for the shareholders of the firm for the
trend period analyzed. The ROE for the firm has been around 21.97% in the year 2015 and the
same has well decreased to around 17.04%. The key reasons which can be well attributed to the
2015 2016 2017 2018 2019 Industry
0.00
0.10
0.20
0.30
0.40
0.50
0.60
0.70
0.56 0.63 0.57 0.54 0.55 0.51
Debt Ratio
Efficiency Ratio
The efficiency ratio for the firm has been analyzed using the Asset Turnover Ratio stating
the sales that the firm is generating using the total asset base that has been deployed. The Asset
Turnover Ratio for the firm has been around 2.50 times in the year 2015, which on a comparative
basis has fallen for the firm to around 2.57 times in the year 2019 (In.finance.yahoo.com 2020).
The industry standard level for the ratio has been around 2.44 times which clearly states that on
an average the firm is performing when compared to peers that are operating in the Retail
Industry. The change in the ratio of the firm are well shown below:
2015 2016 2017 2018 2019 Industry
2.30
2.35
2.40
2.45
2.50
2.55
2.60
2.50 2.52
2.41 2.43
2.57
2.44
Asset Turnover Ratio
Profitability Ratio
The profitability aspect of the firm has been well analyzed using the Return on Equity
which clearly sates the return that the firm is generating for the shareholders of the firm for the
trend period analyzed. The ROE for the firm has been around 21.97% in the year 2015 and the
same has well decreased to around 17.04%. The key reasons which can be well attributed to the
5FINANCIAL MANAGEMENT
fact behind the fall in the ROE can be due to the decrease in the revenue that the firm has
reported for the time period. Rising Operational cost also has been the key reason for such a poor
performance that has worsened the net profitability of the firm. From the industry standard
perspective the same has been around 24.37%.
2015 2016 2017 2018 2019 Industry
0.00%
5.00%
10.00%
15.00%
20.00%
25.00%
30.00%
21.97%
18.28%
15.01% 15.45% 17.04%
24.37%
Return on Equity Ratio
Liquidity Ratio
The liquidity aspect of the firm can be well analyzed with the help of current ratio which
clearly shows the amount of current assets the firm is having with respect to the current
liabilities. The ratio for the firm has fallen consistently for the firm from 0.84 times to around
0.73 times and this has been particularly due to the decrease in the current assets with respect to
the current liabilities that the firm has reported for the trend period. When compared from an
industry standard perspective the same has been around 0.81 times. The inadequate amount of
current assets with respect to the current liabilities in turn may affect the business operations of
the firm for the trend period analyzed (Datanalysis 2020).
2015 2016 2017 2018 2019 Industry
0.66
0.70
0.74
0.78
0.82
0.86 0.84 0.83
0.79 0.78
0.73
0.81
Current Ratio
⊘ This is a preview!⊘
Do you want full access?
Subscribe today to unlock all pages.
Trusted by 1+ million students worldwide
6FINANCIAL MANAGEMENT
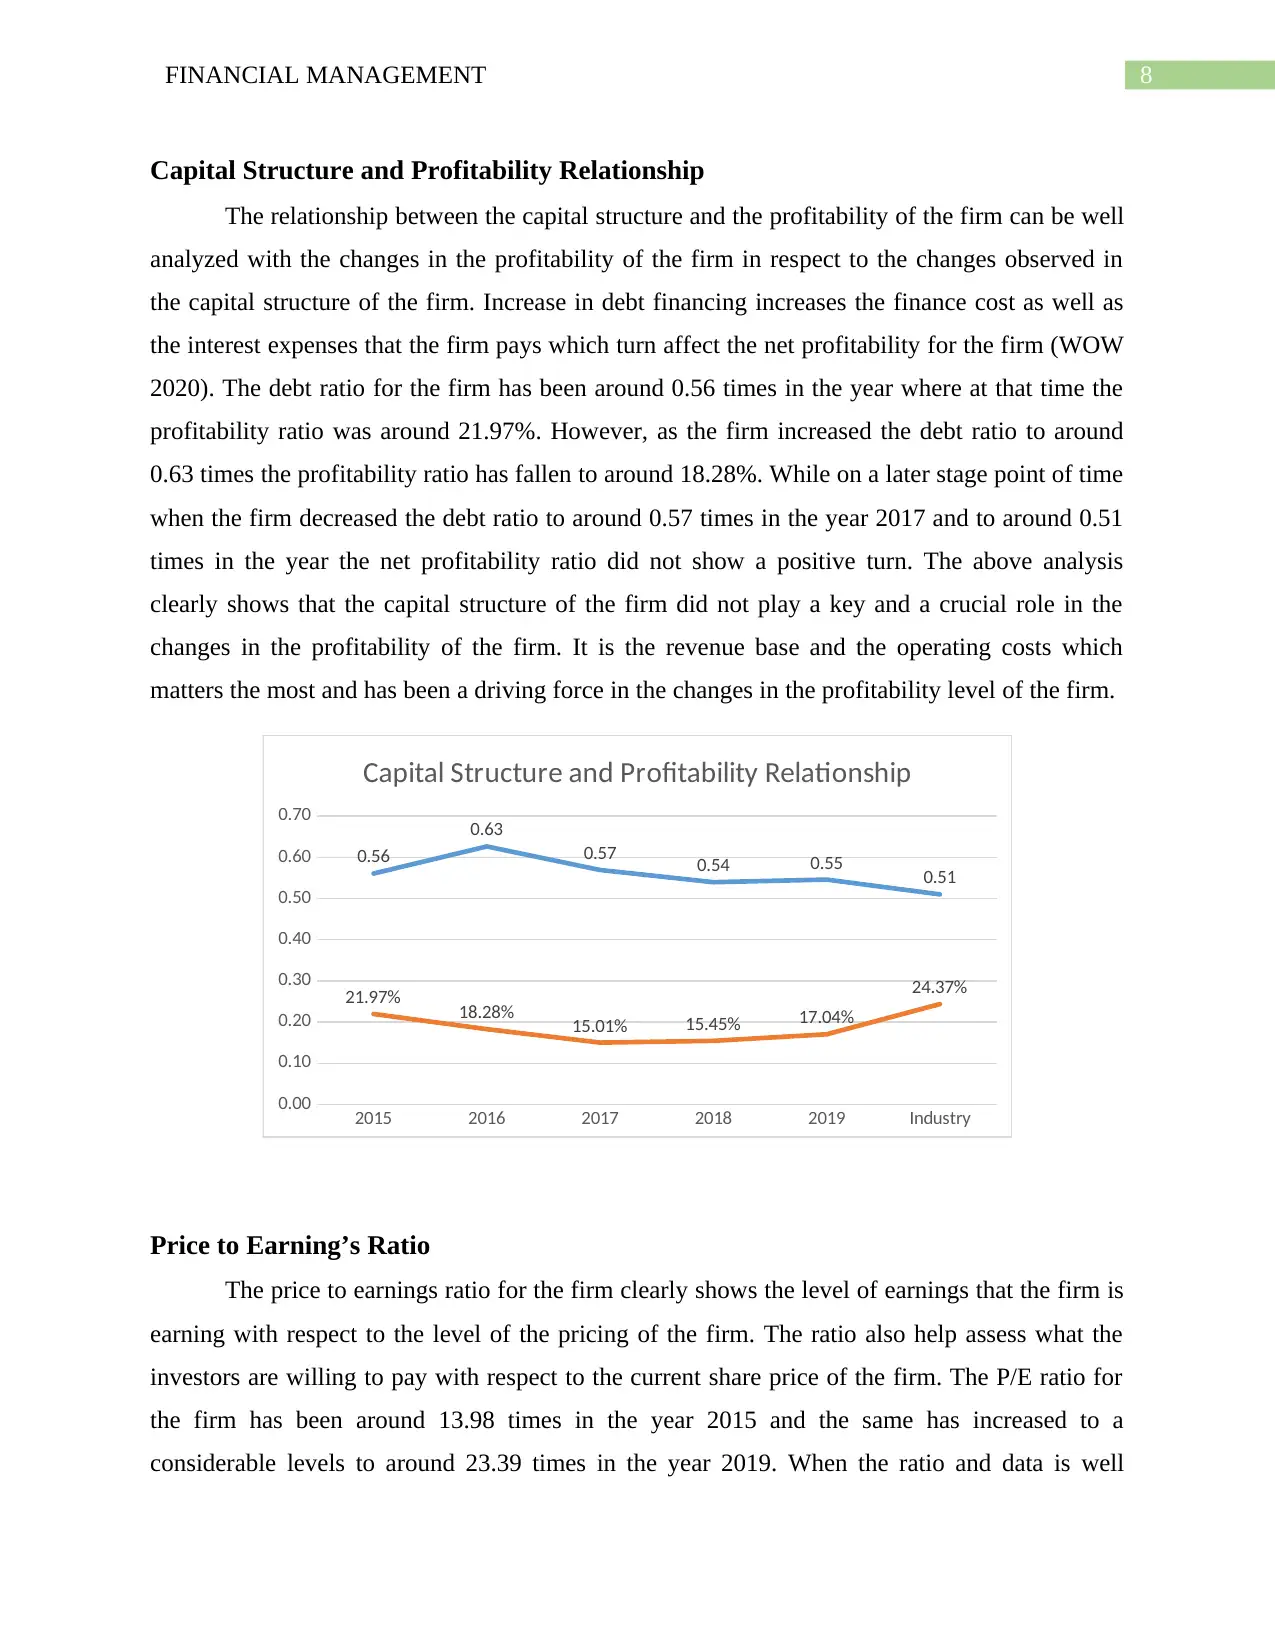
Du Pont Analysis
The Du Pont Analysis has been carried out for the Woolworths Firm in order to get the
value of the Return on Equity for the firm (Rakićević et al., 2016). The key formula that has been
applied for the purpose of calculating the Du Pont Analysis is well shown below:
The ROE via Du Pont method has been calculated for a sum of five years whereby
relevant changes in the financials of the firm has been well taken into consideration for the
purpose of analysis. The ROE which has been well calculated for the firm has been around
21.97% in the year 2015 which has well decreased to around 17.04. Decrease in the profitability
and the return generated on total assets has been the key reason why the fall in the ratio has been
observed for the trend period analyzed. In this aspects since the ratio of financial leverage has
almost remained constant so the factor was not as material as compared to other factor.
Du Pont Analysis
Particulars 2015 2016 2017 2018 2019
Net Profit 2,445,500,000 1,605,600,000 1,482,000,000 1,676,000,000 1,818,000,000
Total Sales
61,149,400,00
0
58,553,000,00
0
55,912,800,00
0
57,187,000,00
0
60,272,000,00
0
Net Profit Margin 4.00% 2.74% 2.65% 2.93% 3.02%
Sales
61,149,400,00
0
58,553,000,00
0
55,912,800,00
0
57,187,000,00
0
60,272,000,00
0
Total Assets
25,336,800,00
0
23,502,200,00
0
22,915,800,00
0
23,558,000,00
0
23,491,000,00
0
Return on Assets 2.41 2.49 2.44 2.43 2.57
Total Assets
25,336,800,00
0
23,502,200,00
0
22,915,800,00
0
23,558,000,00
0
23,491,000,00
0
Equity
11,132,000,00
0 8,781,900,000 9,876,100,000
10,849,000,00
0
10,669,000,00
0
Financial
Leverage 2.28 2.68 2.32 2.17 2.20
ROE 21.97% 18.28% 15.01% 15.45% 17.04%
Du Pont Analysis
The Du Pont Analysis has been carried out for the Woolworths Firm in order to get the
value of the Return on Equity for the firm (Rakićević et al., 2016). The key formula that has been
applied for the purpose of calculating the Du Pont Analysis is well shown below:
The ROE via Du Pont method has been calculated for a sum of five years whereby
relevant changes in the financials of the firm has been well taken into consideration for the
purpose of analysis. The ROE which has been well calculated for the firm has been around
21.97% in the year 2015 which has well decreased to around 17.04. Decrease in the profitability
and the return generated on total assets has been the key reason why the fall in the ratio has been
observed for the trend period analyzed. In this aspects since the ratio of financial leverage has
almost remained constant so the factor was not as material as compared to other factor.
Du Pont Analysis
Particulars 2015 2016 2017 2018 2019
Net Profit 2,445,500,000 1,605,600,000 1,482,000,000 1,676,000,000 1,818,000,000
Total Sales
61,149,400,00
0
58,553,000,00
0
55,912,800,00
0
57,187,000,00
0
60,272,000,00
0
Net Profit Margin 4.00% 2.74% 2.65% 2.93% 3.02%
Sales
61,149,400,00
0
58,553,000,00
0
55,912,800,00
0
57,187,000,00
0
60,272,000,00
0
Total Assets
25,336,800,00
0
23,502,200,00
0
22,915,800,00
0
23,558,000,00
0
23,491,000,00
0
Return on Assets 2.41 2.49 2.44 2.43 2.57
Total Assets
25,336,800,00
0
23,502,200,00
0
22,915,800,00
0
23,558,000,00
0
23,491,000,00
0
Equity
11,132,000,00
0 8,781,900,000 9,876,100,000
10,849,000,00
0
10,669,000,00
0
Financial
Leverage 2.28 2.68 2.32 2.17 2.20
ROE 21.97% 18.28% 15.01% 15.45% 17.04%
Paraphrase This Document
Need a fresh take? Get an instant paraphrase of this document with our AI Paraphraser

7FINANCIAL MANAGEMENT
8FINANCIAL MANAGEMENT
Capital Structure and Profitability Relationship
The relationship between the capital structure and the profitability of the firm can be well
analyzed with the changes in the profitability of the firm in respect to the changes observed in
the capital structure of the firm. Increase in debt financing increases the finance cost as well as
the interest expenses that the firm pays which turn affect the net profitability for the firm (WOW
2020). The debt ratio for the firm has been around 0.56 times in the year where at that time the
profitability ratio was around 21.97%. However, as the firm increased the debt ratio to around
0.63 times the profitability ratio has fallen to around 18.28%. While on a later stage point of time
when the firm decreased the debt ratio to around 0.57 times in the year 2017 and to around 0.51
times in the year the net profitability ratio did not show a positive turn. The above analysis
clearly shows that the capital structure of the firm did not play a key and a crucial role in the
changes in the profitability of the firm. It is the revenue base and the operating costs which
matters the most and has been a driving force in the changes in the profitability level of the firm.
2015 2016 2017 2018 2019 Industry
0.00
0.10
0.20
0.30
0.40
0.50
0.60
0.70
0.56
0.63
0.57 0.54 0.55 0.51
21.97% 18.28% 15.01% 15.45% 17.04%
24.37%
Capital Structure and Profitability Relationship
Price to Earning’s Ratio
The price to earnings ratio for the firm clearly shows the level of earnings that the firm is
earning with respect to the level of the pricing of the firm. The ratio also help assess what the
investors are willing to pay with respect to the current share price of the firm. The P/E ratio for
the firm has been around 13.98 times in the year 2015 and the same has increased to a
considerable levels to around 23.39 times in the year 2019. When the ratio and data is well
Capital Structure and Profitability Relationship
The relationship between the capital structure and the profitability of the firm can be well
analyzed with the changes in the profitability of the firm in respect to the changes observed in
the capital structure of the firm. Increase in debt financing increases the finance cost as well as
the interest expenses that the firm pays which turn affect the net profitability for the firm (WOW
2020). The debt ratio for the firm has been around 0.56 times in the year where at that time the
profitability ratio was around 21.97%. However, as the firm increased the debt ratio to around
0.63 times the profitability ratio has fallen to around 18.28%. While on a later stage point of time
when the firm decreased the debt ratio to around 0.57 times in the year 2017 and to around 0.51
times in the year the net profitability ratio did not show a positive turn. The above analysis
clearly shows that the capital structure of the firm did not play a key and a crucial role in the
changes in the profitability of the firm. It is the revenue base and the operating costs which
matters the most and has been a driving force in the changes in the profitability level of the firm.
2015 2016 2017 2018 2019 Industry
0.00
0.10
0.20
0.30
0.40
0.50
0.60
0.70
0.56
0.63
0.57 0.54 0.55 0.51
21.97% 18.28% 15.01% 15.45% 17.04%
24.37%
Capital Structure and Profitability Relationship
Price to Earning’s Ratio
The price to earnings ratio for the firm clearly shows the level of earnings that the firm is
earning with respect to the level of the pricing of the firm. The ratio also help assess what the
investors are willing to pay with respect to the current share price of the firm. The P/E ratio for
the firm has been around 13.98 times in the year 2015 and the same has increased to a
considerable levels to around 23.39 times in the year 2019. When the ratio and data is well
⊘ This is a preview!⊘
Do you want full access?
Subscribe today to unlock all pages.
Trusted by 1+ million students worldwide
9FINANCIAL MANAGEMENT
compared with the help of the industry level the same was around 21.58 times. The ratio clearly
states that the share price of the firm may be overvalued in respect to the earnings that has been
made by other companies that are operating in the same industry. The high PE ratio shows that
investors are willing to pay more for the future prospects or earnings that the firm would be
making in respect to the current share price.
Conclusion
The analysis conducted for the Woolworths Firm was done using the financial data for
the firm from the period 2015-2019 whereby relevant changes in the financials of the firm has
been observed. The analysis conducted well reflected that the profitability aspects of the firm has
worsened in the trend period analyzed. The key reason we found was the decrease in the sales
and the increase of the operating cost in respect to the sales made by the firm. The financial
leverage of the firm was also found out to be high and it is recommended that the management of
the firm take important steps for reducing the same and maintaining a stable amount of working
capital in the business.
Paraphrase This Document
Need a fresh take? Get an instant paraphrase of this document with our AI Paraphraser
10FINANCIAL MANAGEMENT
References
(WOW), W. 2020. Woolworths Ltd (WOW) Financial Ratios - Investing.com India. [online]
Investing.com India. Available at: https://in.investing.com/equities/woolworths-limited-ratios
[Accessed 22 Jan. 2020].
Australian Institute of Business. 2017. Everything You Need To Know About Academic
Referencing | AIB Official Blog. [online] Available at:
https://www.aib.edu.au/blog/study-tips/everything-need-know-academic-referencing/ [Accessed
22 Jan. 2020].
Datanalysis-morningstar-com-au.eu1.proxy.openathens.net. 2020. OpenAthens / Sign in. [online]
Available at: https://datanalysis-morningstar-com-au.eu1.proxy.openathens.net/ftl/firm/
profitloss?ASXCode=WOW&rt=A&sy=2015-01-01&ey=2020-12-31&xtm-
licensee=datpremium [Accessed 22 Jan. 2020].
Datanalysis-morningstar-com-au.eu1.proxy.openathens.net. 2020. OpenAthens / Sign in. [online]
Available at: https://datanalysis-morningstar-com-au.eu1.proxy.openathens.net/ftl/firm/
balancesheet?xtm-licensee=datpremium&ASXCode=WOW&sy=2015-01-01&ey=2020-12-
31&rt=A [Accessed 22 Jan. 2020].
Haskins, B., Nehme, Z., Cameron, P., Bernard, S., Parker‐Stebbing, L. and Smith, K., 2019.
Coles and Woolworths have installed public access defibrillators in all their stores: It is time
other Australian businesses followed their lead. Emergency Medicine Australasia.
Haskins, M.E., 2017. Remington, Inc.: Instant Insights for Financial Ratios. Darden Business
Publishing Cases.
In.finance.yahoo.com. 2020. Yahoo is now a part of Verizon Media. [online] Available at:
https://in.finance.yahoo.com/quote/WOW.AX/financials?p=WOW.AX [Accessed 22 Jan. 2020].
Linares-Mustarós, S., Coenders, G. and Vives-Mestres, M., 2018. Financial performance and
distress profiles. From classification according to financial ratios to compositional
classification. Advances in Accounting, 40, pp.1-10.
11FINANCIAL MANAGEMENT
Myšková, R. and Hájek, P., 2017. Comprehensive assessment of firm financial performance
using financial ratios and linguistic analysis of annual reports. Journal of International Studies,
volume 10, issue: 4.
Rakićević, A., Milošević, P., Petrović, B. and Radojević, D.G., 2016. DuPont financial ratio
analysis using logical aggregation. In Soft computing applications (pp. 727-739). Springer,
Cham.
⊘ This is a preview!⊘
Do you want full access?
Subscribe today to unlock all pages.
Trusted by 1+ million students worldwide
1 out of 13
Related Documents


Your All-in-One AI-Powered Toolkit for Academic Success.
+13062052269
info@desklib.com
Available 24*7 on WhatsApp / Email
![[object Object]](/_next/static/media/star-bottom.7253800d.svg)
Unlock your academic potential
Copyright © 2020–2026 A2Z Services. All Rights Reserved. Developed and managed by ZUCOL.