Financial Statement Analysis: Woolworths and Wesfarmers Comparison
VerifiedAdded on 2023/06/11
|23
|4989
|204
Report
AI Summary
This report conducts a financial analysis of Woolworths Limited, comparing it with its key competitor, Wesfarmers Limited, through various financial ratios related to profitability, efficiency, liquidity, and investment. The analysis indicates that both companies maintain stable financial positions in the Australian consumer staples sector. Wesfarmers demonstrates a competitive advantage in profitability and investment, while Woolworths excels in liquidity and efficiency. The report also examines ethical standards, corporate governance, and adherence to ASX guidelines, ensuring financial integrity through AASB compliance. It further explores management's approach to risk, financial reporting, and attitudes towards information processing and accounting, providing a comprehensive overview of the companies' financial health and operational practices.
Running head: ACCOUNTING FOR BUSINESS
Accounting for Business
Name of the Student:
Name of the University:
Author’s Note:
Course ID:
Accounting for Business
Name of the Student:
Name of the University:
Author’s Note:
Course ID:
Paraphrase This Document
Need a fresh take? Get an instant paraphrase of this document with our AI Paraphraser
1ACCOUNTING FOR BUSINESS
Table of Contents
Executive Summary:........................................................................................................................3
Introduction:....................................................................................................................................4
Section 1:.........................................................................................................................................4
1.1 Profitability analysis of Woolworths Limited in comparison to its competitor, Wesfarmers
Limited:........................................................................................................................................4
Section 2:.........................................................................................................................................7
2.1 Return on assets:....................................................................................................................9
2.2 Inventory turnover:..............................................................................................................10
2.3 Quick ratio:..........................................................................................................................11
2.4 Price-earnings ratio:.............................................................................................................12
Section 3........................................................................................................................................13
3.1 Corporate governance and practice of integrity policy inside the business:.......................13
3.2 Management’s approach in taking and managing business risks:.......................................13
3.3 Management’s attitudes and actions towards financial reporting:......................................14
3.4 Management’s attitudes information processing and accounting:.......................................14
3.5 Business Operations:...........................................................................................................15
3.6 Investments and investment activities:....................................................................................15
3.7 Financing and financing activities:......................................................................................16
3.8 Industry Size:.......................................................................................................................16
2ACCOUNTING FOR BUSINESS
3.9 Major players/competitors:..................................................................................................17
3.10 Market Shares of industry players:....................................................................................17
Conclusion:....................................................................................................................................17
References:....................................................................................................................................19
⊘ This is a preview!⊘
Do you want full access?
Subscribe today to unlock all pages.
Trusted by 1+ million students worldwide
3ACCOUNTING FOR BUSINESS
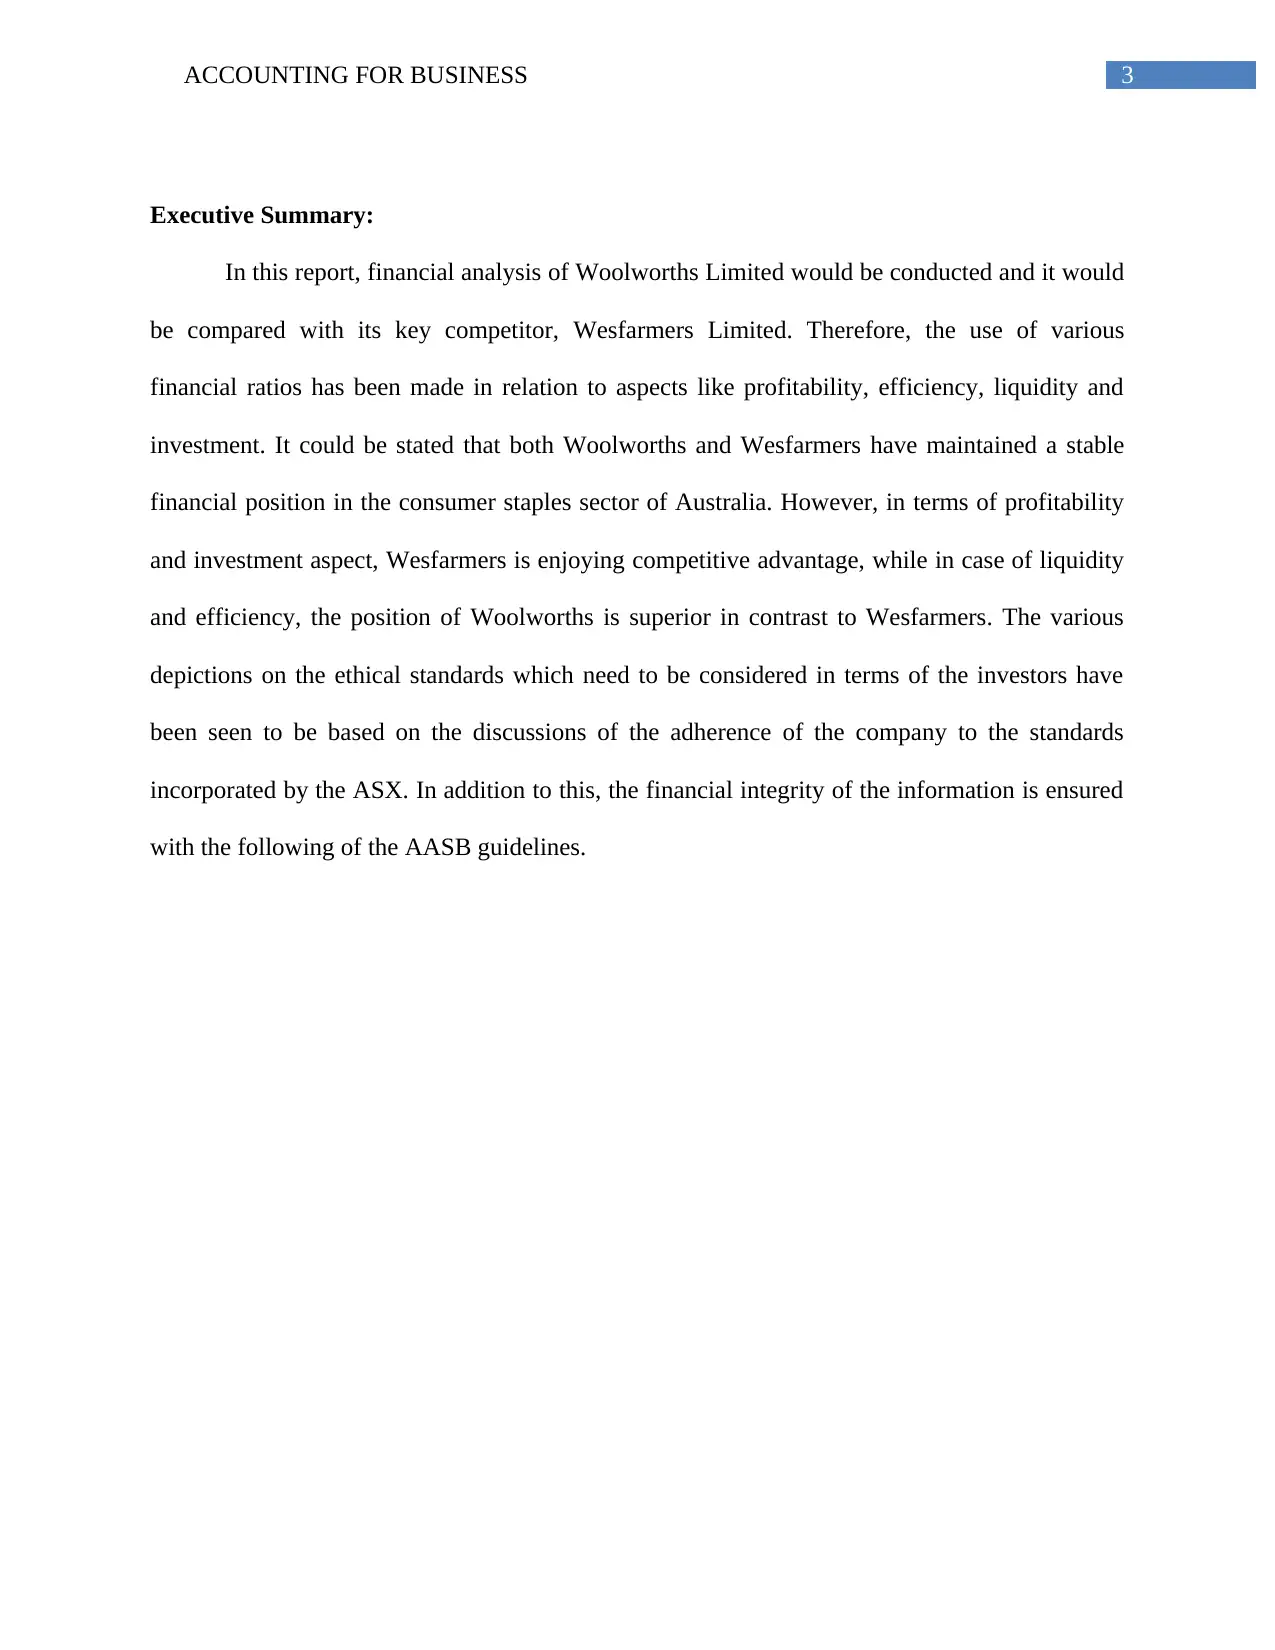
Executive Summary:
In this report, financial analysis of Woolworths Limited would be conducted and it would
be compared with its key competitor, Wesfarmers Limited. Therefore, the use of various
financial ratios has been made in relation to aspects like profitability, efficiency, liquidity and
investment. It could be stated that both Woolworths and Wesfarmers have maintained a stable
financial position in the consumer staples sector of Australia. However, in terms of profitability
and investment aspect, Wesfarmers is enjoying competitive advantage, while in case of liquidity
and efficiency, the position of Woolworths is superior in contrast to Wesfarmers. The various
depictions on the ethical standards which need to be considered in terms of the investors have
been seen to be based on the discussions of the adherence of the company to the standards
incorporated by the ASX. In addition to this, the financial integrity of the information is ensured
with the following of the AASB guidelines.
Paraphrase This Document
Need a fresh take? Get an instant paraphrase of this document with our AI Paraphraser
4ACCOUNTING FOR BUSINESS
Introduction:
In the current competitive global business environment, financial analysis is of extreme
significance, as it helps in examining the financial information for arriving at the business
decisions as well as investment decisions. In this report, financial analysis of Woolworths
Limited would be conducted and it would be compared with its key competitor, Wesfarmers
Limited. Therefore, the use of various financial ratios has been made in relation to aspects like
profitability, efficiency, liquidity and investment. The latter section of the report would shed
light on evaluating the working procedure of Woolworths Limited to maintain the best interest of
the organisation.
Section 1:
1.1 Profitability analysis of Woolworths Limited in comparison to its competitor,
Wesfarmers Limited:
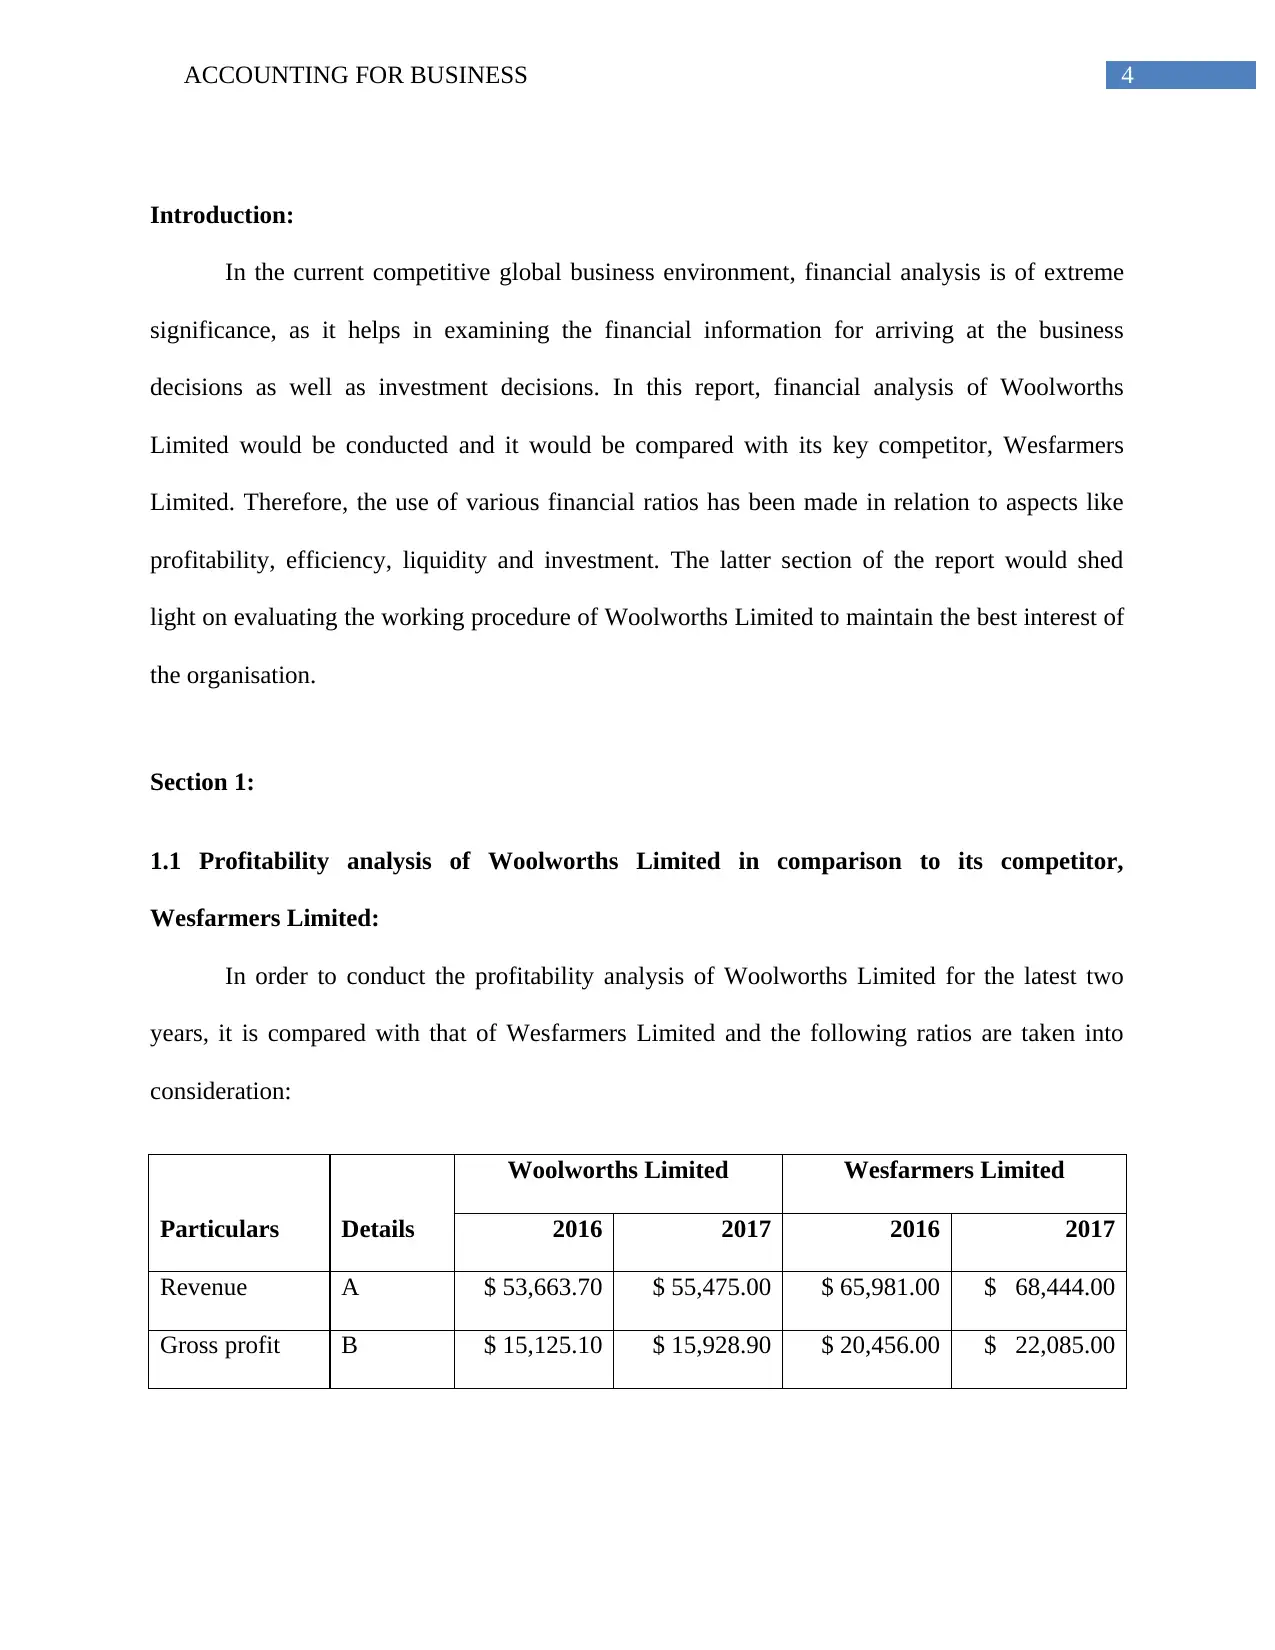
In order to conduct the profitability analysis of Woolworths Limited for the latest two
years, it is compared with that of Wesfarmers Limited and the following ratios are taken into
consideration:
Particulars Details
Woolworths Limited Wesfarmers Limited
2016 2017 2016 2017
Revenue A $ 53,663.70 $ 55,475.00 $ 65,981.00 $ 68,444.00
Gross profit B $ 15,125.10 $ 15,928.90 $ 20,456.00 $ 22,085.00
Introduction:
In the current competitive global business environment, financial analysis is of extreme
significance, as it helps in examining the financial information for arriving at the business
decisions as well as investment decisions. In this report, financial analysis of Woolworths
Limited would be conducted and it would be compared with its key competitor, Wesfarmers
Limited. Therefore, the use of various financial ratios has been made in relation to aspects like
profitability, efficiency, liquidity and investment. The latter section of the report would shed
light on evaluating the working procedure of Woolworths Limited to maintain the best interest of
the organisation.
Section 1:
1.1 Profitability analysis of Woolworths Limited in comparison to its competitor,
Wesfarmers Limited:
In order to conduct the profitability analysis of Woolworths Limited for the latest two
years, it is compared with that of Wesfarmers Limited and the following ratios are taken into
consideration:
Particulars Details
Woolworths Limited Wesfarmers Limited
2016 2017 2016 2017
Revenue A $ 53,663.70 $ 55,475.00 $ 65,981.00 $ 68,444.00
Gross profit B $ 15,125.10 $ 15,928.90 $ 20,456.00 $ 22,085.00
5ACCOUNTING FOR BUSINESS
Operating
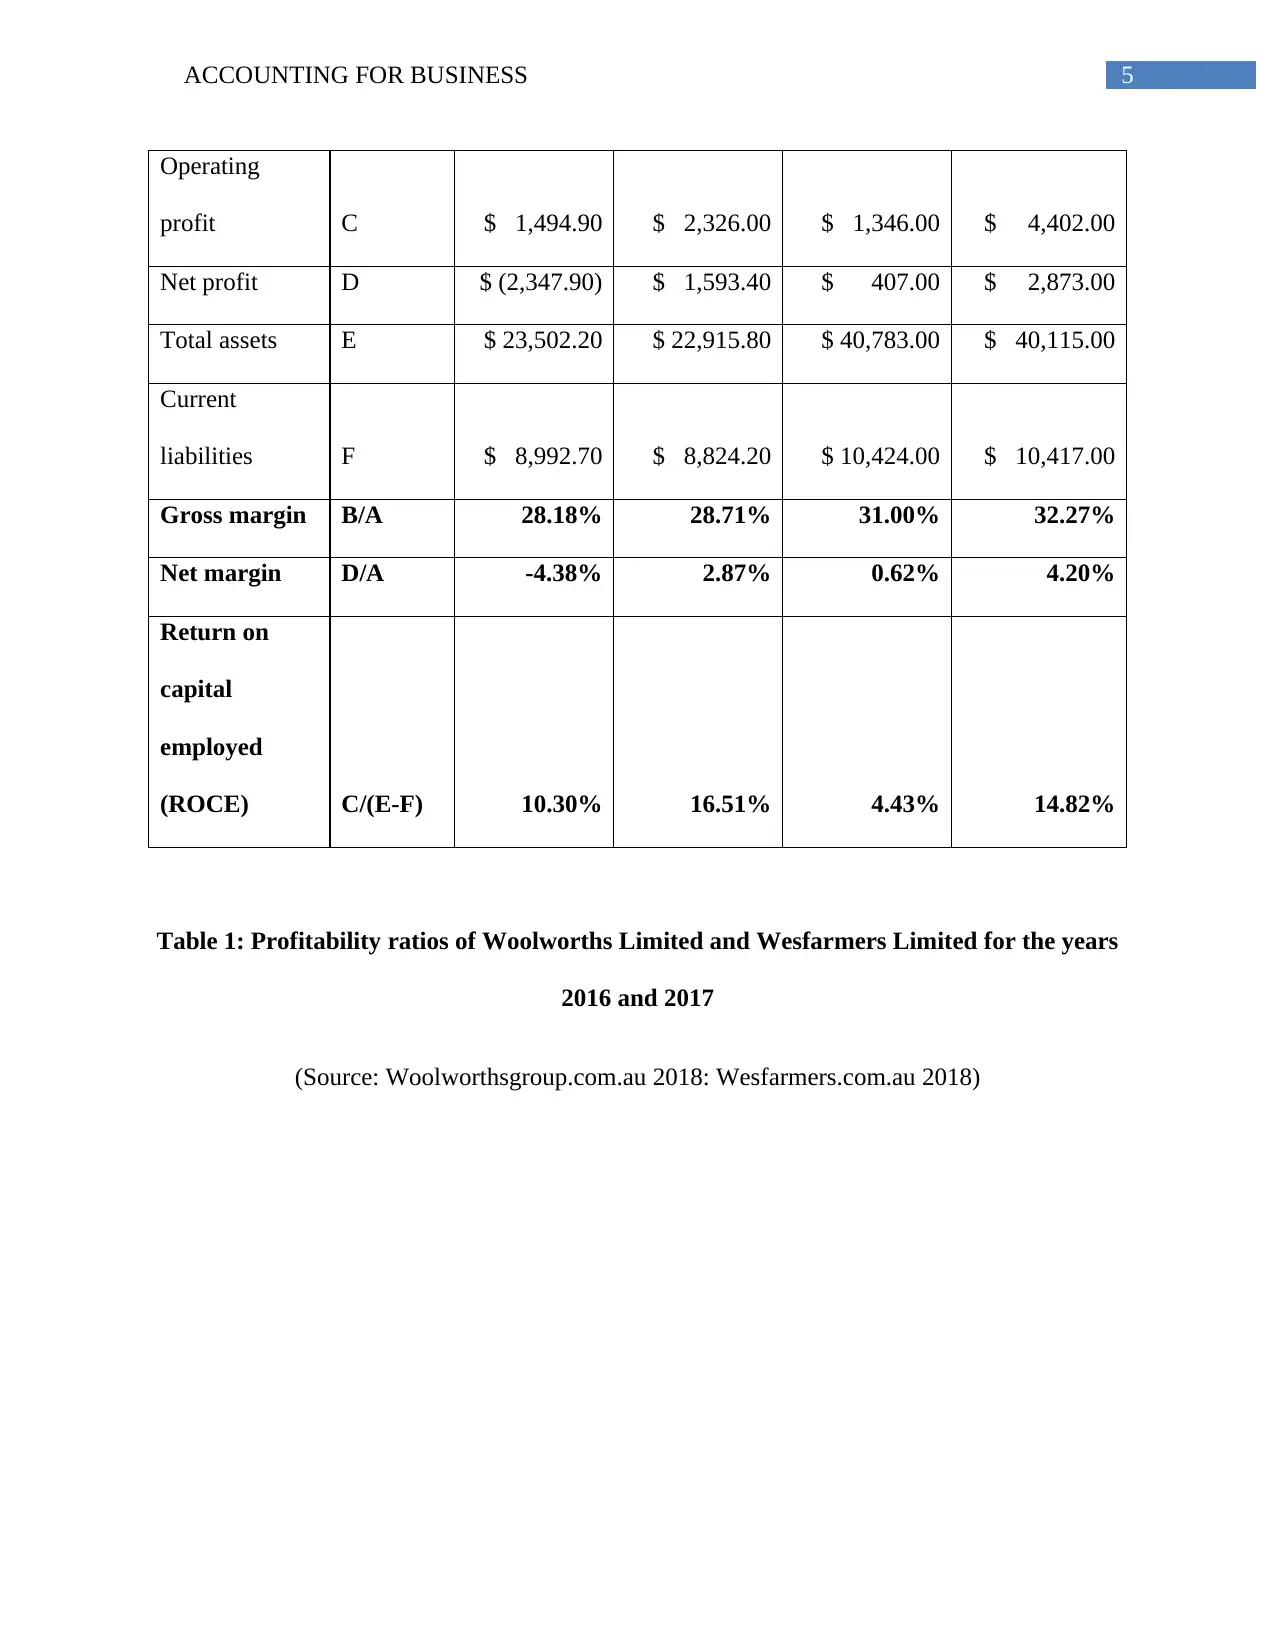
profit C $ 1,494.90 $ 2,326.00 $ 1,346.00 $ 4,402.00
Net profit D $ (2,347.90) $ 1,593.40 $ 407.00 $ 2,873.00
Total assets E $ 23,502.20 $ 22,915.80 $ 40,783.00 $ 40,115.00
Current
liabilities F $ 8,992.70 $ 8,824.20 $ 10,424.00 $ 10,417.00
Gross margin B/A 28.18% 28.71% 31.00% 32.27%
Net margin D/A -4.38% 2.87% 0.62% 4.20%
Return on
capital
employed
(ROCE) C/(E-F) 10.30% 16.51% 4.43% 14.82%
Table 1: Profitability ratios of Woolworths Limited and Wesfarmers Limited for the years
2016 and 2017
(Source: Woolworthsgroup.com.au 2018: Wesfarmers.com.au 2018)
Operating
profit C $ 1,494.90 $ 2,326.00 $ 1,346.00 $ 4,402.00
Net profit D $ (2,347.90) $ 1,593.40 $ 407.00 $ 2,873.00
Total assets E $ 23,502.20 $ 22,915.80 $ 40,783.00 $ 40,115.00
Current
liabilities F $ 8,992.70 $ 8,824.20 $ 10,424.00 $ 10,417.00
Gross margin B/A 28.18% 28.71% 31.00% 32.27%
Net margin D/A -4.38% 2.87% 0.62% 4.20%
Return on
capital
employed
(ROCE) C/(E-F) 10.30% 16.51% 4.43% 14.82%
Table 1: Profitability ratios of Woolworths Limited and Wesfarmers Limited for the years
2016 and 2017
(Source: Woolworthsgroup.com.au 2018: Wesfarmers.com.au 2018)
⊘ This is a preview!⊘
Do you want full access?
Subscribe today to unlock all pages.
Trusted by 1+ million students worldwide
6ACCOUNTING FOR BUSINESS
2016 2017 2016 2017
Woolworths Limited Wesfarmers Limited
-10.00%
-5.00%
0.00%
5.00%
10.00%
15.00%
20.00%
25.00%
30.00%
35.00%
28.18% 28.71% 31.00% 32.27%
-4.38%
2.87% 0.62%
4.20%
10.30%
16.51%
4.43%
14.82%
Profitability Ratios of Woolworths
and Wesfarmers
Gross margin
Net margin
Return on capital
employed (ROCE)
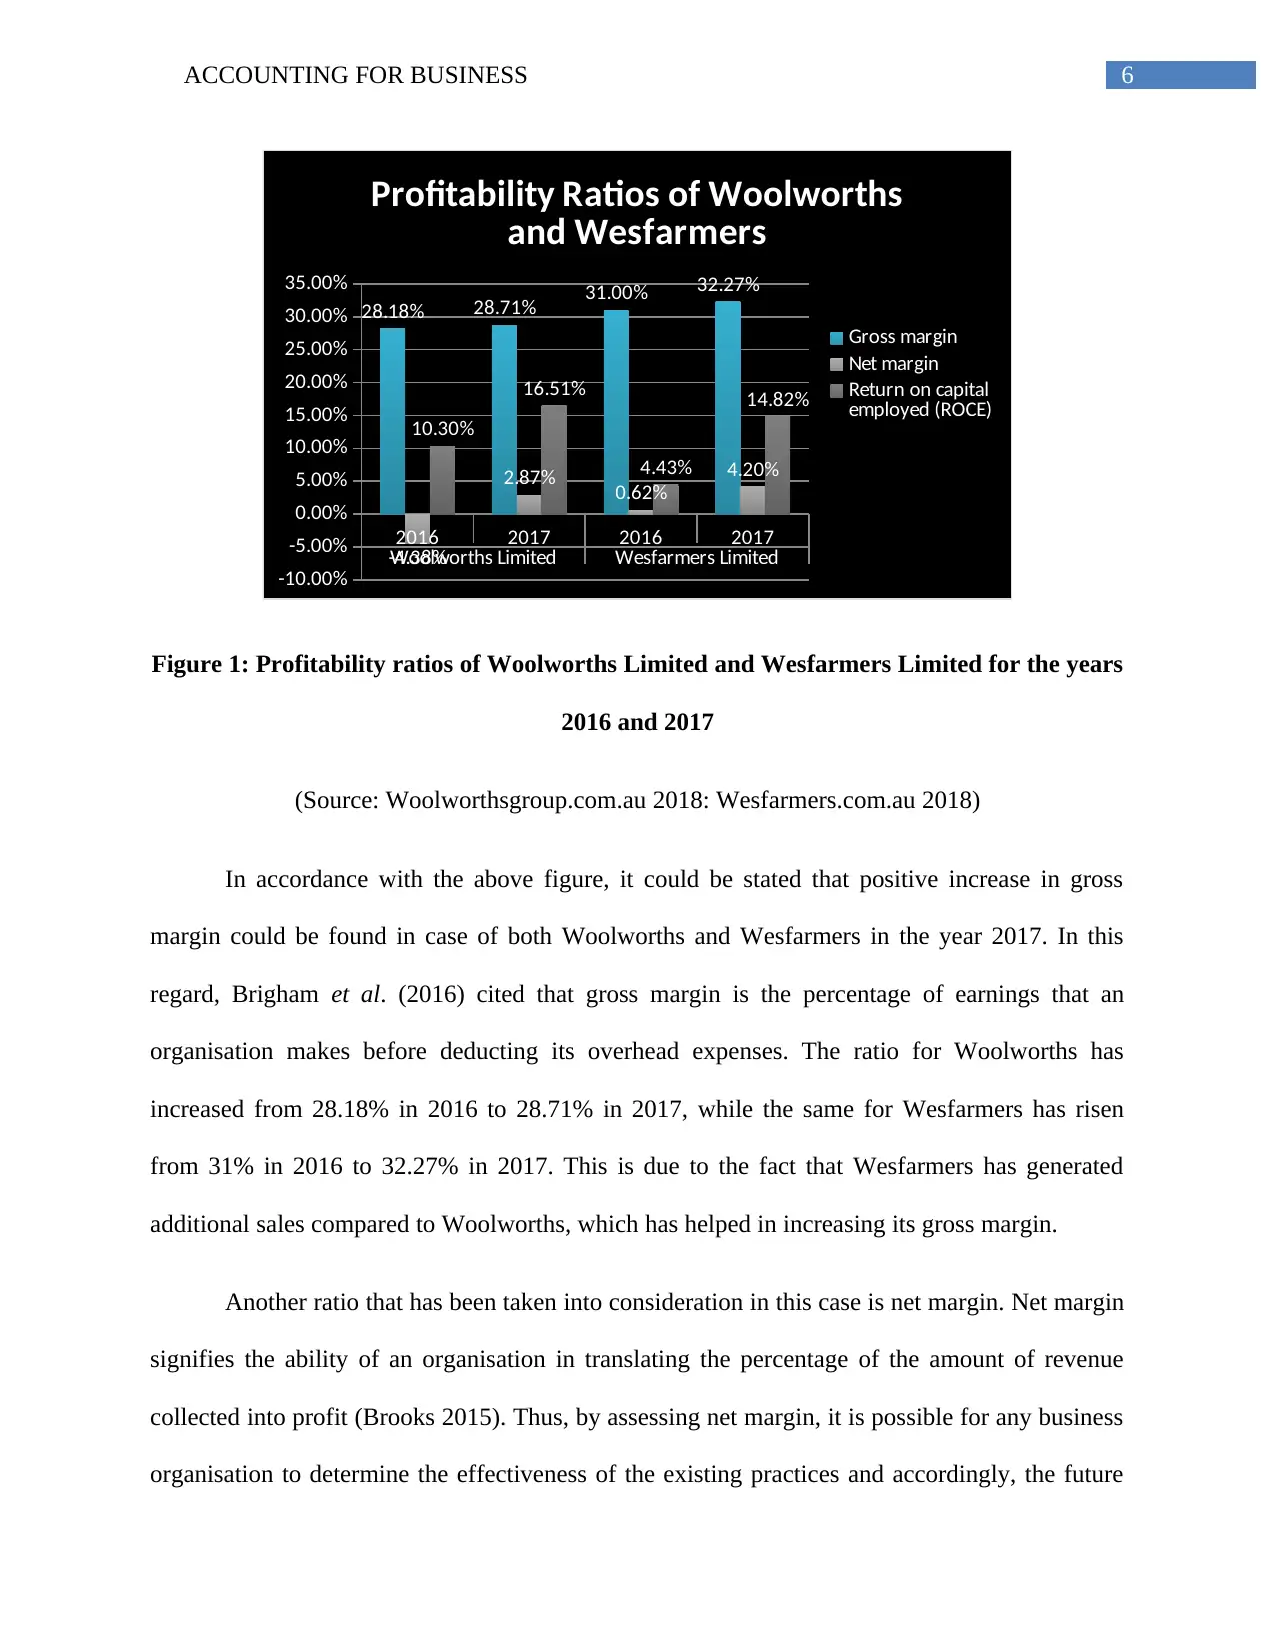
Figure 1: Profitability ratios of Woolworths Limited and Wesfarmers Limited for the years
2016 and 2017
(Source: Woolworthsgroup.com.au 2018: Wesfarmers.com.au 2018)
In accordance with the above figure, it could be stated that positive increase in gross
margin could be found in case of both Woolworths and Wesfarmers in the year 2017. In this
regard, Brigham et al. (2016) cited that gross margin is the percentage of earnings that an
organisation makes before deducting its overhead expenses. The ratio for Woolworths has
increased from 28.18% in 2016 to 28.71% in 2017, while the same for Wesfarmers has risen
from 31% in 2016 to 32.27% in 2017. This is due to the fact that Wesfarmers has generated
additional sales compared to Woolworths, which has helped in increasing its gross margin.
Another ratio that has been taken into consideration in this case is net margin. Net margin
signifies the ability of an organisation in translating the percentage of the amount of revenue
collected into profit (Brooks 2015). Thus, by assessing net margin, it is possible for any business
organisation to determine the effectiveness of the existing practices and accordingly, the future
2016 2017 2016 2017
Woolworths Limited Wesfarmers Limited
-10.00%
-5.00%
0.00%
5.00%
10.00%
15.00%
20.00%
25.00%
30.00%
35.00%
28.18% 28.71% 31.00% 32.27%
-4.38%
2.87% 0.62%
4.20%
10.30%
16.51%
4.43%
14.82%
Profitability Ratios of Woolworths
and Wesfarmers
Gross margin
Net margin
Return on capital
employed (ROCE)
Figure 1: Profitability ratios of Woolworths Limited and Wesfarmers Limited for the years
2016 and 2017
(Source: Woolworthsgroup.com.au 2018: Wesfarmers.com.au 2018)
In accordance with the above figure, it could be stated that positive increase in gross
margin could be found in case of both Woolworths and Wesfarmers in the year 2017. In this
regard, Brigham et al. (2016) cited that gross margin is the percentage of earnings that an
organisation makes before deducting its overhead expenses. The ratio for Woolworths has
increased from 28.18% in 2016 to 28.71% in 2017, while the same for Wesfarmers has risen
from 31% in 2016 to 32.27% in 2017. This is due to the fact that Wesfarmers has generated
additional sales compared to Woolworths, which has helped in increasing its gross margin.
Another ratio that has been taken into consideration in this case is net margin. Net margin
signifies the ability of an organisation in translating the percentage of the amount of revenue
collected into profit (Brooks 2015). Thus, by assessing net margin, it is possible for any business
organisation to determine the effectiveness of the existing practices and accordingly, the future
Paraphrase This Document
Need a fresh take? Get an instant paraphrase of this document with our AI Paraphraser
7ACCOUNTING FOR BUSINESS
profits could be forecasted. In case of Woolworths, net margin has increase considerably from -
4.38% in 2016 to 2.87% in 2017. On the other hand, Wesfarmers has experienced an increase in
net margin from 0.62% in 2016 to 4.20% in 2017. This is due to the fact that Wesfarmers has
earned adequate revenue and lower operating expenses are incurred in contrast to the same.
Finally, ROCE is considered, which gauges the profitability as well efficiency of an
organisation with which the employment of capital is made (Laitinen 2017). The higher the ratio,
the better it is for the organisation. In case of Woolworths, increase in this ratio could be
observed from 10.30% in 2016 to 16.51% in 2017, while the similar trend is observed for
Wesfarmers as well from 4.43% in 2016 to 14.82% in 2017. Hence, it could be said that
Woolworths is in a better position in terms of this ratio; however, in terms of profitability, the
position of Wesfarmers is better than Woolworths in the consumer staples sector of Australia.
Section 2:
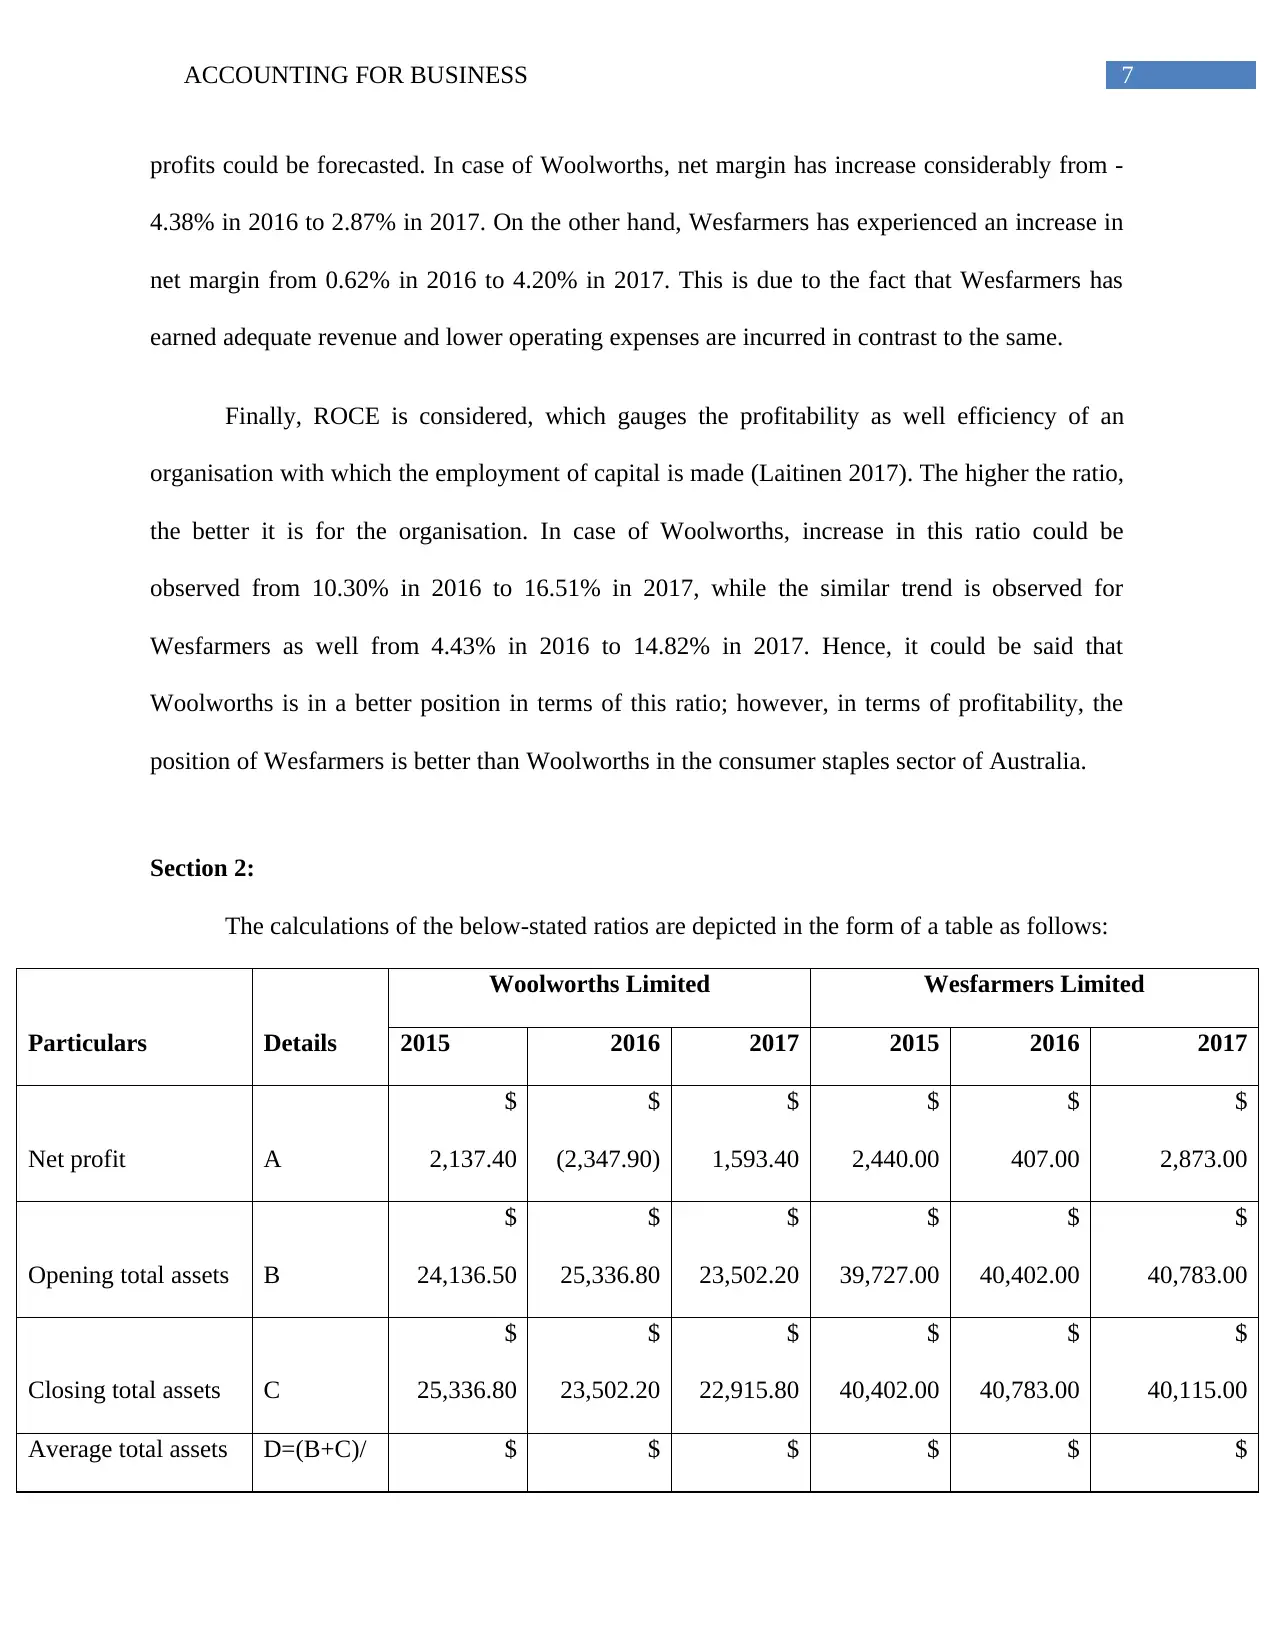
The calculations of the below-stated ratios are depicted in the form of a table as follows:
Particulars Details
Woolworths Limited Wesfarmers Limited
2015 2016 2017 2015 2016 2017
Net profit A
$
2,137.40
$
(2,347.90)
$
1,593.40
$
2,440.00
$
407.00
$
2,873.00
Opening total assets B
$
24,136.50
$
25,336.80
$
23,502.20
$
39,727.00
$
40,402.00
$
40,783.00
Closing total assets C
$
25,336.80
$
23,502.20
$
22,915.80
$
40,402.00
$
40,783.00
$
40,115.00
Average total assets D=(B+C)/ $ $ $ $ $ $
profits could be forecasted. In case of Woolworths, net margin has increase considerably from -
4.38% in 2016 to 2.87% in 2017. On the other hand, Wesfarmers has experienced an increase in
net margin from 0.62% in 2016 to 4.20% in 2017. This is due to the fact that Wesfarmers has
earned adequate revenue and lower operating expenses are incurred in contrast to the same.
Finally, ROCE is considered, which gauges the profitability as well efficiency of an
organisation with which the employment of capital is made (Laitinen 2017). The higher the ratio,
the better it is for the organisation. In case of Woolworths, increase in this ratio could be
observed from 10.30% in 2016 to 16.51% in 2017, while the similar trend is observed for
Wesfarmers as well from 4.43% in 2016 to 14.82% in 2017. Hence, it could be said that
Woolworths is in a better position in terms of this ratio; however, in terms of profitability, the
position of Wesfarmers is better than Woolworths in the consumer staples sector of Australia.
Section 2:
The calculations of the below-stated ratios are depicted in the form of a table as follows:
Particulars Details
Woolworths Limited Wesfarmers Limited
2015 2016 2017 2015 2016 2017
Net profit A
$
2,137.40
$
(2,347.90)
$
1,593.40
$
2,440.00
$
407.00
$
2,873.00
Opening total assets B
$
24,136.50
$
25,336.80
$
23,502.20
$
39,727.00
$
40,402.00
$
40,783.00
Closing total assets C
$
25,336.80
$
23,502.20
$
22,915.80
$
40,402.00
$
40,783.00
$
40,115.00
Average total assets D=(B+C)/ $ $ $ $ $ $
8ACCOUNTING FOR BUSINESS
2 24,736.65 24,419.50 23,209.00 40,064.50 40,592.50 40,449.00
Cost of revenue E
$
44,344.80
$
38,538.60
$
39,739.70
$
43,045.00
$
45,525.00
$
46,539.00
Opening inventory F
$
4,693.20
$
4,872.20
$
4,558.50
$
66.00
$
428.00
$
6,260.00
Closing inventory G
$
4,872.20
$
4,558.50
$
4,080.40
$
428.00
$
6,260.00
$
6,530.00
Average inventory H=(F+G)/2
$
4,782.70
$
4,715.35
$
4,319.45
$
247.00
$
3,344.00
$
6,395.00
Current assets I
$
7,660.90
$
7,427.00
$
6,994.20
$
9,093.00
$
9,684.00
$
9,667.00
Current liabilities J
$
9,168.60
$
8,992.70
$
8,824.20
$
9,726.00
$
10,424.00
$
10,417.00
Earnings per share K
1.7
1
0.5
8
1.1
1
2.1
6
0.3
6
2.5
5
Market price per
share L
0.2
4
0.2
5
0.2
7
0.4
2
0.4
0
0.4
4
Return on assets A/D 8.64% -9.61% 6.87% 6.09% 1.00% 7.10%
Inventory turnover
(in days) 365/(E/H)
39.3
7
44.6
6
39.6
7
2.0
9
26.8
1
50.1
6
Quick ratio (I-G)/J
0.3
0
0.3
2
0.3
3
0.8
9
0.3
3
0.3
0
Price-earnings K/L 7.1 2.3 4.1 5.1 0.9 5.8
⊘ This is a preview!⊘
Do you want full access?
Subscribe today to unlock all pages.
Trusted by 1+ million students worldwide
9ACCOUNTING FOR BUSINESS
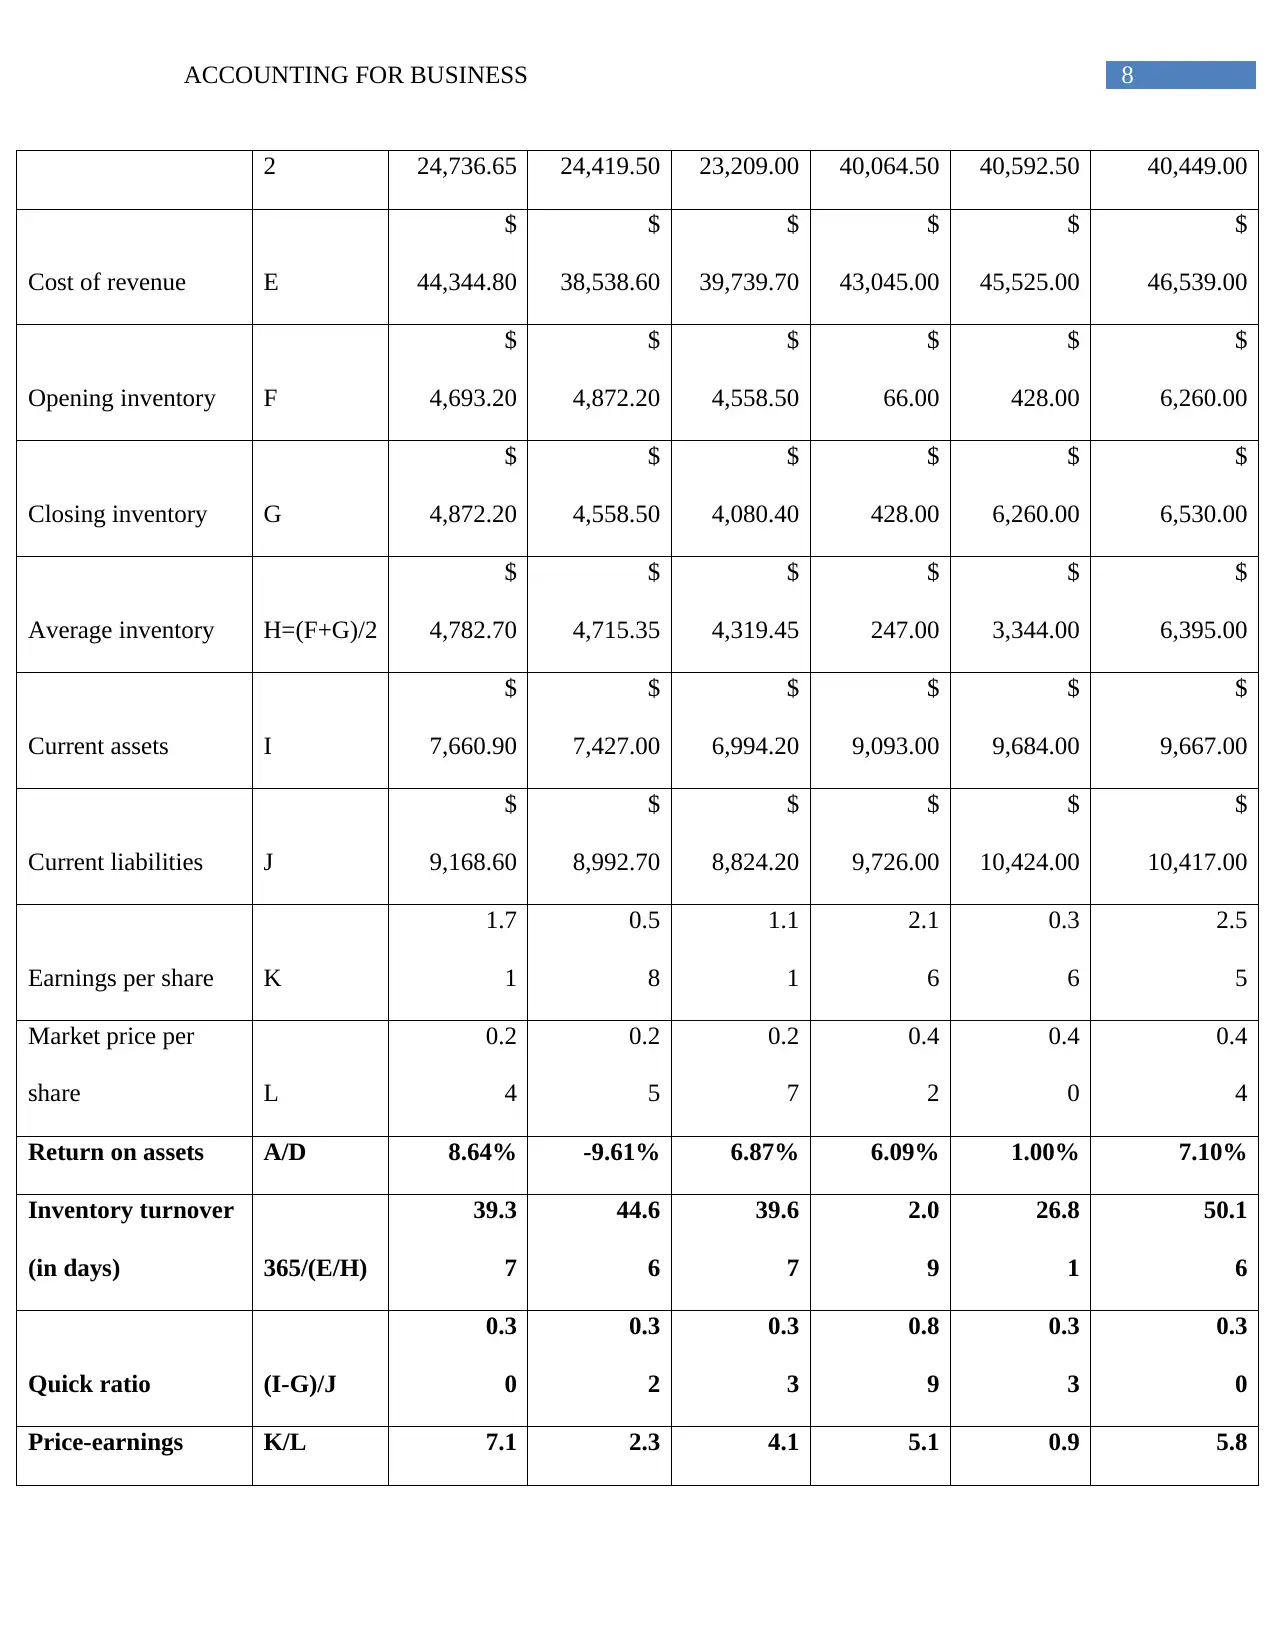
ratio 3 2 1 4 0 0
Table 2: Financial ratios of Woolworths Limited and Wesfarmers Limited for the years
2015, 2016 and 2017
(Source: Woolworthsgroup.com.au 2018: Wesfarmers.com.au 2018)
2.1 Return on assets:
2015 2016 2017 2015 2016 2017
Woolworths Limited Wesfarmers Limited
-15.00%
-10.00%
-5.00%
0.00%
5.00%
10.00% 8.64%
-9.61%
6.87% 6.09%
1.00%
7.10%
Return on assets
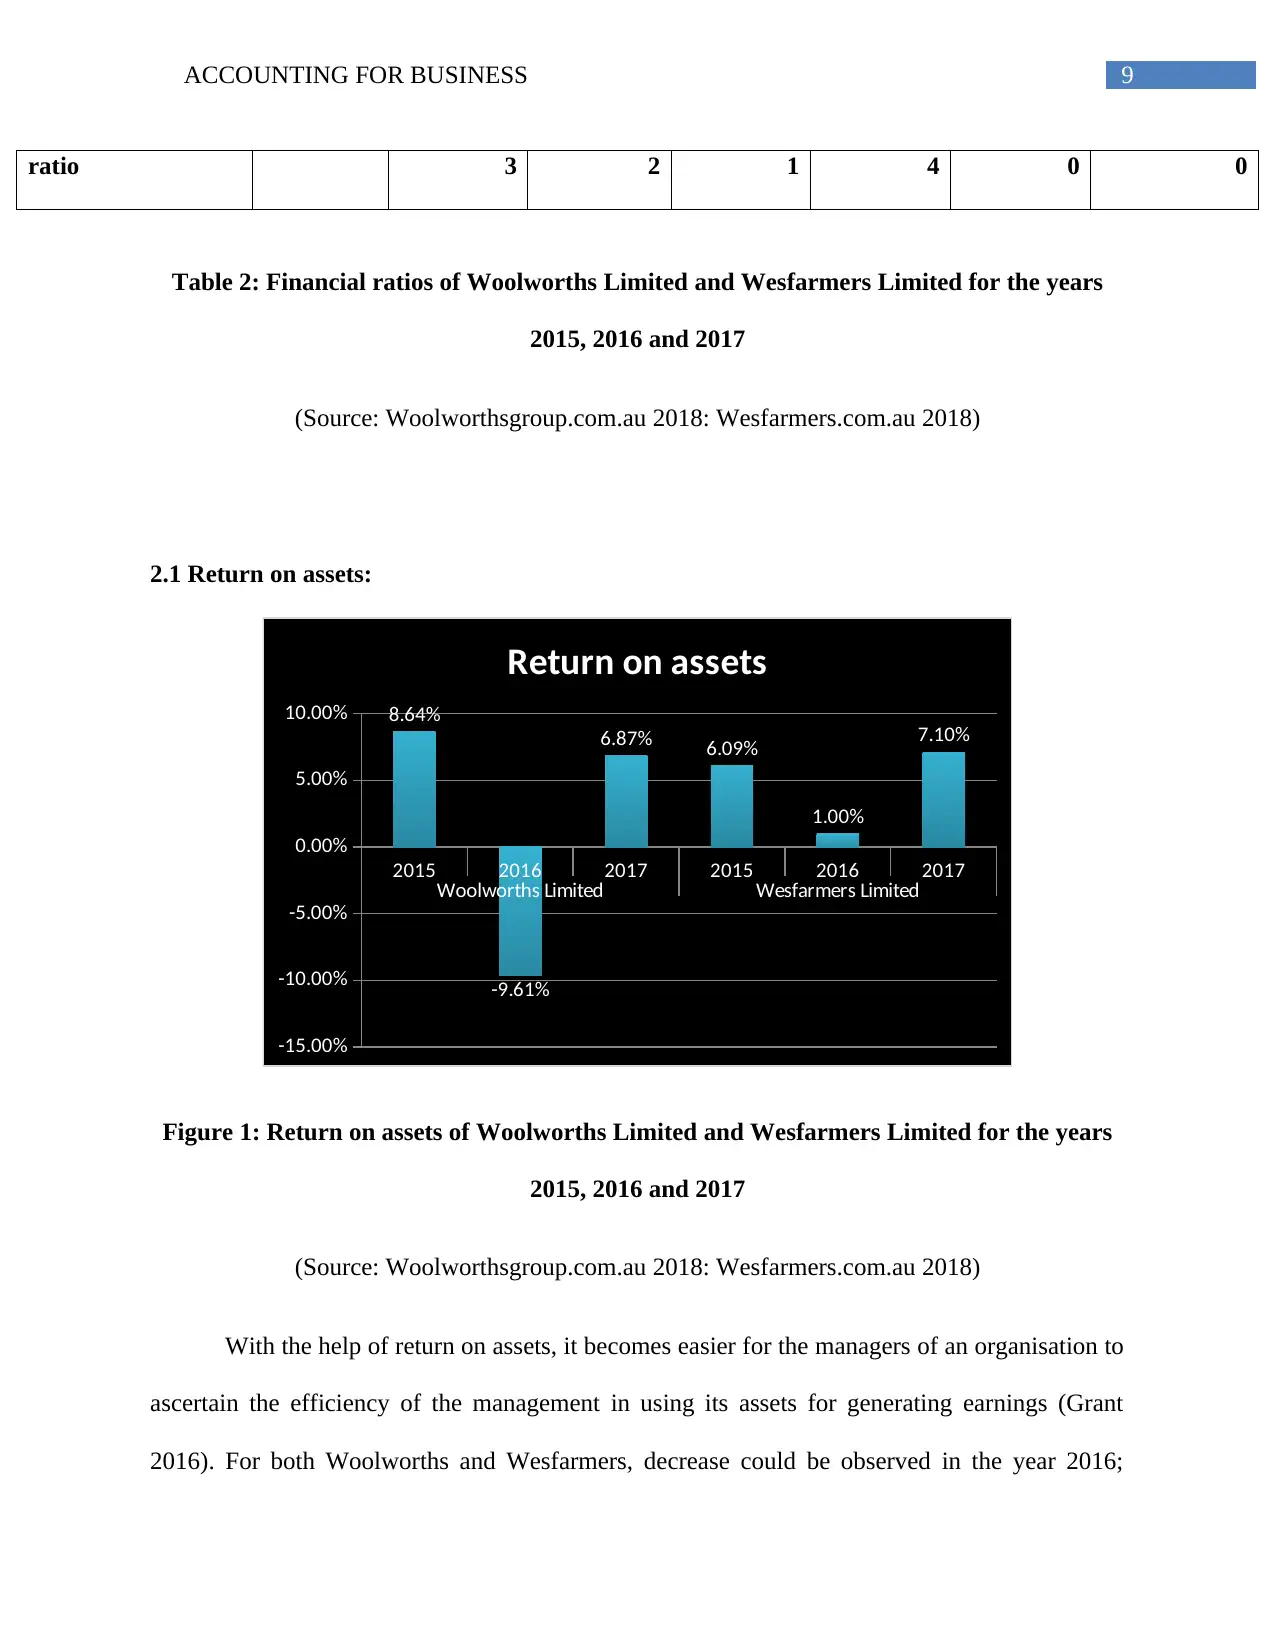
Figure 1: Return on assets of Woolworths Limited and Wesfarmers Limited for the years
2015, 2016 and 2017
(Source: Woolworthsgroup.com.au 2018: Wesfarmers.com.au 2018)
With the help of return on assets, it becomes easier for the managers of an organisation to
ascertain the efficiency of the management in using its assets for generating earnings (Grant
2016). For both Woolworths and Wesfarmers, decrease could be observed in the year 2016;
ratio 3 2 1 4 0 0
Table 2: Financial ratios of Woolworths Limited and Wesfarmers Limited for the years
2015, 2016 and 2017
(Source: Woolworthsgroup.com.au 2018: Wesfarmers.com.au 2018)
2.1 Return on assets:
2015 2016 2017 2015 2016 2017
Woolworths Limited Wesfarmers Limited
-15.00%
-10.00%
-5.00%
0.00%
5.00%
10.00% 8.64%
-9.61%
6.87% 6.09%
1.00%
7.10%
Return on assets
Figure 1: Return on assets of Woolworths Limited and Wesfarmers Limited for the years
2015, 2016 and 2017
(Source: Woolworthsgroup.com.au 2018: Wesfarmers.com.au 2018)
With the help of return on assets, it becomes easier for the managers of an organisation to
ascertain the efficiency of the management in using its assets for generating earnings (Grant
2016). For both Woolworths and Wesfarmers, decrease could be observed in the year 2016;
Paraphrase This Document
Need a fresh take? Get an instant paraphrase of this document with our AI Paraphraser
10ACCOUNTING FOR BUSINESS
however, it has increased significantly in 2017. This is because of the increasing popularity of e-
commerce in the Australian retail sector; however, Wesfarmers has generated more earnings in
contrast to Woolworths. Thus, Woolworths needs to deploy its asset base more effectively so that
higher earnings could be generated in future (Myšková and Hájek 2017).
2.2 Inventory turnover:
2015 2016 2017 2015 2016 2017
Woolworths Limited Wesfarmers Limited
-
10.00
20.00
30.00
40.00
50.00
60.00
39.37
44.66
39.67
2.09
26.81
50.16
Inventory turnover (in days)
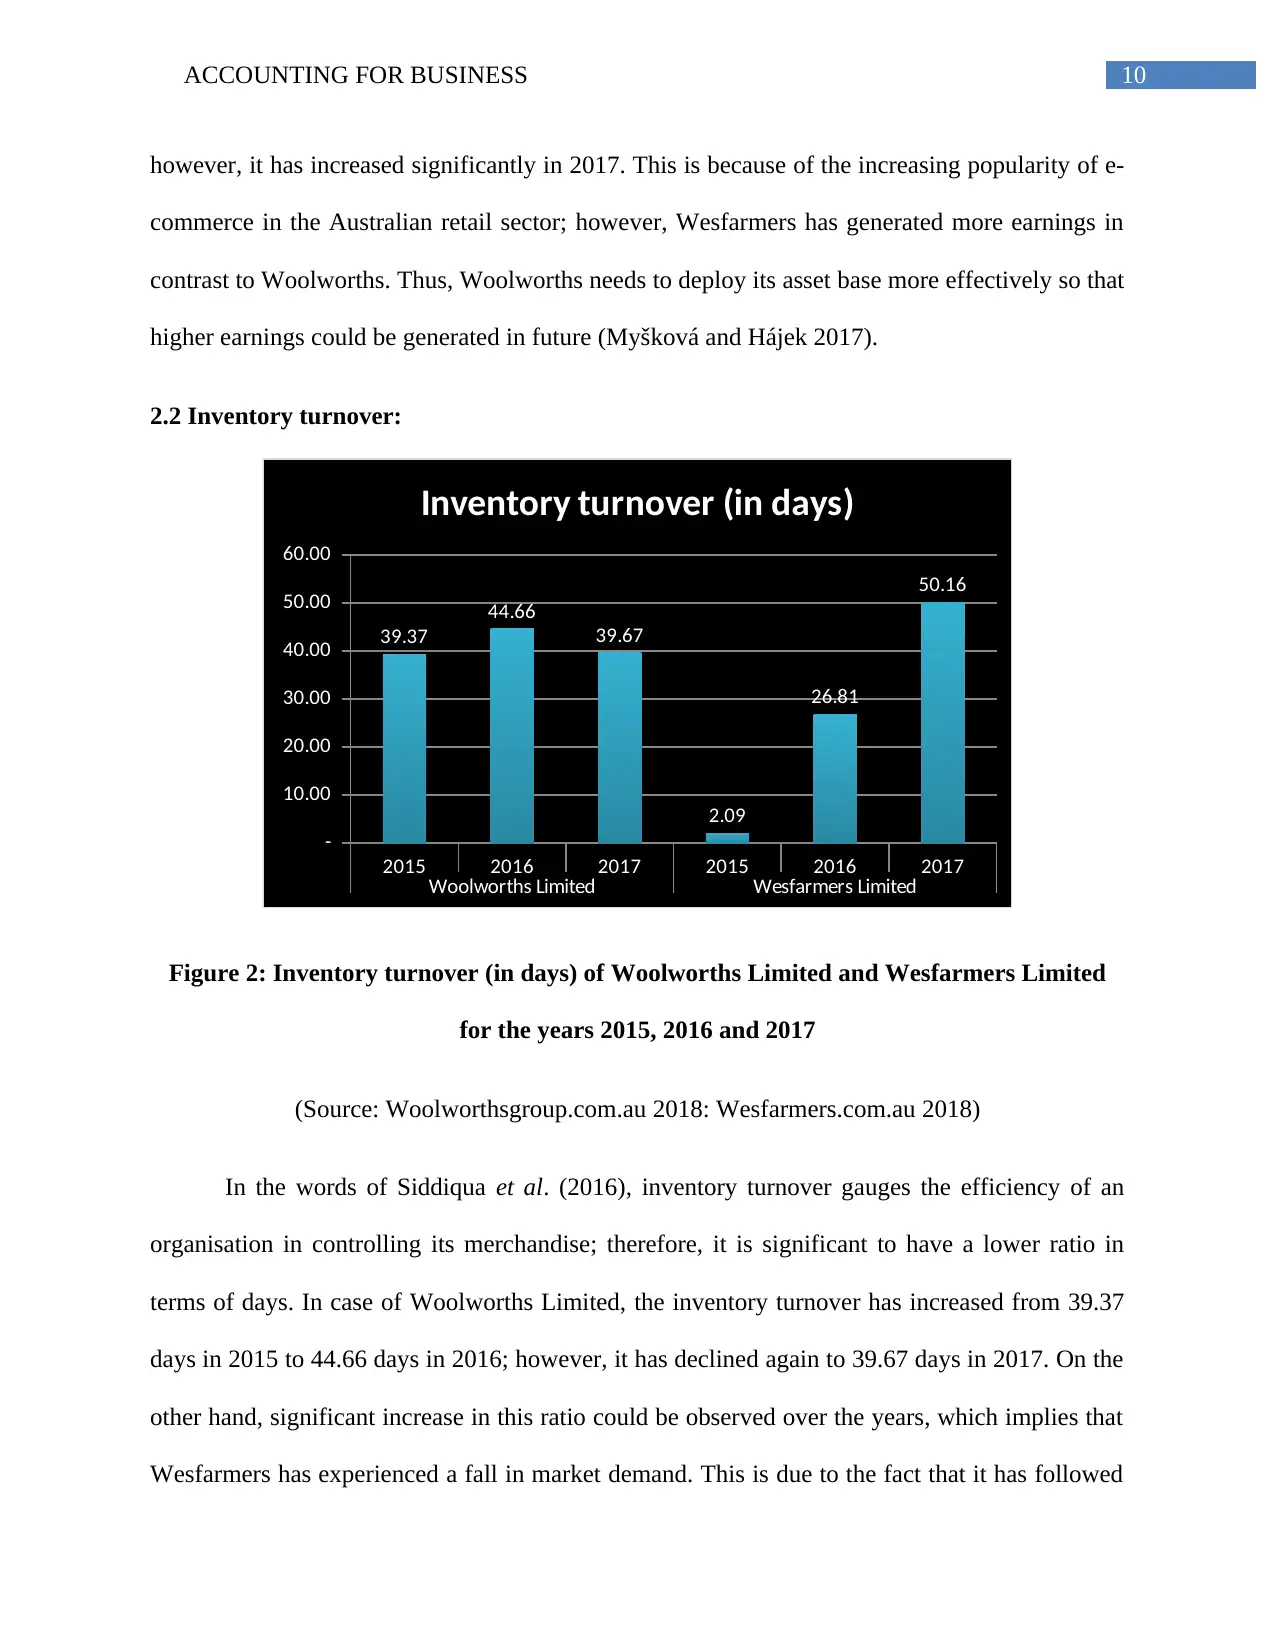
Figure 2: Inventory turnover (in days) of Woolworths Limited and Wesfarmers Limited
for the years 2015, 2016 and 2017
(Source: Woolworthsgroup.com.au 2018: Wesfarmers.com.au 2018)
In the words of Siddiqua et al. (2016), inventory turnover gauges the efficiency of an
organisation in controlling its merchandise; therefore, it is significant to have a lower ratio in
terms of days. In case of Woolworths Limited, the inventory turnover has increased from 39.37
days in 2015 to 44.66 days in 2016; however, it has declined again to 39.67 days in 2017. On the
other hand, significant increase in this ratio could be observed over the years, which implies that
Wesfarmers has experienced a fall in market demand. This is due to the fact that it has followed
however, it has increased significantly in 2017. This is because of the increasing popularity of e-
commerce in the Australian retail sector; however, Wesfarmers has generated more earnings in
contrast to Woolworths. Thus, Woolworths needs to deploy its asset base more effectively so that
higher earnings could be generated in future (Myšková and Hájek 2017).
2.2 Inventory turnover:
2015 2016 2017 2015 2016 2017
Woolworths Limited Wesfarmers Limited
-
10.00
20.00
30.00
40.00
50.00
60.00
39.37
44.66
39.67
2.09
26.81
50.16
Inventory turnover (in days)
Figure 2: Inventory turnover (in days) of Woolworths Limited and Wesfarmers Limited
for the years 2015, 2016 and 2017
(Source: Woolworthsgroup.com.au 2018: Wesfarmers.com.au 2018)
In the words of Siddiqua et al. (2016), inventory turnover gauges the efficiency of an
organisation in controlling its merchandise; therefore, it is significant to have a lower ratio in
terms of days. In case of Woolworths Limited, the inventory turnover has increased from 39.37
days in 2015 to 44.66 days in 2016; however, it has declined again to 39.67 days in 2017. On the
other hand, significant increase in this ratio could be observed over the years, which implies that
Wesfarmers has experienced a fall in market demand. This is due to the fact that it has followed
11ACCOUNTING FOR BUSINESS
aggressive pricing structure. Hence, in terms of this ratio, Woolworths is placed in a better
position in the consumer staples market.
2.3 Quick ratio:
2015 2016 2017 2015 2016 2017
Woolworths Limited Wesfarmers Limited
-
0.10
0.20
0.30
0.40
0.50
0.60
0.70
0.80
0.90
1.00
0.30 0.32 0.33
0.89
0.33 0.30
Quick ratio
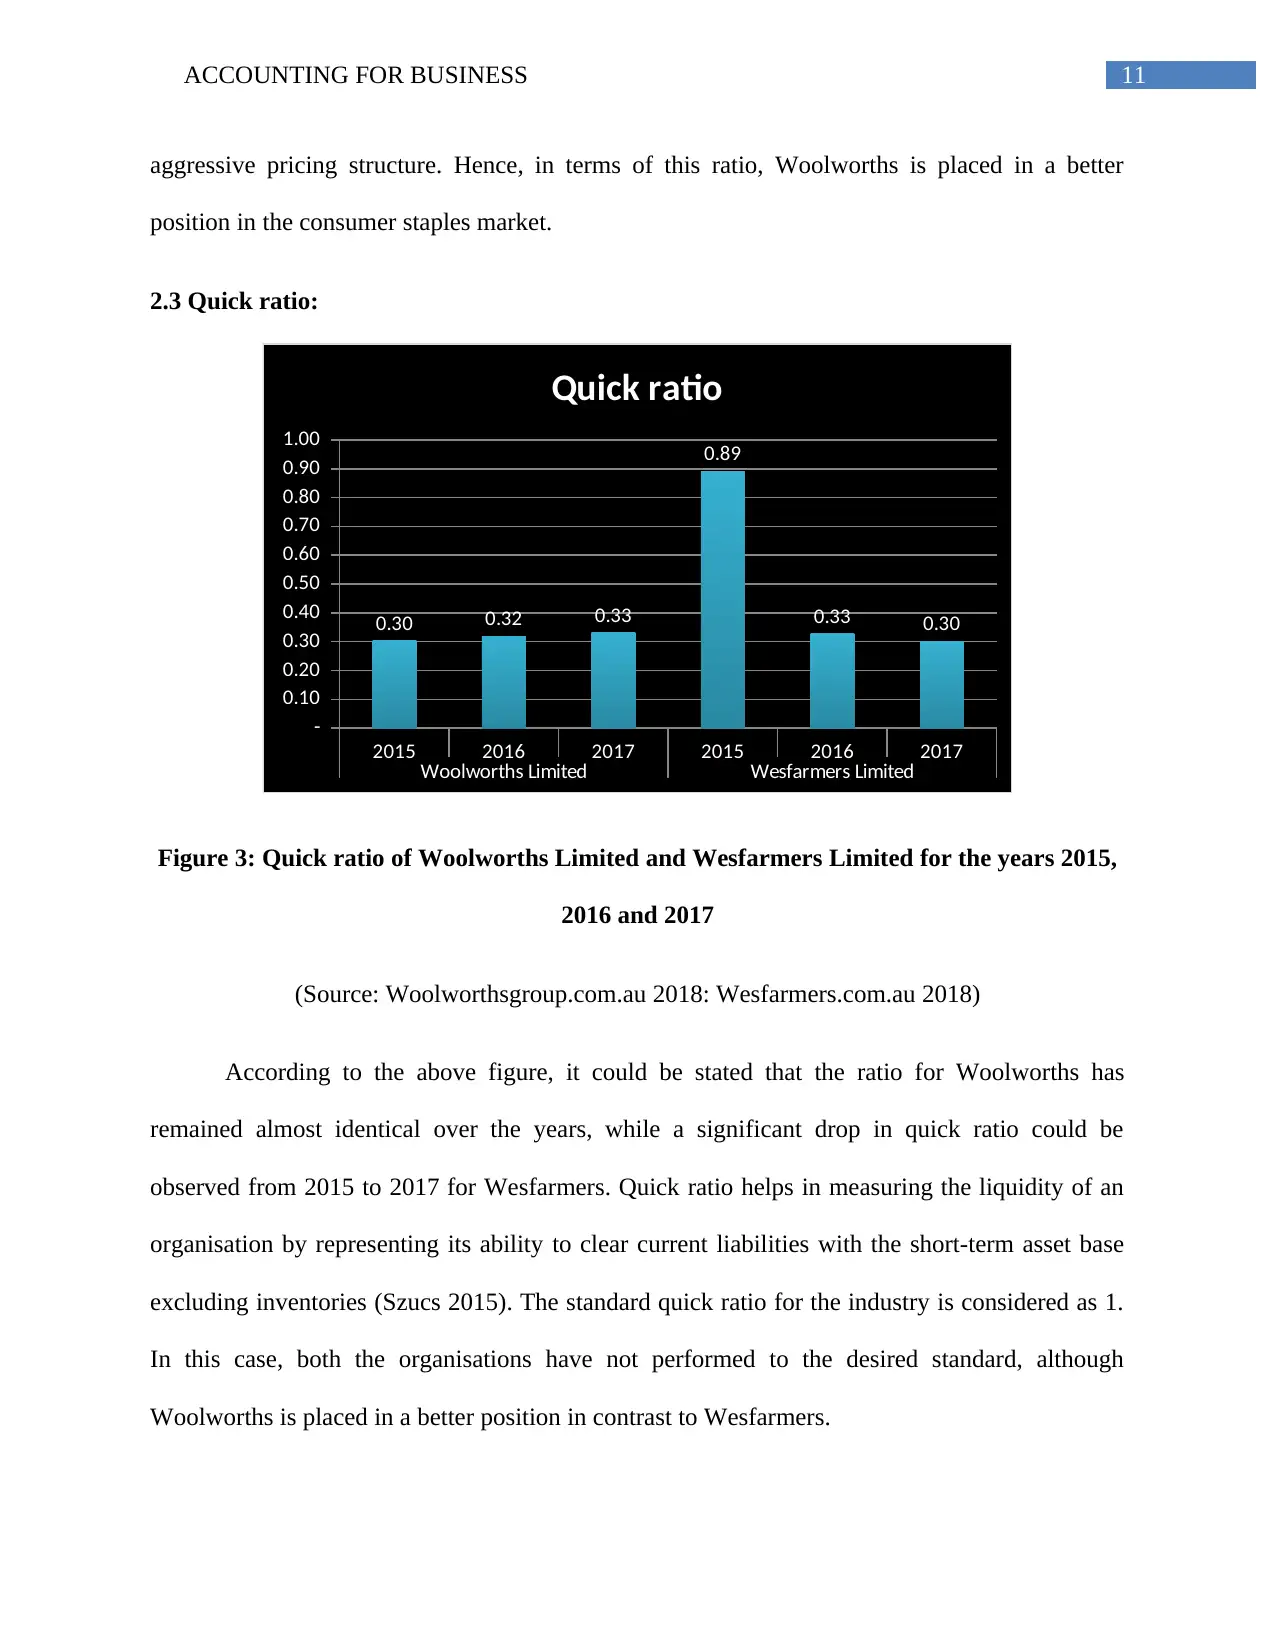
Figure 3: Quick ratio of Woolworths Limited and Wesfarmers Limited for the years 2015,
2016 and 2017
(Source: Woolworthsgroup.com.au 2018: Wesfarmers.com.au 2018)
According to the above figure, it could be stated that the ratio for Woolworths has
remained almost identical over the years, while a significant drop in quick ratio could be
observed from 2015 to 2017 for Wesfarmers. Quick ratio helps in measuring the liquidity of an
organisation by representing its ability to clear current liabilities with the short-term asset base
excluding inventories (Szucs 2015). The standard quick ratio for the industry is considered as 1.
In this case, both the organisations have not performed to the desired standard, although
Woolworths is placed in a better position in contrast to Wesfarmers.
aggressive pricing structure. Hence, in terms of this ratio, Woolworths is placed in a better
position in the consumer staples market.
2.3 Quick ratio:
2015 2016 2017 2015 2016 2017
Woolworths Limited Wesfarmers Limited
-
0.10
0.20
0.30
0.40
0.50
0.60
0.70
0.80
0.90
1.00
0.30 0.32 0.33
0.89
0.33 0.30
Quick ratio
Figure 3: Quick ratio of Woolworths Limited and Wesfarmers Limited for the years 2015,
2016 and 2017
(Source: Woolworthsgroup.com.au 2018: Wesfarmers.com.au 2018)
According to the above figure, it could be stated that the ratio for Woolworths has
remained almost identical over the years, while a significant drop in quick ratio could be
observed from 2015 to 2017 for Wesfarmers. Quick ratio helps in measuring the liquidity of an
organisation by representing its ability to clear current liabilities with the short-term asset base
excluding inventories (Szucs 2015). The standard quick ratio for the industry is considered as 1.
In this case, both the organisations have not performed to the desired standard, although
Woolworths is placed in a better position in contrast to Wesfarmers.
⊘ This is a preview!⊘
Do you want full access?
Subscribe today to unlock all pages.
Trusted by 1+ million students worldwide
1 out of 23
Related Documents


Your All-in-One AI-Powered Toolkit for Academic Success.
+13062052269
info@desklib.com
Available 24*7 on WhatsApp / Email
![[object Object]](/_next/static/media/star-bottom.7253800d.svg)
Unlock your academic potential
Copyright © 2020–2026 A2Z Services. All Rights Reserved. Developed and managed by ZUCOL.