Financial Analysis of Woolworths (ACC00724) - 2013-2017 Report
VerifiedAdded on 2023/06/10
|16
|3238
|339
Report
AI Summary
This report presents a comprehensive financial analysis of Woolworths, examining its performance from 2013 to 2017. The analysis begins with a horizontal analysis of the income statement, evaluating changes in revenue, expenses, and net income over the five-year period. The report then calculates and interprets various financial ratios, including return on assets, return on equity, operating profit margin, gross profit margin, inventory turnover, settlement period for debtors, current ratio, quick ratio, debt-to-assets ratio, interest cover ratio, assets turnover, earnings per share, price-earnings ratio, and dividend yield. The discussion covers profitability, efficiency, liquidity, financial gearing, and investment ratios, providing insights into Woolworths' financial health and performance trends. The report also includes a detailed calculation of each ratio, along with the formula used to derive the results.
Running head: ACCOUNTING FOR MANAGERS
Accounting for Managers
Name of the Student:
Name of the University:
Authors Note:
Accounting for Managers
Name of the Student:
Name of the University:
Authors Note:
Paraphrase This Document
Need a fresh take? Get an instant paraphrase of this document with our AI Paraphraser
ACCOUNTING FOR MANAGERS
1
Table of Contents
C. Preparing Horizontal analysis of the Income Statement for Five years:...............................2
D. Calculating financial ratios of Woolworths from 2013 to 2017:..........................................3
E. Commenting on the profitability, efficiency, liquidity, financial gearing and investment
ratios of Woolworths from 2013 to 2017:..................................................................................9
Reference and Bibliography:....................................................................................................14
ACCOUNTING FOR MANAGERS
2
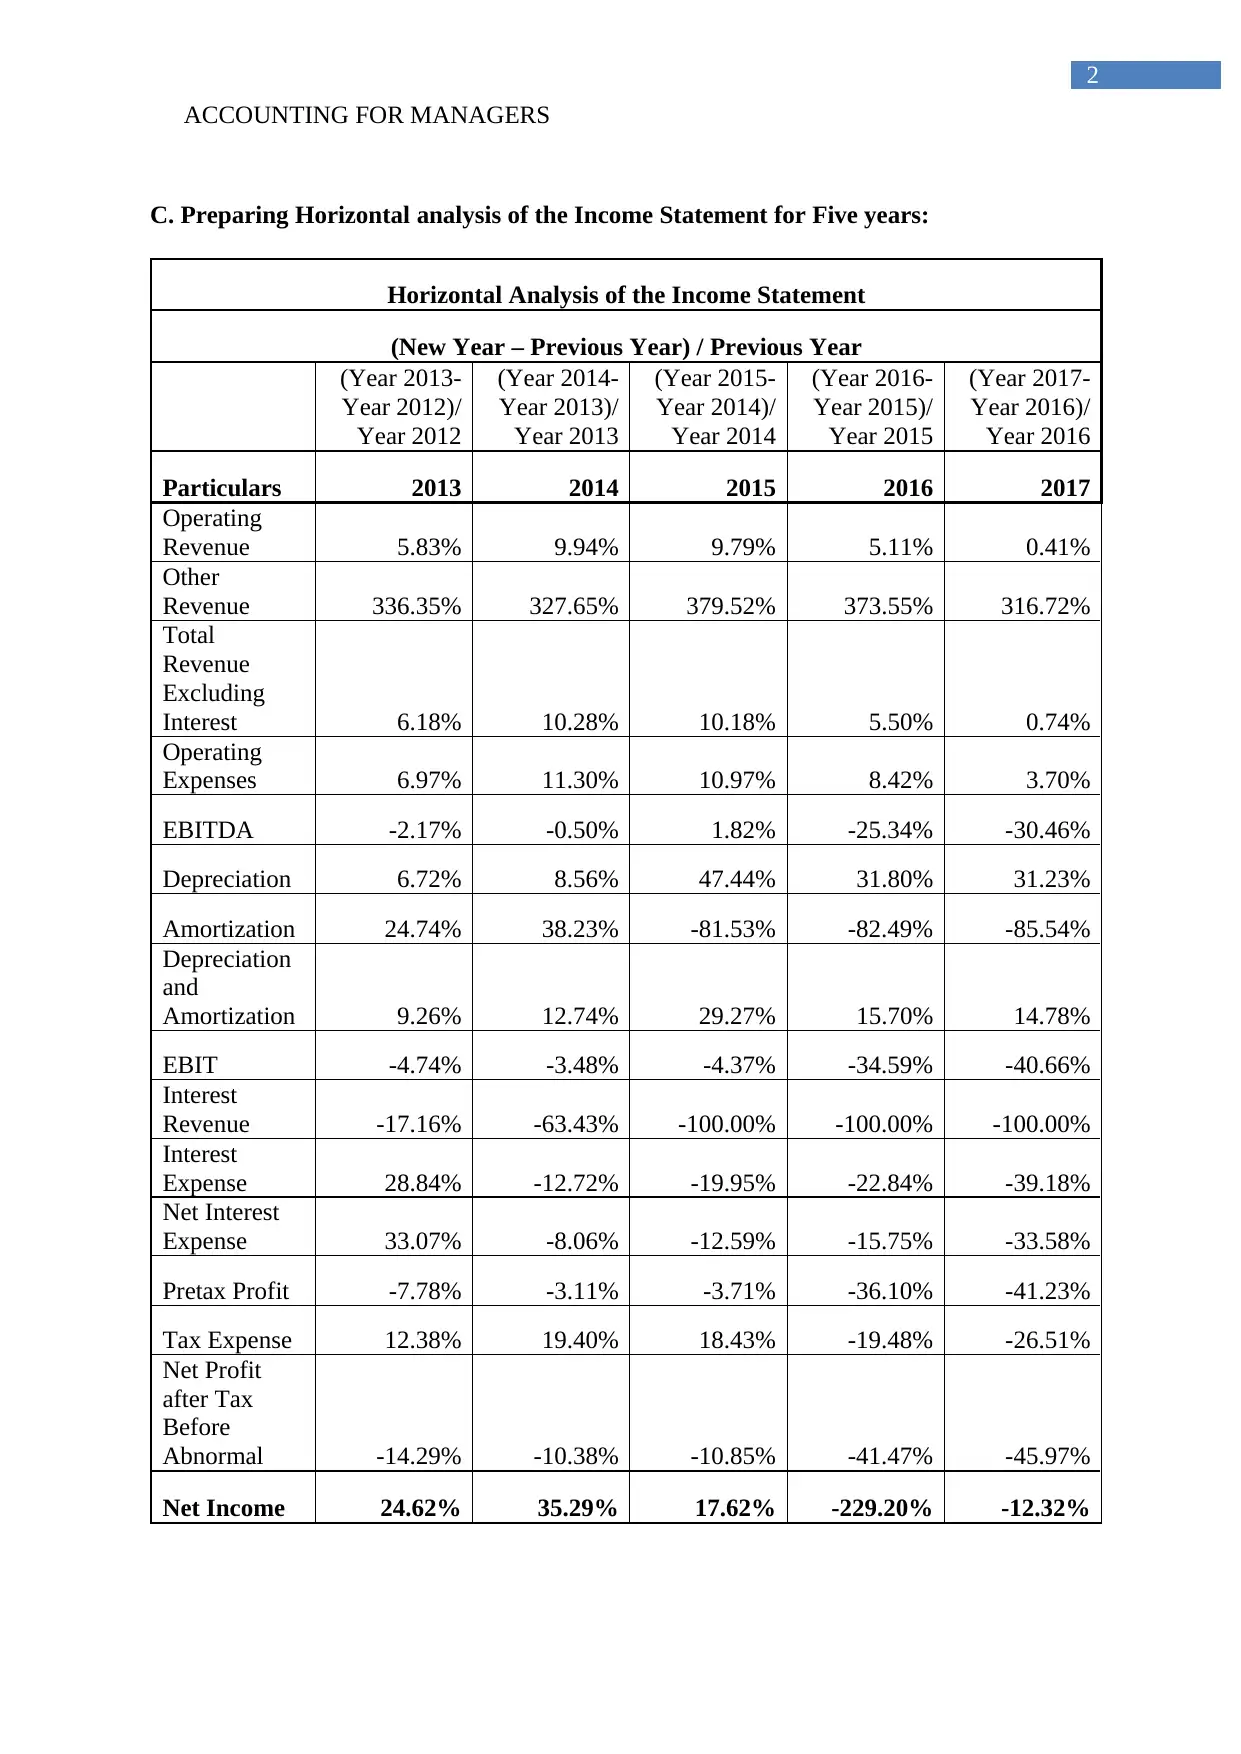
C. Preparing Horizontal analysis of the Income Statement for Five years:
Horizontal Analysis of the Income Statement
(New Year – Previous Year) / Previous Year
(Year 2013-
Year 2012)/
Year 2012
(Year 2014-
Year 2013)/
Year 2013
(Year 2015-
Year 2014)/
Year 2014
(Year 2016-
Year 2015)/
Year 2015
(Year 2017-
Year 2016)/
Year 2016
Particulars 2013 2014 2015 2016 2017
Operating
Revenue 5.83% 9.94% 9.79% 5.11% 0.41%
Other
Revenue 336.35% 327.65% 379.52% 373.55% 316.72%
Total
Revenue
Excluding
Interest 6.18% 10.28% 10.18% 5.50% 0.74%
Operating
Expenses 6.97% 11.30% 10.97% 8.42% 3.70%
EBITDA -2.17% -0.50% 1.82% -25.34% -30.46%
Depreciation 6.72% 8.56% 47.44% 31.80% 31.23%
Amortization 24.74% 38.23% -81.53% -82.49% -85.54%
Depreciation
and
Amortization 9.26% 12.74% 29.27% 15.70% 14.78%
EBIT -4.74% -3.48% -4.37% -34.59% -40.66%
Interest
Revenue -17.16% -63.43% -100.00% -100.00% -100.00%
Interest
Expense 28.84% -12.72% -19.95% -22.84% -39.18%
Net Interest
Expense 33.07% -8.06% -12.59% -15.75% -33.58%
Pretax Profit -7.78% -3.11% -3.71% -36.10% -41.23%
Tax Expense 12.38% 19.40% 18.43% -19.48% -26.51%
Net Profit
after Tax
Before
Abnormal -14.29% -10.38% -10.85% -41.47% -45.97%
Net Income 24.62% 35.29% 17.62% -229.20% -12.32%
2
C. Preparing Horizontal analysis of the Income Statement for Five years:
Horizontal Analysis of the Income Statement
(New Year – Previous Year) / Previous Year
(Year 2013-
Year 2012)/
Year 2012
(Year 2014-
Year 2013)/
Year 2013
(Year 2015-
Year 2014)/
Year 2014
(Year 2016-
Year 2015)/
Year 2015
(Year 2017-
Year 2016)/
Year 2016
Particulars 2013 2014 2015 2016 2017
Operating
Revenue 5.83% 9.94% 9.79% 5.11% 0.41%
Other
Revenue 336.35% 327.65% 379.52% 373.55% 316.72%
Total
Revenue
Excluding
Interest 6.18% 10.28% 10.18% 5.50% 0.74%
Operating
Expenses 6.97% 11.30% 10.97% 8.42% 3.70%
EBITDA -2.17% -0.50% 1.82% -25.34% -30.46%
Depreciation 6.72% 8.56% 47.44% 31.80% 31.23%
Amortization 24.74% 38.23% -81.53% -82.49% -85.54%
Depreciation
and
Amortization 9.26% 12.74% 29.27% 15.70% 14.78%
EBIT -4.74% -3.48% -4.37% -34.59% -40.66%
Interest
Revenue -17.16% -63.43% -100.00% -100.00% -100.00%
Interest
Expense 28.84% -12.72% -19.95% -22.84% -39.18%
Net Interest
Expense 33.07% -8.06% -12.59% -15.75% -33.58%
Pretax Profit -7.78% -3.11% -3.71% -36.10% -41.23%
Tax Expense 12.38% 19.40% 18.43% -19.48% -26.51%
Net Profit
after Tax
Before
Abnormal -14.29% -10.38% -10.85% -41.47% -45.97%
Net Income 24.62% 35.29% 17.62% -229.20% -12.32%
⊘ This is a preview!⊘
Do you want full access?
Subscribe today to unlock all pages.
Trusted by 1+ million students worldwide
ACCOUNTING FOR MANAGERS
3
The above table mainly represents the overall horizontal analysis of Woolworths
Income statement from 2013 to 2017. In addition, base year for the evaluation of horizontal
analysis is taken as 2012, which helps in understanding the progress made by Woolworths
over the period of five years. From the evaluation it is understood that total revenue of the
company has declined, which has forced the company to reduce its net income. Moreover, the
continuous decline in expenses is witnessed for the organisation, which only indicates the
measure is taken by the company in curbing the declining revenues. Hence, from the
evaluation it is seen that the progress of Woolworths has declined immensely from the level
of 24.62% in net income during 2013 to -12.32% in 2017. This mainly portrays the low
financial capability of the company is maintaining the level of income and generating high
rate of profits from operations. In this context, Saleh (2016) stated that investors with the help
of horizontal analysis is able to identify the level of income, which a company could obtain
over the period of time by conducting relevant actions. On the other hand, Berg and
Bjarnegard (2016) criticises that due to the unethical actions of the organisation in
manipulating their annual report, the projections made by the investors become invalid.
The management of Woolworths need to comply with the changing trend and
amendment their operations to increase revenue and generate adequate income to support its
expenses. The continuation of losses incurred during 2016 needs to be stopped by the
management of Woolworths for smoothly conducing their operations.
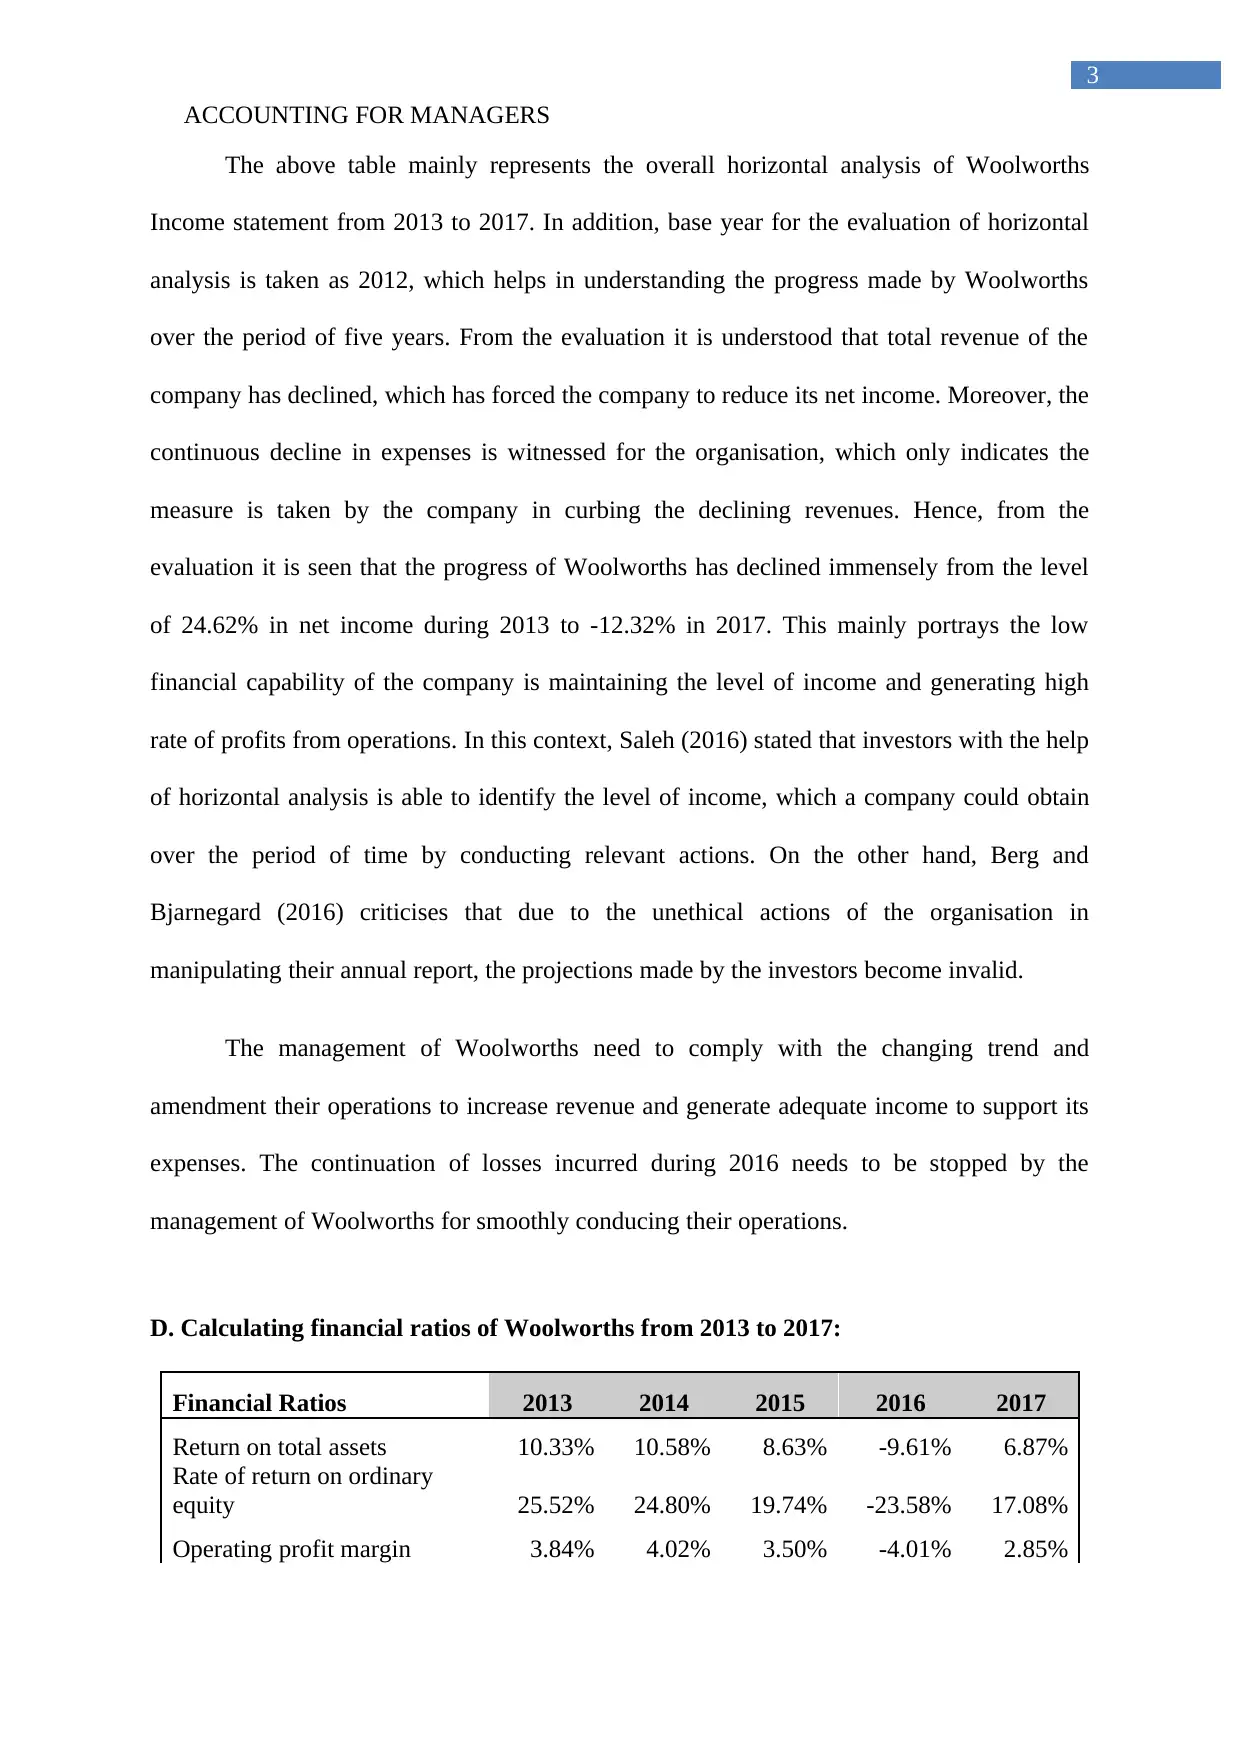
D. Calculating financial ratios of Woolworths from 2013 to 2017:
Financial Ratios 2013 2014 2015 2016 2017
Return on total assets 10.33% 10.58% 8.63% -9.61% 6.87%
Rate of return on ordinary
equity 25.52% 24.80% 19.74% -23.58% 17.08%
Operating profit margin 3.84% 4.02% 3.50% -4.01% 2.85%
3
The above table mainly represents the overall horizontal analysis of Woolworths
Income statement from 2013 to 2017. In addition, base year for the evaluation of horizontal
analysis is taken as 2012, which helps in understanding the progress made by Woolworths
over the period of five years. From the evaluation it is understood that total revenue of the
company has declined, which has forced the company to reduce its net income. Moreover, the
continuous decline in expenses is witnessed for the organisation, which only indicates the
measure is taken by the company in curbing the declining revenues. Hence, from the
evaluation it is seen that the progress of Woolworths has declined immensely from the level
of 24.62% in net income during 2013 to -12.32% in 2017. This mainly portrays the low
financial capability of the company is maintaining the level of income and generating high
rate of profits from operations. In this context, Saleh (2016) stated that investors with the help
of horizontal analysis is able to identify the level of income, which a company could obtain
over the period of time by conducting relevant actions. On the other hand, Berg and
Bjarnegard (2016) criticises that due to the unethical actions of the organisation in
manipulating their annual report, the projections made by the investors become invalid.
The management of Woolworths need to comply with the changing trend and
amendment their operations to increase revenue and generate adequate income to support its
expenses. The continuation of losses incurred during 2016 needs to be stopped by the
management of Woolworths for smoothly conducing their operations.
D. Calculating financial ratios of Woolworths from 2013 to 2017:
Financial Ratios 2013 2014 2015 2016 2017
Return on total assets 10.33% 10.58% 8.63% -9.61% 6.87%
Rate of return on ordinary
equity 25.52% 24.80% 19.74% -23.58% 17.08%
Operating profit margin 3.84% 4.02% 3.50% -4.01% 2.85%
Paraphrase This Document
Need a fresh take? Get an instant paraphrase of this document with our AI Paraphraser
ACCOUNTING FOR MANAGERS
4
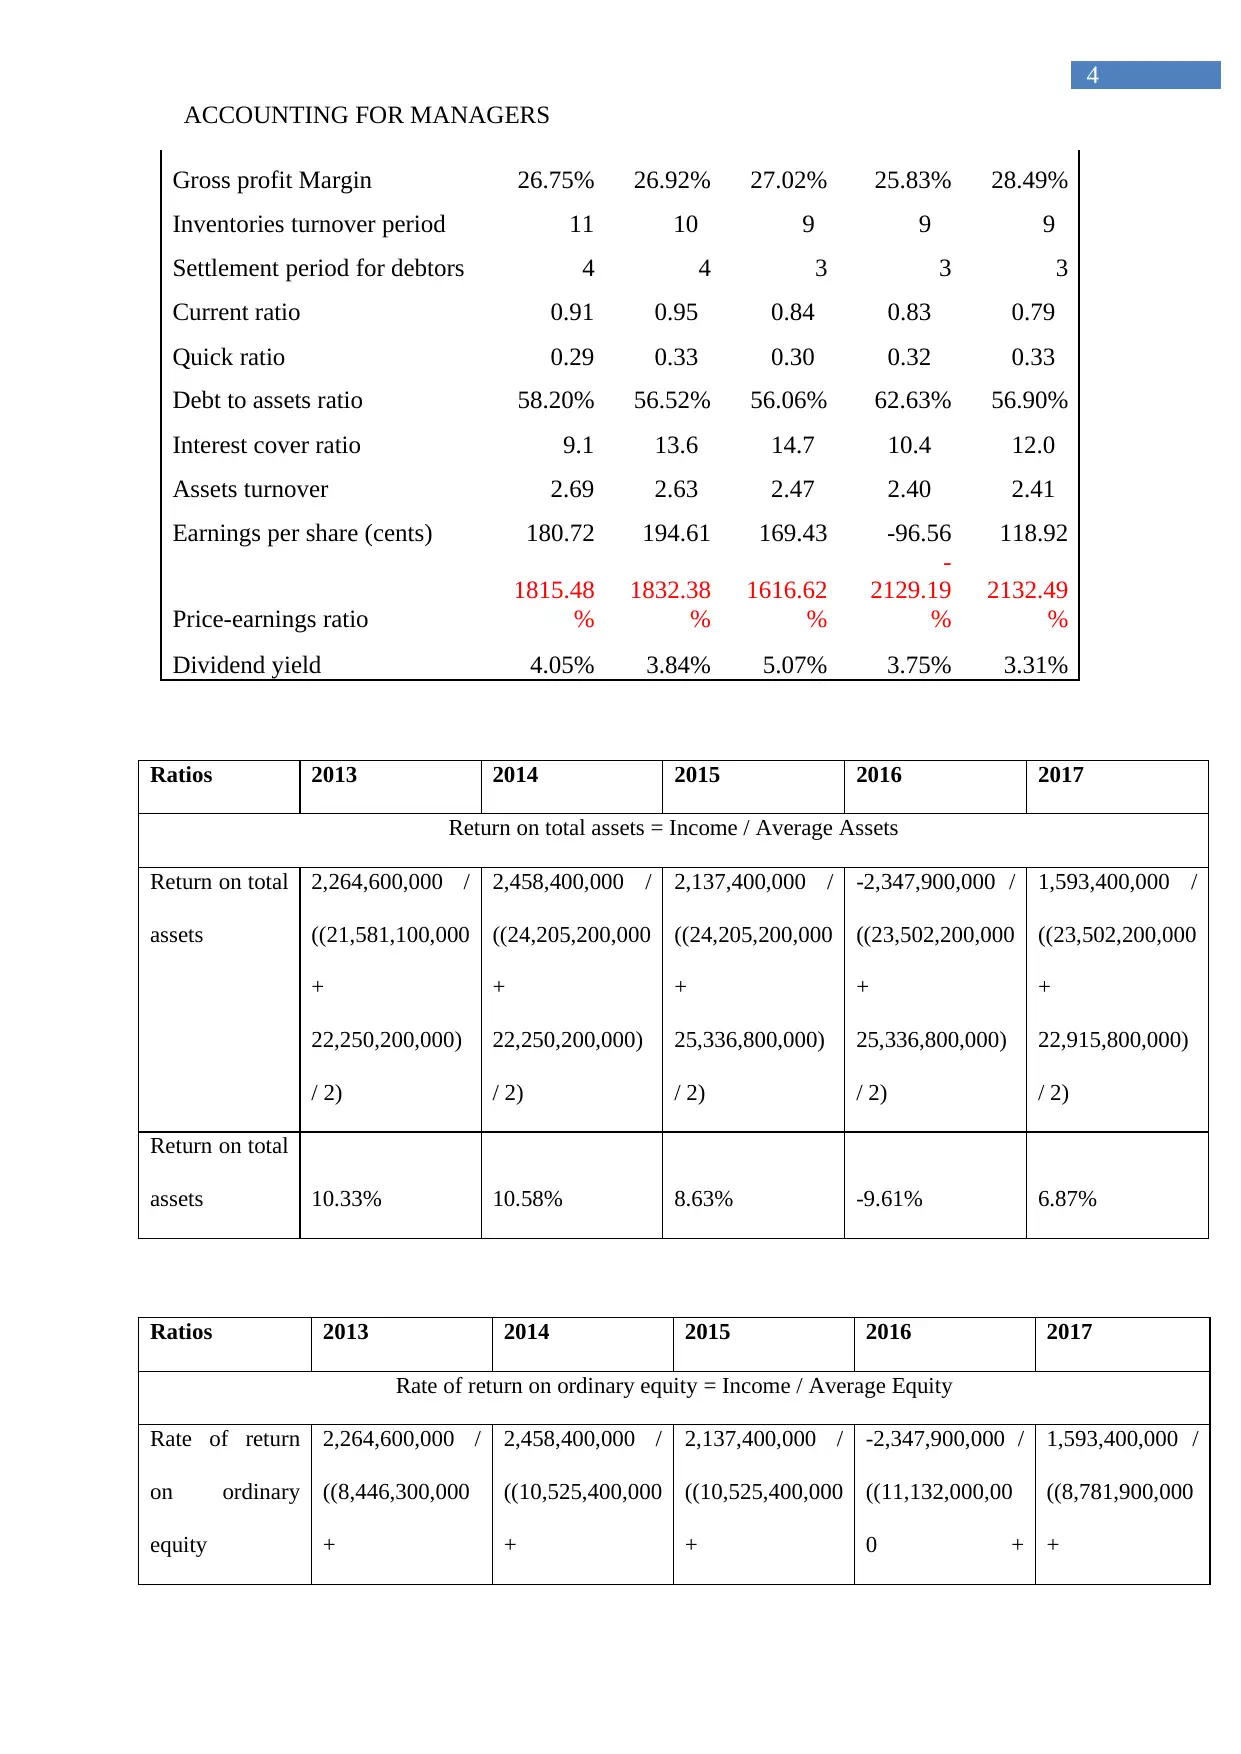
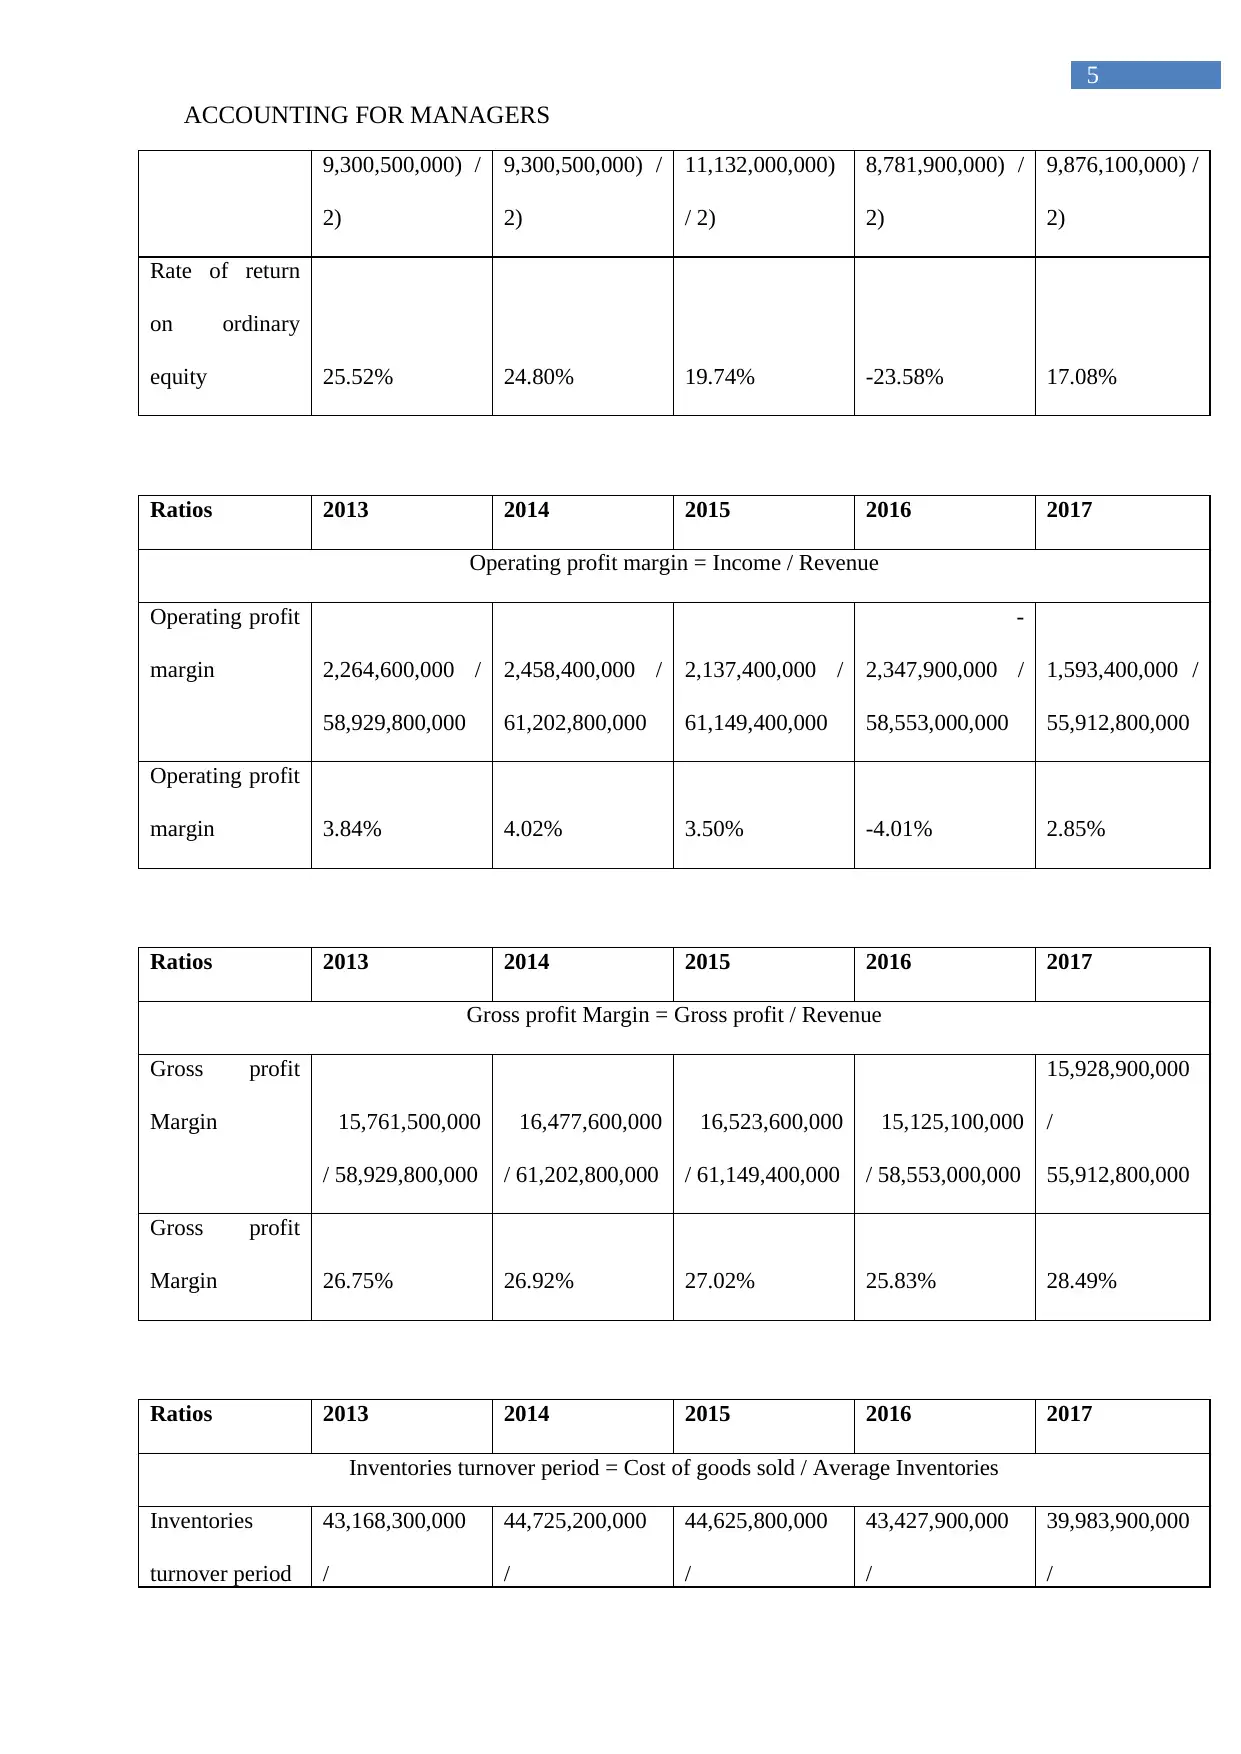
Gross profit Margin 26.75% 26.92% 27.02% 25.83% 28.49%
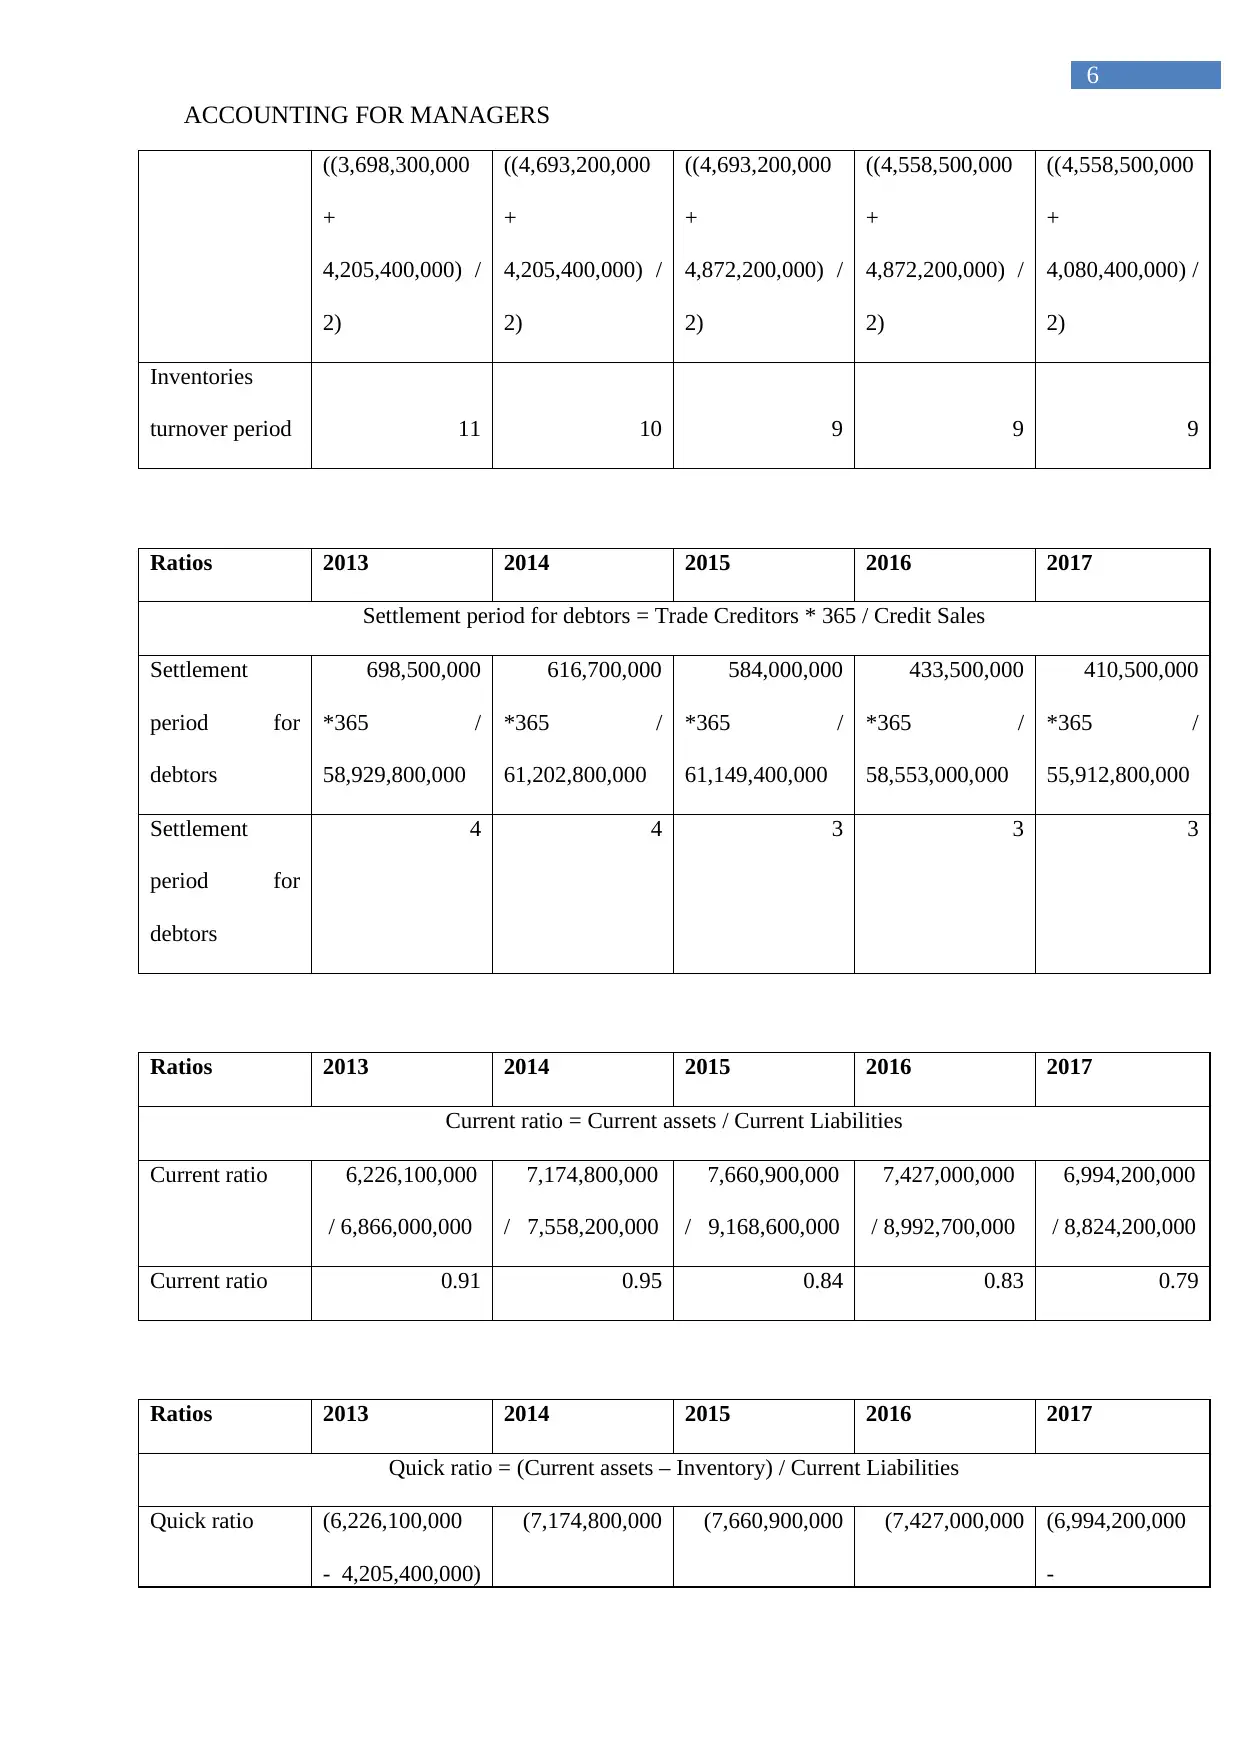
Inventories turnover period 11 10 9 9 9
Settlement period for debtors 4 4 3 3 3
Current ratio 0.91 0.95 0.84 0.83 0.79
Quick ratio 0.29 0.33 0.30 0.32 0.33
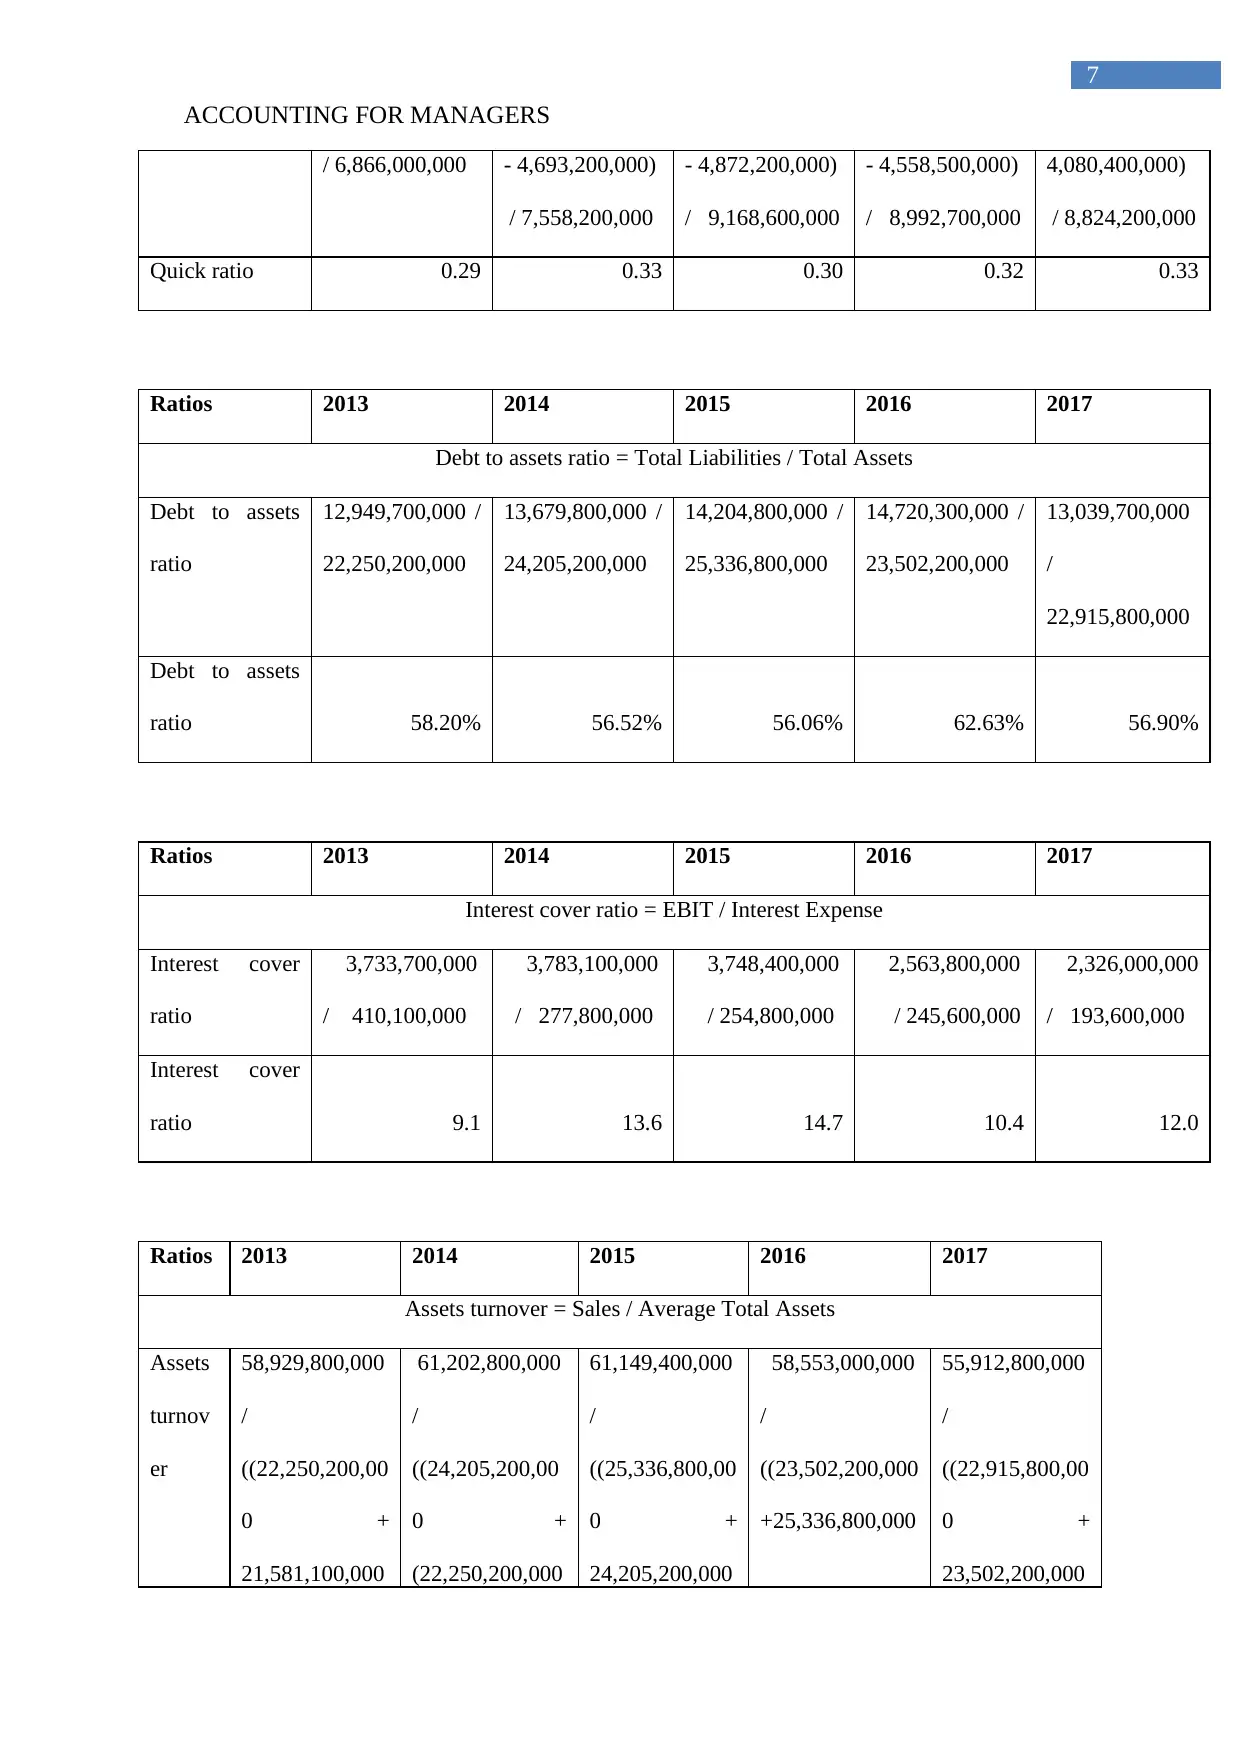
Debt to assets ratio 58.20% 56.52% 56.06% 62.63% 56.90%
Interest cover ratio 9.1 13.6 14.7 10.4 12.0
Assets turnover 2.69 2.63 2.47 2.40 2.41
Earnings per share (cents) 180.72 194.61 169.43 -96.56 118.92
Price-earnings ratio
1815.48
%
1832.38
%
1616.62
%
-
2129.19
%
2132.49
%
Dividend yield 4.05% 3.84% 5.07% 3.75% 3.31%
Ratios 2013 2014 2015 2016 2017
Return on total assets = Income / Average Assets
Return on total
assets
2,264,600,000 /
((21,581,100,000
+
22,250,200,000)
/ 2)
2,458,400,000 /
((24,205,200,000
+
22,250,200,000)
/ 2)
2,137,400,000 /
((24,205,200,000
+
25,336,800,000)
/ 2)
-2,347,900,000 /
((23,502,200,000
+
25,336,800,000)
/ 2)
1,593,400,000 /
((23,502,200,000
+
22,915,800,000)
/ 2)
Return on total
assets 10.33% 10.58% 8.63% -9.61% 6.87%
Ratios 2013 2014 2015 2016 2017
Rate of return on ordinary equity = Income / Average Equity
Rate of return
on ordinary
equity
2,264,600,000 /
((8,446,300,000
+
2,458,400,000 /
((10,525,400,000
+
2,137,400,000 /
((10,525,400,000
+
-2,347,900,000 /
((11,132,000,00
0 +
1,593,400,000 /
((8,781,900,000
+
4
Gross profit Margin 26.75% 26.92% 27.02% 25.83% 28.49%
Inventories turnover period 11 10 9 9 9
Settlement period for debtors 4 4 3 3 3
Current ratio 0.91 0.95 0.84 0.83 0.79
Quick ratio 0.29 0.33 0.30 0.32 0.33
Debt to assets ratio 58.20% 56.52% 56.06% 62.63% 56.90%
Interest cover ratio 9.1 13.6 14.7 10.4 12.0
Assets turnover 2.69 2.63 2.47 2.40 2.41
Earnings per share (cents) 180.72 194.61 169.43 -96.56 118.92
Price-earnings ratio
1815.48
%
1832.38
%
1616.62
%
-
2129.19
%
2132.49
%
Dividend yield 4.05% 3.84% 5.07% 3.75% 3.31%
Ratios 2013 2014 2015 2016 2017
Return on total assets = Income / Average Assets
Return on total
assets
2,264,600,000 /
((21,581,100,000
+
22,250,200,000)
/ 2)
2,458,400,000 /
((24,205,200,000
+
22,250,200,000)
/ 2)
2,137,400,000 /
((24,205,200,000
+
25,336,800,000)
/ 2)
-2,347,900,000 /
((23,502,200,000
+
25,336,800,000)
/ 2)
1,593,400,000 /
((23,502,200,000
+
22,915,800,000)
/ 2)
Return on total
assets 10.33% 10.58% 8.63% -9.61% 6.87%
Ratios 2013 2014 2015 2016 2017
Rate of return on ordinary equity = Income / Average Equity
Rate of return
on ordinary
equity
2,264,600,000 /
((8,446,300,000
+
2,458,400,000 /
((10,525,400,000
+
2,137,400,000 /
((10,525,400,000
+
-2,347,900,000 /
((11,132,000,00
0 +
1,593,400,000 /
((8,781,900,000
+
ACCOUNTING FOR MANAGERS
5
9,300,500,000) /
2)
9,300,500,000) /
2)
11,132,000,000)
/ 2)
8,781,900,000) /
2)
9,876,100,000) /
2)
Rate of return
on ordinary
equity 25.52% 24.80% 19.74% -23.58% 17.08%
Ratios 2013 2014 2015 2016 2017
Operating profit margin = Income / Revenue
Operating profit
margin 2,264,600,000 /
58,929,800,000
2,458,400,000 /
61,202,800,000
2,137,400,000 /
61,149,400,000
-
2,347,900,000 /
58,553,000,000
1,593,400,000 /
55,912,800,000
Operating profit
margin 3.84% 4.02% 3.50% -4.01% 2.85%
Ratios 2013 2014 2015 2016 2017
Gross profit Margin = Gross profit / Revenue
Gross profit
Margin 15,761,500,000
/ 58,929,800,000
16,477,600,000
/ 61,202,800,000
16,523,600,000
/ 61,149,400,000
15,125,100,000
/ 58,553,000,000
15,928,900,000
/
55,912,800,000
Gross profit
Margin 26.75% 26.92% 27.02% 25.83% 28.49%
Ratios 2013 2014 2015 2016 2017
Inventories turnover period = Cost of goods sold / Average Inventories
Inventories
turnover period
43,168,300,000
/
44,725,200,000
/
44,625,800,000
/
43,427,900,000
/
39,983,900,000
/
⊘ This is a preview!⊘
Do you want full access?
Subscribe today to unlock all pages.
Trusted by 1+ million students worldwide
ACCOUNTING FOR MANAGERS
6
((3,698,300,000
+
4,205,400,000) /
2)
((4,693,200,000
+
4,205,400,000) /
2)
((4,693,200,000
+
4,872,200,000) /
2)
((4,558,500,000
+
4,872,200,000) /
2)
((4,558,500,000
+
4,080,400,000) /
2)
Inventories
turnover period 11 10 9 9 9
Ratios 2013 2014 2015 2016 2017
Settlement period for debtors = Trade Creditors * 365 / Credit Sales
Settlement
period for
debtors
698,500,000
*365 /
58,929,800,000
616,700,000
*365 /
61,202,800,000
584,000,000
*365 /
61,149,400,000
433,500,000
*365 /
58,553,000,000
410,500,000
*365 /
55,912,800,000
Settlement
period for
debtors
4 4 3 3 3
Ratios 2013 2014 2015 2016 2017
Current ratio = Current assets / Current Liabilities
Current ratio 6,226,100,000
/ 6,866,000,000
7,174,800,000
/ 7,558,200,000
7,660,900,000
/ 9,168,600,000
7,427,000,000
/ 8,992,700,000
6,994,200,000
/ 8,824,200,000
Current ratio 0.91 0.95 0.84 0.83 0.79
Ratios 2013 2014 2015 2016 2017
Quick ratio = (Current assets – Inventory) / Current Liabilities
Quick ratio (6,226,100,000
- 4,205,400,000)
(7,174,800,000 (7,660,900,000 (7,427,000,000 (6,994,200,000
-
Paraphrase This Document
Need a fresh take? Get an instant paraphrase of this document with our AI Paraphraser
ACCOUNTING FOR MANAGERS
7
/ 6,866,000,000 - 4,693,200,000)
/ 7,558,200,000
- 4,872,200,000)
/ 9,168,600,000
- 4,558,500,000)
/ 8,992,700,000
4,080,400,000)
/ 8,824,200,000
Quick ratio 0.29 0.33 0.30 0.32 0.33
Ratios 2013 2014 2015 2016 2017
Debt to assets ratio = Total Liabilities / Total Assets
Debt to assets
ratio
12,949,700,000 /
22,250,200,000
13,679,800,000 /
24,205,200,000
14,204,800,000 /
25,336,800,000
14,720,300,000 /
23,502,200,000
13,039,700,000
/
22,915,800,000
Debt to assets
ratio 58.20% 56.52% 56.06% 62.63% 56.90%
Ratios 2013 2014 2015 2016 2017
Interest cover ratio = EBIT / Interest Expense
Interest cover
ratio
3,733,700,000
/ 410,100,000
3,783,100,000
/ 277,800,000
3,748,400,000
/ 254,800,000
2,563,800,000
/ 245,600,000
2,326,000,000
/ 193,600,000
Interest cover
ratio 9.1 13.6 14.7 10.4 12.0
Ratios 2013 2014 2015 2016 2017
Assets turnover = Sales / Average Total Assets
Assets
turnov
er
58,929,800,000
/
((22,250,200,00
0 +
21,581,100,000
61,202,800,000
/
((24,205,200,00
0 +
(22,250,200,000
61,149,400,000
/
((25,336,800,00
0 +
24,205,200,000
58,553,000,000
/
((23,502,200,000
+25,336,800,000
55,912,800,000
/
((22,915,800,00
0 +
23,502,200,000
ACCOUNTING FOR MANAGERS
8
)/2) )/2) )/2) )/2) )/2)
Assets
turnov
er
2.69 2.63 2.47 2.40 2.41
Ratios 2013 2014 2015 2016 2017
Earnings Per share = (Net income / Shares outstanding)
Earnings Per
share
(2,264,600,00
0.00
-
5,200,000.00)
/
1,250,200,000
.00
(2,458,400,00
0.00
-
6,700,000.00)
/
1,259,800,000
.00
(2,137,400,00
0.00
+
8,600,000.00)
/
1,266,615,199
.00
(-
2,347,900,000.0
0 +
1,113,100,000.0
0) /
1,278,758,725.0
0
(1,593,400,00
0.00
-
59,900,000.00
) /
1,289,500,000
.00
Earnings Per
share 1.81 1.95 1.69 -0.97 1.19
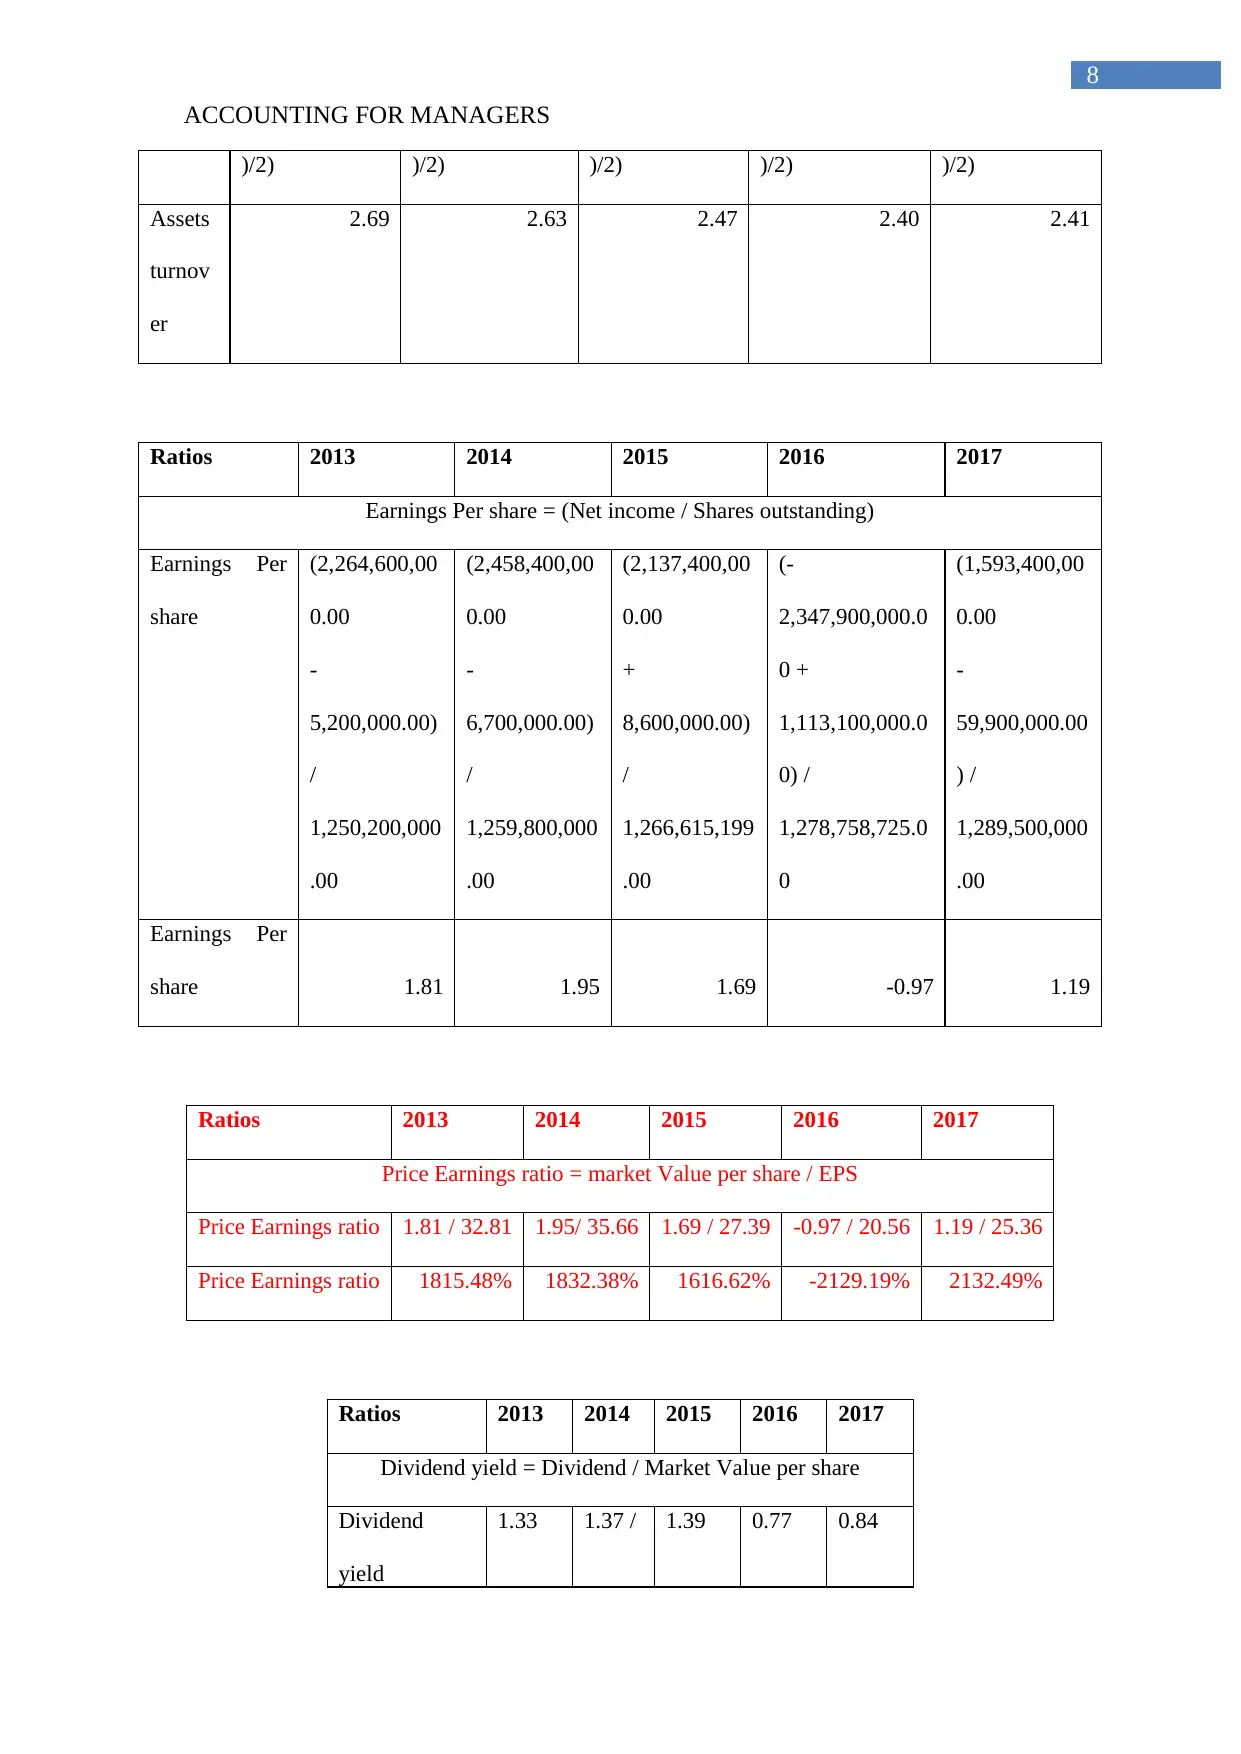
Ratios 2013 2014 2015 2016 2017
Price Earnings ratio = market Value per share / EPS
Price Earnings ratio 1.81 / 32.81 1.95/ 35.66 1.69 / 27.39 -0.97 / 20.56 1.19 / 25.36
Price Earnings ratio 1815.48% 1832.38% 1616.62% -2129.19% 2132.49%
Ratios 2013 2014 2015 2016 2017
Dividend yield = Dividend / Market Value per share
Dividend
yield
1.33 1.37 / 1.39 0.77 0.84
8
)/2) )/2) )/2) )/2) )/2)
Assets
turnov
er
2.69 2.63 2.47 2.40 2.41
Ratios 2013 2014 2015 2016 2017
Earnings Per share = (Net income / Shares outstanding)
Earnings Per
share
(2,264,600,00
0.00
-
5,200,000.00)
/
1,250,200,000
.00
(2,458,400,00
0.00
-
6,700,000.00)
/
1,259,800,000
.00
(2,137,400,00
0.00
+
8,600,000.00)
/
1,266,615,199
.00
(-
2,347,900,000.0
0 +
1,113,100,000.0
0) /
1,278,758,725.0
0
(1,593,400,00
0.00
-
59,900,000.00
) /
1,289,500,000
.00
Earnings Per
share 1.81 1.95 1.69 -0.97 1.19
Ratios 2013 2014 2015 2016 2017
Price Earnings ratio = market Value per share / EPS
Price Earnings ratio 1.81 / 32.81 1.95/ 35.66 1.69 / 27.39 -0.97 / 20.56 1.19 / 25.36
Price Earnings ratio 1815.48% 1832.38% 1616.62% -2129.19% 2132.49%
Ratios 2013 2014 2015 2016 2017
Dividend yield = Dividend / Market Value per share
Dividend
yield
1.33 1.37 / 1.39 0.77 0.84
⊘ This is a preview!⊘
Do you want full access?
Subscribe today to unlock all pages.
Trusted by 1+ million students worldwide
ACCOUNTING FOR MANAGERS
9
/ 32.81 35.66 /
27.39
/ 20.56 / 25.36
Dividend
yield 4.05% 3.84% 5.07% 3.75% 3.31%
E. Commenting on the profitability, efficiency, liquidity, financial gearing and
investment ratios of Woolworths from 2013 to 2017:
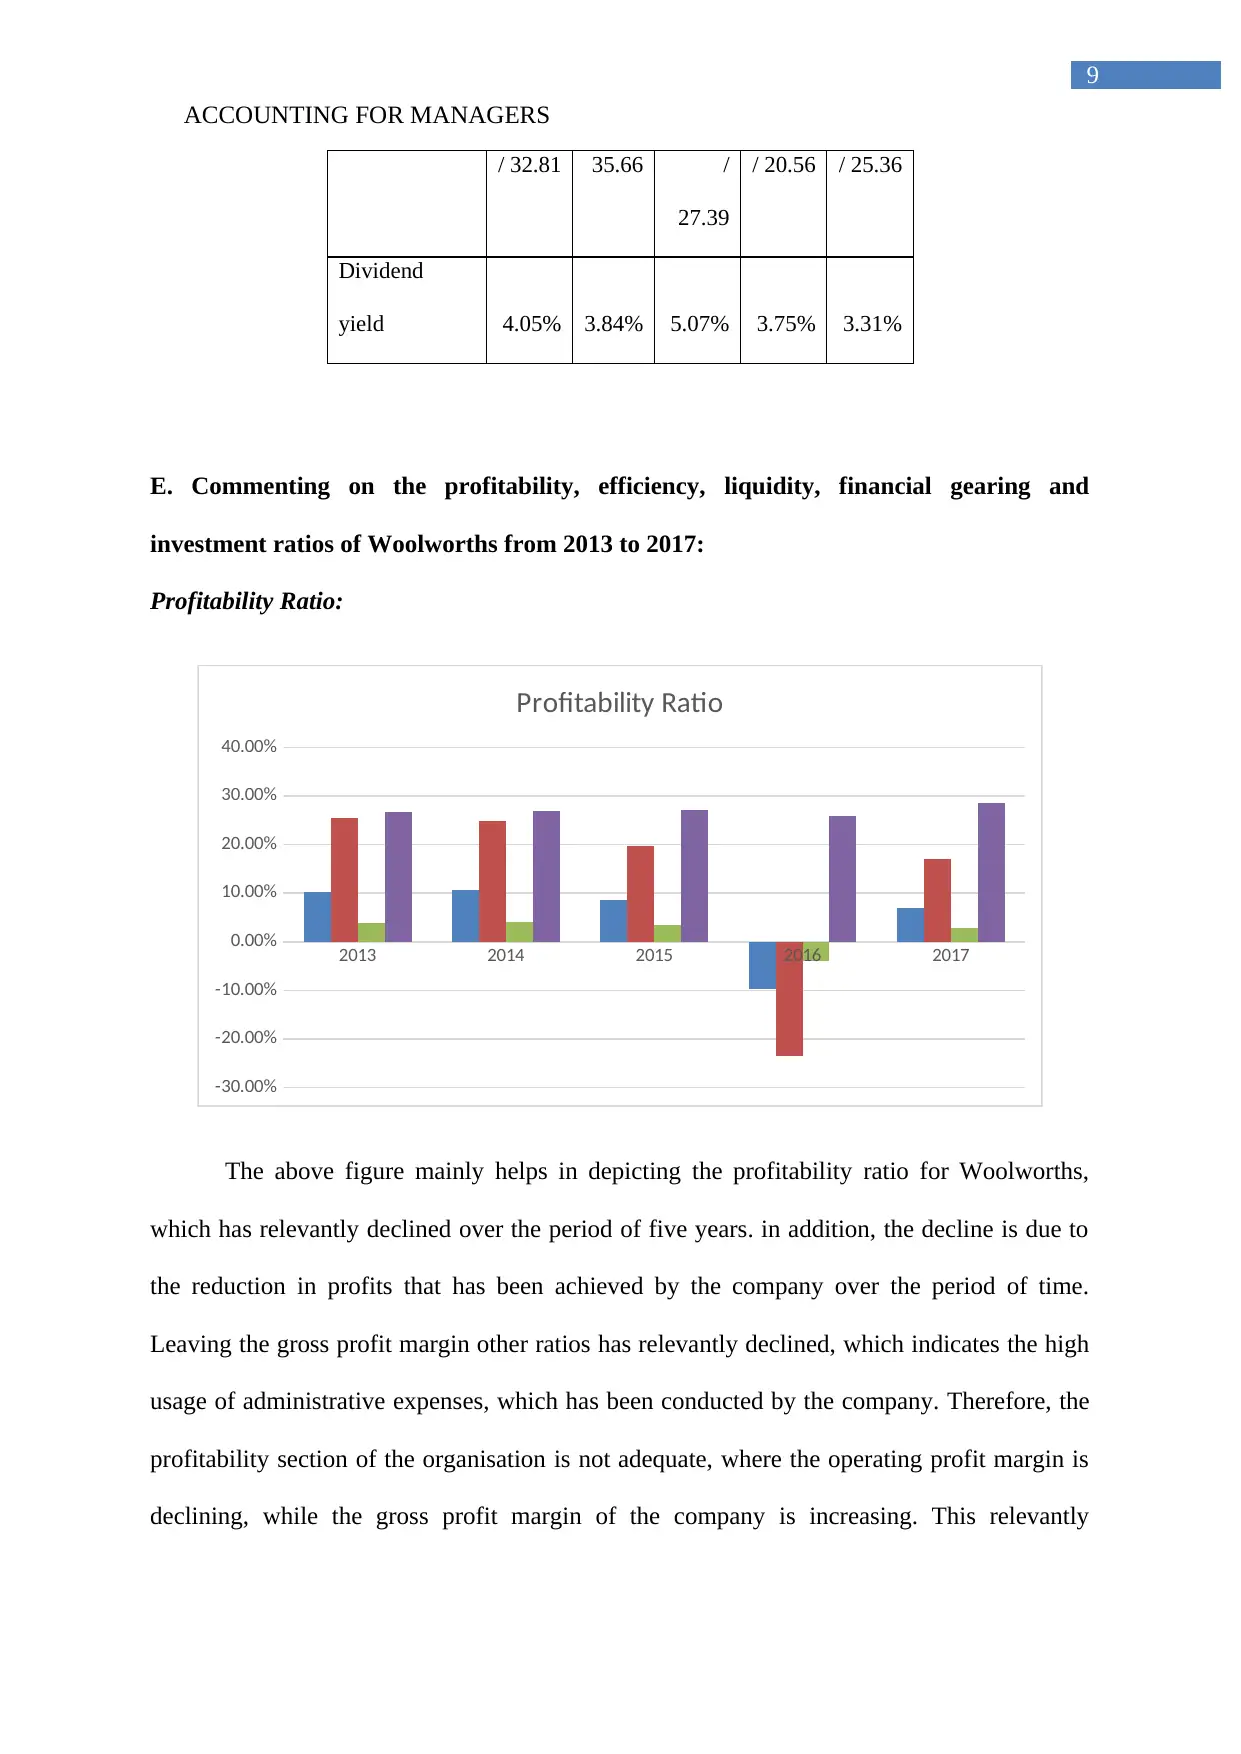
Profitability Ratio:
2013 2014 2015 2016 2017
-30.00%
-20.00%
-10.00%
0.00%
10.00%
20.00%
30.00%
40.00%
Profitability Ratio
The above figure mainly helps in depicting the profitability ratio for Woolworths,
which has relevantly declined over the period of five years. in addition, the decline is due to
the reduction in profits that has been achieved by the company over the period of time.
Leaving the gross profit margin other ratios has relevantly declined, which indicates the high
usage of administrative expenses, which has been conducted by the company. Therefore, the
profitability section of the organisation is not adequate, where the operating profit margin is
declining, while the gross profit margin of the company is increasing. This relevantly
9
/ 32.81 35.66 /
27.39
/ 20.56 / 25.36
Dividend
yield 4.05% 3.84% 5.07% 3.75% 3.31%
E. Commenting on the profitability, efficiency, liquidity, financial gearing and
investment ratios of Woolworths from 2013 to 2017:
Profitability Ratio:
2013 2014 2015 2016 2017
-30.00%
-20.00%
-10.00%
0.00%
10.00%
20.00%
30.00%
40.00%
Profitability Ratio
The above figure mainly helps in depicting the profitability ratio for Woolworths,
which has relevantly declined over the period of five years. in addition, the decline is due to
the reduction in profits that has been achieved by the company over the period of time.
Leaving the gross profit margin other ratios has relevantly declined, which indicates the high
usage of administrative expenses, which has been conducted by the company. Therefore, the
profitability section of the organisation is not adequate, where the operating profit margin is
declining, while the gross profit margin of the company is increasing. This relevantly
Paraphrase This Document
Need a fresh take? Get an instant paraphrase of this document with our AI Paraphraser
ACCOUNTING FOR MANAGERS
10
indicates that the company is controlling its expenses in cost of sales, while increasing its
spending in administrative expenses (Soares and Pina 2017).
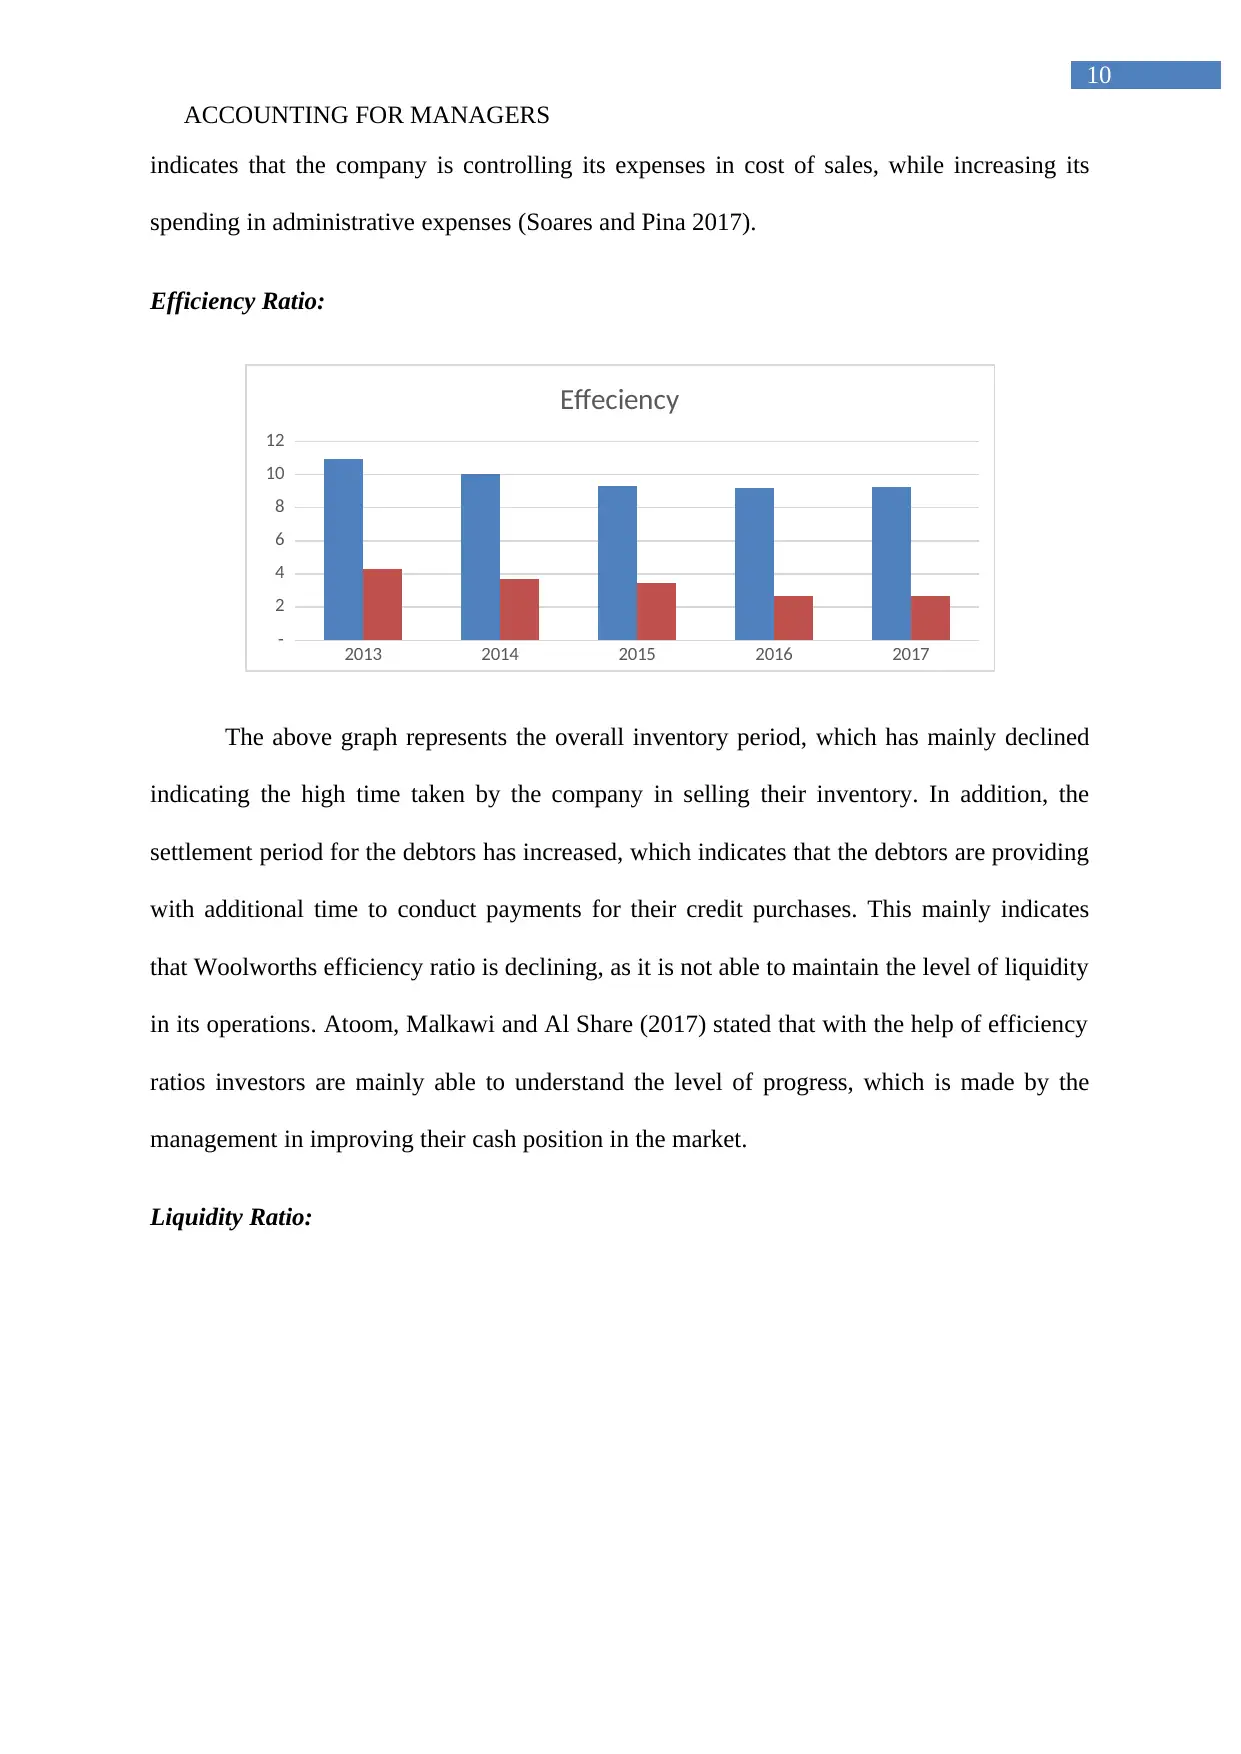
Efficiency Ratio:
2013 2014 2015 2016 2017
-
2
4
6
8
10
12
Effeciency
The above graph represents the overall inventory period, which has mainly declined
indicating the high time taken by the company in selling their inventory. In addition, the
settlement period for the debtors has increased, which indicates that the debtors are providing
with additional time to conduct payments for their credit purchases. This mainly indicates
that Woolworths efficiency ratio is declining, as it is not able to maintain the level of liquidity
in its operations. Atoom, Malkawi and Al Share (2017) stated that with the help of efficiency
ratios investors are mainly able to understand the level of progress, which is made by the
management in improving their cash position in the market.
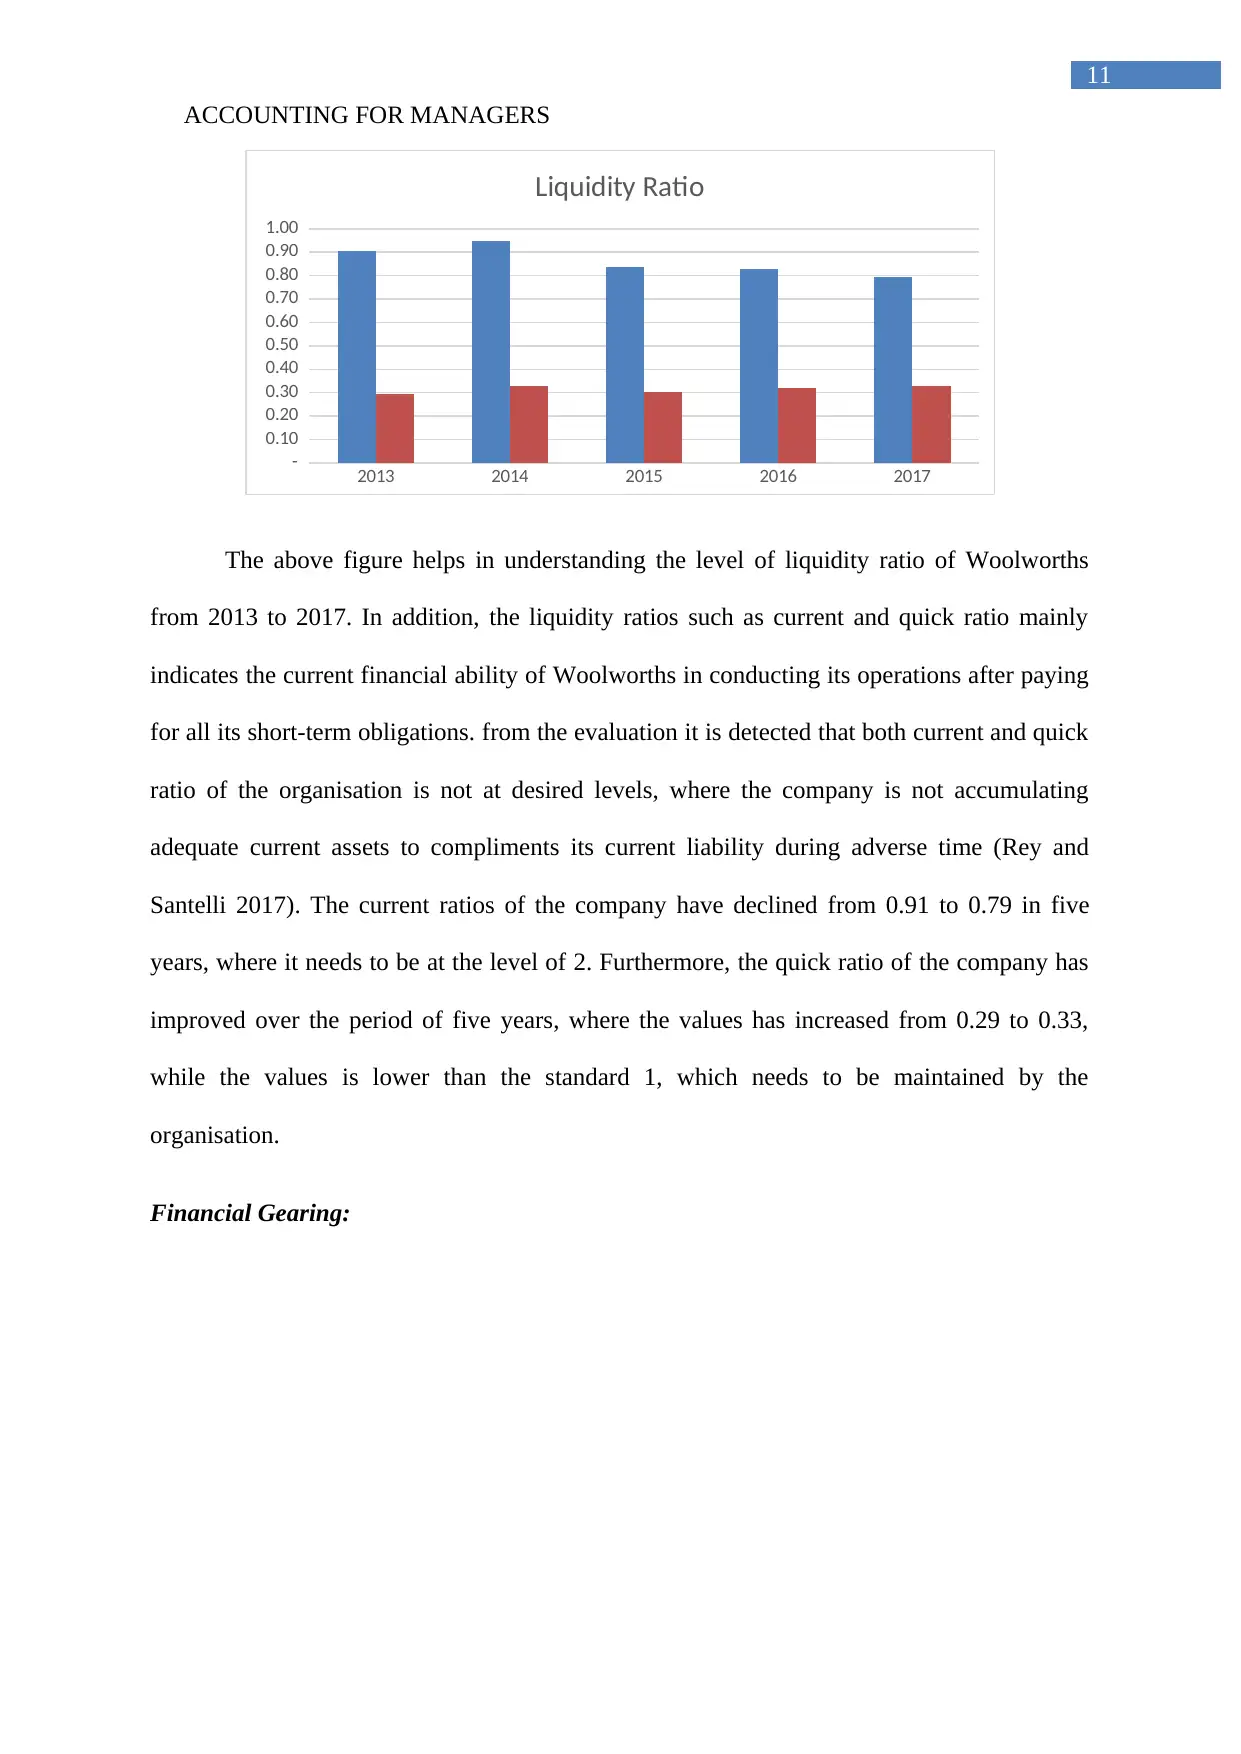
Liquidity Ratio:
10
indicates that the company is controlling its expenses in cost of sales, while increasing its
spending in administrative expenses (Soares and Pina 2017).
Efficiency Ratio:
2013 2014 2015 2016 2017
-
2
4
6
8
10
12
Effeciency
The above graph represents the overall inventory period, which has mainly declined
indicating the high time taken by the company in selling their inventory. In addition, the
settlement period for the debtors has increased, which indicates that the debtors are providing
with additional time to conduct payments for their credit purchases. This mainly indicates
that Woolworths efficiency ratio is declining, as it is not able to maintain the level of liquidity
in its operations. Atoom, Malkawi and Al Share (2017) stated that with the help of efficiency
ratios investors are mainly able to understand the level of progress, which is made by the
management in improving their cash position in the market.
Liquidity Ratio:
ACCOUNTING FOR MANAGERS
11
2013 2014 2015 2016 2017
-
0.10
0.20
0.30
0.40
0.50
0.60
0.70
0.80
0.90
1.00
Liquidity Ratio
The above figure helps in understanding the level of liquidity ratio of Woolworths
from 2013 to 2017. In addition, the liquidity ratios such as current and quick ratio mainly
indicates the current financial ability of Woolworths in conducting its operations after paying
for all its short-term obligations. from the evaluation it is detected that both current and quick
ratio of the organisation is not at desired levels, where the company is not accumulating
adequate current assets to compliments its current liability during adverse time (Rey and
Santelli 2017). The current ratios of the company have declined from 0.91 to 0.79 in five
years, where it needs to be at the level of 2. Furthermore, the quick ratio of the company has
improved over the period of five years, where the values has increased from 0.29 to 0.33,
while the values is lower than the standard 1, which needs to be maintained by the
organisation.
Financial Gearing:
⊘ This is a preview!⊘
Do you want full access?
Subscribe today to unlock all pages.
Trusted by 1+ million students worldwide
1 out of 16
Related Documents


Your All-in-One AI-Powered Toolkit for Academic Success.
+13062052269
info@desklib.com
Available 24*7 on WhatsApp / Email
![[object Object]](/_next/static/media/star-bottom.7253800d.svg)
Unlock your academic potential
Copyright © 2020–2026 A2Z Services. All Rights Reserved. Developed and managed by ZUCOL.