Finance Report: Financial Ratio Analysis and Investment Appraisal
VerifiedAdded on 2023/06/04
|16
|3493
|148
Report
AI Summary
This finance report provides a comprehensive analysis of various financial aspects. It begins with an introduction to finance and then delves into detailed calculations of financial ratios, including gross profit margin, asset usage ratio, and current ratio, offering interpretations and insights into their significance. The report also covers the importance of considering the audience for financial statement analysis. Furthermore, it includes the preparation of a monthly cash budget, break-even point calculations, and margin of safety analysis. The report then proceeds to investment appraisal techniques, calculating payback period, net present value (NPV), and accounting rate of return (ARR) for different investment options, culminating in recommendations on which projects to undertake and discussions on improving investment appraisal approaches. The report, contributed by a student, is available on Desklib, a platform for AI-based study tools.

Introduction to finance
Contents
Contents
Paraphrase This Document
Need a fresh take? Get an instant paraphrase of this document with our AI Paraphraser
INTRODUCTION...........................................................................................................................3
MAIN BODY...................................................................................................................................3
Question 1........................................................................................................................................3
a) Calculation of financial ratios............................................................................................3
b) The importance of considering the audience for financial statement analysis...................5
Question 2........................................................................................................................................5
a) Opening statement of financial position.............................................................................5
b ) monthly cash budget for 6 months....................................................................................6
c) Description of additional expenditure................................................................................7
Question 3........................................................................................................................................7
a) Calculation of breakeven point...........................................................................................7
b) Margin of safety ( MOS ) for the year ended 2019 and 2020............................................8
c) Analysis about new strategy formed by Jessica.................................................................9
Question 4........................................................................................................................................9
Calculation of payback period, NPV and ARR......................................................................9
Analysis for the project that should be undertaken..............................................................12
Approaches to investment appraisals and their improvement..............................................13
CONCLUSION..............................................................................................................................14
REFERENCES..............................................................................................................................16
INTRODUCTION
Finance is the understanding and discipline of cash, currencies, and assets. It is associated
to, but not identical with, economics, the education of the manufacture, distribution, and
ingesting of cash, capital assets, goods, and services. Since financial activities take place in the
system of finance in numerous sectors, the sectors can be broadly categorised into personal
finance, corporate finance and public finance. Accounting for financial management is the
maintenance frequently related with CFO and finance branch of the organisation. These type of
services mainly encompass looking into the future by converting a plan for business into a
budget or a financial model and assist an organisation to manage its plan (Atrill and Lindley,
2019). This report contains the calculation of numerous ratios and their analysis, preparing cash
budget, and analysis for NPV.
MAIN BODY
Question 1
a) Calculation of financial ratios
Gross profit margin = ( sales - COGS ) * 100 / sales
= ( 3495 – 2182 ) * 100 / 3495
= ( 1313 / 3495 ) * 100
= 37.57 %
Assets usage ratio = total sales / average total assets
= 3495 / [( 3812 + 2503 ) / 2]
= 3495 / 3157.5
= 1.10 times
Current ratio = current assets / current liabilities
= 1687 / 744
= 2.27 times
Acid test ratio = ( Current asset – stock ) / current liability
= ( 1687 – 150 ) / 744
= 1537 / 744
⊘ This is a preview!⊘
Do you want full access?
Subscribe today to unlock all pages.
Trusted by 1+ million students worldwide
= 2.06 times
Inventory holding period = ( average inventory / cost of goods sold ) * 365
= [( 150 + 102 ) / 2 ] / 2182 * 365
= ( 126 / 2182 ) * 365
= 21.08 days
Debt to equity ratio = total debts / total equity
= 170 / 2898
= 0.058 times
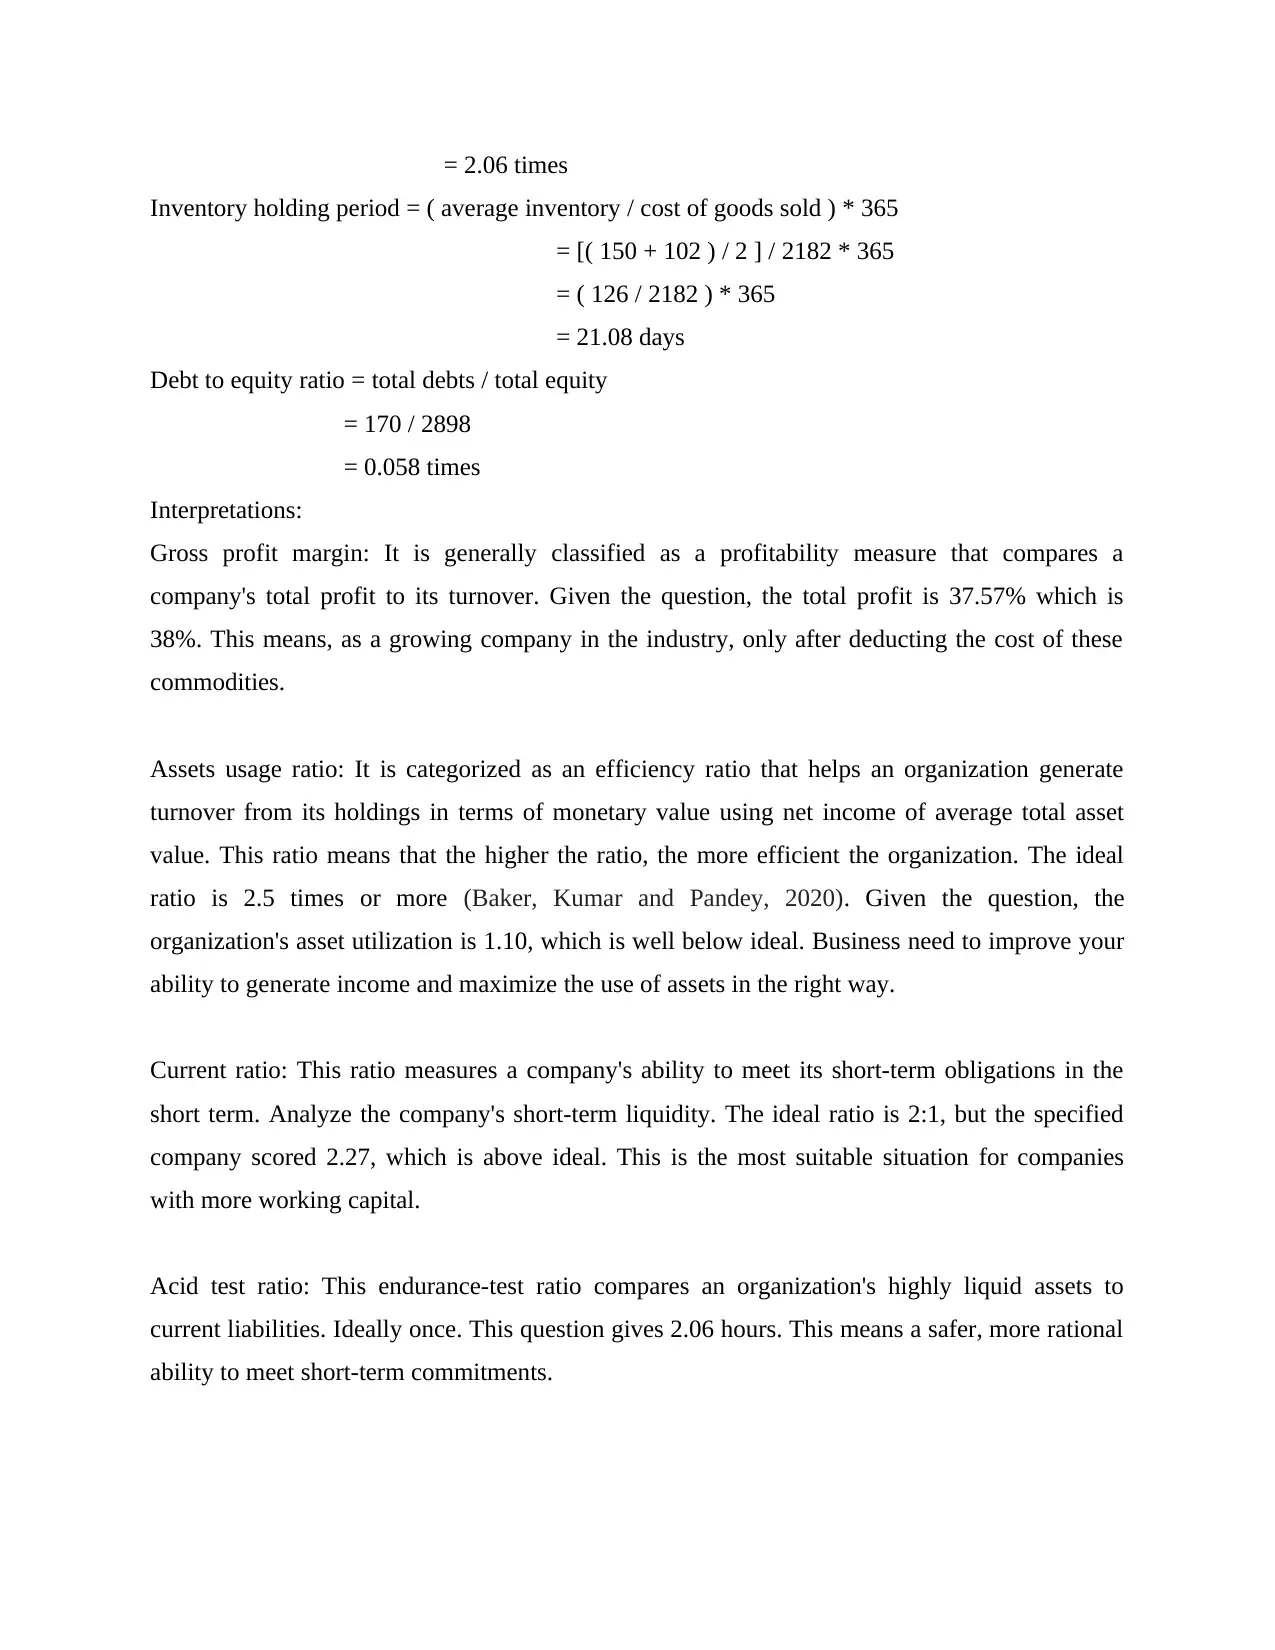
Interpretations:
Gross profit margin: It is generally classified as a profitability measure that compares a
company's total profit to its turnover. Given the question, the total profit is 37.57% which is
38%. This means, as a growing company in the industry, only after deducting the cost of these
commodities.
Assets usage ratio: It is categorized as an efficiency ratio that helps an organization generate
turnover from its holdings in terms of monetary value using net income of average total asset
value. This ratio means that the higher the ratio, the more efficient the organization. The ideal
ratio is 2.5 times or more (Baker, Kumar and Pandey, 2020). Given the question, the
organization's asset utilization is 1.10, which is well below ideal. Business need to improve your
ability to generate income and maximize the use of assets in the right way.
Current ratio: This ratio measures a company's ability to meet its short-term obligations in the
short term. Analyze the company's short-term liquidity. The ideal ratio is 2:1, but the specified
company scored 2.27, which is above ideal. This is the most suitable situation for companies
with more working capital.
Acid test ratio: This endurance-test ratio compares an organization's highly liquid assets to
current liabilities. Ideally once. This question gives 2.06 hours. This means a safer, more rational
ability to meet short-term commitments.
Inventory holding period = ( average inventory / cost of goods sold ) * 365
= [( 150 + 102 ) / 2 ] / 2182 * 365
= ( 126 / 2182 ) * 365
= 21.08 days
Debt to equity ratio = total debts / total equity
= 170 / 2898
= 0.058 times
Interpretations:
Gross profit margin: It is generally classified as a profitability measure that compares a
company's total profit to its turnover. Given the question, the total profit is 37.57% which is
38%. This means, as a growing company in the industry, only after deducting the cost of these
commodities.
Assets usage ratio: It is categorized as an efficiency ratio that helps an organization generate
turnover from its holdings in terms of monetary value using net income of average total asset
value. This ratio means that the higher the ratio, the more efficient the organization. The ideal
ratio is 2.5 times or more (Baker, Kumar and Pandey, 2020). Given the question, the
organization's asset utilization is 1.10, which is well below ideal. Business need to improve your
ability to generate income and maximize the use of assets in the right way.
Current ratio: This ratio measures a company's ability to meet its short-term obligations in the
short term. Analyze the company's short-term liquidity. The ideal ratio is 2:1, but the specified
company scored 2.27, which is above ideal. This is the most suitable situation for companies
with more working capital.
Acid test ratio: This endurance-test ratio compares an organization's highly liquid assets to
current liabilities. Ideally once. This question gives 2.06 hours. This means a safer, more rational
ability to meet short-term commitments.
Paraphrase This Document
Need a fresh take? Get an instant paraphrase of this document with our AI Paraphraser
Inventory holding period: Inventory holding time is a ratio that represents the number of days a
company holds inventory before selling. Indicates the number of days it takes for inventory to
rotate within the organization.
Debt to equity ratio: If there is high leverage in this ratio, it indicates that the company has more
leverage from the capital markets in its business. Low leverage, on the other hand, indicates that
the asset is being used optimally and is less leveraged outside the market. For this particular
question, 0.058 means less borrowed capital and less risk on hand (Brunstein and Perera, 2019).
b) The importance of considering the audience for financial statement analysis
This is the financial statement for the fiscal year, divided into expenses and income.
Provide opportunities for internal and external stakeholders to make informed decisions related
to investments. It also gives lenders an unbiased view of a company's financial health. This helps
with loan selection. This assessment reviews the trading company's financial statements to gain
insight into its financial functioning. These statements consist of profit statements, stability
sheets, and coin flows. Evaluation of the internal workings is done by workers, authorities,
managers, etc. using accounting information from the trading company. External ratings, on the
other hand, are done by outsiders who have access to the posted account. This includes investors,
credit and government agencies, and creditors. It allows us to make the right and appropriate
choices to improve the company's financial role (Klimczak, 2020).
Question 2
a) Opening statement of financial position
Assets
Non current assets
Tangible assets £ 150,000
Current assets
cash at bank £ 50,000
Total assets £ 200,000
liabilities
Capital £ 200,000
Total £ 200,000
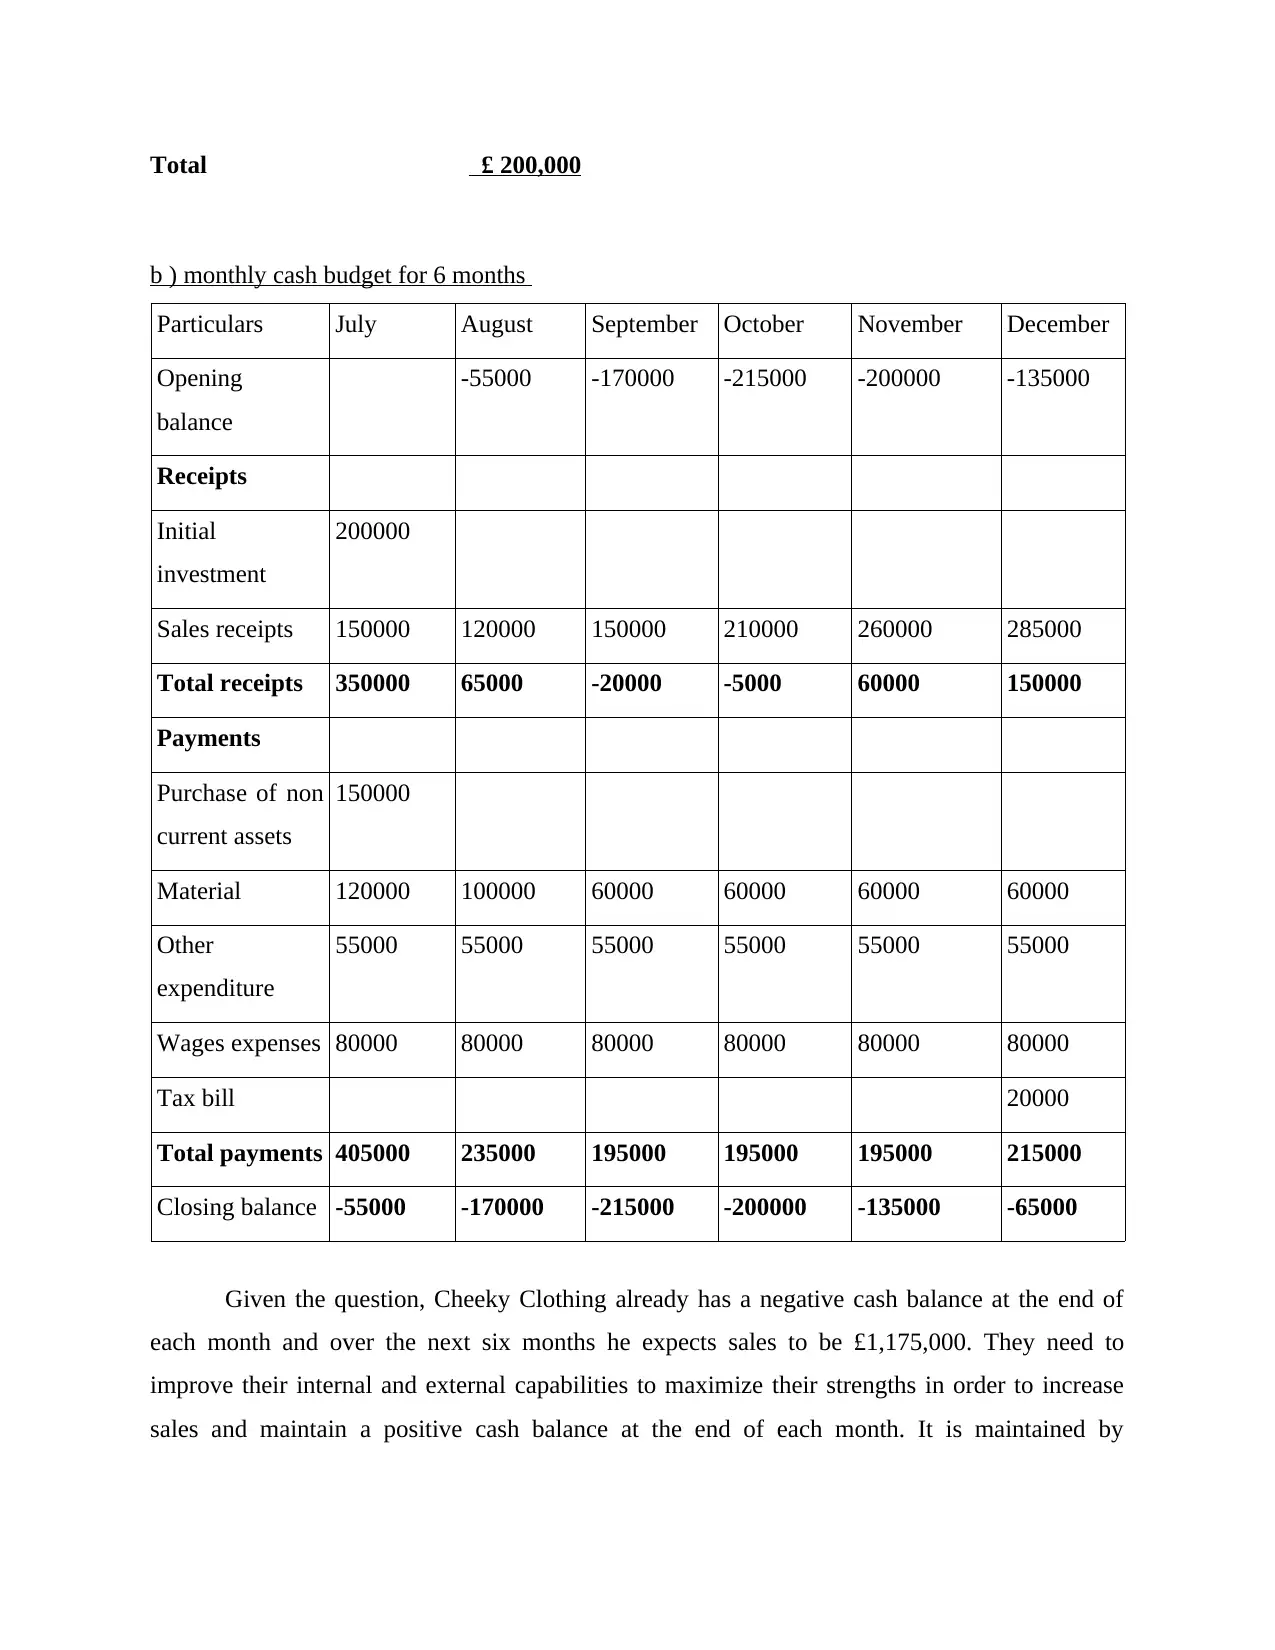
b ) monthly cash budget for 6 months
Particulars July August September October November December
Opening
balance
-55000 -170000 -215000 -200000 -135000
Receipts
Initial
investment
200000
Sales receipts 150000 120000 150000 210000 260000 285000
Total receipts 350000 65000 -20000 -5000 60000 150000
Payments
Purchase of non
current assets
150000
Material 120000 100000 60000 60000 60000 60000
Other
expenditure
55000 55000 55000 55000 55000 55000
Wages expenses 80000 80000 80000 80000 80000 80000
Tax bill 20000
Total payments 405000 235000 195000 195000 195000 215000
Closing balance -55000 -170000 -215000 -200000 -135000 -65000
Given the question, Cheeky Clothing already has a negative cash balance at the end of
each month and over the next six months he expects sales to be £1,175,000. They need to
improve their internal and external capabilities to maximize their strengths in order to increase
sales and maintain a positive cash balance at the end of each month. It is maintained by
⊘ This is a preview!⊘
Do you want full access?
Subscribe today to unlock all pages.
Trusted by 1+ million students worldwide
increasing sales and reducing other costs such as reduction of materials, as raw materials have to
be produced like in-house production.
c) Description of additional expenditure
This business should include expenses for July and December. This includes software
invoices, rent, operating costs, and fees to suppliers. Overdraft mortgages give local
entrepreneurs access to more price points, even though they don't have any right now. It can help
you manage price range timing drift and help you maintain a good track record. With the help of
credit bureau, companies can pay their bills on time and out of pocket (Liu, 2019).
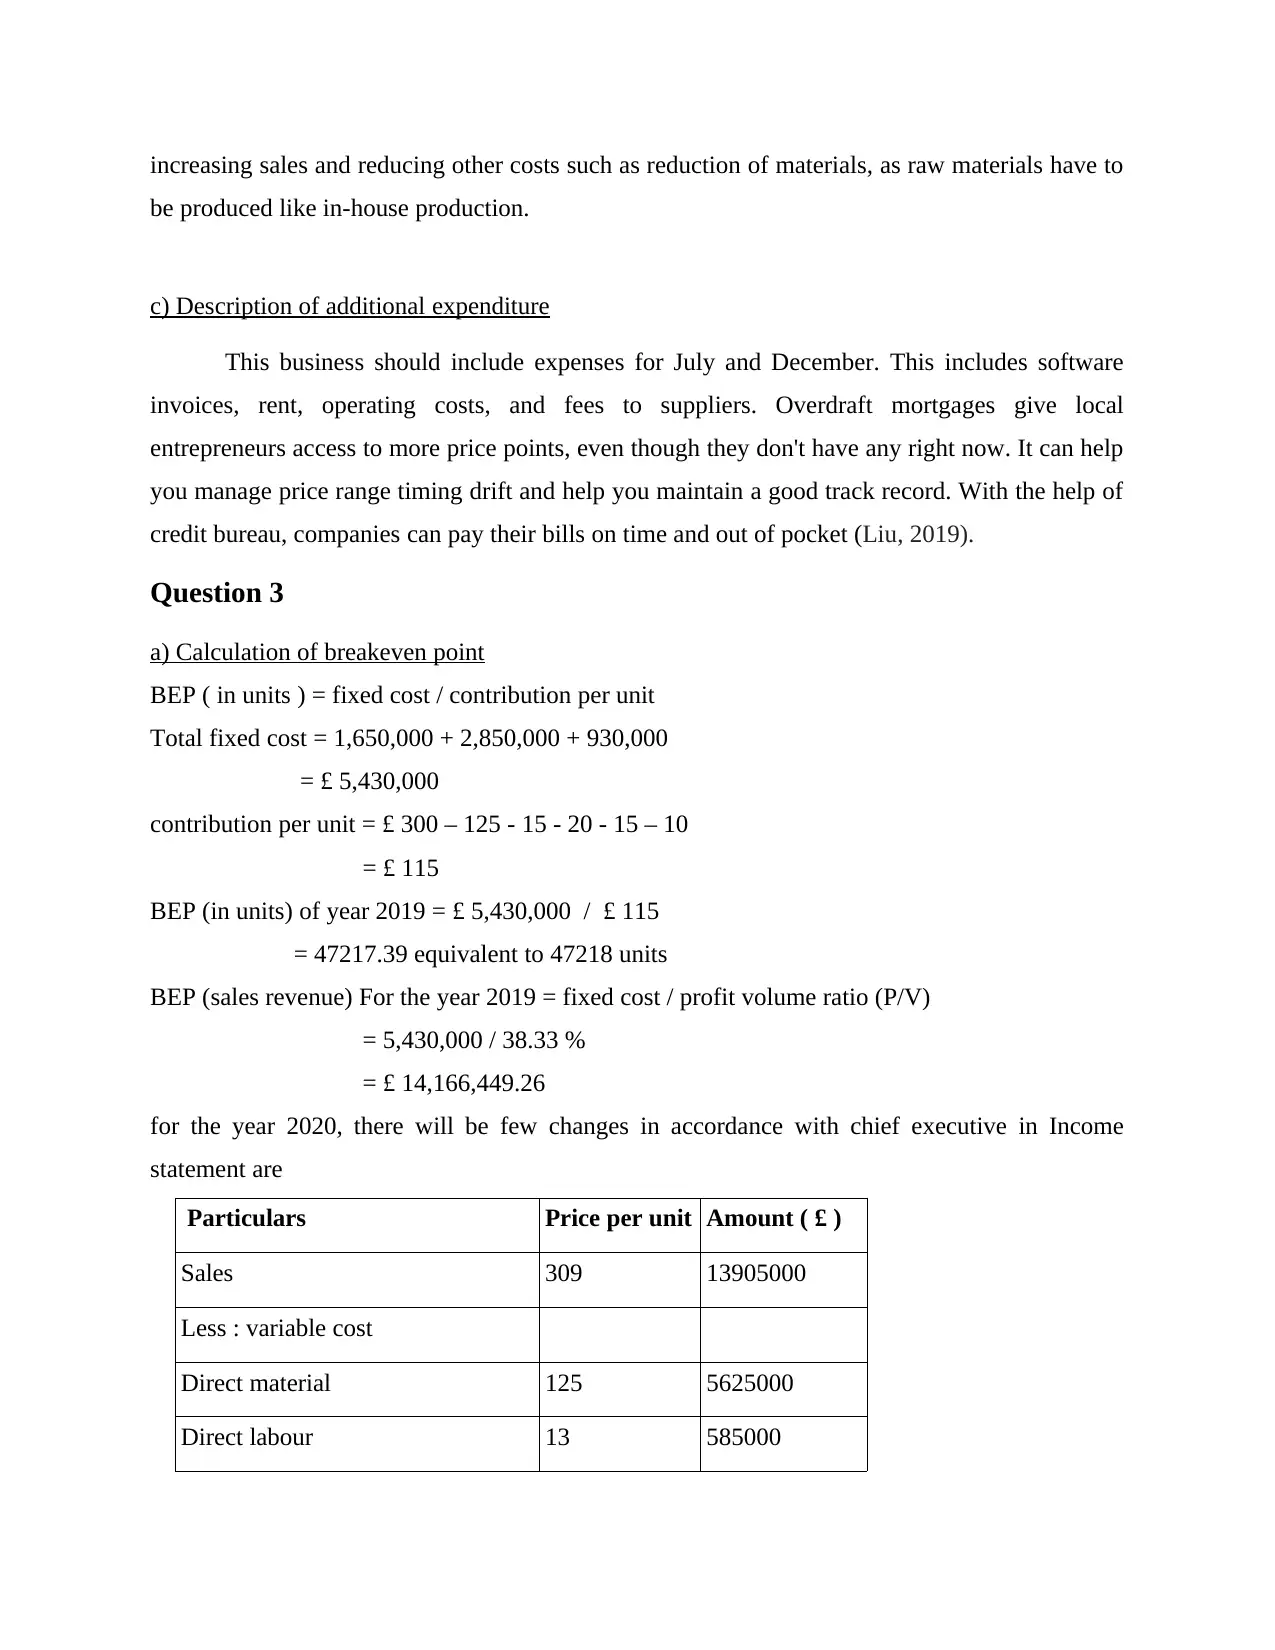
Question 3
a) Calculation of breakeven point
BEP ( in units ) = fixed cost / contribution per unit
Total fixed cost = 1,650,000 + 2,850,000 + 930,000
= £ 5,430,000
contribution per unit = £ 300 – 125 - 15 - 20 - 15 – 10
= £ 115
BEP (in units) of year 2019 = £ 5,430,000 / £ 115
= 47217.39 equivalent to 47218 units
BEP (sales revenue) For the year 2019 = fixed cost / profit volume ratio (P/V)
= 5,430,000 / 38.33 %
= £ 14,166,449.26
for the year 2020, there will be few changes in accordance with chief executive in Income
statement are
Particulars Price per unit Amount ( £ )
Sales 309 13905000
Less : variable cost
Direct material 125 5625000
Direct labour 13 585000
be produced like in-house production.
c) Description of additional expenditure
This business should include expenses for July and December. This includes software
invoices, rent, operating costs, and fees to suppliers. Overdraft mortgages give local
entrepreneurs access to more price points, even though they don't have any right now. It can help
you manage price range timing drift and help you maintain a good track record. With the help of
credit bureau, companies can pay their bills on time and out of pocket (Liu, 2019).
Question 3
a) Calculation of breakeven point
BEP ( in units ) = fixed cost / contribution per unit
Total fixed cost = 1,650,000 + 2,850,000 + 930,000
= £ 5,430,000
contribution per unit = £ 300 – 125 - 15 - 20 - 15 – 10
= £ 115
BEP (in units) of year 2019 = £ 5,430,000 / £ 115
= 47217.39 equivalent to 47218 units
BEP (sales revenue) For the year 2019 = fixed cost / profit volume ratio (P/V)
= 5,430,000 / 38.33 %
= £ 14,166,449.26
for the year 2020, there will be few changes in accordance with chief executive in Income
statement are
Particulars Price per unit Amount ( £ )
Sales 309 13905000
Less : variable cost
Direct material 125 5625000
Direct labour 13 585000
Paraphrase This Document
Need a fresh take? Get an instant paraphrase of this document with our AI Paraphraser
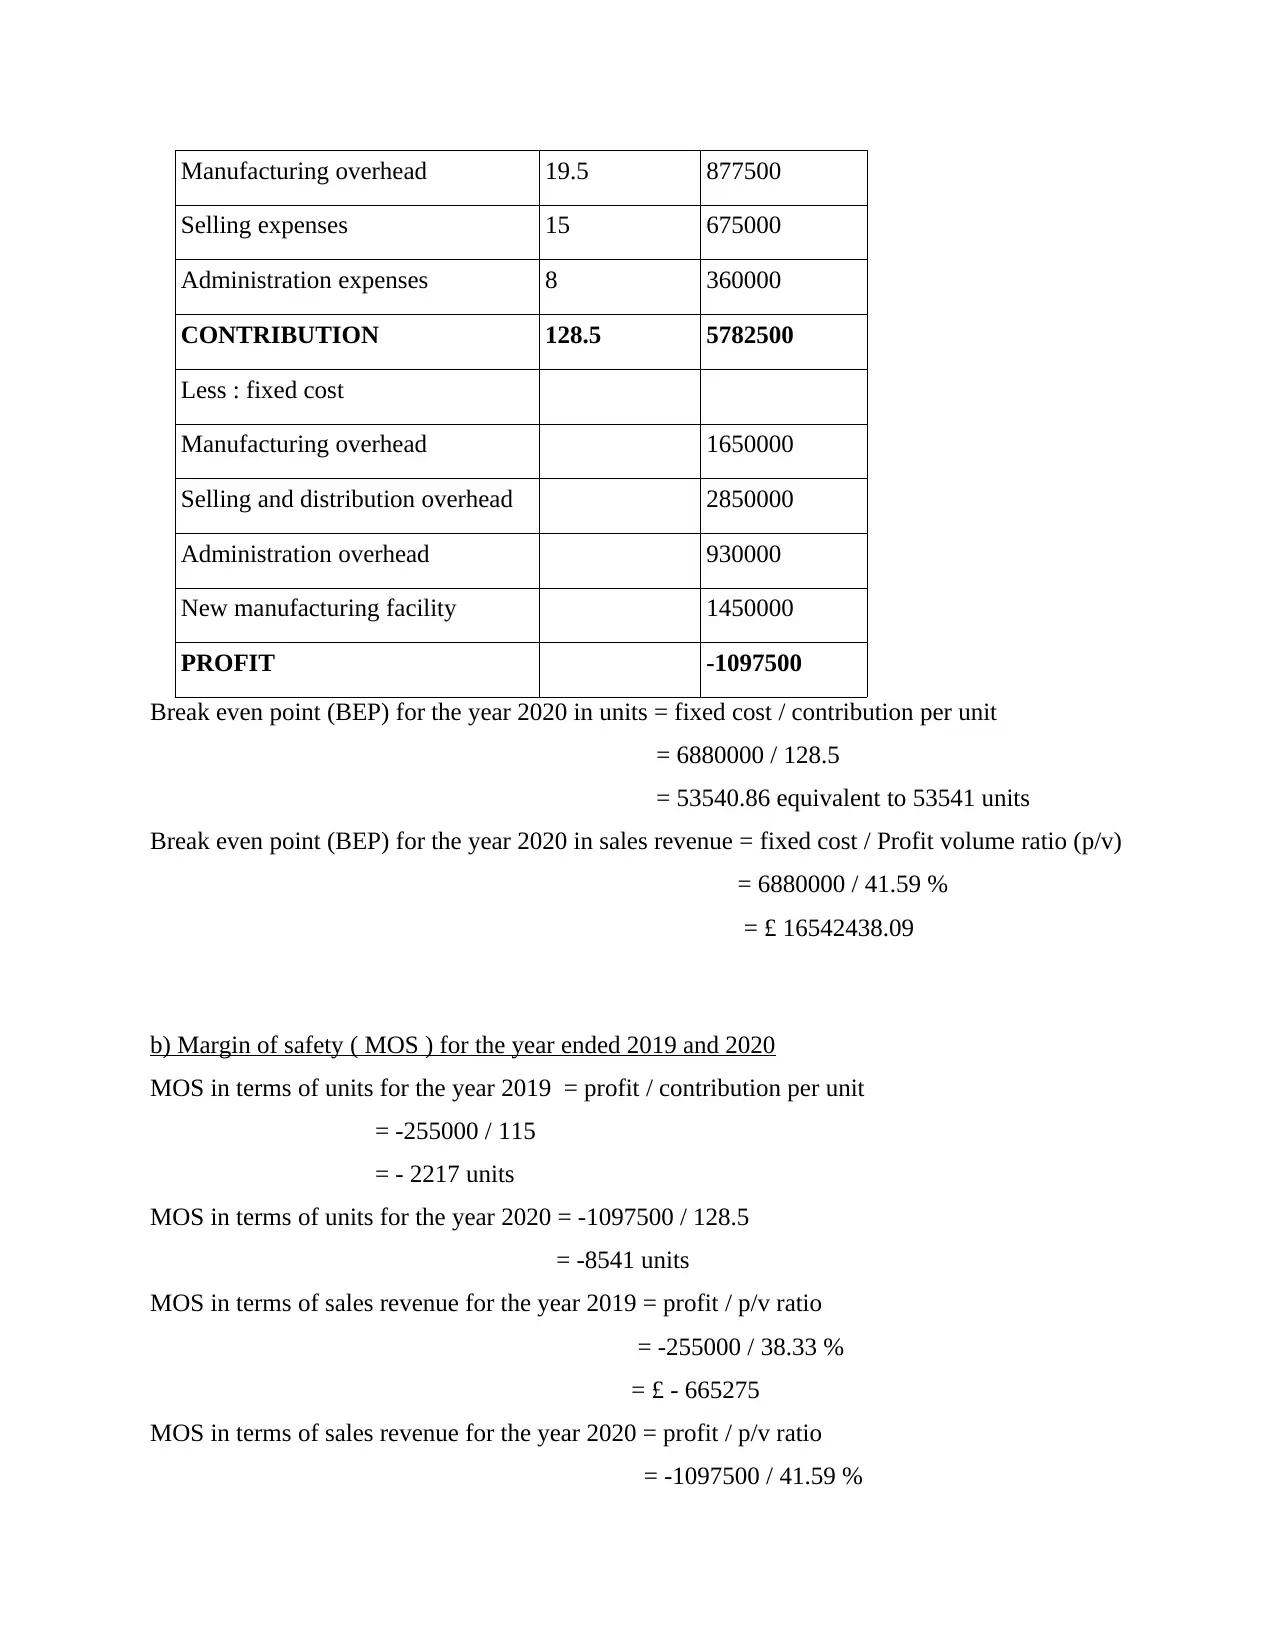
Manufacturing overhead 19.5 877500
Selling expenses 15 675000
Administration expenses 8 360000
CONTRIBUTION 128.5 5782500
Less : fixed cost
Manufacturing overhead 1650000
Selling and distribution overhead 2850000
Administration overhead 930000
New manufacturing facility 1450000
PROFIT -1097500
Break even point (BEP) for the year 2020 in units = fixed cost / contribution per unit
= 6880000 / 128.5
= 53540.86 equivalent to 53541 units
Break even point (BEP) for the year 2020 in sales revenue = fixed cost / Profit volume ratio (p/v)
= 6880000 / 41.59 %
= £ 16542438.09
b) Margin of safety ( MOS ) for the year ended 2019 and 2020
MOS in terms of units for the year 2019 = profit / contribution per unit
= -255000 / 115
= - 2217 units
MOS in terms of units for the year 2020 = -1097500 / 128.5
= -8541 units
MOS in terms of sales revenue for the year 2019 = profit / p/v ratio
= -255000 / 38.33 %
= £ - 665275
MOS in terms of sales revenue for the year 2020 = profit / p/v ratio
= -1097500 / 41.59 %
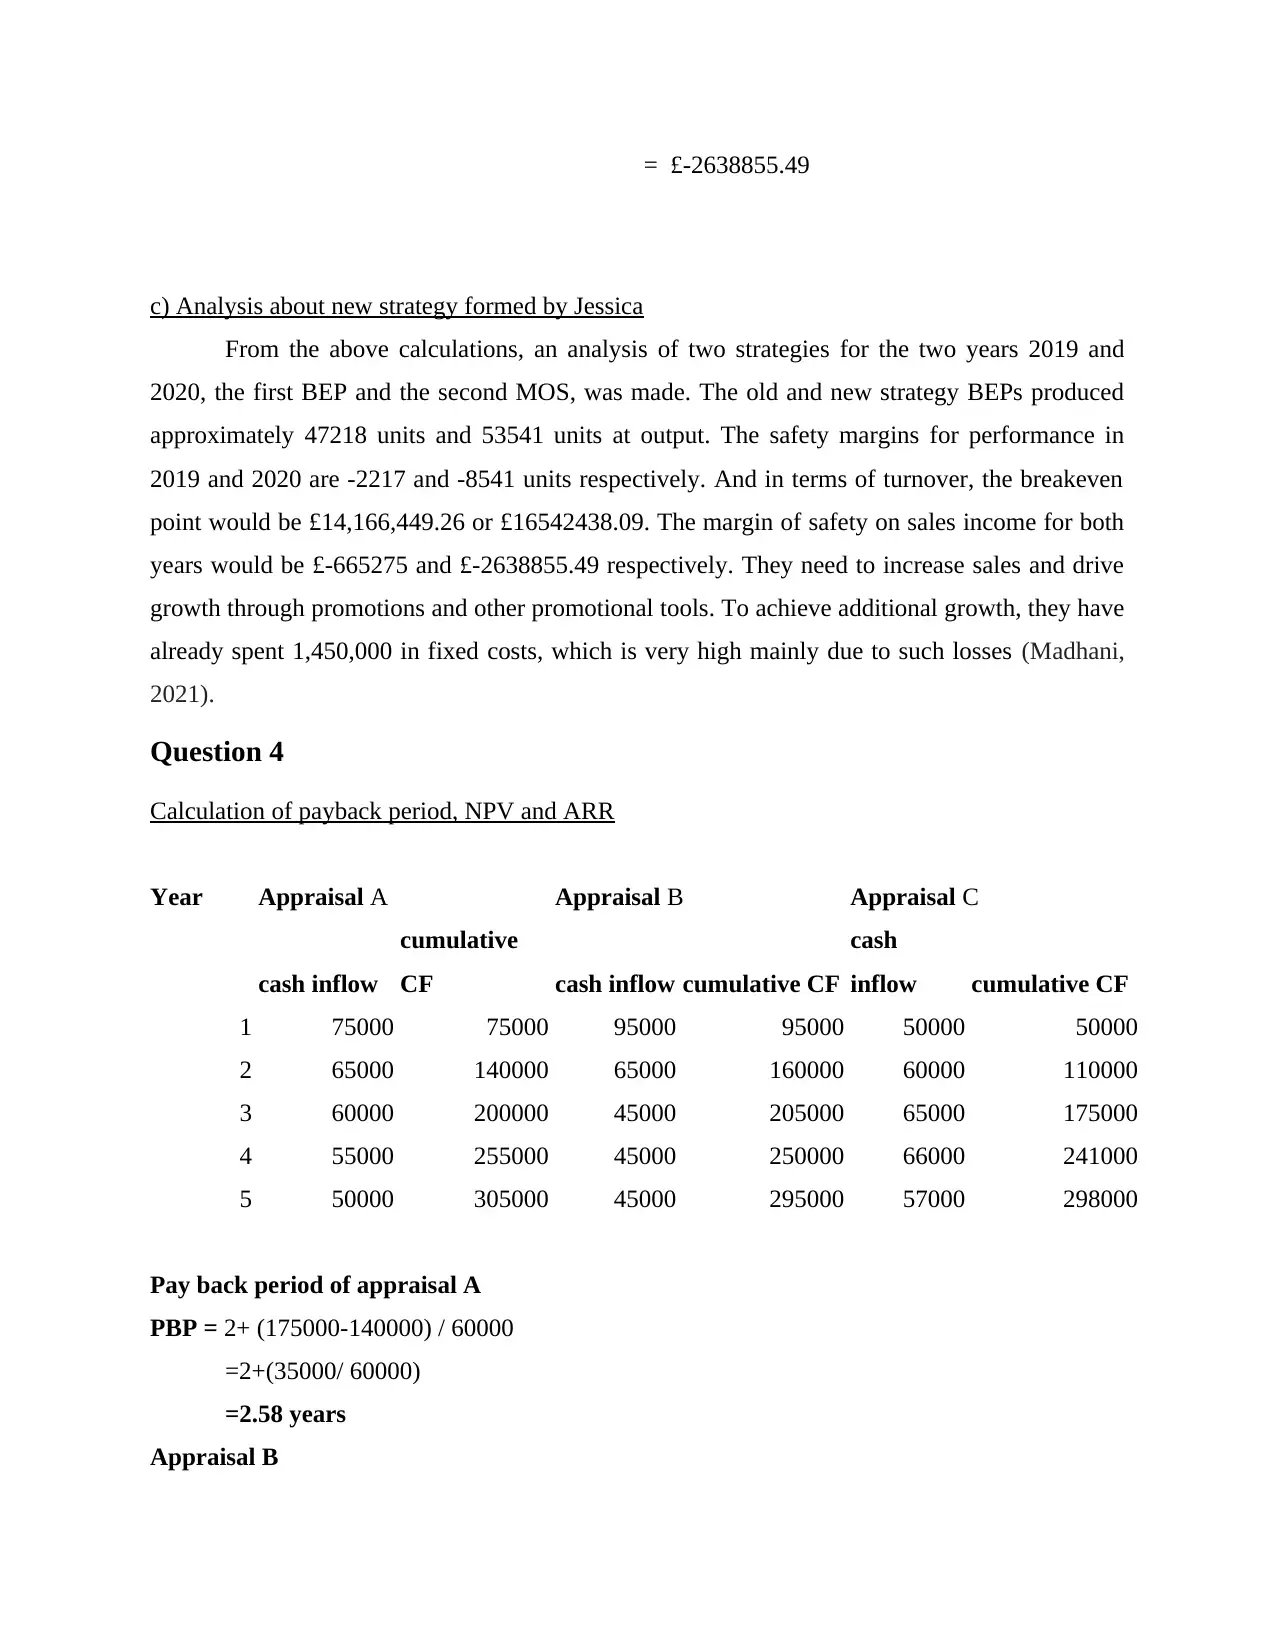
= £-2638855.49
c) Analysis about new strategy formed by Jessica
From the above calculations, an analysis of two strategies for the two years 2019 and
2020, the first BEP and the second MOS, was made. The old and new strategy BEPs produced
approximately 47218 units and 53541 units at output. The safety margins for performance in
2019 and 2020 are -2217 and -8541 units respectively. And in terms of turnover, the breakeven
point would be £14,166,449.26 or £16542438.09. The margin of safety on sales income for both
years would be £-665275 and £-2638855.49 respectively. They need to increase sales and drive
growth through promotions and other promotional tools. To achieve additional growth, they have
already spent 1,450,000 in fixed costs, which is very high mainly due to such losses (Madhani,
2021).
Question 4
Calculation of payback period, NPV and ARR
Year Appraisal A Appraisal B Appraisal C
cash inflow
cumulative
CF cash inflow cumulative CF
cash
inflow cumulative CF
1 75000 75000 95000 95000 50000 50000
2 65000 140000 65000 160000 60000 110000
3 60000 200000 45000 205000 65000 175000
4 55000 255000 45000 250000 66000 241000
5 50000 305000 45000 295000 57000 298000
Pay back period of appraisal A
PBP = 2+ (175000-140000) / 60000
=2+(35000/ 60000)
=2.58 years
Appraisal B
⊘ This is a preview!⊘
Do you want full access?
Subscribe today to unlock all pages.
Trusted by 1+ million students worldwide
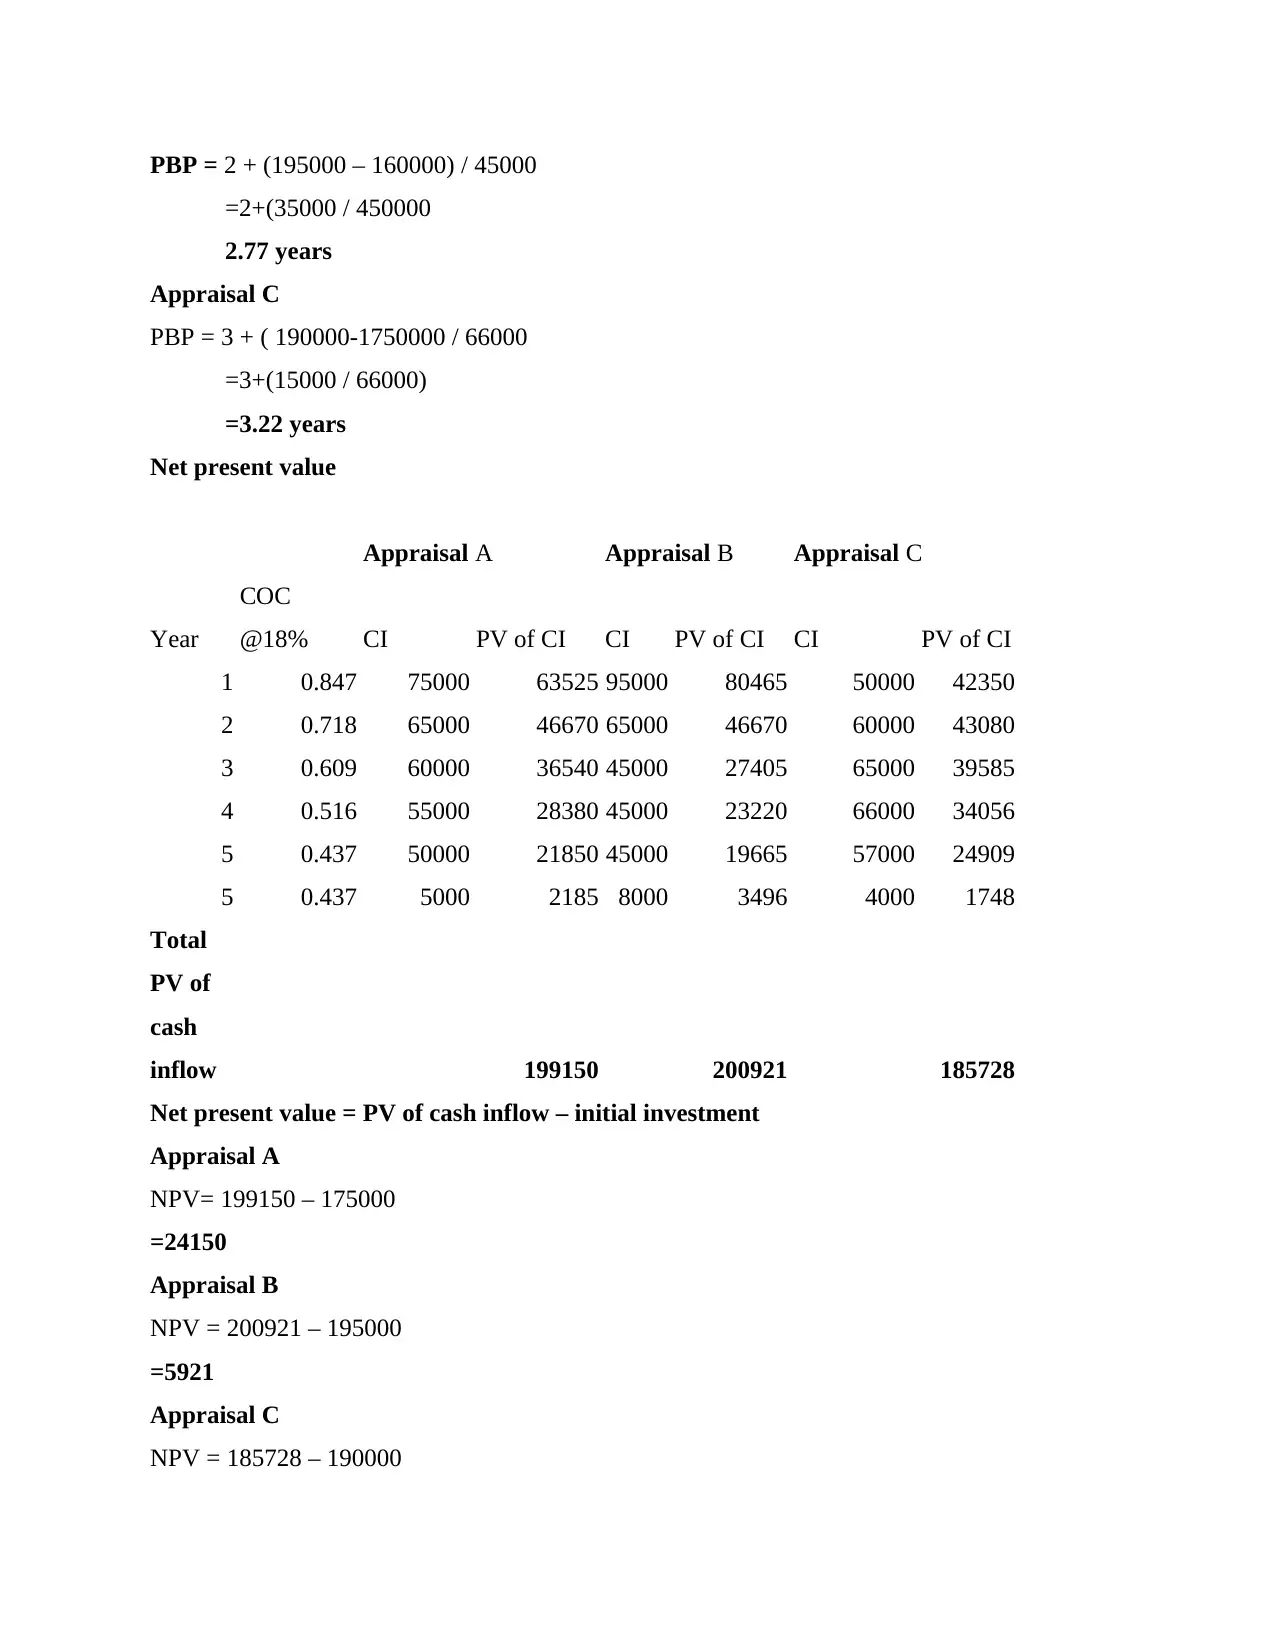
PBP = 2 + (195000 – 160000) / 45000
=2+(35000 / 450000
2.77 years
Appraisal C
PBP = 3 + ( 190000-1750000 / 66000
=3+(15000 / 66000)
=3.22 years
Net present value
Appraisal A Appraisal B Appraisal C
Year
COC
@18% CI PV of CI CI PV of CI CI PV of CI
1 0.847 75000 63525 95000 80465 50000 42350
2 0.718 65000 46670 65000 46670 60000 43080
3 0.609 60000 36540 45000 27405 65000 39585
4 0.516 55000 28380 45000 23220 66000 34056
5 0.437 50000 21850 45000 19665 57000 24909
5 0.437 5000 2185 8000 3496 4000 1748
Total
PV of
cash
inflow 199150 200921 185728
Net present value = PV of cash inflow – initial investment
Appraisal A
NPV= 199150 – 175000
=24150
Appraisal B
NPV = 200921 – 195000
=5921
Appraisal C
NPV = 185728 – 190000
Paraphrase This Document
Need a fresh take? Get an instant paraphrase of this document with our AI Paraphraser
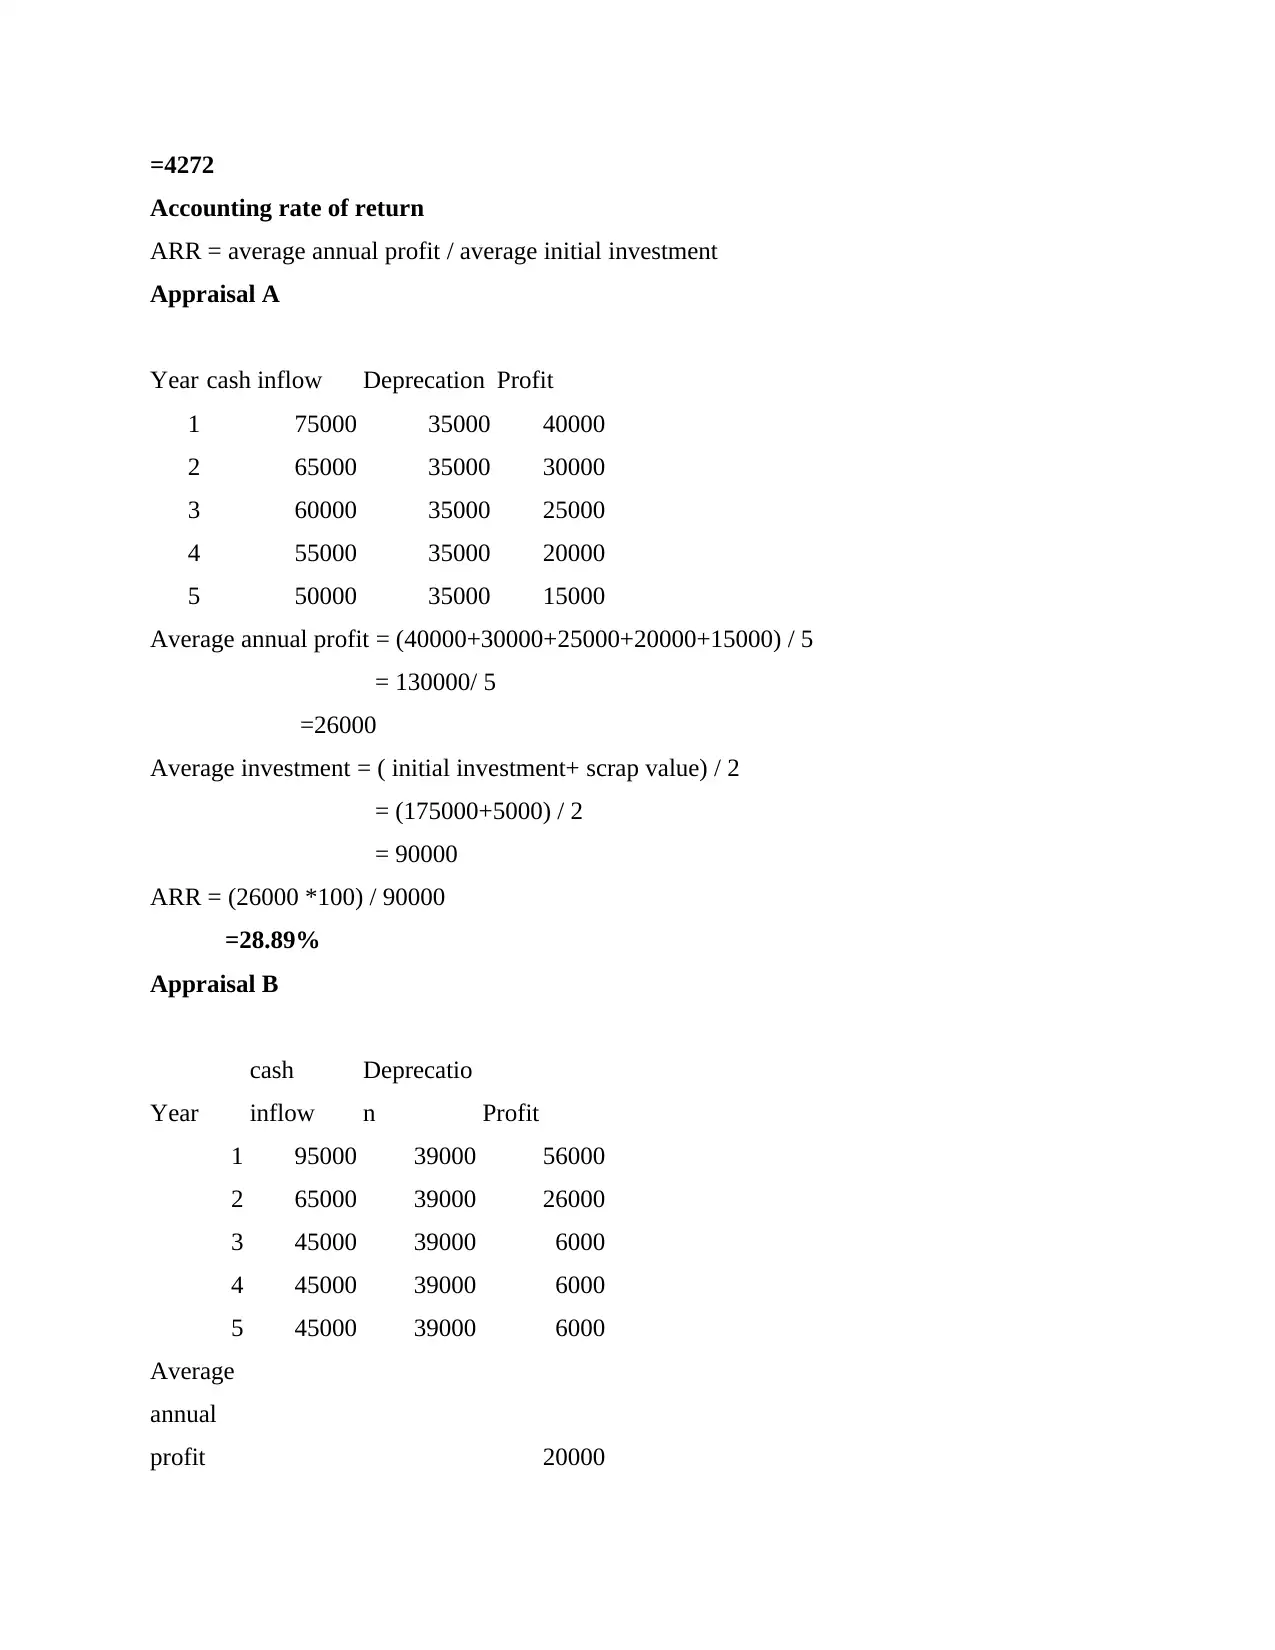
=4272
Accounting rate of return
ARR = average annual profit / average initial investment
Appraisal A
Year cash inflow Deprecation Profit
1 75000 35000 40000
2 65000 35000 30000
3 60000 35000 25000
4 55000 35000 20000
5 50000 35000 15000
Average annual profit = (40000+30000+25000+20000+15000) / 5
= 130000/ 5
=26000
Average investment = ( initial investment+ scrap value) / 2
= (175000+5000) / 2
= 90000
ARR = (26000 *100) / 90000
=28.89%
Appraisal B
Year
cash
inflow
Deprecatio
n Profit
1 95000 39000 56000
2 65000 39000 26000
3 45000 39000 6000
4 45000 39000 6000
5 45000 39000 6000
Average
annual
profit 20000
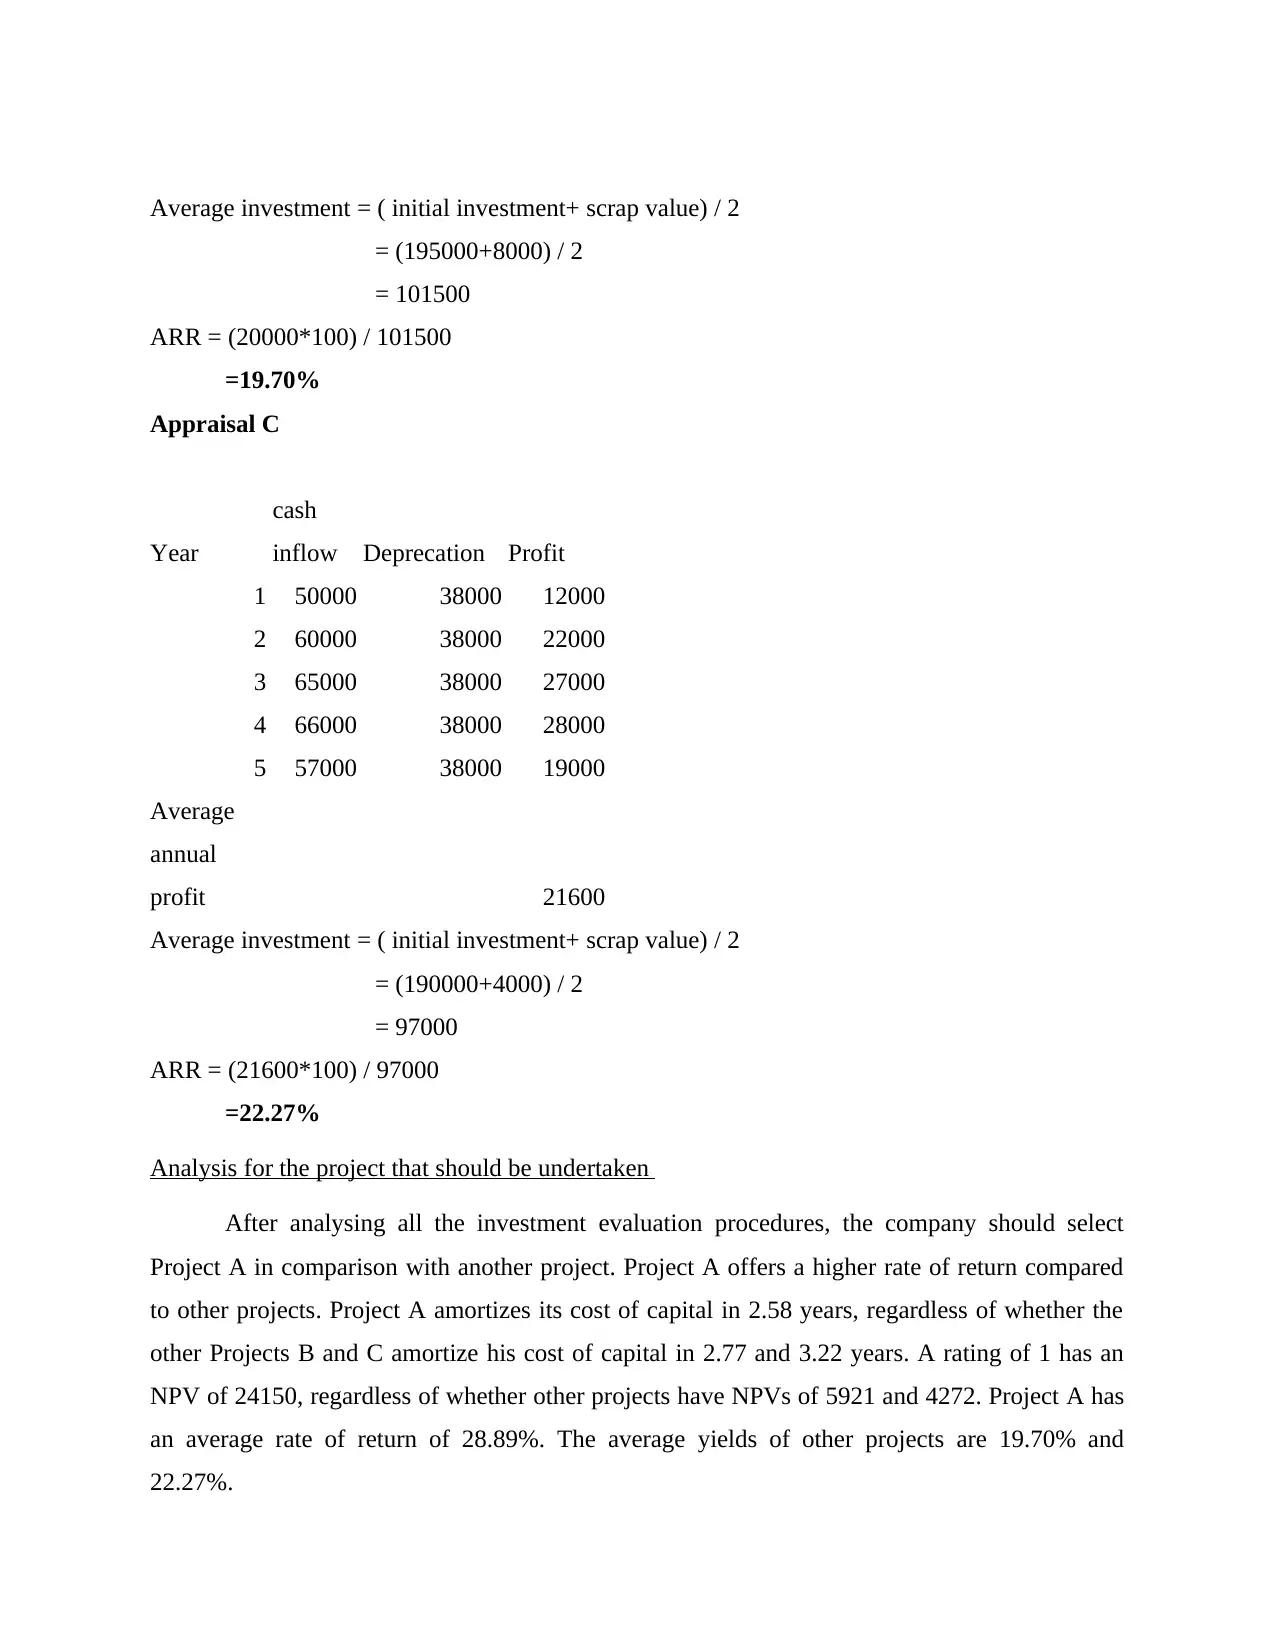
Average investment = ( initial investment+ scrap value) / 2
= (195000+8000) / 2
= 101500
ARR = (20000*100) / 101500
=19.70%
Appraisal C
Year
cash
inflow Deprecation Profit
1 50000 38000 12000
2 60000 38000 22000
3 65000 38000 27000
4 66000 38000 28000
5 57000 38000 19000
Average
annual
profit 21600
Average investment = ( initial investment+ scrap value) / 2
= (190000+4000) / 2
= 97000
ARR = (21600*100) / 97000
=22.27%
Analysis for the project that should be undertaken
After analysing all the investment evaluation procedures, the company should select
Project A in comparison with another project. Project A offers a higher rate of return compared
to other projects. Project A amortizes its cost of capital in 2.58 years, regardless of whether the
other Projects B and C amortize his cost of capital in 2.77 and 3.22 years. A rating of 1 has an
NPV of 24150, regardless of whether other projects have NPVs of 5921 and 4272. Project A has
an average rate of return of 28.89%. The average yields of other projects are 19.70% and
22.27%.
⊘ This is a preview!⊘
Do you want full access?
Subscribe today to unlock all pages.
Trusted by 1+ million students worldwide
1 out of 16
Related Documents


Your All-in-One AI-Powered Toolkit for Academic Success.
+13062052269
info@desklib.com
Available 24*7 on WhatsApp / Email
![[object Object]](/_next/static/media/star-bottom.7253800d.svg)
Unlock your academic potential
Copyright © 2020–2026 A2Z Services. All Rights Reserved. Developed and managed by ZUCOL.