Financial Management Assignment: Investment and CFO Duties

Verified

Added on  2023/06/03

|22
|3422
|145
Homework Assignment
AI Summary
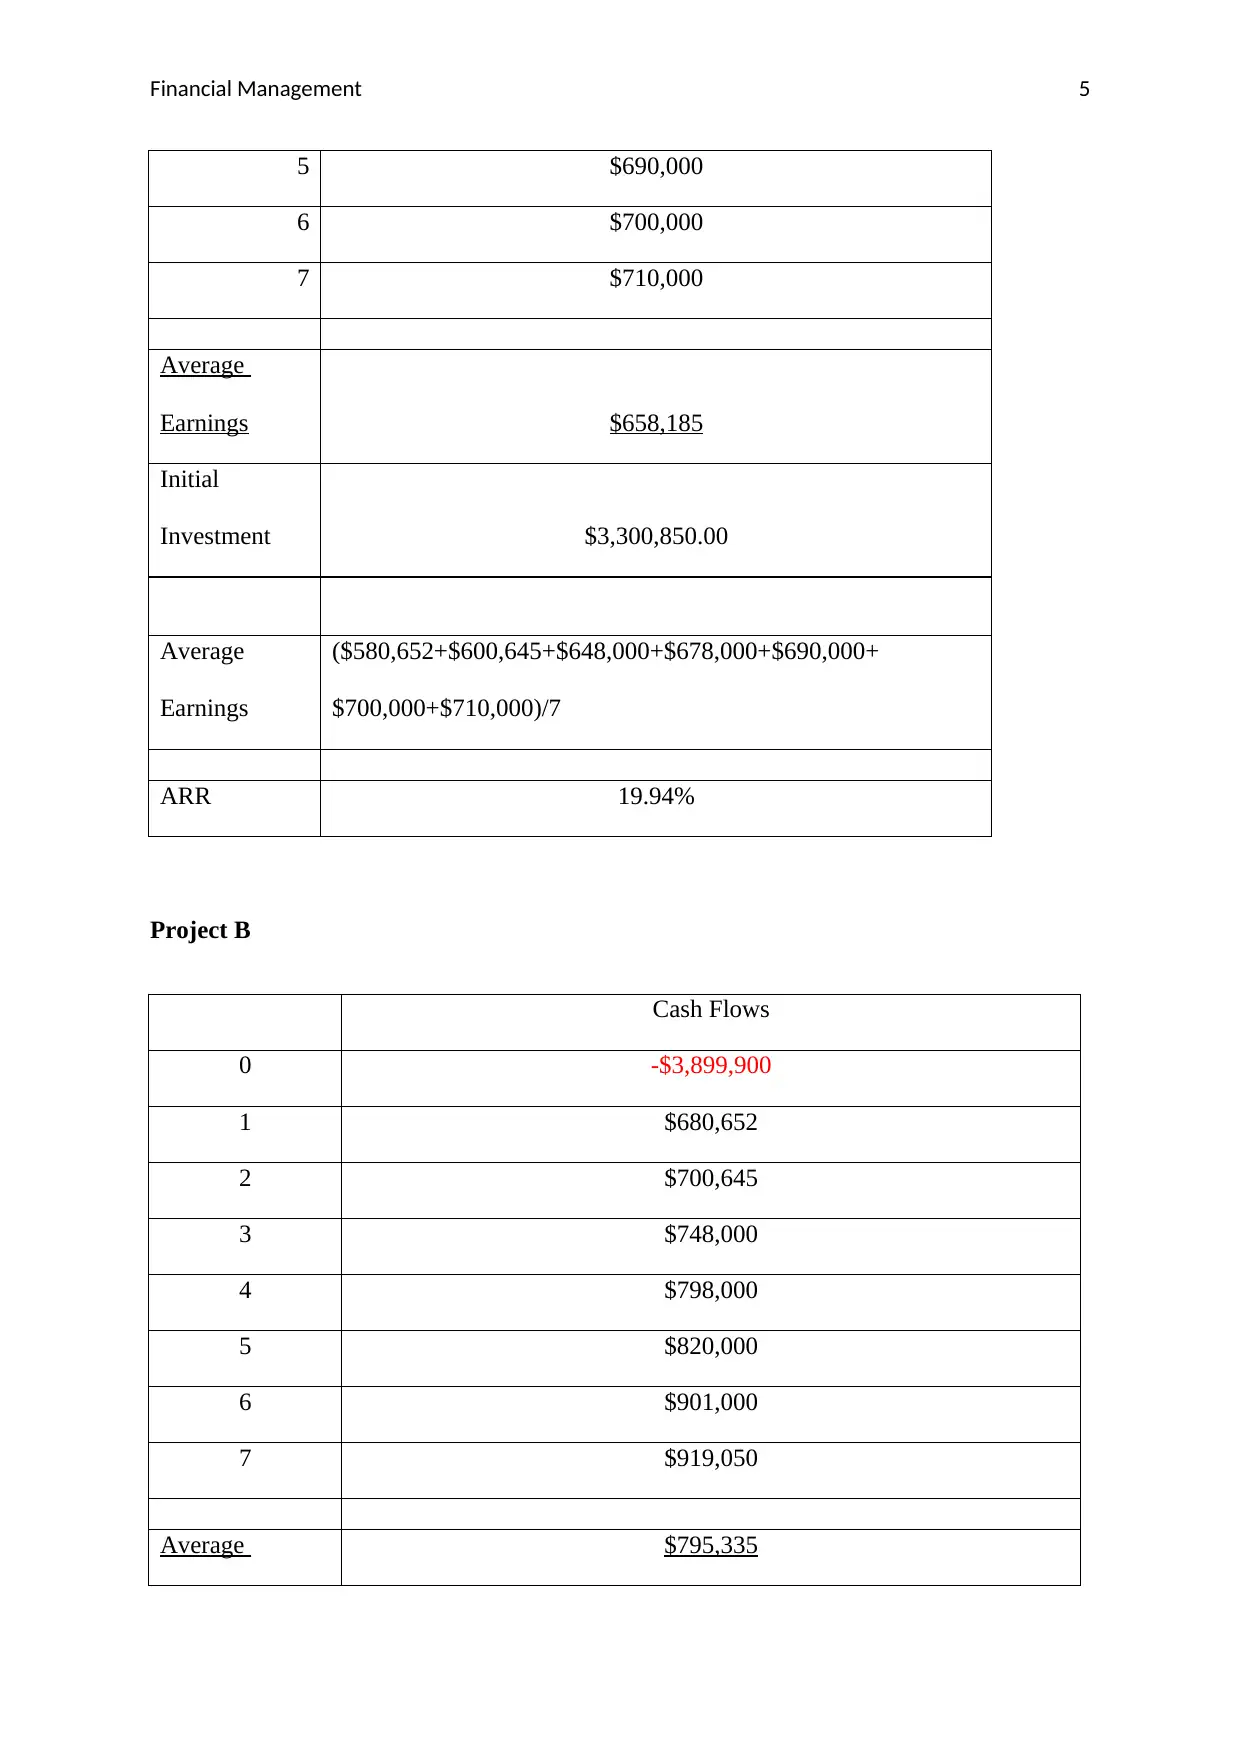
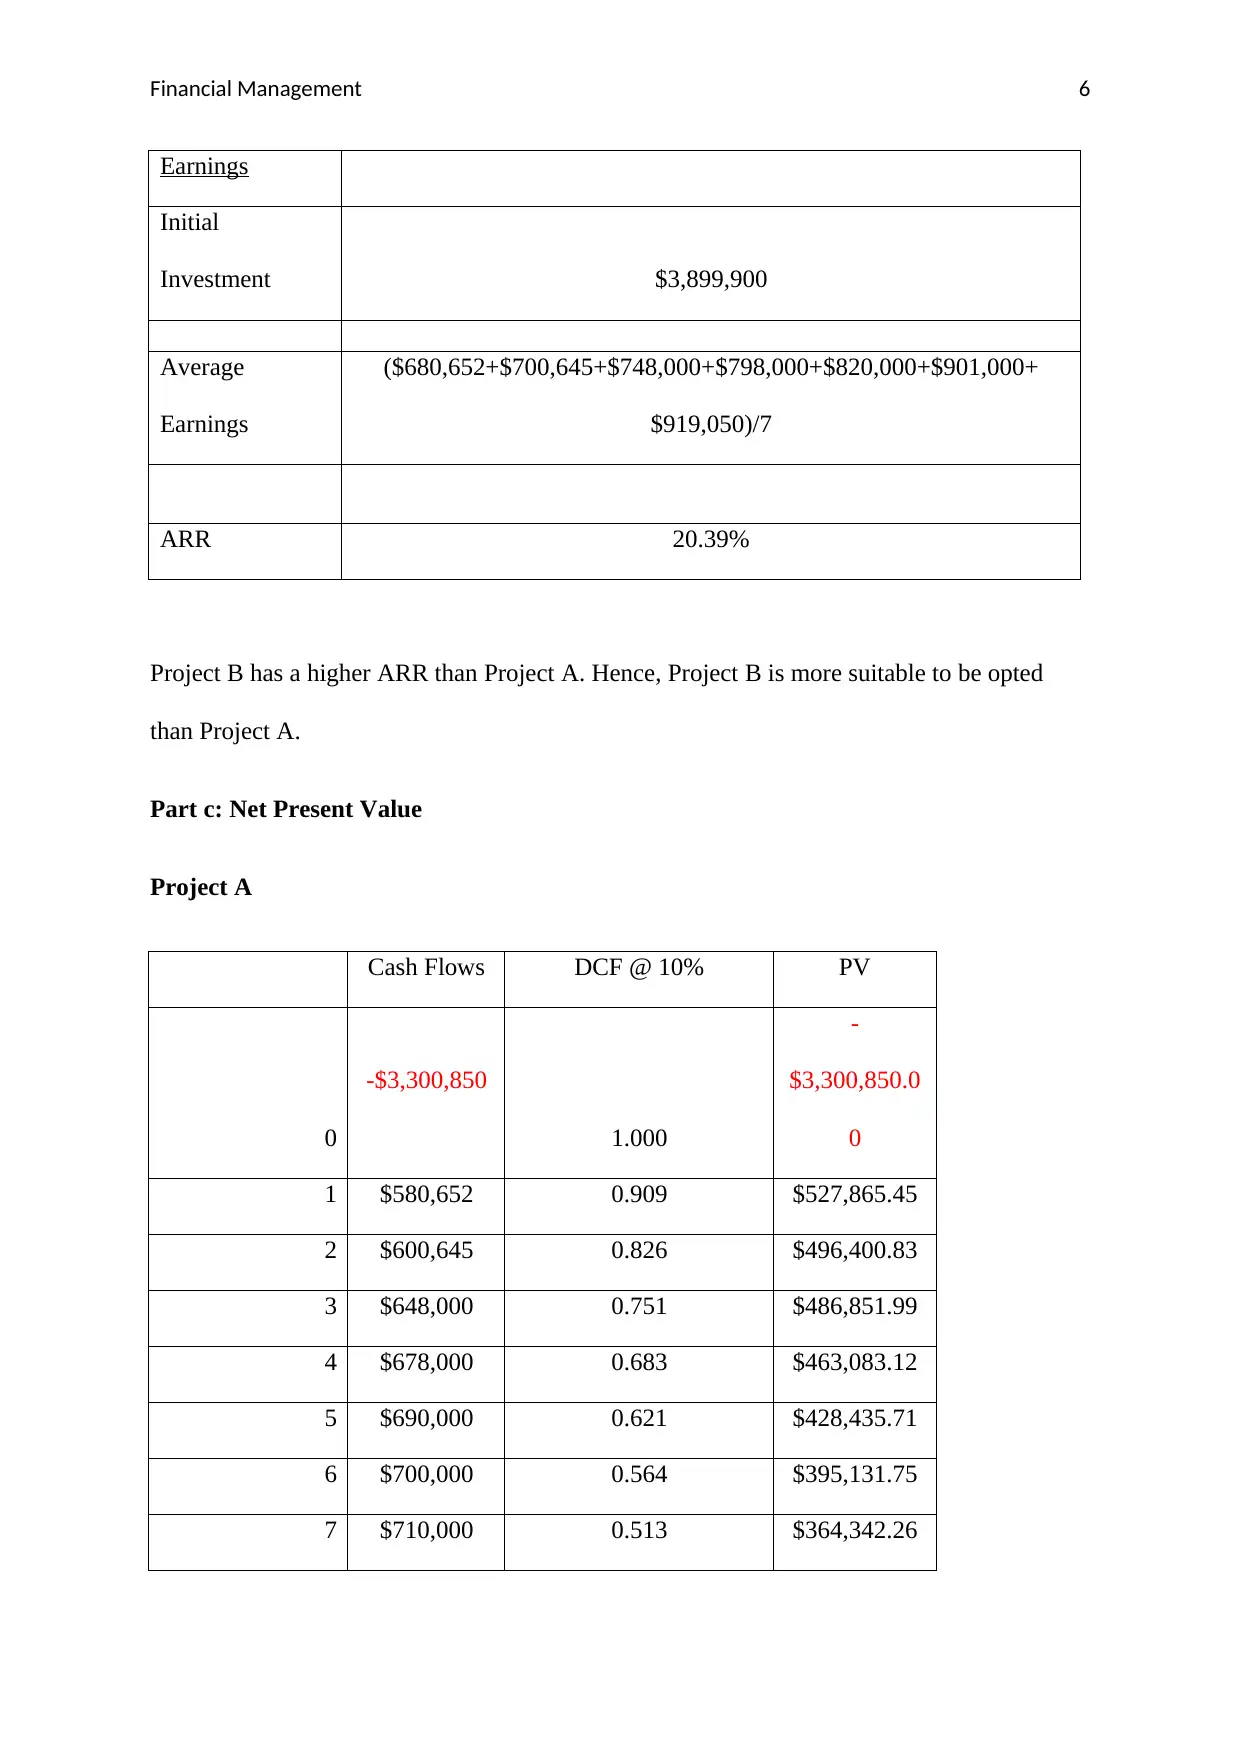
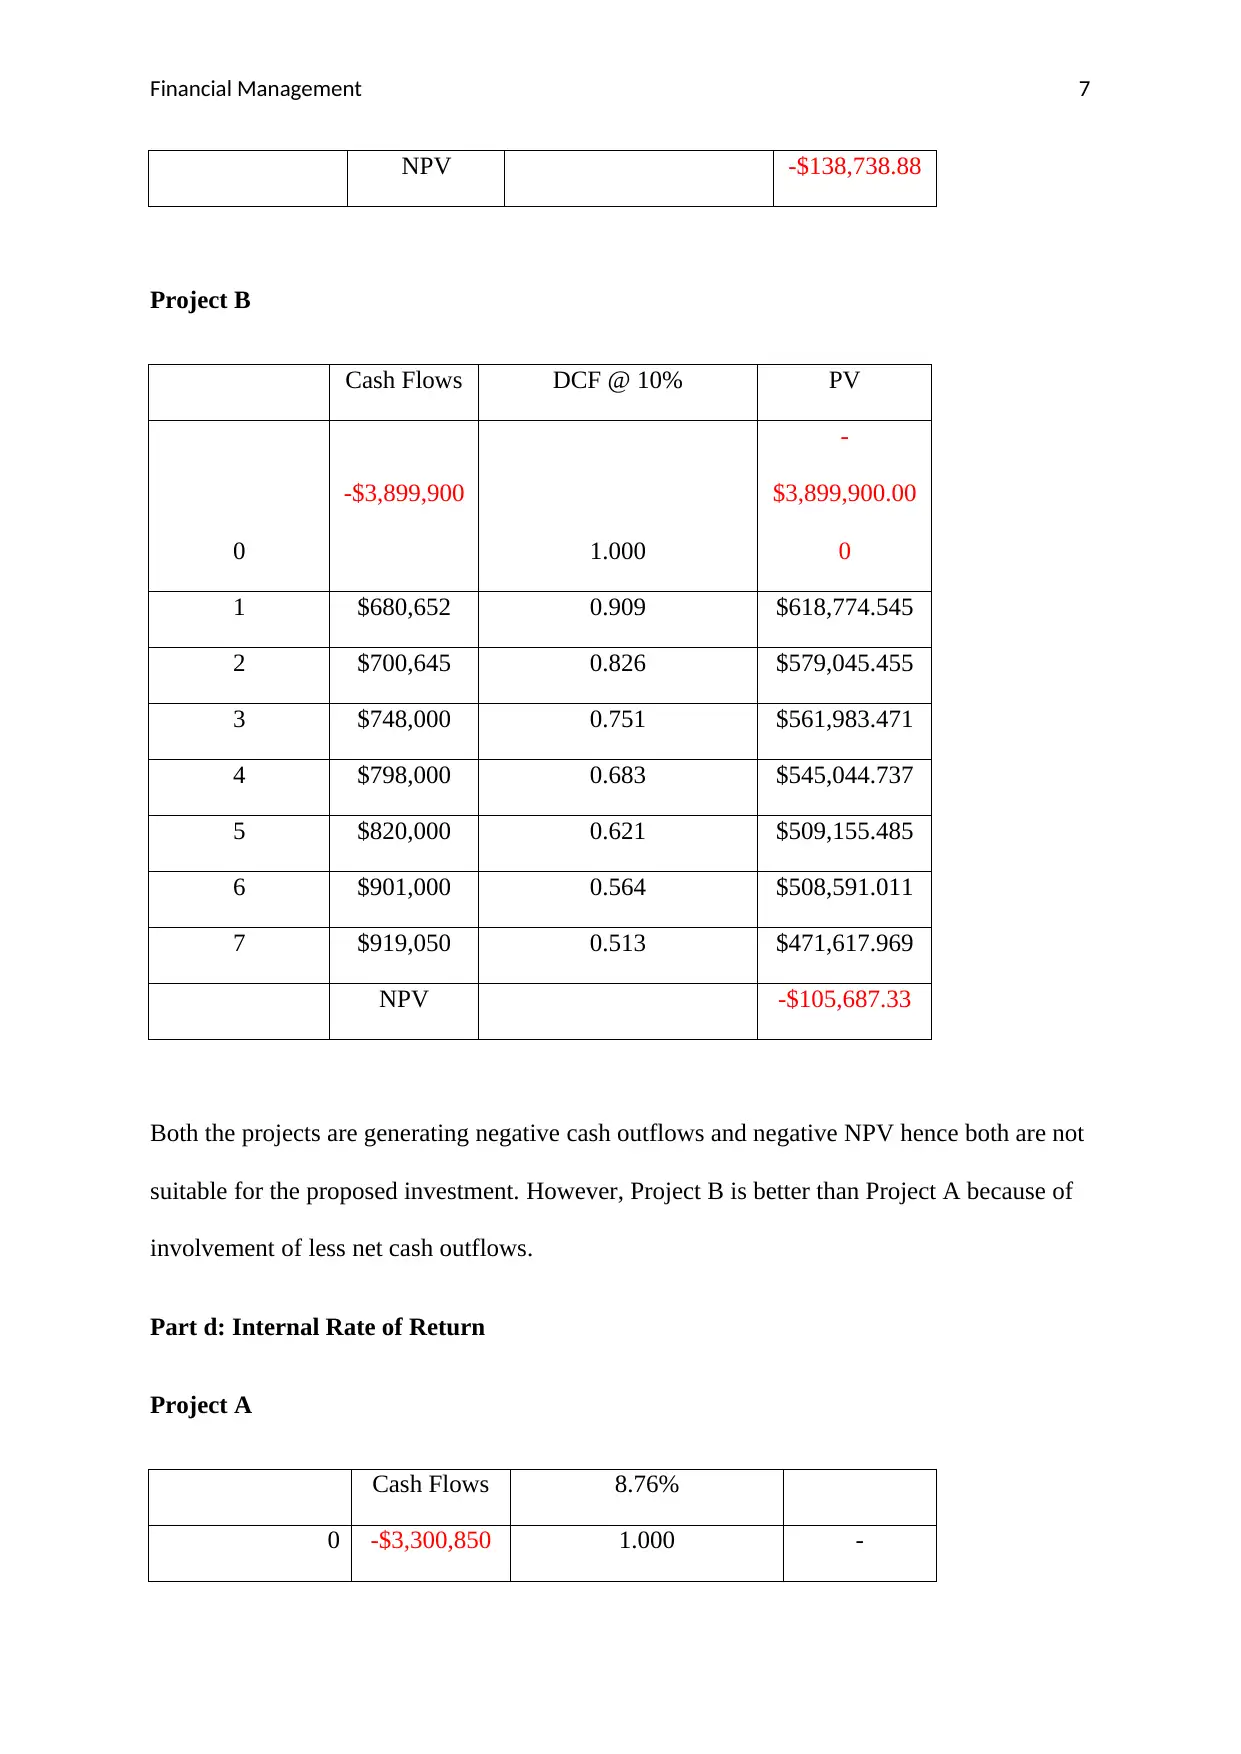
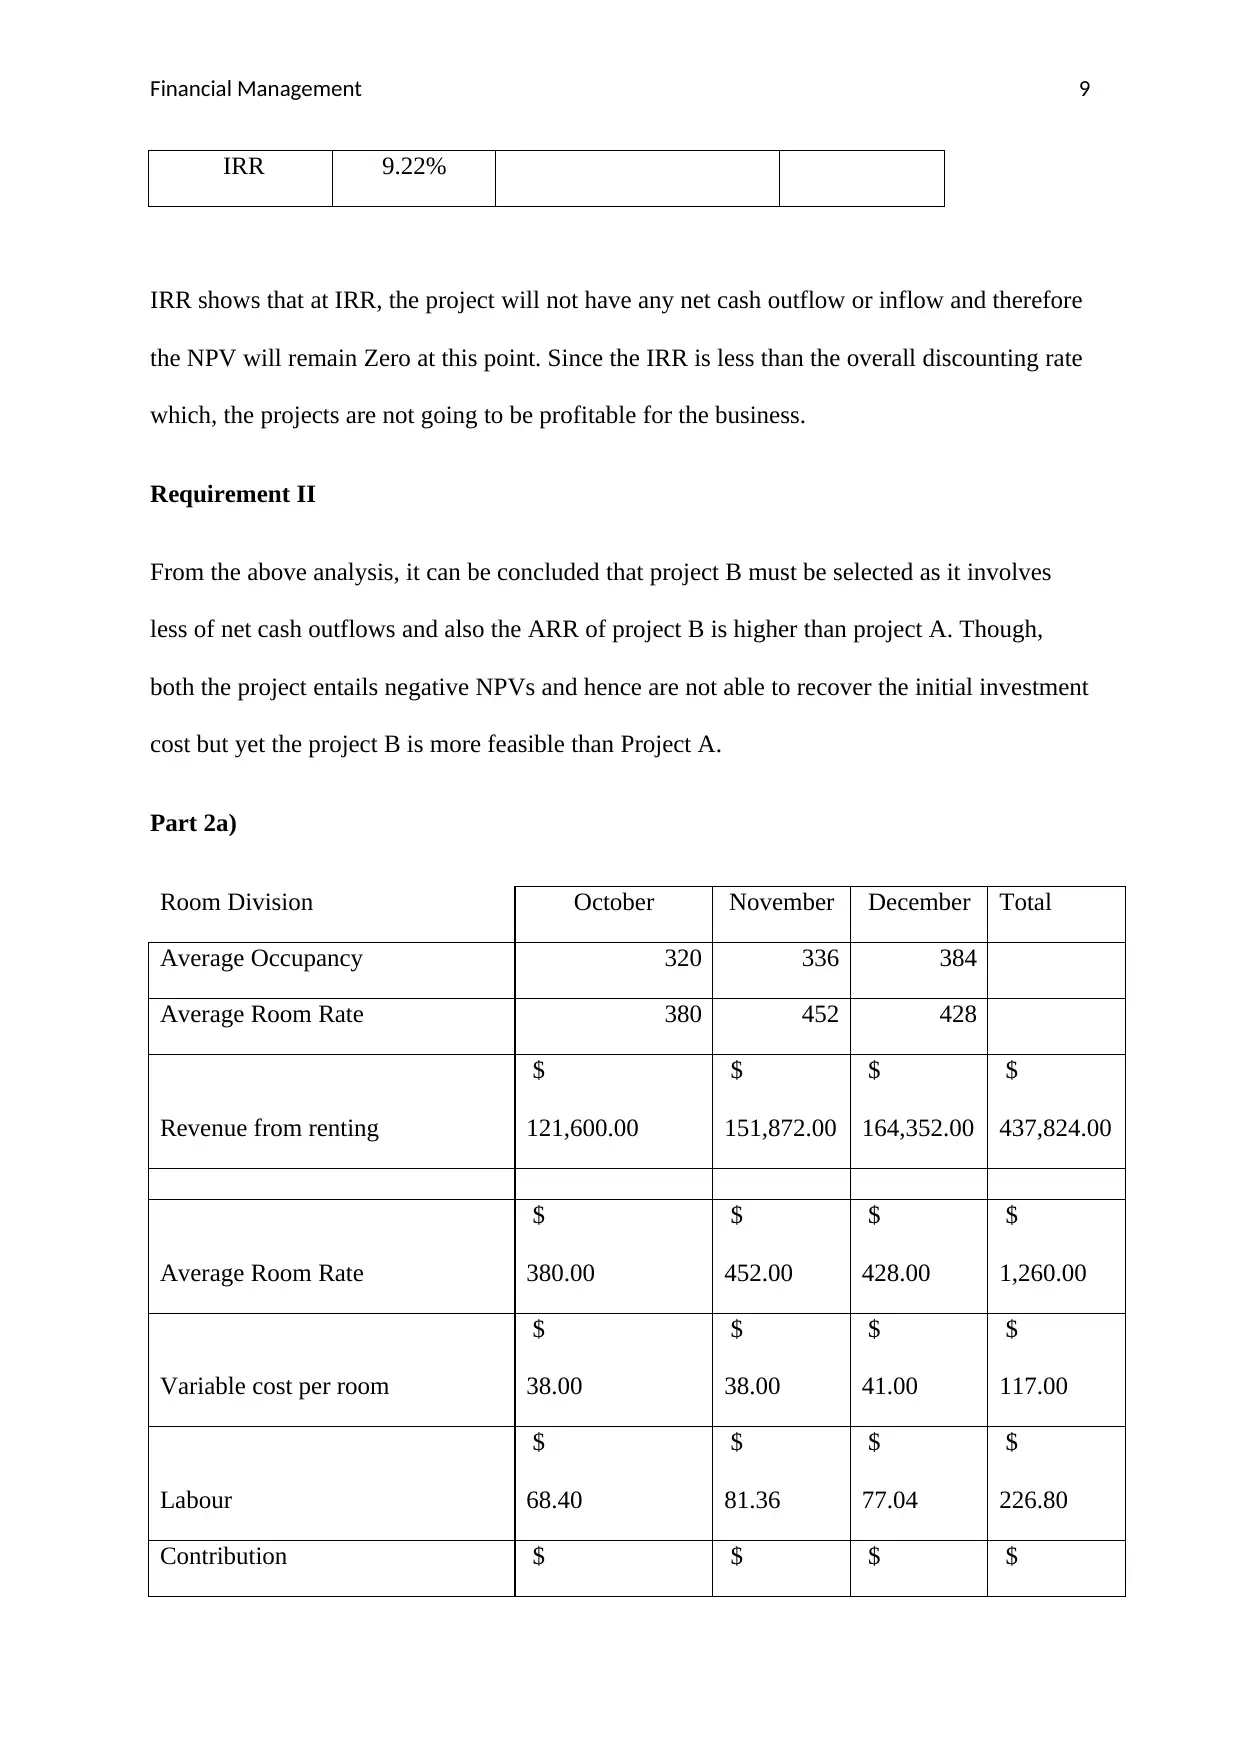
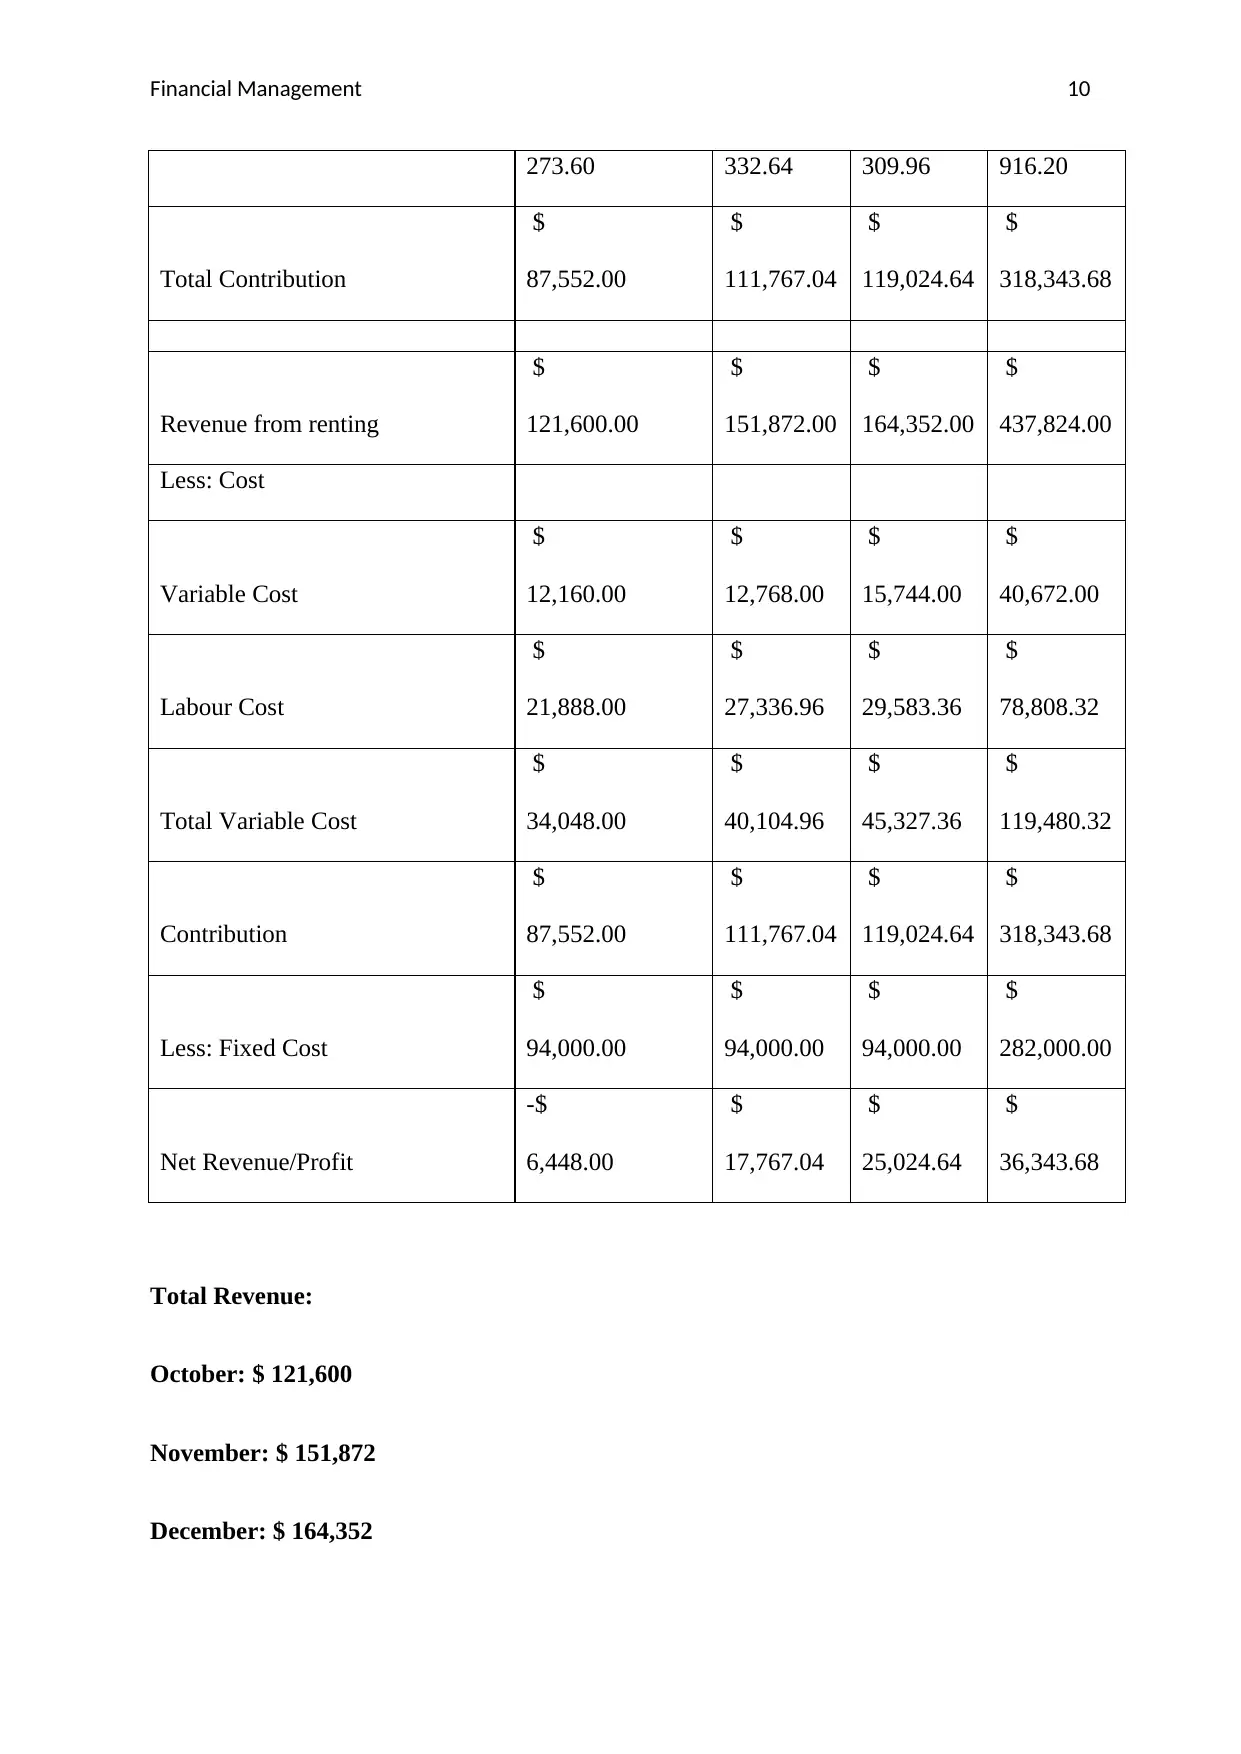
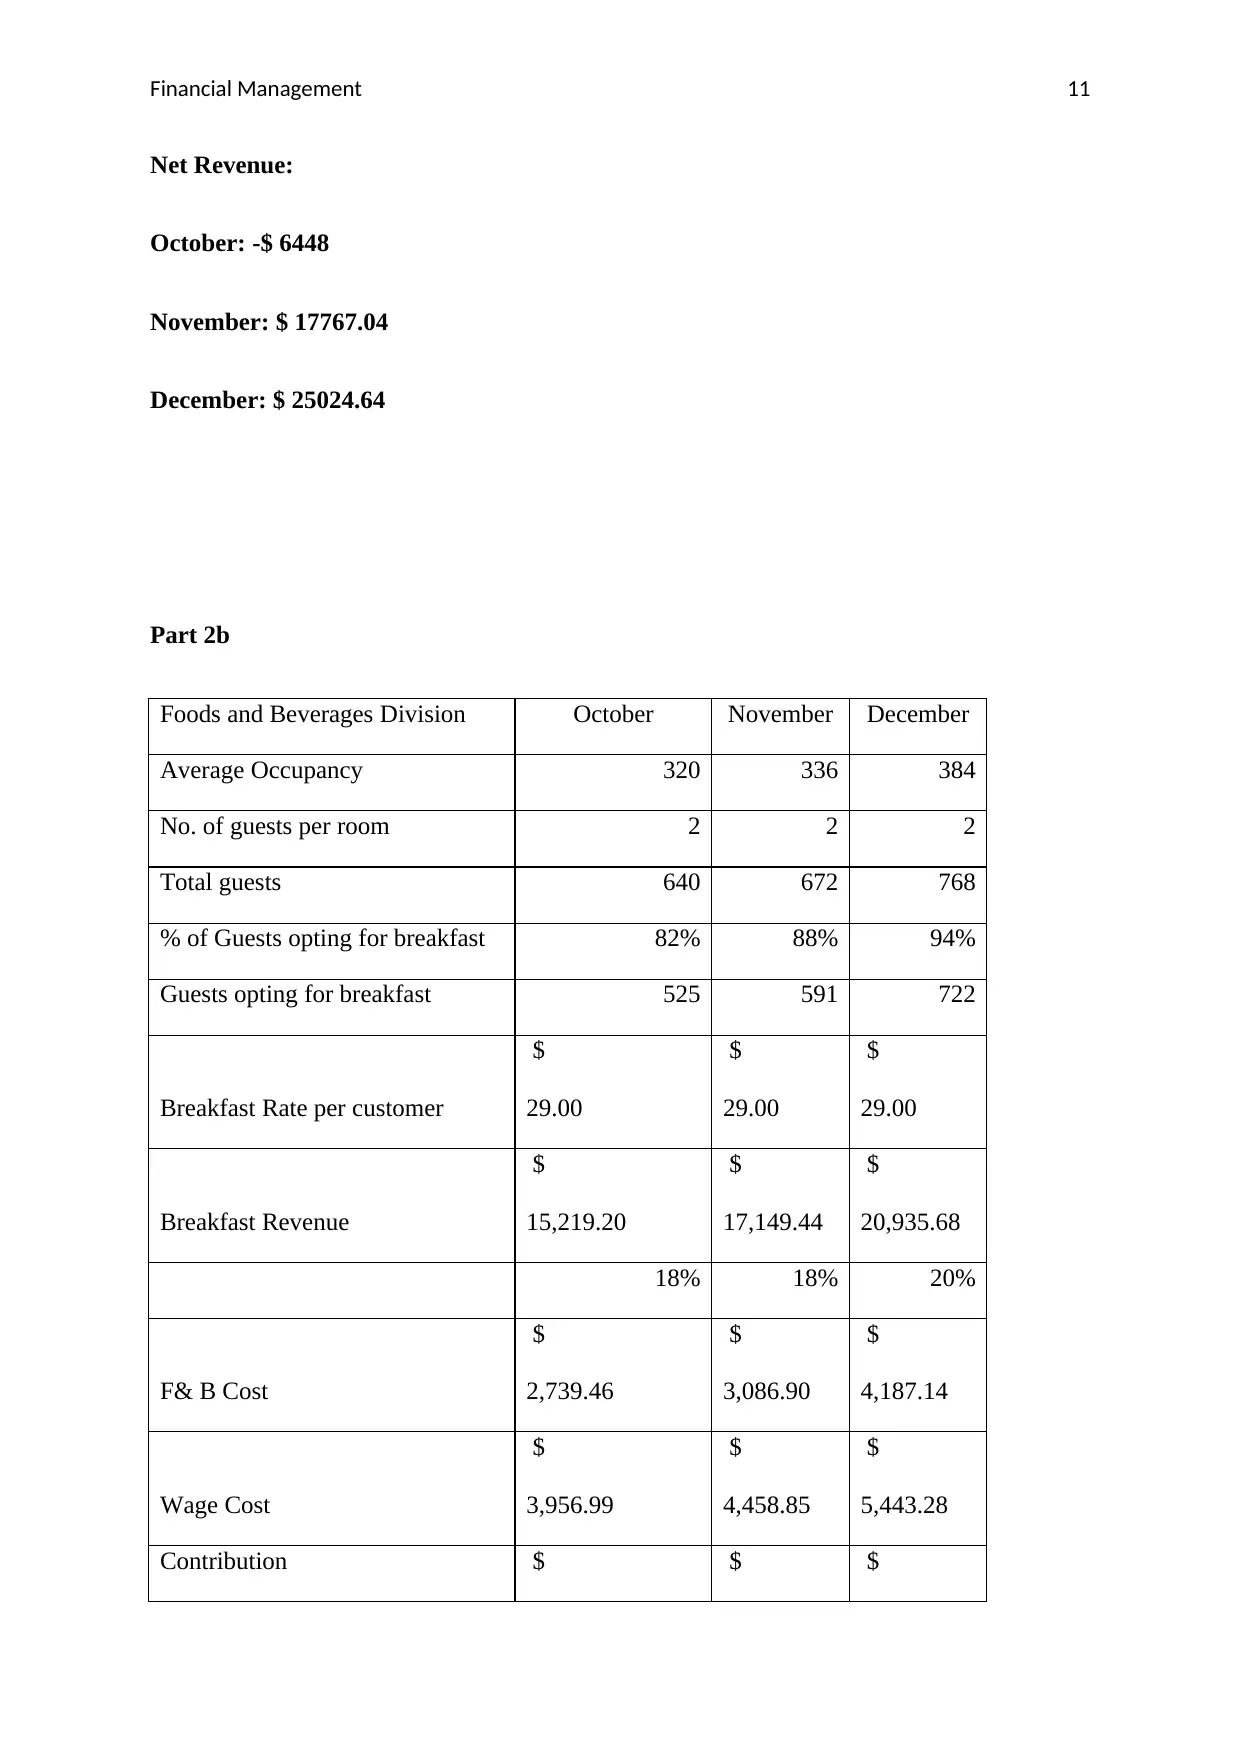
This assignment is a comprehensive analysis of financial management principles, encompassing both quantitative and qualitative aspects. Part A delves into capital investment decisions, evaluating two projects using various methods like payback period (both simple and discounted), accounting rate of return (ARR), net present value (NPV), and internal rate of return (IRR) to determine project feasibility. Part B shifts the focus to the roles and responsibilities of a Chief Financial Officer (CFO), including strategic financial planning, risk management, ethical leadership, and stakeholder communication. The analysis extends to a case study of Zelma Hotel, examining room division and food & beverage division performance, including revenue, variable costs, fixed costs, and profitability. The assignment incorporates 'what-if' scenarios and discusses the impact of changes in room bookings, variable costs, and fixed costs on overall profitability. The document concludes with an assessment of the challenges and duties of a CFO, emphasizing ethical and fiduciary responsibilities.
Document Page
Running Head: Financial Management
Financial and Accounting Management
tabler-icon-diamond-filled.svg

Paraphrase This Document

Need a fresh take? Get an instant paraphrase of this document with our AI Paraphraser
Document Page
Financial Management 1
PART A
Requirement I
Part a Payback Period method
Project A
Years Cash Flows Cumulative Cash Flows
0 -$3,300,850 -$3,300,850
1 $580,652 -$2,720,198
2 $600,645 -$2,119,553
3 $648,000 -$1,471,553
4 $678,000 -$793,553
5 $690,000 -$103,553
6 $700,000 $596,447
7 $710,000 $1,306,447
Payback
Period=
5+
(103553/(596447+103553)
)
Payback
Period 5.15 years
However, use of payback period model will give absurd results as it is not taking into
account the time value of money. Thus, we are required to calculate discounted payback
period.
Discounted payback period
Document Page
Financial Management 2
Cash
Flows DCF @ 10% PV
Cumulative
PV
0
-
$3,300,850 1.000
-
$3,300,850.00
-
$3,300,850.00
1 $580,652
0.909 $527,865.45
-
$2,772,984.55
2 $600,645
0.826 $496,400.83
-
$2,276,583.72
3 $648,000
0.751 $486,851.99
-
$1,789,731.73
4 $678,000
0.683 $463,083.12
-
$1,326,648.61
5 $690,000 0.621 $428,435.71 -$898,212.89
6 $700,000 0.564 $395,131.75 -$503,081.14
7 $710,000 0.513 $364,342.26 -$138,738.88
No payback period is there in case of Project A as the project is not able to generate net
cash inflow throughout its life span.
Project B
Years Cash Flows Cumulative Cash Flows
0 -$3,899,900 -$3,899,900
1 $680,652 -$3,219,248
2 $700,645 -$2,518,603
3 $748,000 -$1,770,603
4 $798,000 -$972,603
Document Page
Financial Management 3
5 $820,000 -$152,603
6 $901,000 $748,397
7 $919,050 $1,667,447
Payback
Period=
5+
(152603/152603+748397))
Payback
Period 5.17
Cash
Flows DCF @ 10% PV
Cumulative
PV
0
-
$3,899,90
0 1.000
-
$3,899,900.00
0
-
$3,899,900.00
0
1 $680,652
0.909 $618,774.545
-
$3,281,125.45
5
2 $700,645
0.826 $579,045.455
-
$2,702,080.00
0
3 $748,000
0.751 $561,983.471
-
$2,140,096.52
9
4 $798,000 0.683 $545,044.737 -
$1,595,051.79
tabler-icon-diamond-filled.svg

Paraphrase This Document

Need a fresh take? Get an instant paraphrase of this document with our AI Paraphraser
Document Page
Financial Management 4
2
5 $820,000
0.621 $509,155.485
-
$1,085,896.30
7
6 $901,000 0.564 $508,591.011 -$577,305.296
7 $919,050 0.513 $471,617.969 -$105,687.327
Under both the project alternatives the cost of initial investment will be recovered in 5 years
and few months as per simple payback model. However, Project B will take few months
more than Project A.
But as per discounted payback period model, there will no payback period in both the cases.
Part b: Accounting Rate of Return (ARR)
It is assumed that accounting profits and cash flows are equivalent to each other as no
information of accounting profits is given in case.
Project A
Years Cash Flows
0 -$3,300,850
1 $580,652
2 $600,645
3 $648,000
4 $678,000
Document Page
Financial Management 5
5 $690,000
6 $700,000
7 $710,000
Average
Earnings $658,185
Initial
Investment $3,300,850.00
Average
Earnings
($580,652+$600,645+$648,000+$678,000+$690,000+
$700,000+$710,000)/7
ARR 19.94%
Project B
Cash Flows
0 -$3,899,900
1 $680,652
2 $700,645
3 $748,000
4 $798,000
5 $820,000
6 $901,000
7 $919,050
Average $795,335
Document Page
Financial Management 6
Earnings
Initial
Investment $3,899,900
Average
Earnings
($680,652+$700,645+$748,000+$798,000+$820,000+$901,000+
$919,050)/7
ARR 20.39%
Project B has a higher ARR than Project A. Hence, Project B is more suitable to be opted
than Project A.
Part c: Net Present Value
Project A
Cash Flows DCF @ 10% PV
0
-$3,300,850
1.000
-
$3,300,850.0
0
1 $580,652 0.909 $527,865.45
2 $600,645 0.826 $496,400.83
3 $648,000 0.751 $486,851.99
4 $678,000 0.683 $463,083.12
5 $690,000 0.621 $428,435.71
6 $700,000 0.564 $395,131.75
7 $710,000 0.513 $364,342.26
tabler-icon-diamond-filled.svg

Paraphrase This Document

Need a fresh take? Get an instant paraphrase of this document with our AI Paraphraser
Document Page
Financial Management 7
NPV -$138,738.88
Project B
Cash Flows DCF @ 10% PV
0
-$3,899,900
1.000
-
$3,899,900.00
0
1 $680,652 0.909 $618,774.545
2 $700,645 0.826 $579,045.455
3 $748,000 0.751 $561,983.471
4 $798,000 0.683 $545,044.737
5 $820,000 0.621 $509,155.485
6 $901,000 0.564 $508,591.011
7 $919,050 0.513 $471,617.969
NPV -$105,687.33
Both the projects are generating negative cash outflows and negative NPV hence both are not
suitable for the proposed investment. However, Project B is better than Project A because of
involvement of less net cash outflows.
Part d: Internal Rate of Return
Project A
Cash Flows 8.76%
0 -$3,300,850 1.000 -
Document Page
Financial Management 8
3300850.00
0
1 $580,652 0.919 533888.935
2 $600,645 0.845 507794.338
3 $648,000 0.777 503709.321
4 $678,000 0.715 484584.668
5 $690,000 0.657 453444.418
6 $700,000 0.604 422968.479
7 $710,000 0.556 394460.305
IRR 8.76% $0.5
Project B
Cash Flows 9.22%
0
-$3,899,900
1.000
-
$3,899,900.0
0
1 $680,652 0.916 $623,209.65
2 $700,645 0.838 $587,375.88
3 $748,000 0.768 $574,154.43
4 $798,000 0.703 $560,840.10
5 $820,000 0.643 $527,665.94
6 $901,000 0.589 $530,858.82
7 $919,050 0.539 $495,795.33
$0.14
Document Page
Financial Management 9
IRR 9.22%
IRR shows that at IRR, the project will not have any net cash outflow or inflow and therefore
the NPV will remain Zero at this point. Since the IRR is less than the overall discounting rate
which, the projects are not going to be profitable for the business.
Requirement II
From the above analysis, it can be concluded that project B must be selected as it involves
less of net cash outflows and also the ARR of project B is higher than project A. Though,
both the project entails negative NPVs and hence are not able to recover the initial investment
cost but yet the project B is more feasible than Project A.
Part 2a)
Room Division October November December Total
Average Occupancy 320 336 384
Average Room Rate 380 452 428
Revenue from renting
$
121,600.00
$
151,872.00
$
164,352.00
$
437,824.00
Average Room Rate
$
380.00
$
452.00
$
428.00
$
1,260.00
Variable cost per room
$
38.00
$
38.00
$
41.00
$
117.00
Labour
$
68.40
$
81.36
$
77.04
$
226.80
Contribution $ $ $ $
tabler-icon-diamond-filled.svg

Paraphrase This Document

Need a fresh take? Get an instant paraphrase of this document with our AI Paraphraser
Document Page
Financial Management 10
273.60 332.64 309.96 916.20
Total Contribution
$
87,552.00
$
111,767.04
$
119,024.64
$
318,343.68
Revenue from renting
$
121,600.00
$
151,872.00
$
164,352.00
$
437,824.00
Less: Cost
Variable Cost
$
12,160.00
$
12,768.00
$
15,744.00
$
40,672.00
Labour Cost
$
21,888.00
$
27,336.96
$
29,583.36
$
78,808.32
Total Variable Cost
$
34,048.00
$
40,104.96
$
45,327.36
$
119,480.32
Contribution
$
87,552.00
$
111,767.04
$
119,024.64
$
318,343.68
Less: Fixed Cost
$
94,000.00
$
94,000.00
$
94,000.00
$
282,000.00
Net Revenue/Profit
-$
6,448.00
$
17,767.04
$
25,024.64
$
36,343.68
Total Revenue:
October: $ 121,600
November: $ 151,872
December: $ 164,352
Document Page
Financial Management 11
Net Revenue:
October: -$ 6448
November: $ 17767.04
December: $ 25024.64
Part 2b
Foods and Beverages Division October November December
Average Occupancy 320 336 384
No. of guests per room 2 2 2
Total guests 640 672 768
% of Guests opting for breakfast 82% 88% 94%
Guests opting for breakfast 525 591 722
Breakfast Rate per customer
$
29.00
$
29.00
$
29.00
Breakfast Revenue
$
15,219.20
$
17,149.44
$
20,935.68
18% 18% 20%
F& B Cost
$
2,739.46
$
3,086.90
$
4,187.14
Wage Cost
$
3,956.99
$
4,458.85
$
5,443.28
Contribution $ $ $
chevron_up_icon
1 out of 22
circle_padding
hide_on_mobile
zoom_out_icon
[object Object]