Report: Financial Performance Comparison of ERM and Pacific Energy
VerifiedAdded on 2020/06/04
|13
|3752
|86
Report
AI Summary
This report presents a comparative financial analysis of ERM Ltd. and Pacific Energy Ltd., evaluating their financial positions through income statements and balance sheets. The analysis indicates that Pacific Ltd. demonstrates superior performance in terms of profitability, liquidity, and asset efficiency ratios, making it a more attractive investment option. The report also examines capital structure ratios and CSR aspects, highlighting ERM's strengths in capital structure and the importance of CSR in business development. Key findings include Pacific Ltd.'s capacity to meet debts and generate fruitful earnings, alongside a discussion of the limitations of ratio analysis and its impact on stakeholder decisions. The analysis includes comparison of consolidated income statements and balance sheets, providing insights into the economic conditions and market stability of both organizations. The comparison includes profitability, liquidity, and efficiency ratios to assess the organizations' ability to meet debts. The report also discusses the advantages of the financial analysis for the stakeholders.

ACCOUNTING
Paraphrase This Document
Need a fresh take? Get an instant paraphrase of this document with our AI Paraphraser
EXECUTIVE SUMMARY
In the present report there has been comparison between two companies and their
financial positions by comparing their income statements, balance sheet which indicates that
Pacific Ltd is far better than the ERM Ltd as well as profitable and the liquidity and profitability
ratios are better for investors to make the investment in the Pacific Ltd. It can be said that the
organization will be beneficial as per the CSR report which will be used by Stakeholders in
making decisions as to make investment in the organization. Analysis made by investors reveals
that Pacific has the capacity to meet the debts on time as well as able to generate the fruitful
earnings. However, there has been various kinds or analysis made such as consolidated income
statements as well as consolidated balance sheet of both industries. It helps in identifying the
economic condition of such organizations as well as their stability in market.
There should be including various ratios such as profitability, liquidity, efficiency etc.
which elaborates capacity of organization in meeting debts. Such findings or disclosure will be
bountiful for the stakeholders in the internal as well as external environment to access the
turnover generated by such organization. Hence, as per the analysis and comparison based on
ERM Ltd as well as Pacific Energy Ltd, there has been variations in the profit earning capacity of
both the organizations as well as in their ratio analysis. It can influence to stakeholders in making
investments in Pacific Ltd which indicates that, this firm is more profitable as it has favorable
liquidity or will be good in meeting debts as well as generating funds. On behalf of it, the
stakeholders will be benefited if they make investments in this industry. On the other side, these
reports will be beneficial for the professional in organization in making favourable decisions so
they can be able to make improvements in operational performances. They will be able to analyse
the costs or expenses made on such activities as well as implementation various strategies in
order to control such expenses. Equity ratio of Pacific Ltd describes that this firm is able to pay
dividends to its clients or shareholders on favorable mark as well as it will be profitablity for
equity holders in making good earnings.
CONTENTS
EXECUTIVE SUMMARY.............................................................................................................i
INTRODUCTION..........................................................................................................................3
QUESTION 1 .................................................................................................................................4
QUESTION 2 .................................................................................................................................6
QUESTION 3 .................................................................................................................................7
CONCLUSION...............................................................................................................................8
APPENDIX....................................................................................................................................10
⊘ This is a preview!⊘
Do you want full access?
Subscribe today to unlock all pages.
Trusted by 1+ million students worldwide
INTRODUCTION
Accounting helps the firm to analysis the profitability, income generation and loss of the
business during operational activities. In the present assessment, it has been defined as
preparation of the financial records for firm and verification and reporting of such record. This
report contains, calculations of various ratios, income statement as well as financial position of
ERM and Pacific Energy limited. These analysis helps the investors or stakeholders to make
favorable decisions regarding investment of funds in most suitable firm. Accounting ratio
compares the two prospect of financial statements which will assist the firm to calculate the
assets and current liability. The further report will tell how the financial accounting assist both
the company's ability to meet the long term and short term debts. Further, there will be discussion
about the loopholes and the strength of the organization in the long run which will be bountiful
for internal as well as external operations.
Paraphrase This Document
Need a fresh take? Get an instant paraphrase of this document with our AI Paraphraser
QUESTION 1
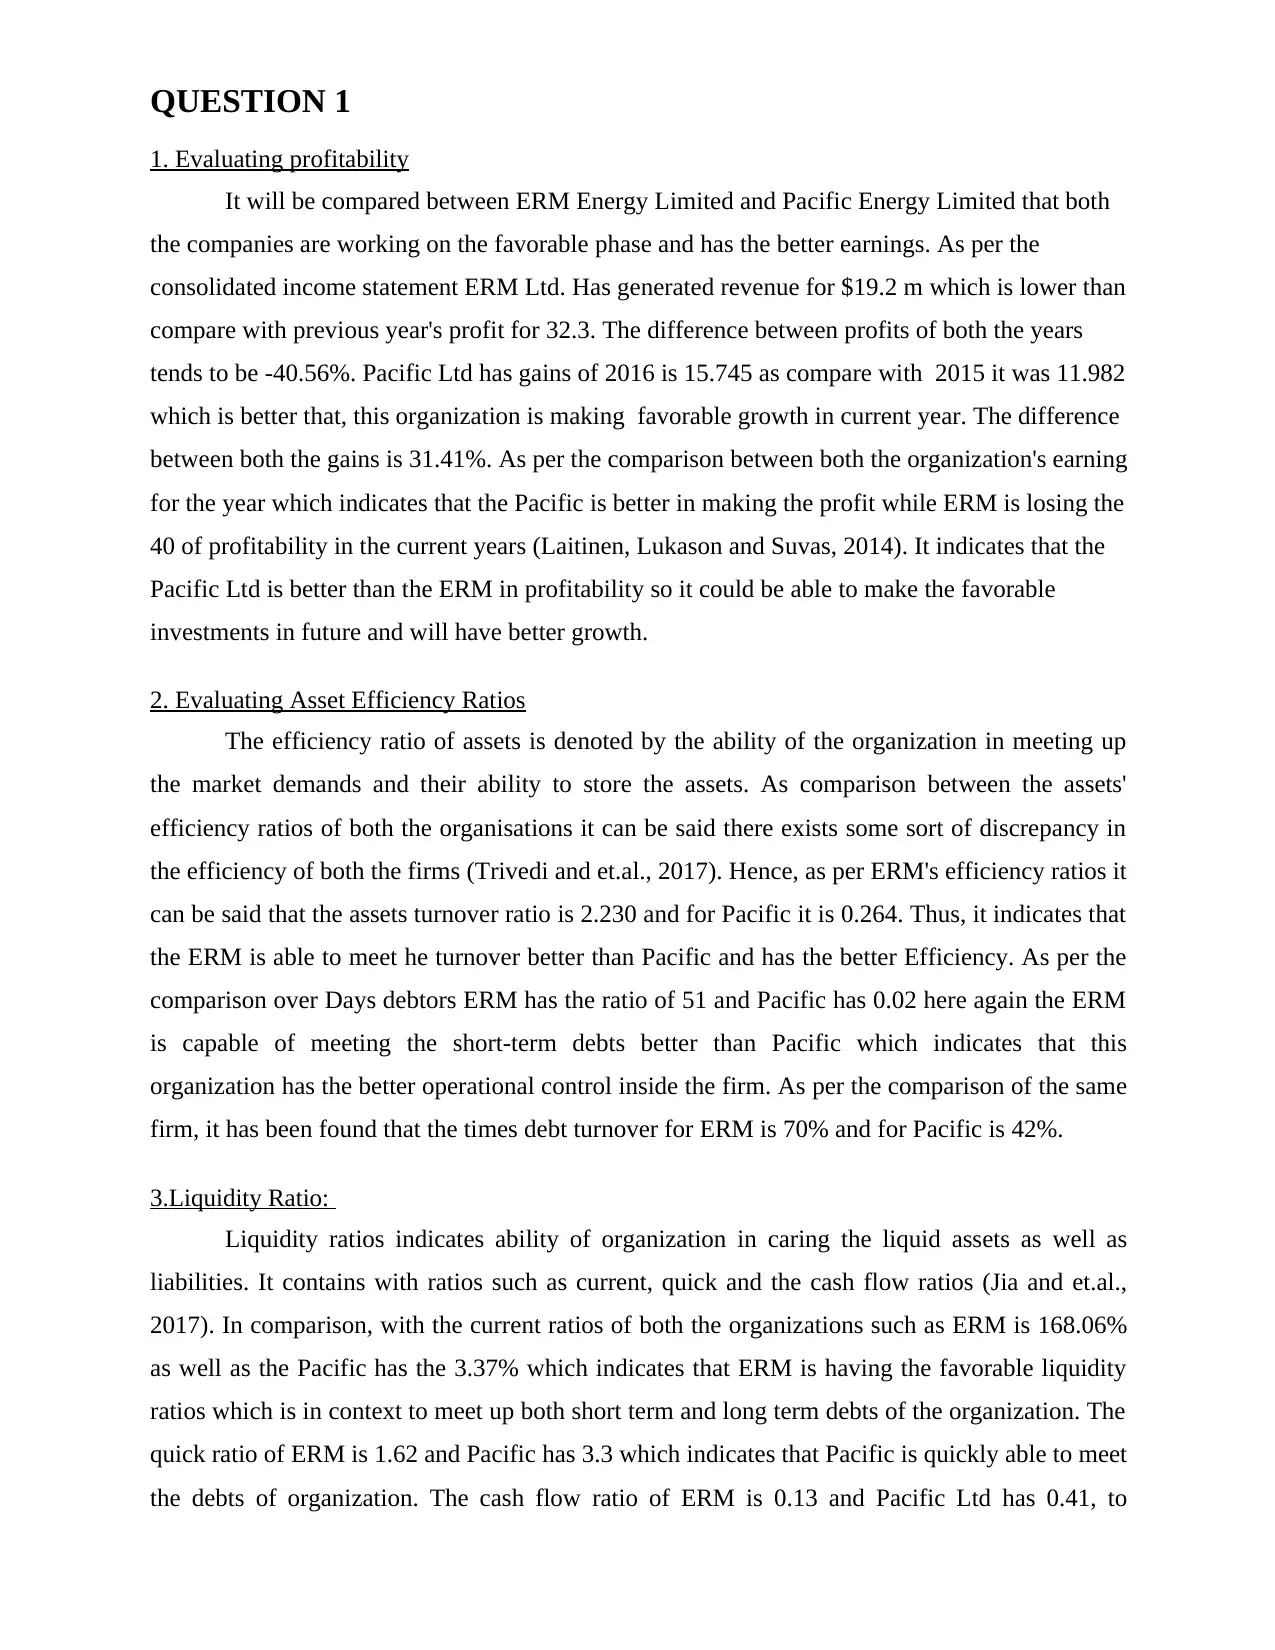
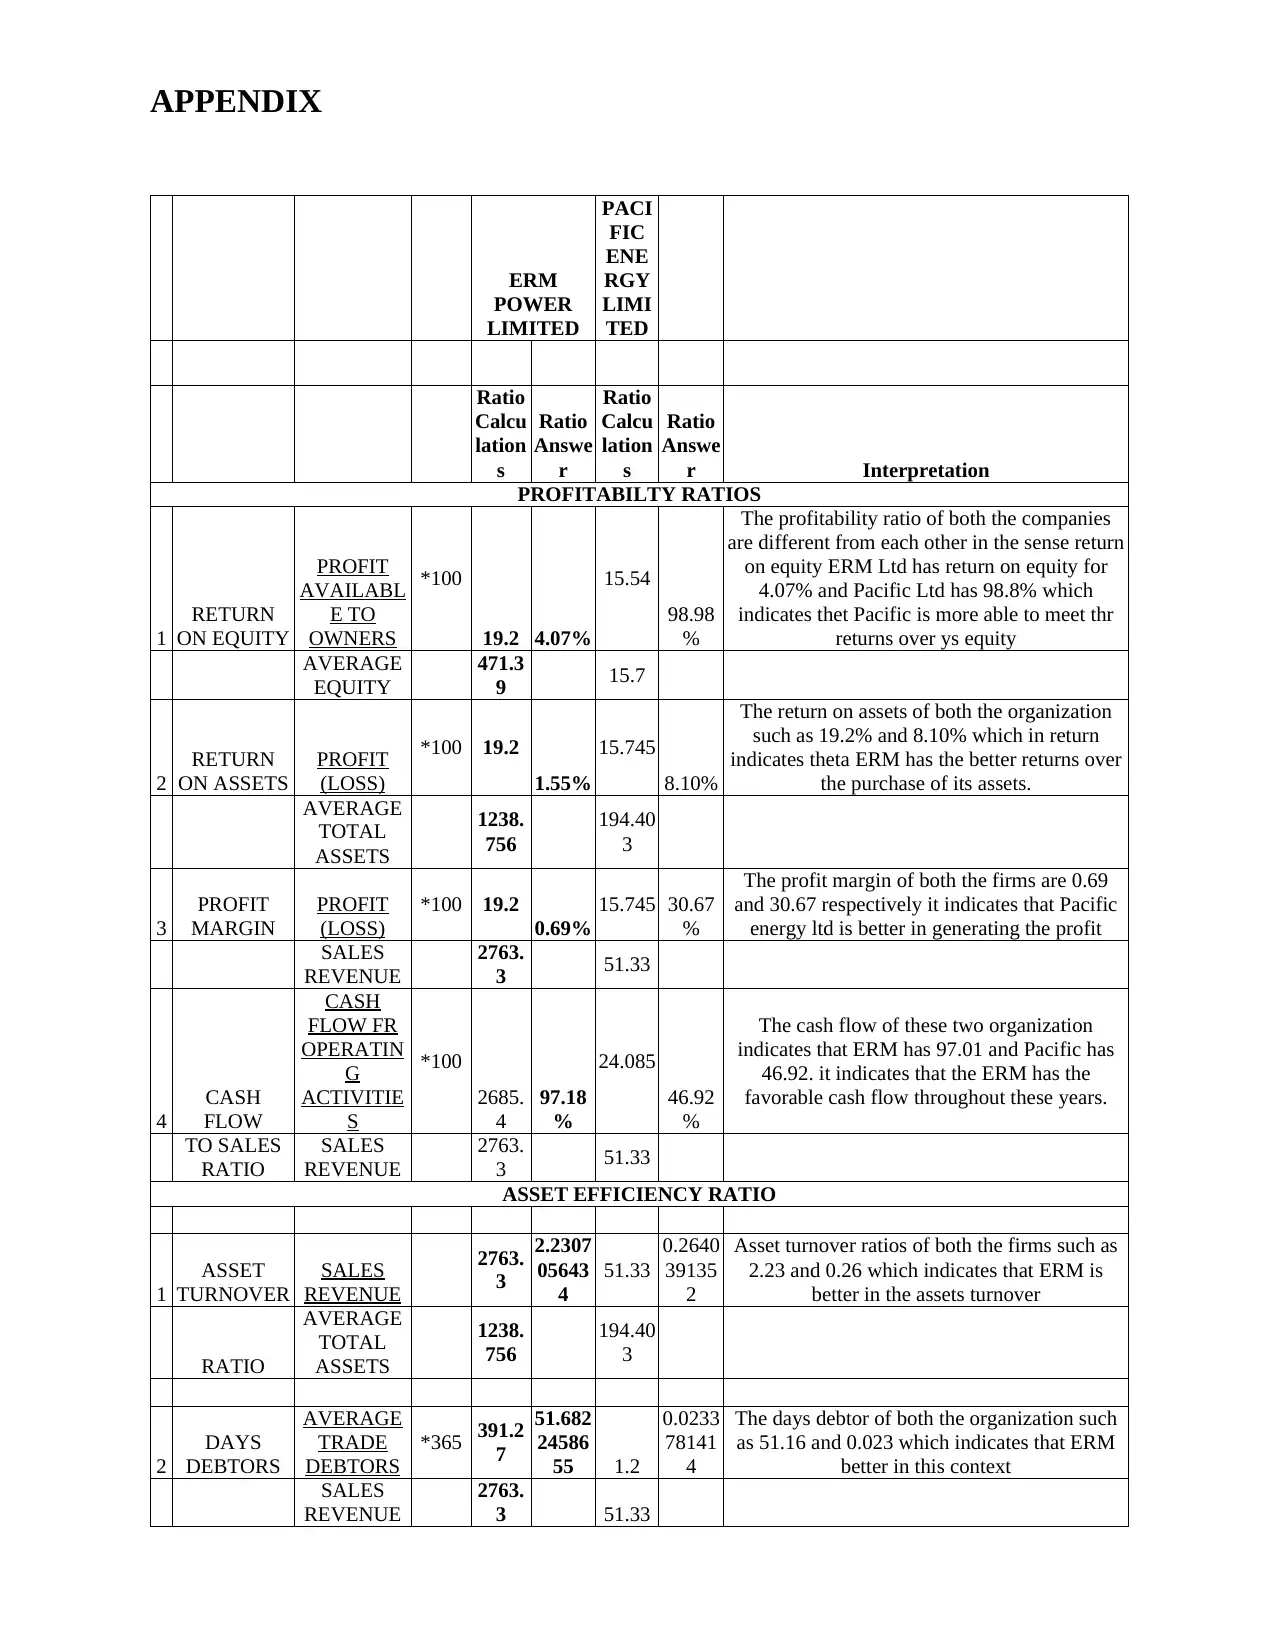
1. Evaluating profitability
It will be compared between ERM Energy Limited and Pacific Energy Limited that both
the companies are working on the favorable phase and has the better earnings. As per the
consolidated income statement ERM Ltd. Has generated revenue for $19.2 m which is lower than
compare with previous year's profit for 32.3. The difference between profits of both the years
tends to be -40.56%. Pacific Ltd has gains of 2016 is 15.745 as compare with 2015 it was 11.982
which is better that, this organization is making favorable growth in current year. The difference
between both the gains is 31.41%. As per the comparison between both the organization's earning
for the year which indicates that the Pacific is better in making the profit while ERM is losing the
40 of profitability in the current years (Laitinen, Lukason and Suvas, 2014). It indicates that the
Pacific Ltd is better than the ERM in profitability so it could be able to make the favorable
investments in future and will have better growth.
2. Evaluating Asset Efficiency Ratios
The efficiency ratio of assets is denoted by the ability of the organization in meeting up
the market demands and their ability to store the assets. As comparison between the assets'
efficiency ratios of both the organisations it can be said there exists some sort of discrepancy in
the efficiency of both the firms (Trivedi and et.al., 2017). Hence, as per ERM's efficiency ratios it
can be said that the assets turnover ratio is 2.230 and for Pacific it is 0.264. Thus, it indicates that
the ERM is able to meet he turnover better than Pacific and has the better Efficiency. As per the
comparison over Days debtors ERM has the ratio of 51 and Pacific has 0.02 here again the ERM
is capable of meeting the short-term debts better than Pacific which indicates that this
organization has the better operational control inside the firm. As per the comparison of the same
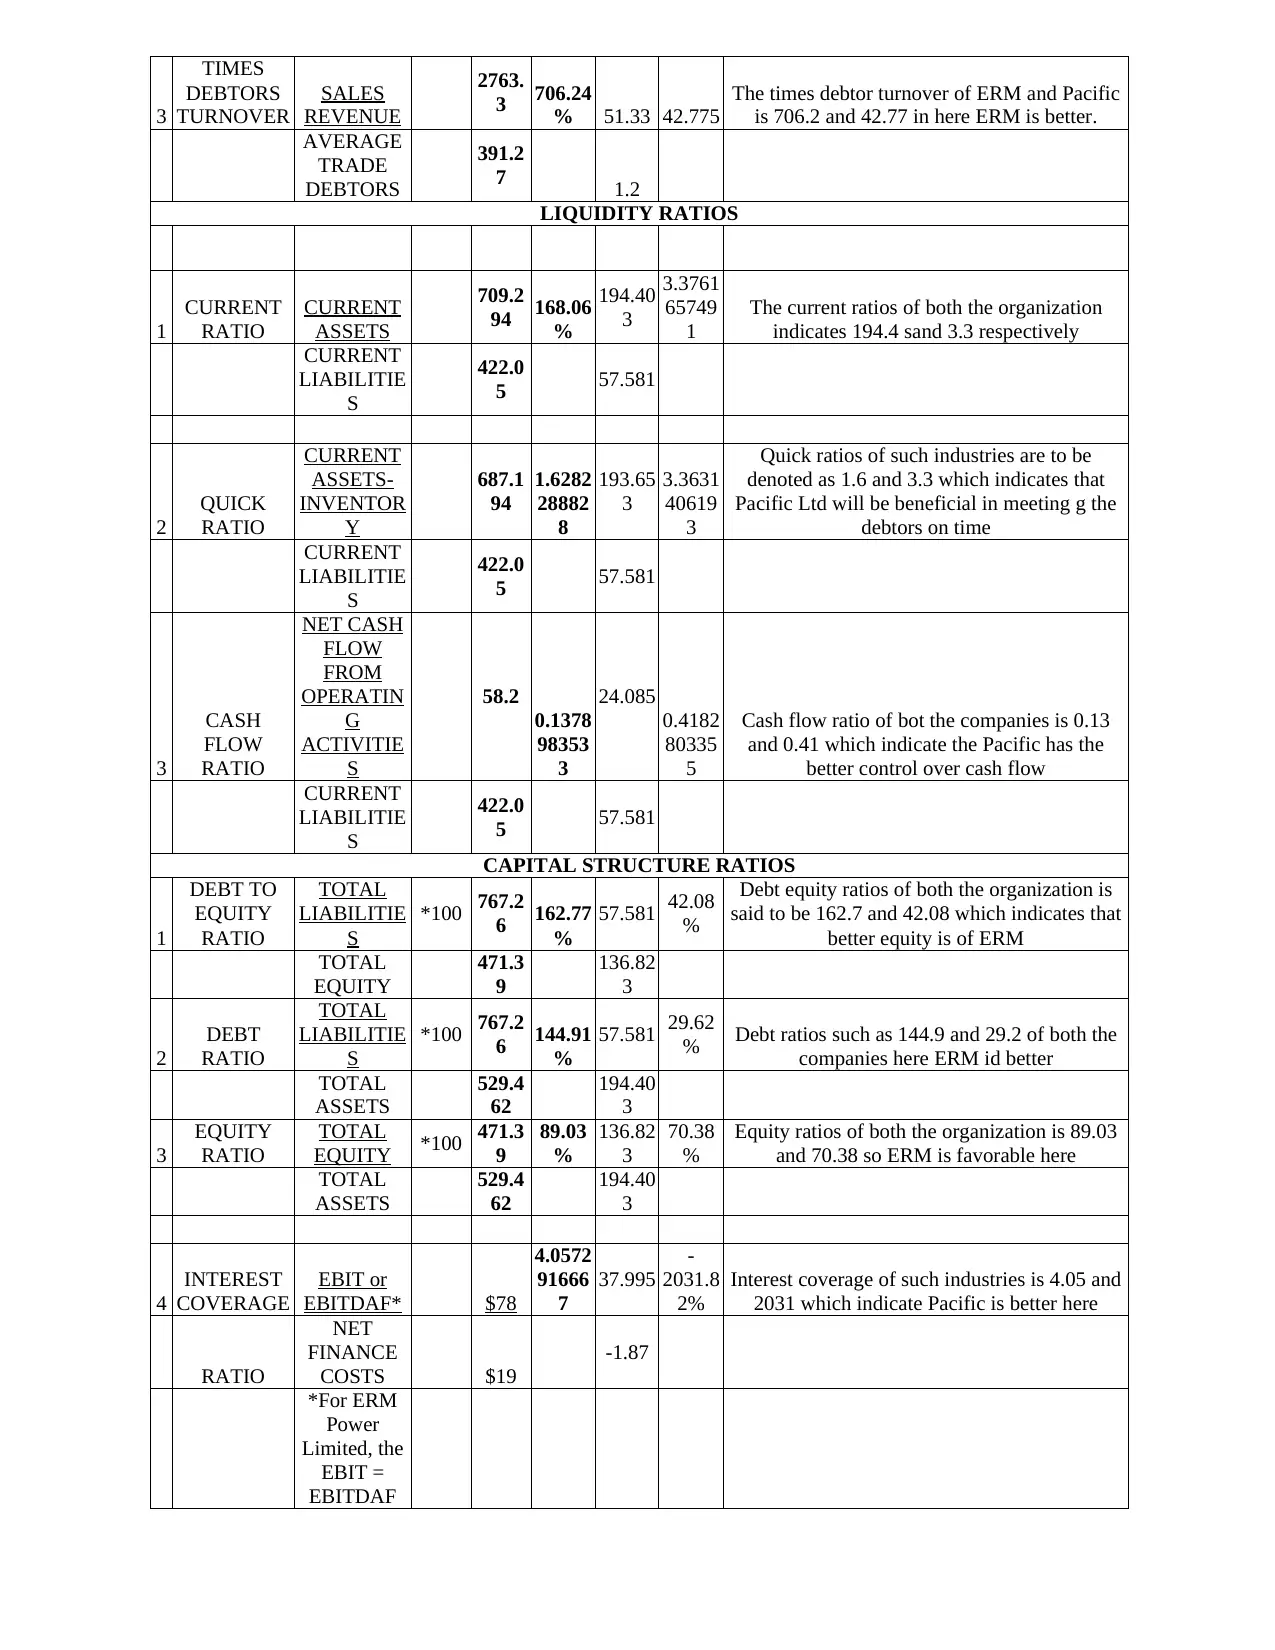
firm, it has been found that the times debt turnover for ERM is 70% and for Pacific is 42%.
3.Liquidity Ratio:
Liquidity ratios indicates ability of organization in caring the liquid assets as well as
liabilities. It contains with ratios such as current, quick and the cash flow ratios (Jia and et.al.,
2017). In comparison, with the current ratios of both the organizations such as ERM is 168.06%
as well as the Pacific has the 3.37% which indicates that ERM is having the favorable liquidity
ratios which is in context to meet up both short term and long term debts of the organization. The
quick ratio of ERM is 1.62 and Pacific has 3.3 which indicates that Pacific is quickly able to meet
the debts of organization. The cash flow ratio of ERM is 0.13 and Pacific Ltd has 0.41, to
1. Evaluating profitability
It will be compared between ERM Energy Limited and Pacific Energy Limited that both
the companies are working on the favorable phase and has the better earnings. As per the
consolidated income statement ERM Ltd. Has generated revenue for $19.2 m which is lower than
compare with previous year's profit for 32.3. The difference between profits of both the years
tends to be -40.56%. Pacific Ltd has gains of 2016 is 15.745 as compare with 2015 it was 11.982
which is better that, this organization is making favorable growth in current year. The difference
between both the gains is 31.41%. As per the comparison between both the organization's earning
for the year which indicates that the Pacific is better in making the profit while ERM is losing the
40 of profitability in the current years (Laitinen, Lukason and Suvas, 2014). It indicates that the
Pacific Ltd is better than the ERM in profitability so it could be able to make the favorable
investments in future and will have better growth.
2. Evaluating Asset Efficiency Ratios
The efficiency ratio of assets is denoted by the ability of the organization in meeting up
the market demands and their ability to store the assets. As comparison between the assets'
efficiency ratios of both the organisations it can be said there exists some sort of discrepancy in
the efficiency of both the firms (Trivedi and et.al., 2017). Hence, as per ERM's efficiency ratios it
can be said that the assets turnover ratio is 2.230 and for Pacific it is 0.264. Thus, it indicates that
the ERM is able to meet he turnover better than Pacific and has the better Efficiency. As per the
comparison over Days debtors ERM has the ratio of 51 and Pacific has 0.02 here again the ERM
is capable of meeting the short-term debts better than Pacific which indicates that this
organization has the better operational control inside the firm. As per the comparison of the same
firm, it has been found that the times debt turnover for ERM is 70% and for Pacific is 42%.
3.Liquidity Ratio:
Liquidity ratios indicates ability of organization in caring the liquid assets as well as
liabilities. It contains with ratios such as current, quick and the cash flow ratios (Jia and et.al.,
2017). In comparison, with the current ratios of both the organizations such as ERM is 168.06%
as well as the Pacific has the 3.37% which indicates that ERM is having the favorable liquidity
ratios which is in context to meet up both short term and long term debts of the organization. The
quick ratio of ERM is 1.62 and Pacific has 3.3 which indicates that Pacific is quickly able to meet
the debts of organization. The cash flow ratio of ERM is 0.13 and Pacific Ltd has 0.41, to
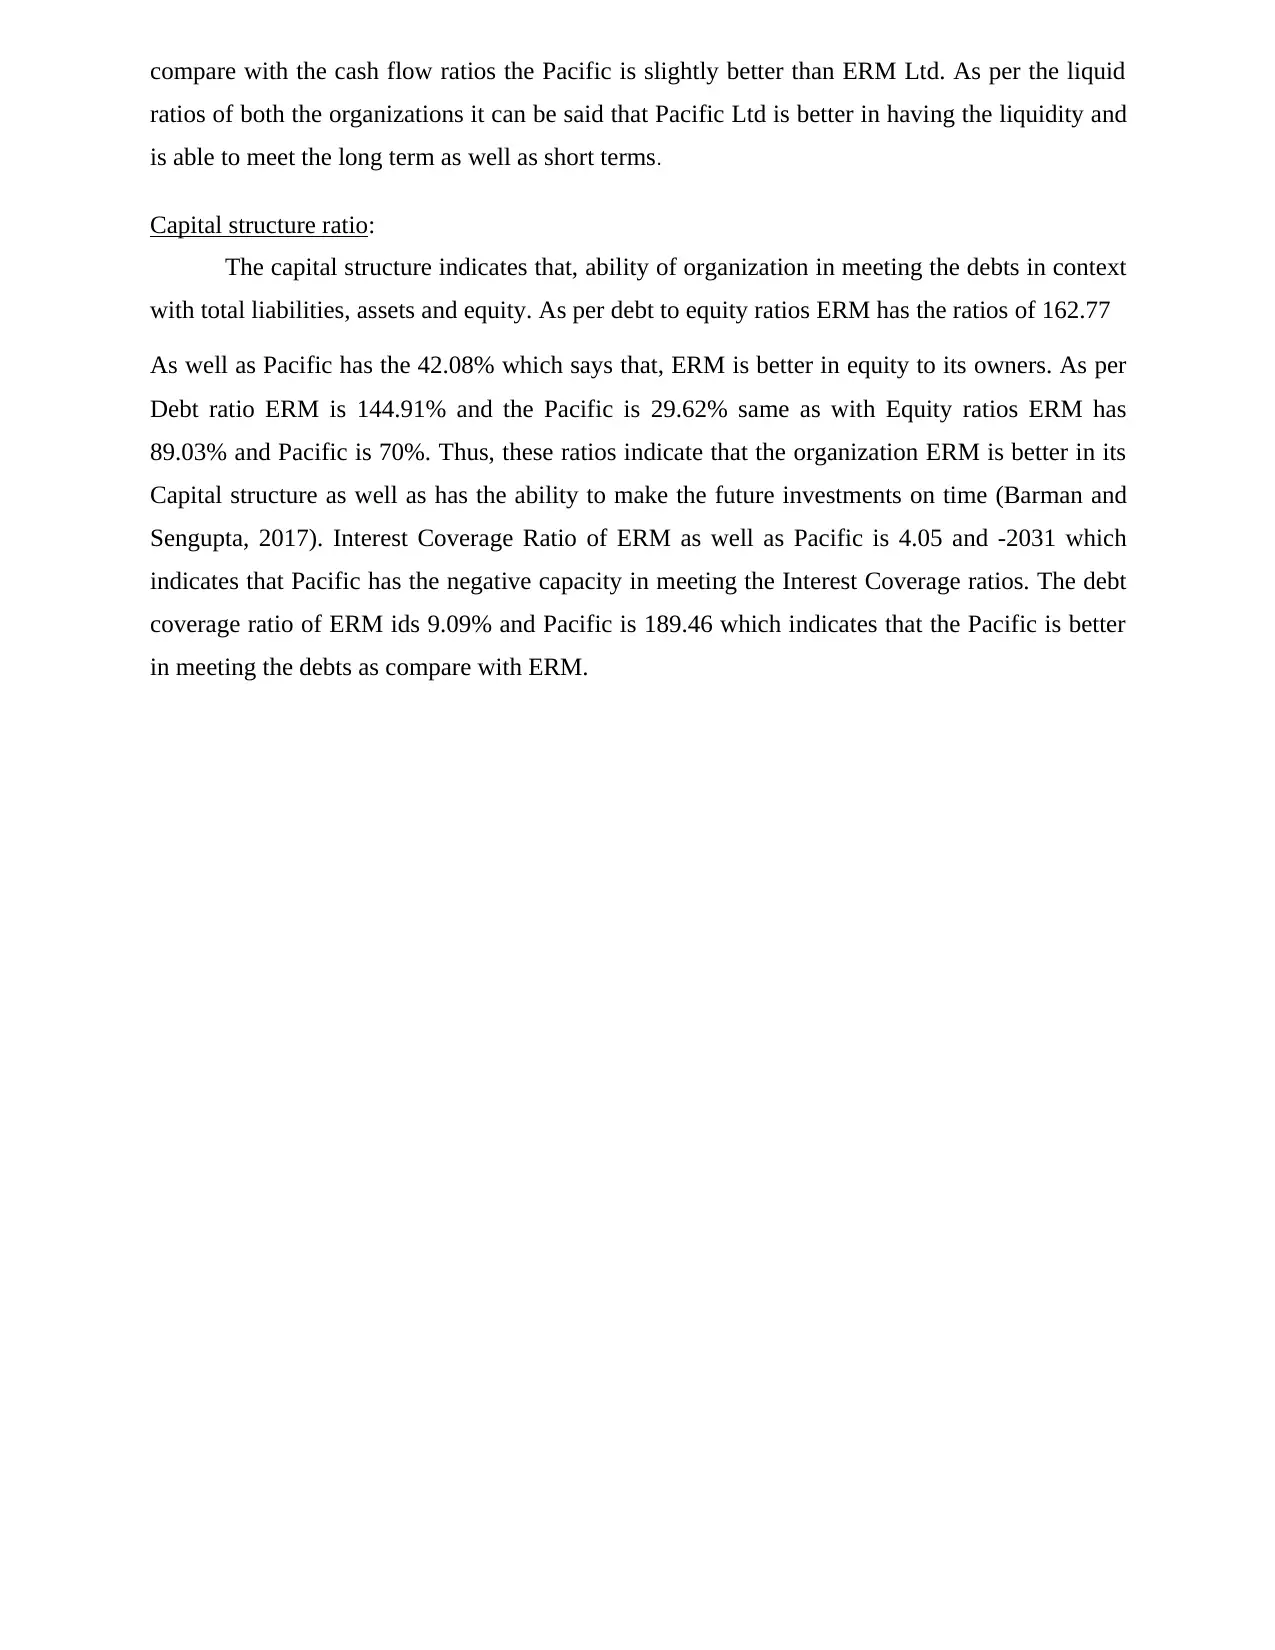
compare with the cash flow ratios the Pacific is slightly better than ERM Ltd. As per the liquid
ratios of both the organizations it can be said that Pacific Ltd is better in having the liquidity and
is able to meet the long term as well as short terms.
Capital structure ratio:
The capital structure indicates that, ability of organization in meeting the debts in context
with total liabilities, assets and equity. As per debt to equity ratios ERM has the ratios of 162.77
As well as Pacific has the 42.08% which says that, ERM is better in equity to its owners. As per
Debt ratio ERM is 144.91% and the Pacific is 29.62% same as with Equity ratios ERM has
89.03% and Pacific is 70%. Thus, these ratios indicate that the organization ERM is better in its
Capital structure as well as has the ability to make the future investments on time (Barman and
Sengupta, 2017). Interest Coverage Ratio of ERM as well as Pacific is 4.05 and -2031 which
indicates that Pacific has the negative capacity in meeting the Interest Coverage ratios. The debt
coverage ratio of ERM ids 9.09% and Pacific is 189.46 which indicates that the Pacific is better
in meeting the debts as compare with ERM.
⊘ This is a preview!⊘
Do you want full access?
Subscribe today to unlock all pages.
Trusted by 1+ million students worldwide
QUESTION 2
As per the analysis of Consolidated income statement as well as consolidated balance
sheet of both the companies such as ERM and Pacific it can be said that, both the organizations is
operating in the favorable stage. As per the income statement of ERM the profit for the year 2016
is 13.2 which is lower as compare with the previous year's profit for 32.3 it indicates the
difference of -40% which says the organization is losing the 40% of profit share in the current
year. On the other site, Pacific Ltd has the profitability which is better in the current for 15.54
which was previous year 11.90. It can be said the Pacific Ltd has the better profitability and
investors will be beneficial if they make the investments in the organization as they will be going
to have the favorable or positive value of share in the future as dividends (Garanina and et.al.,
2017). Further it can be said the ratio analysis of both the companies which indicate that the
Pacific has the better profitability as well as Capacity to meet the debts on time. Which will be
bountiful for the stakeholders such as investors of shareholders to the organization in making the
investment in the organization. It can be assumed that, Pacific Energy Ltd is going to have the
positive growth in coming time and will be beneficial in making the earnings.
Paraphrase This Document
Need a fresh take? Get an instant paraphrase of this document with our AI Paraphraser
QUESTION 3
Demerits of Ratio analysis of the Financial statements' analysis
The ratio analysis is very helpful device to study the financial statements of the company
although having some disadvantages as well:.
Historical information- all the information used in the ratio analysis are based on the
historical data and not the new or latest on. The available data will certainly not reflect or
show the current position of the company.
Different accounting policies- as if comparing two different company it is not correct as
both the company may be using different policies' valuation of inventories, charging of
depreciation and all the other methods. So, it would be not good to compare the two firms
one any bases.
Quantitative analysis- The ratios are based on the quantitative analysis only and
qualitative aspects are ignored totally. A company performing well does not give the
quality assurance of that firm. For instance, high, current ratio will not certainly mean
sound liquid position when current assets include a large stock consisting of mostly
obsolete unit.
CSR means the corporate social responsibility of the ERM energy and Pacific energy how
much they are aware of their social responsibilities. CSR help ERM energy and Pacific energy to
grow more in the energy industry (Trivedi and et.al., 2017). They both ERM energy and Pacific
energy should be able to analysis the roles to be played in the society. CSR help ERM energy and
Pacific energy to sustain in the business, help them in decision making process and
competitiveness as well. The social and environmental performance of the ERM energy and
Pacific energy will also affect the growth of the ERM energy and Pacific energy. But ERM
energy performance is of better than pacific energy as ERM energy is more aware of the social
factor which is important in the business development.
CONCLUSION
Form the above report it is summarized that ratio analysis comparison of both the
company ERM energy and Pacific energy is not of much effect as both company differ from each
other on many terms. Financial analysis helps the ERM energy and Pacific energy to see what are
the profits and loss of the company and what can be done to improve the performance of the
ERM energy and Pacific energy. Fulfilling CSR is also important where it assists the company to
grow and boost up their sales for further increasing their profit levels.
⊘ This is a preview!⊘
Do you want full access?
Subscribe today to unlock all pages.
Trusted by 1+ million students worldwide
REFERENCES
Books and Journals
Barman, A. N. and Sengupta, P. P., 2017. DETERMINANTS OF PROFITABILITY IN INDIAN
TELECOM INDUSTRY USING FINANCIAL RATIO ANALYSIS. International Journal
of Research in Management & Social Science, p.25.
Garanina, T. and et.al., 2017. Forward-looking intellectual capital disclosure in IPOs:
implications for intellectual capital and integrated reporting. Journal of Intellectual Capital.
18(1). pp.128-148.
Jia, W., and et.al., 2017. D/H ratio analysis of pyrolysis-released n-alkanes from asphaltenes for
correlating oils from different sources. Journal of Analytical and Applied Pyrolysis. 126.
pp.99-104.
Laitinen, E. K., Lukason, O. and Suvas, A., 2014. Behaviour of financial ratios in firm failure
process: an international comparison. International journal of finance and accounting. 3(2).
pp.122-131.
Trivedi, M. K., and et.al., 2017. Structural Properties and Isotopic Abundance Ratio Analysis of
Magnesium Gluconate Treated with the Energy of Consciousness Using LC-MS and NMR
Spectroscopy. International Journal of Applied Agricultural Sciences. 3(2).
Paraphrase This Document
Need a fresh take? Get an instant paraphrase of this document with our AI Paraphraser
APPENDIX
ERM
POWER
LIMITED
PACI
FIC
ENE
RGY
LIMI
TED
Ratio
Calcu
lation
s
Ratio
Answe
r
Ratio
Calcu
lation
s
Ratio
Answe
r Interpretation
PROFITABILTY RATIOS
1
RETURN
ON EQUITY
PROFIT
AVAILABL
E TO
OWNERS
*100
19.2 4.07%
15.54
98.98
%
The profitability ratio of both the companies
are different from each other in the sense return
on equity ERM Ltd has return on equity for
4.07% and Pacific Ltd has 98.8% which
indicates thet Pacific is more able to meet thr
returns over ys equity
AVERAGE
EQUITY
471.3
9 15.7
2
RETURN
ON ASSETS
PROFIT
(LOSS)
*100 19.2
1.55%
15.745
8.10%
The return on assets of both the organization
such as 19.2% and 8.10% which in return
indicates theta ERM has the better returns over
the purchase of its assets.
AVERAGE
TOTAL
ASSETS
1238.
756
194.40
3
3
PROFIT
MARGIN
PROFIT
(LOSS)
*100 19.2
0.69%
15.745 30.67
%
The profit margin of both the firms are 0.69
and 30.67 respectively it indicates that Pacific
energy ltd is better in generating the profit
SALES
REVENUE
2763.
3 51.33
4
CASH
FLOW
CASH
FLOW FR
OPERATIN
G
ACTIVITIE
S
*100
2685.
4
97.18
%
24.085
46.92
%
The cash flow of these two organization
indicates that ERM has 97.01 and Pacific has
46.92. it indicates that the ERM has the
favorable cash flow throughout these years.
TO SALES
RATIO
SALES
REVENUE
2763.
3 51.33
ASSET EFFICIENCY RATIO
1
ASSET
TURNOVER
SALES
REVENUE
2763.
3
2.2307
05643
4
51.33
0.2640
39135
2
Asset turnover ratios of both the firms such as
2.23 and 0.26 which indicates that ERM is
better in the assets turnover
RATIO
AVERAGE
TOTAL
ASSETS
1238.
756
194.40
3
2
DAYS
DEBTORS
AVERAGE
TRADE
DEBTORS
*365 391.2
7
51.682
24586
55 1.2
0.0233
78141
4
The days debtor of both the organization such
as 51.16 and 0.023 which indicates that ERM
better in this context
SALES
REVENUE
2763.
3 51.33
3
TIMES
DEBTORS
TURNOVER
SALES
REVENUE
2763.
3 706.24
% 51.33 42.775
The times debtor turnover of ERM and Pacific
is 706.2 and 42.77 in here ERM is better.
AVERAGE
TRADE
DEBTORS
391.2
7 1.2
LIQUIDITY RATIOS
1
CURRENT
RATIO
CURRENT
ASSETS
709.2
94 168.06
%
194.40
3
3.3761
65749
1
The current ratios of both the organization
indicates 194.4 sand 3.3 respectively
CURRENT
LIABILITIE
S
422.0
5 57.581
2
QUICK
RATIO
CURRENT
ASSETS-
INVENTOR
Y
687.1
94
1.6282
28882
8
193.65
3
3.3631
40619
3
Quick ratios of such industries are to be
denoted as 1.6 and 3.3 which indicates that
Pacific Ltd will be beneficial in meeting g the
debtors on time
CURRENT
LIABILITIE
S
422.0
5 57.581
3
CASH
FLOW
RATIO
NET CASH
FLOW
FROM
OPERATIN
G
ACTIVITIE
S
58.2
0.1378
98353
3
24.085
0.4182
80335
5
Cash flow ratio of bot the companies is 0.13
and 0.41 which indicate the Pacific has the
better control over cash flow
CURRENT
LIABILITIE
S
422.0
5 57.581
CAPITAL STRUCTURE RATIOS
1
DEBT TO
EQUITY
RATIO
TOTAL
LIABILITIE
S
*100 767.2
6 162.77
%
57.581 42.08
%
Debt equity ratios of both the organization is
said to be 162.7 and 42.08 which indicates that
better equity is of ERM
TOTAL
EQUITY
471.3
9
136.82
3
2
DEBT
RATIO
TOTAL
LIABILITIE
S
*100 767.2
6 144.91
%
57.581 29.62
% Debt ratios such as 144.9 and 29.2 of both the
companies here ERM id better
TOTAL
ASSETS
529.4
62
194.40
3
3
EQUITY
RATIO
TOTAL
EQUITY *100 471.3
9
89.03
%
136.82
3
70.38
%
Equity ratios of both the organization is 89.03
and 70.38 so ERM is favorable here
TOTAL
ASSETS
529.4
62
194.40
3
4
INTEREST
COVERAGE
EBIT or
EBITDAF* $78
4.0572
91666
7
37.995
-
2031.8
2%
Interest coverage of such industries is 4.05 and
2031 which indicate Pacific is better here
RATIO
NET
FINANCE
COSTS $19
-1.87
*For ERM
Power
Limited, the
EBIT =
EBITDAF
⊘ This is a preview!⊘
Do you want full access?
Subscribe today to unlock all pages.
Trusted by 1+ million students worldwide
1 out of 13
Related Documents


Your All-in-One AI-Powered Toolkit for Academic Success.
+13062052269
info@desklib.com
Available 24*7 on WhatsApp / Email
![[object Object]](/_next/static/media/star-bottom.7253800d.svg)
Unlock your academic potential
Copyright © 2020–2026 A2Z Services. All Rights Reserved. Developed and managed by ZUCOL.