Financial Analysis Report: Apple Inc. vs. Samsung Ltd. Comparison

Verified

Added on  2020/07/23

|19
|3828
|49
Report
AI Summary
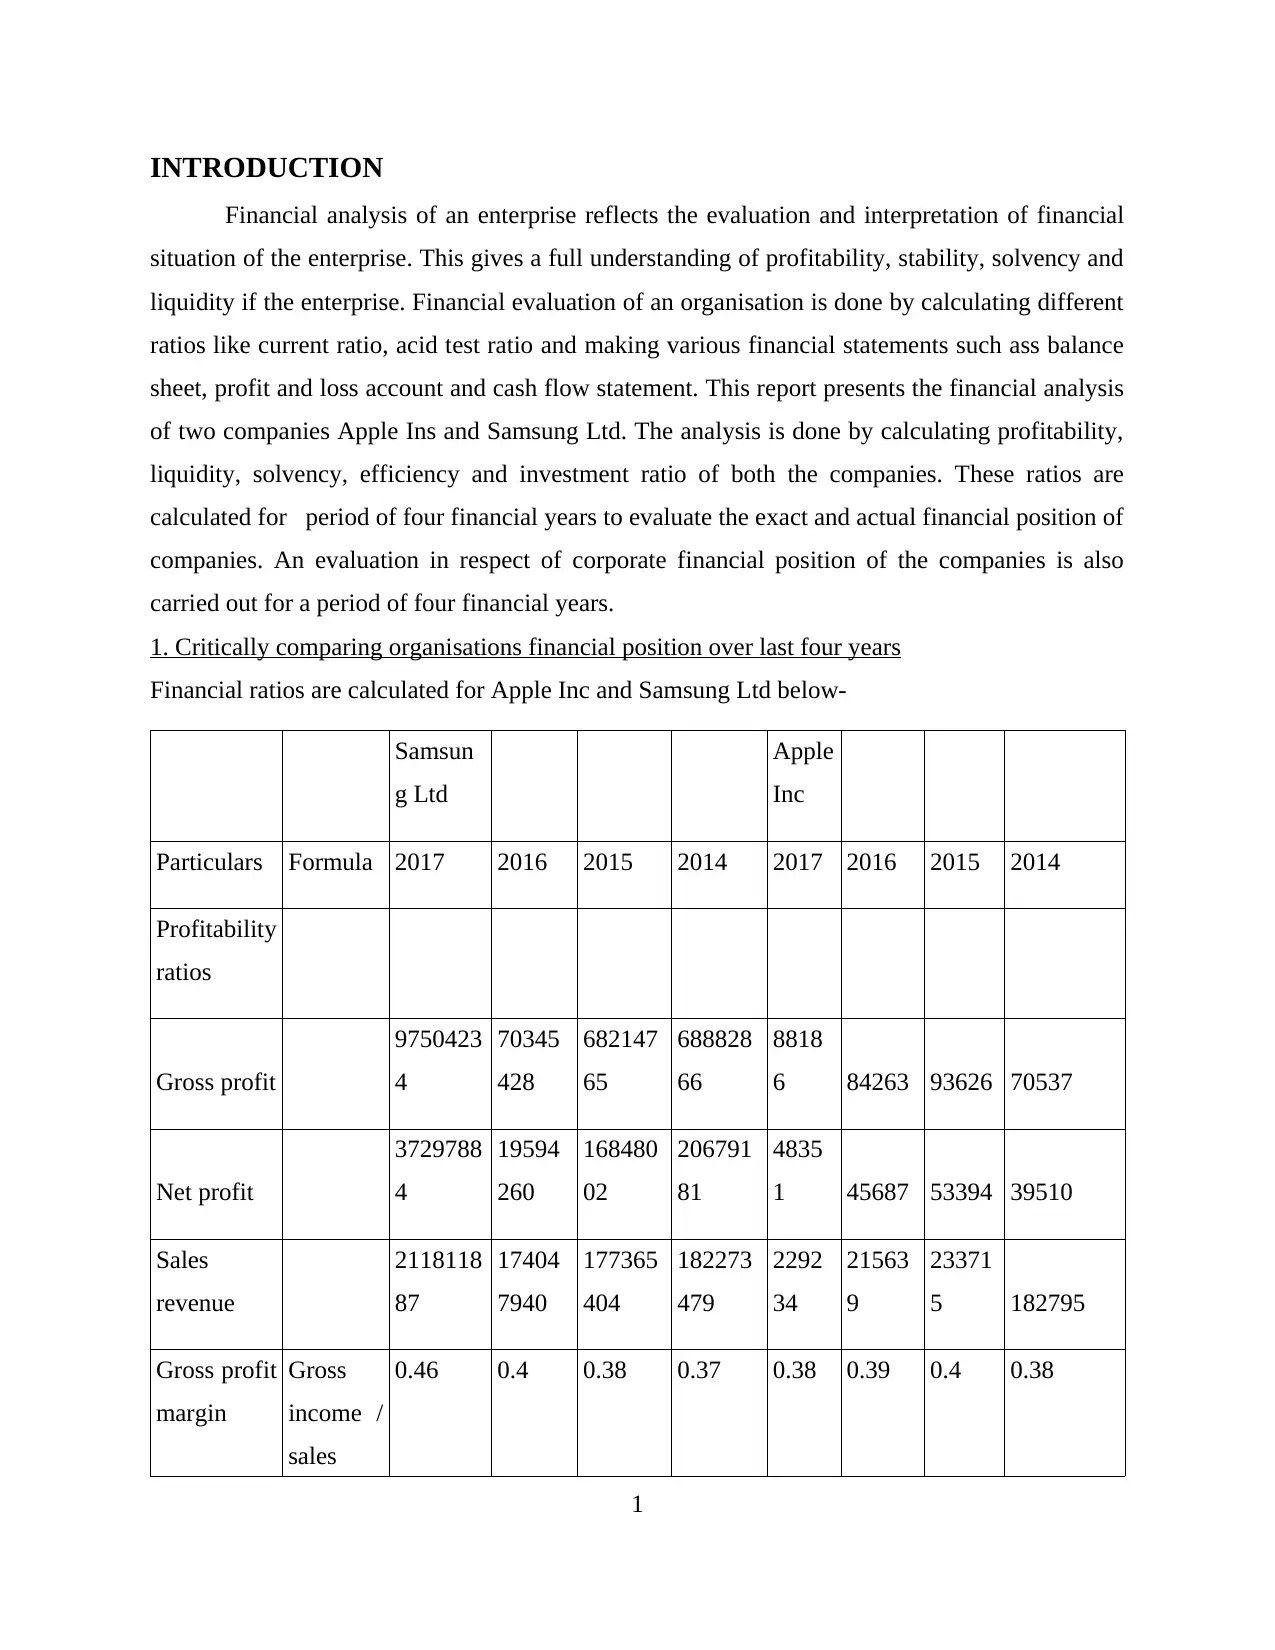
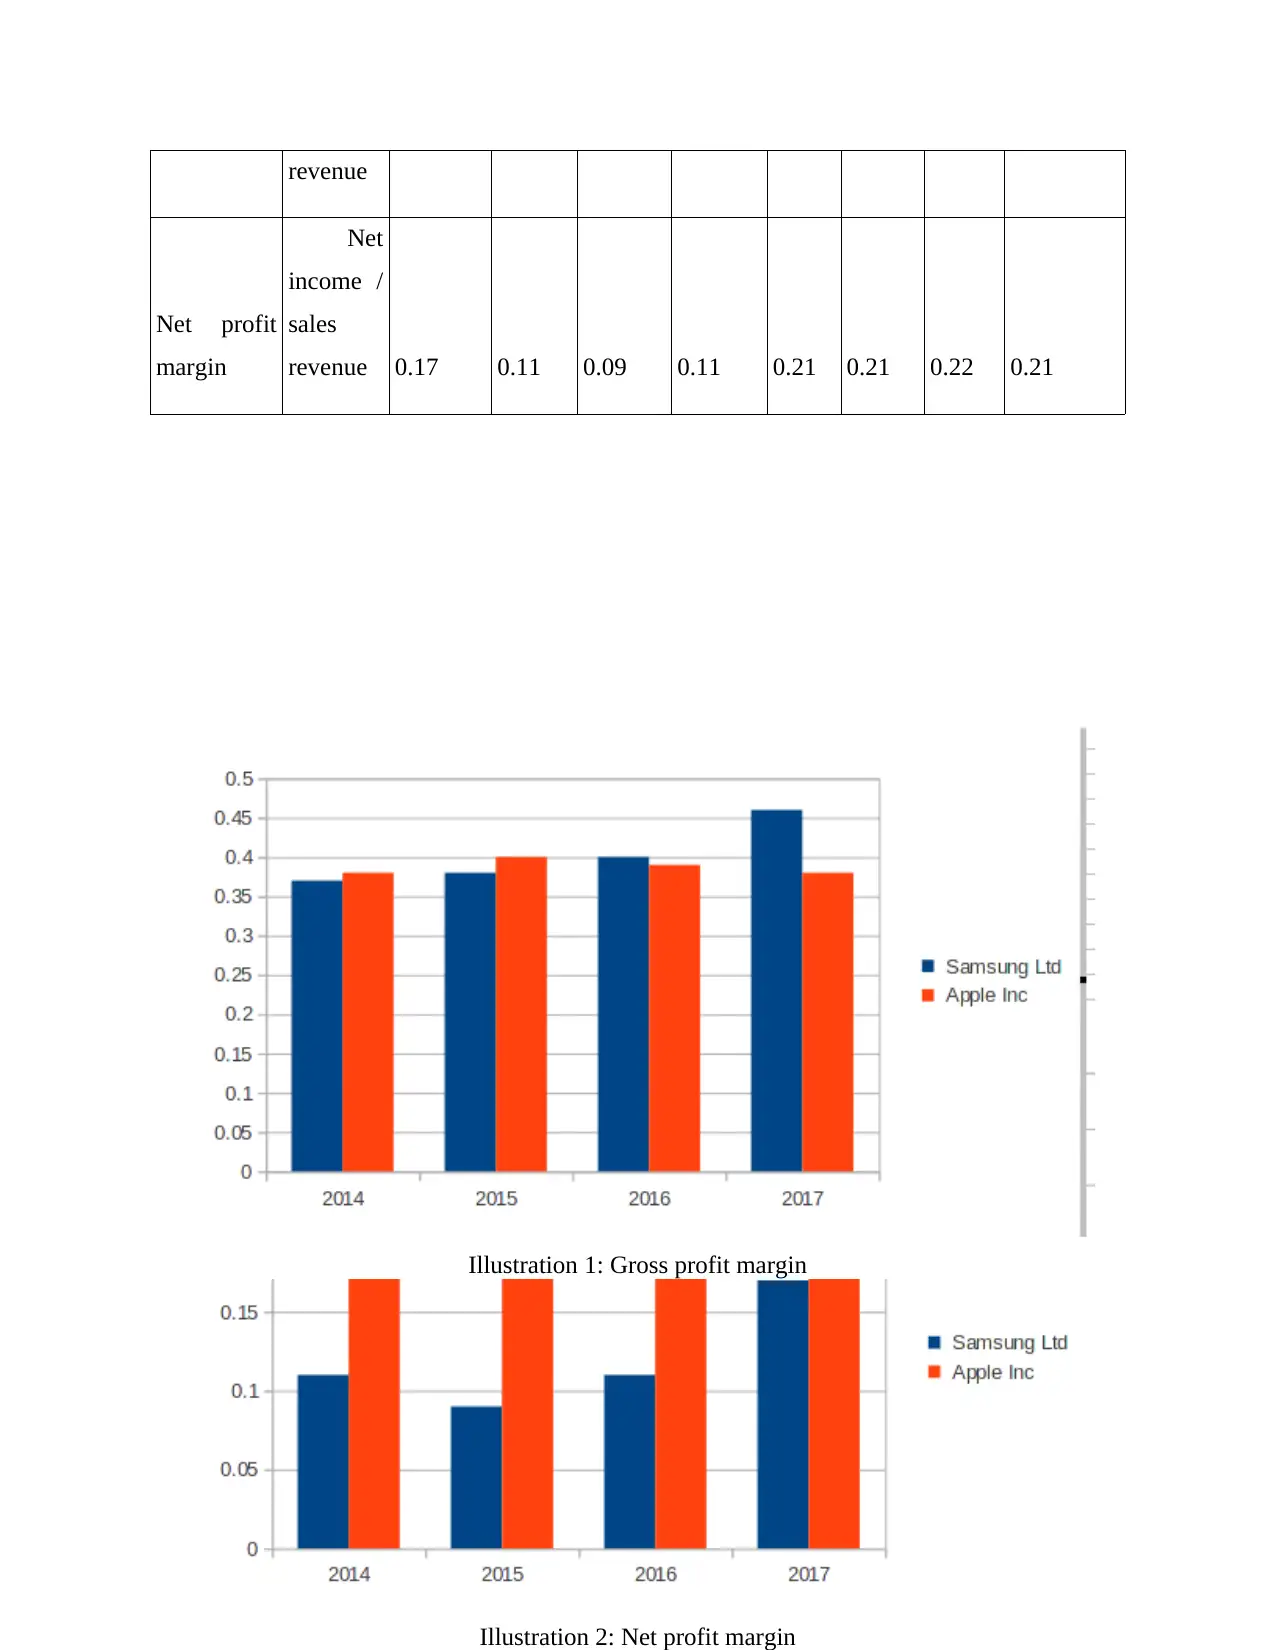
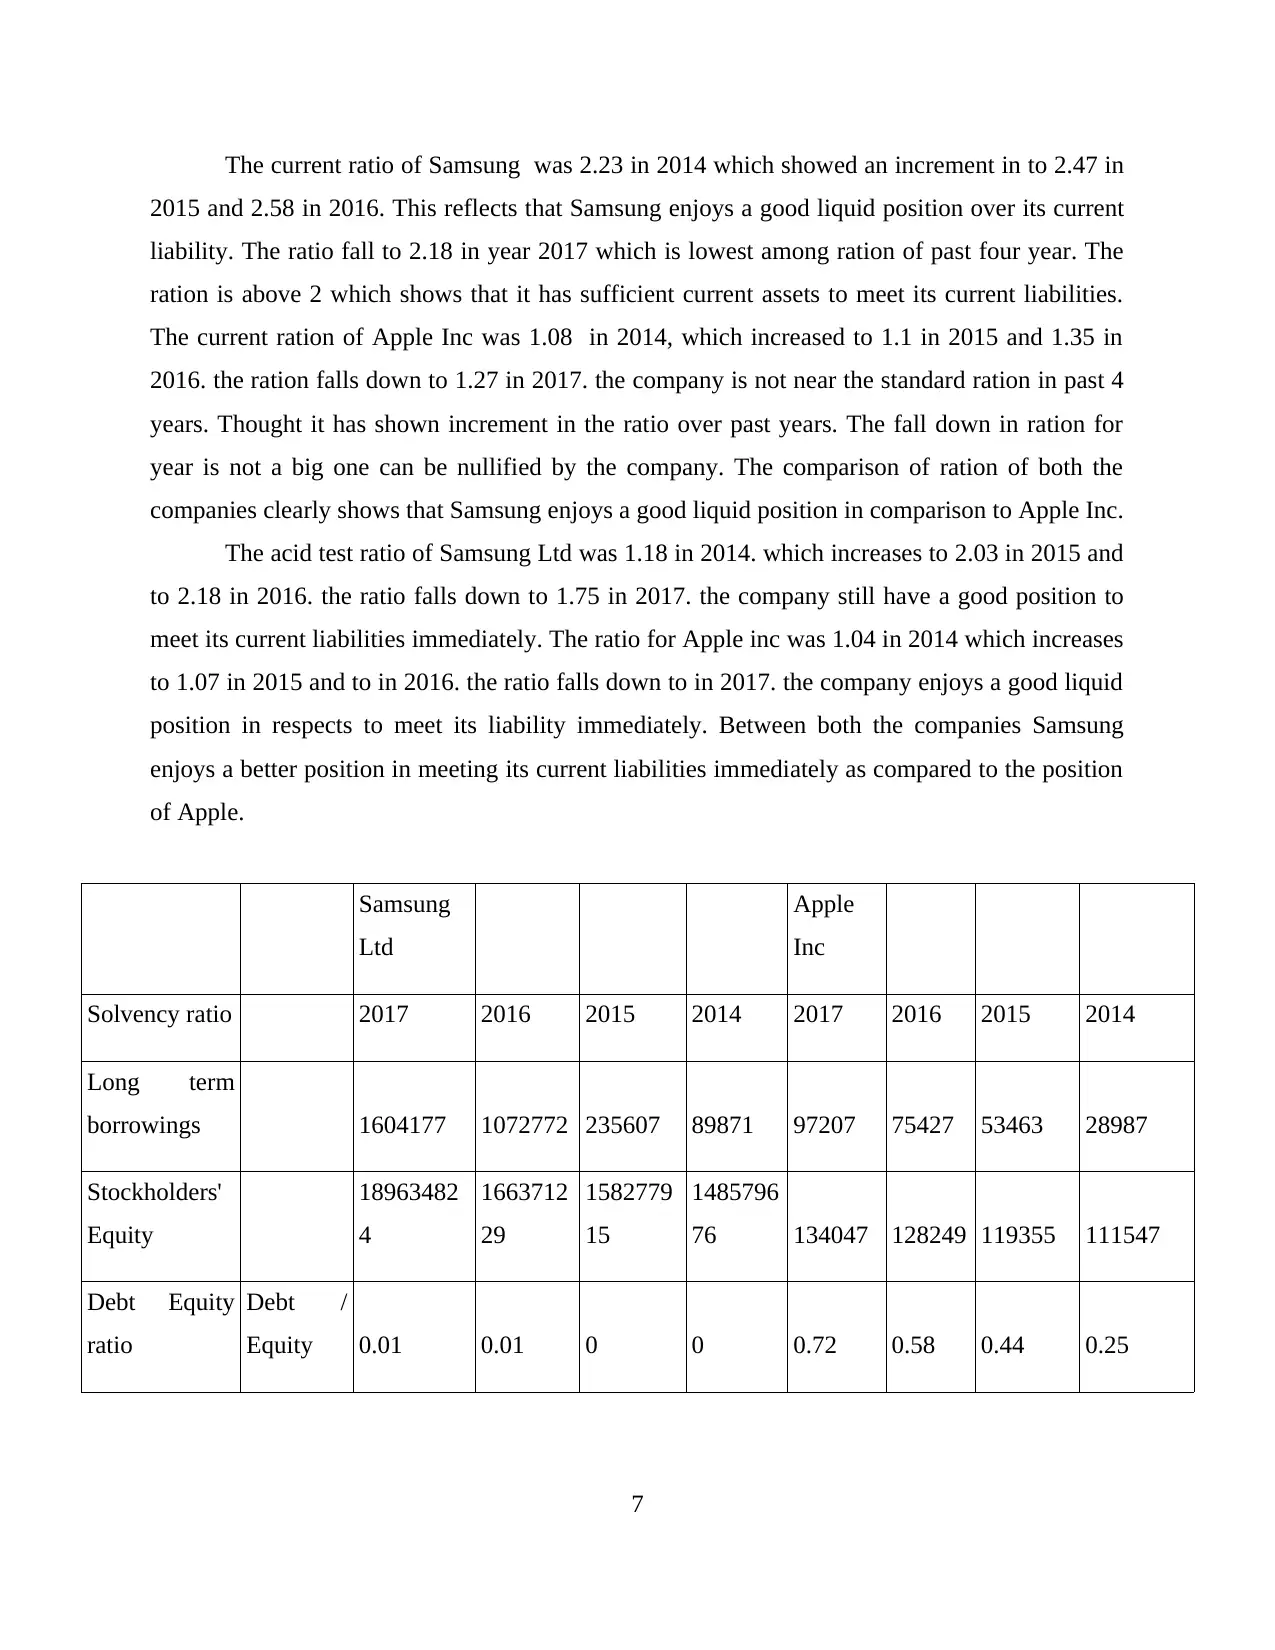
This report provides a comprehensive financial analysis of Apple Inc. and Samsung Ltd., comparing their financial performance over a four-year period. The analysis includes the calculation and interpretation of various financial ratios, such as profitability ratios (gross profit margin, net profit margin), liquidity ratios (current ratio, acid-test ratio), and solvency ratios (debt-equity ratio). The report critically examines the organizations' financial positions, highlighting trends and providing insights into their strengths and weaknesses. The study also includes an assessment of efficiency ratios and a brief overview of the companies' CSR sections. The report aims to provide a comparative understanding of the financial health and performance of these two major players in the technology sector. The report uses financial statements and annual reports to calculate the ratios and interpret the results. The report concludes with a summary of the findings and references the sources used.
Document Page
Financial Analysis
Management & Enterprise
tabler-icon-diamond-filled.svg

Paraphrase This Document

Need a fresh take? Get an instant paraphrase of this document with our AI Paraphraser
Document Page
TABLE OF CONTENTS
INTRODUCTION...........................................................................................................................1
1. Critically comparing organisations financial position over last four years........................1
2. Analysing CSR sections of companies over last two years and commenting on findings13
CONCLUSION..............................................................................................................................15
REFERENCES..............................................................................................................................16
Document Page
INTRODUCTION
Financial analysis of an enterprise reflects the evaluation and interpretation of financial
situation of the enterprise. This gives a full understanding of profitability, stability, solvency and
liquidity if the enterprise. Financial evaluation of an organisation is done by calculating different
ratios like current ratio, acid test ratio and making various financial statements such ass balance
sheet, profit and loss account and cash flow statement. This report presents the financial analysis
of two companies Apple Ins and Samsung Ltd. The analysis is done by calculating profitability,
liquidity, solvency, efficiency and investment ratio of both the companies. These ratios are
calculated for period of four financial years to evaluate the exact and actual financial position of
companies. An evaluation in respect of corporate financial position of the companies is also
carried out for a period of four financial years.
1. Critically comparing organisations financial position over last four years
Financial ratios are calculated for Apple Inc and Samsung Ltd below-
Samsun
g Ltd
Apple
Inc
Particulars Formula 2017 2016 2015 2014 2017 2016 2015 2014
Profitability
ratios
Gross profit
9750423
4
70345
428
682147
65
688828
66
8818
6 84263 93626 70537
Net profit
3729788
4
19594
260
168480
02
206791
81
4835
1 45687 53394 39510
Sales
revenue
2118118
87
17404
7940
177365
404
182273
479
2292
34
21563
9
23371
5 182795
Gross profit
margin
Gross
income /
sales
0.46 0.4 0.38 0.37 0.38 0.39 0.4 0.38
1
Document Page
revenue
Net profit
margin
Net
income /
sales
revenue 0.17 0.11 0.09 0.11 0.21 0.21 0.22 0.21
2
Illustration 2: Net profit margin
Illustration 1: Gross profit margin
tabler-icon-diamond-filled.svg

Paraphrase This Document

Need a fresh take? Get an instant paraphrase of this document with our AI Paraphraser
Document Page
Interpretation:
The profitability ratios are calculated for both the companies such as Apple Inc and
Samsung Ltd which are one of the biggest competitors in the technology sector. These are often
computing for their marketing share and as such, customers are satisfied up to a high extent.
Financial ratios help to effectively assess performance of the company whether it is performing
well in the market or not (Stone and et.al., 2016). Overall financial health can be easily
interpreted with the help of such ratios as they provide effective way of analysing company's
financial statements in the best possible manner. This means that organisation's financial reports
provide just figures which is used for assessing position of company by calculating ratios. In this
context, ratio analysis of both giants in Hi-Tech industry in effective way.
Profitability ratios such as Gross profit margin and Net profit margin both are computed
for analysing which organisation is performing well in comparison to another. The gross profit
ratio of Apple Inc was 0.38 in 2014 which increased to 0.40 in 2015. Furthermore, ratio was
slide down in 2016 to 0.39 and then further decreased to 0.38 in 2017. This clearly shows that
organisation's gross margin is reduced in past years. It is required that operational expenditures
must be controlled in a better way which will increase profits up to great heights. On the other
side, Samsung Ltd had ratio in 2014 of 0.37 which means that firm is earning good. Gross profit
ratio was increased to 0.38 in 2015 and again reached to 0.40 in 2016. In addressing this, margin
reached to remarkable extent as it was 0.46 in 2017 (Samsung Ltd annual reports. 2017). This
shows that firm is earning good quantum of profits in the best possible manner and which has
given huge gross profits (Cucchiella and Rosa, 2015). Hence, it is clarified from such ratio that
Samsung Ltd has good position as it has initiated better control over the expenditures and thus,
fruitful results are obtained.
On the other hand, Net profit margin is also calculated for both firms for the last years in
effective way by seeking annual reports. It can be interpreted that Samsung Ltd had net profit
margin of 0.11 in 2014 and decreased to 0.09 in 2015. However, it hiked again to 0.11 in 2016
and further maximised to 0.17 which shows that firm has effectively initiated control over
expenses and eventually, good net profit margin is generated. In past couple of years, position
was increased which highlights earning capacity of company and control over costs. While,
Apple Inc had 0.21 ratio in 2014 which roused to 0.22 in next year. Further, it decreased to 0.21
in next two years. It can be analysed that gross profit of organisation was low in comparison to
3
Document Page
Samsung Ltd. However, net profit margin of Apple Inc has maximised in past years which is
more than other company. Hence, it has initiated better control over operational and non-
operational expenses leading to more profit margin.
Samsung
Ltd
Apple
Inc
Liquidity
ratio 2017 2016 2015 2014 2017 2016 2015 2014
Current
assets
1299492
19
12193
9593
110328
582
101782
044
12864
5
10686
9 89378 68531
Current
liabilities
5939044
3
47165
446
446414
82
459771
17
10081
4 79006 80610 63448
Inventory
2208812
8
15824
248
166284
75
153076
14 4855 2132 2349 2111
Prepaid
expenses 3390770
30194
69
280264
5
295818
4 0 0 0 0
Liquid
assets
2547889
8
18843
717
194311
20
182657
98 4855 2132 2349 2111
1044703
21
10309
5876
908974
62
835162
46
12379
0
10473
7 87029 66420
Current
ratio
Current
assets /
Current
Liabilitie
s 2.18 2.58 2.47 2.23 1.27 1.35 1.1 1.08
4
Document Page
Acid-test
ratio
Liquid
Asset /
Current
liabilitie
s 1.75 2.18 2.03 1.81 1.22 1.32 1.07 1.04
5
Illustration 3: Current ratio
tabler-icon-diamond-filled.svg

Paraphrase This Document

Need a fresh take? Get an instant paraphrase of this document with our AI Paraphraser
Document Page
Interpretation:
A comparative study of liquidity ratio of Apple inc And Samsung Ltd is carried out to
determine the liquidity position of both the companies. The comparison is done for a period of
four years. This comparison will present an overall representation of change in liquid position of
the each company over a period of four years. This will also give an evaluation and change in
liquid position of one company with another company (PkanapickienÄ— and GrundienÄ—, 2015).
The liquid position of a firm means the valve of cash and cash equivalents of the business which
can be converted into cash easily in respect of the debt the company owes and has to pay it
back. The two liquidity ratios which are calculated here are current and acid test ratio.
Current ration shows the ration of current assets over current liabilities of the business.
This ration shows the ability of business to pay its long and short term obligation. This shows the
availability of cash and cash equivalents in respect of the liabilities. The standard current ration
is 2:1. it represent that an organisation shall have twice the current liabilities in from of cash and
cash equivalents over its turret liabilities (Khidmat and Rehman, 2014). The acid test ratio shows
the ability of the firm to meet its liabilities immediately. The current assets for this calculation
does not include the value of stock. The standard acid test ratio is 1:1.
6
Illustration 4: Acid-Test ratio
Document Page
The current ratio of Samsung was 2.23 in 2014 which showed an increment in to 2.47 in
2015 and 2.58 in 2016. This reflects that Samsung enjoys a good liquid position over its current
liability. The ratio fall to 2.18 in year 2017 which is lowest among ration of past four year. The
ration is above 2 which shows that it has sufficient current assets to meet its current liabilities.
The current ration of Apple Inc was 1.08 in 2014, which increased to 1.1 in 2015 and 1.35 in
2016. the ration falls down to 1.27 in 2017. the company is not near the standard ration in past 4
years. Thought it has shown increment in the ratio over past years. The fall down in ration for
year is not a big one can be nullified by the company. The comparison of ration of both the
companies clearly shows that Samsung enjoys a good liquid position in comparison to Apple Inc.
The acid test ratio of Samsung Ltd was 1.18 in 2014. which increases to 2.03 in 2015 and
to 2.18 in 2016. the ratio falls down to 1.75 in 2017. the company still have a good position to
meet its current liabilities immediately. The ratio for Apple inc was 1.04 in 2014 which increases
to 1.07 in 2015 and to in 2016. the ratio falls down to in 2017. the company enjoys a good liquid
position in respects to meet its liability immediately. Between both the companies Samsung
enjoys a better position in meeting its current liabilities immediately as compared to the position
of Apple.
Samsung
Ltd
Apple
Inc
Solvency ratio 2017 2016 2015 2014 2017 2016 2015 2014
Long term
borrowings 1604177 1072772 235607 89871 97207 75427 53463 28987
Stockholders'
Equity
18963482
4
1663712
29
1582779
15
1485796
76 134047 128249 119355 111547
Debt Equity
ratio
Debt /
Equity 0.01 0.01 0 0 0.72 0.58 0.44 0.25
7
Document Page
Interpretation:
The solvency ratios are computed for both the companies over four years. Debt equity
ratio has been calculated showing how debt is financed in relation to equity in the capital
structure of company. This means that amount of debt should be low as relying more on such
source can be harmful for organisation. The main reason is that debt payments have to be made
on regular intervals and furthermore, interest accrued has to paid in addition to principal amount
and as such, debt burden increases (Meena and Dhar, 2016). If more is used to finance business
activities, then firm may go bankrupt which destroys brand image in the market. Hence, it is
required that there should be optimum mix of debt and equity so that advantages of both finances
can be used by the firm. This is essentially required as if more equity is used, then shareholders'
demand for higher dividends which often leads to hike in market price of shares. Hence,
balanced capital structure should be followed by the company in order to extract benefits in the
best possible way.
It can be analysed from the debt equity ratio of Samsung Ltd that it has very little amount
of long term borrowings to finance its activities. The figures are below 0.01 and even 0 in past
8
Illustration 5: Debt Equity ratio
tabler-icon-diamond-filled.svg

Paraphrase This Document

Need a fresh take? Get an instant paraphrase of this document with our AI Paraphraser
Document Page
years which shows that company is not at all relying on debt for effectively financing its
activities (Schwartz, 2017). It is heavily relying on shareholders' investment which should not be
used up to a high extent. Ideal debt equity ratio should be 0.4 which implies that 40 % of debt
and remaining 60 % must be of equity which is ideal for company. However, debt finance is low
and equity is used quite more in capital structure. On the other side, Apple Inc had 0.25 in 2014
and increased to 0.44 in next year (Apple Inc annual reports, 2017). While, it reached to 0.58 in
2015 and further increased to 0.72 in recent year. These figures show that debt has been
constantly increased by company and as such, it is required to minimise it so as to reduce debt
burden. It should come below 0.4 which is regarded as the safest debt finance by market experts.
Samsung
Ltd
Apple
Inc
Efficiency
ratio 2017 2016 2015 2014 2017 2016 2015 2014
Cost of
Sales
1143076
53
103702
512
109150
639
113390
613
14104
8
13137
6 140089 112258
Inventory
2208812
8
158242
48
166284
75
153076
14 4855 2132 2349 2111
Total assets
2667831
76
226044
667
214071
883
203679
800
37531
9
32168
6 290479 231839
Sales
revenue
2118118
87
174047
940
177365
404
182273
479
22923
4
21563
9 233715 182795
Inventory
Turnover
ratio
Cost of
sales /
average
invento
ry
5.17 5.47 6.7 7.1 29.05 37.6 62.52 50.33
9
Document Page
Assets
Turnover
ratio
Sales
revenue
/
average
total
assets 0.79 0.7 0.8 0.87 0.61 0.61 0.76 0.69
Working
notes
379123
76
3245272
3
319360
89 6987 4481 4460
Average
inventory
189561
88
1622636
1.5
159680
44.5 3493.5 2240.5 2230
Average
assets
492827
843
4401165
50
417751
683
69700
5 612165 522318
246413
921.5
2200582
75
208875
841.5
34850
2.5
306082.
5 261159
10
chevron_up_icon
1 out of 19
circle_padding
hide_on_mobile
zoom_out_icon
[object Object]