Corporate Finance Project Report: Financial and Construction Analysis

Verified

Added on  2023/06/11

|6
|1070
|300
Report
AI Summary
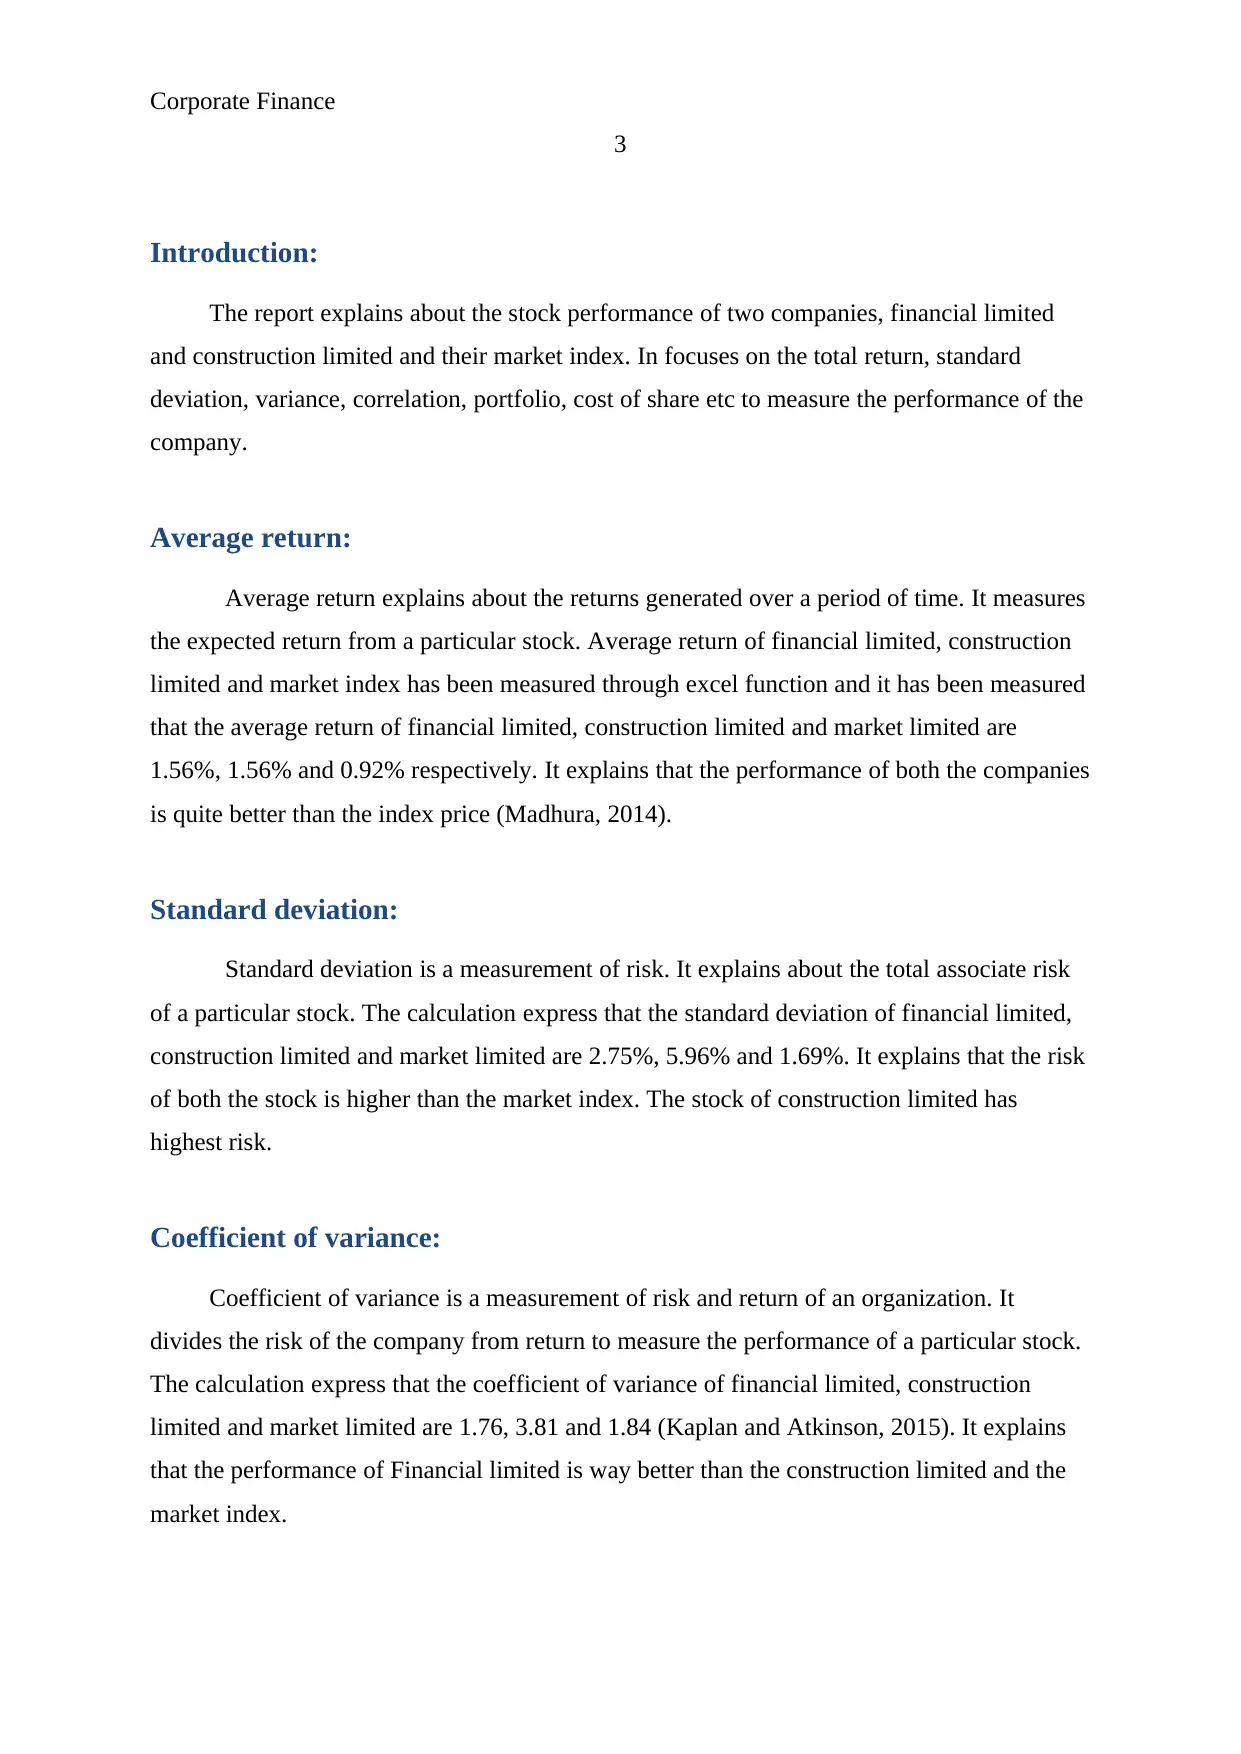
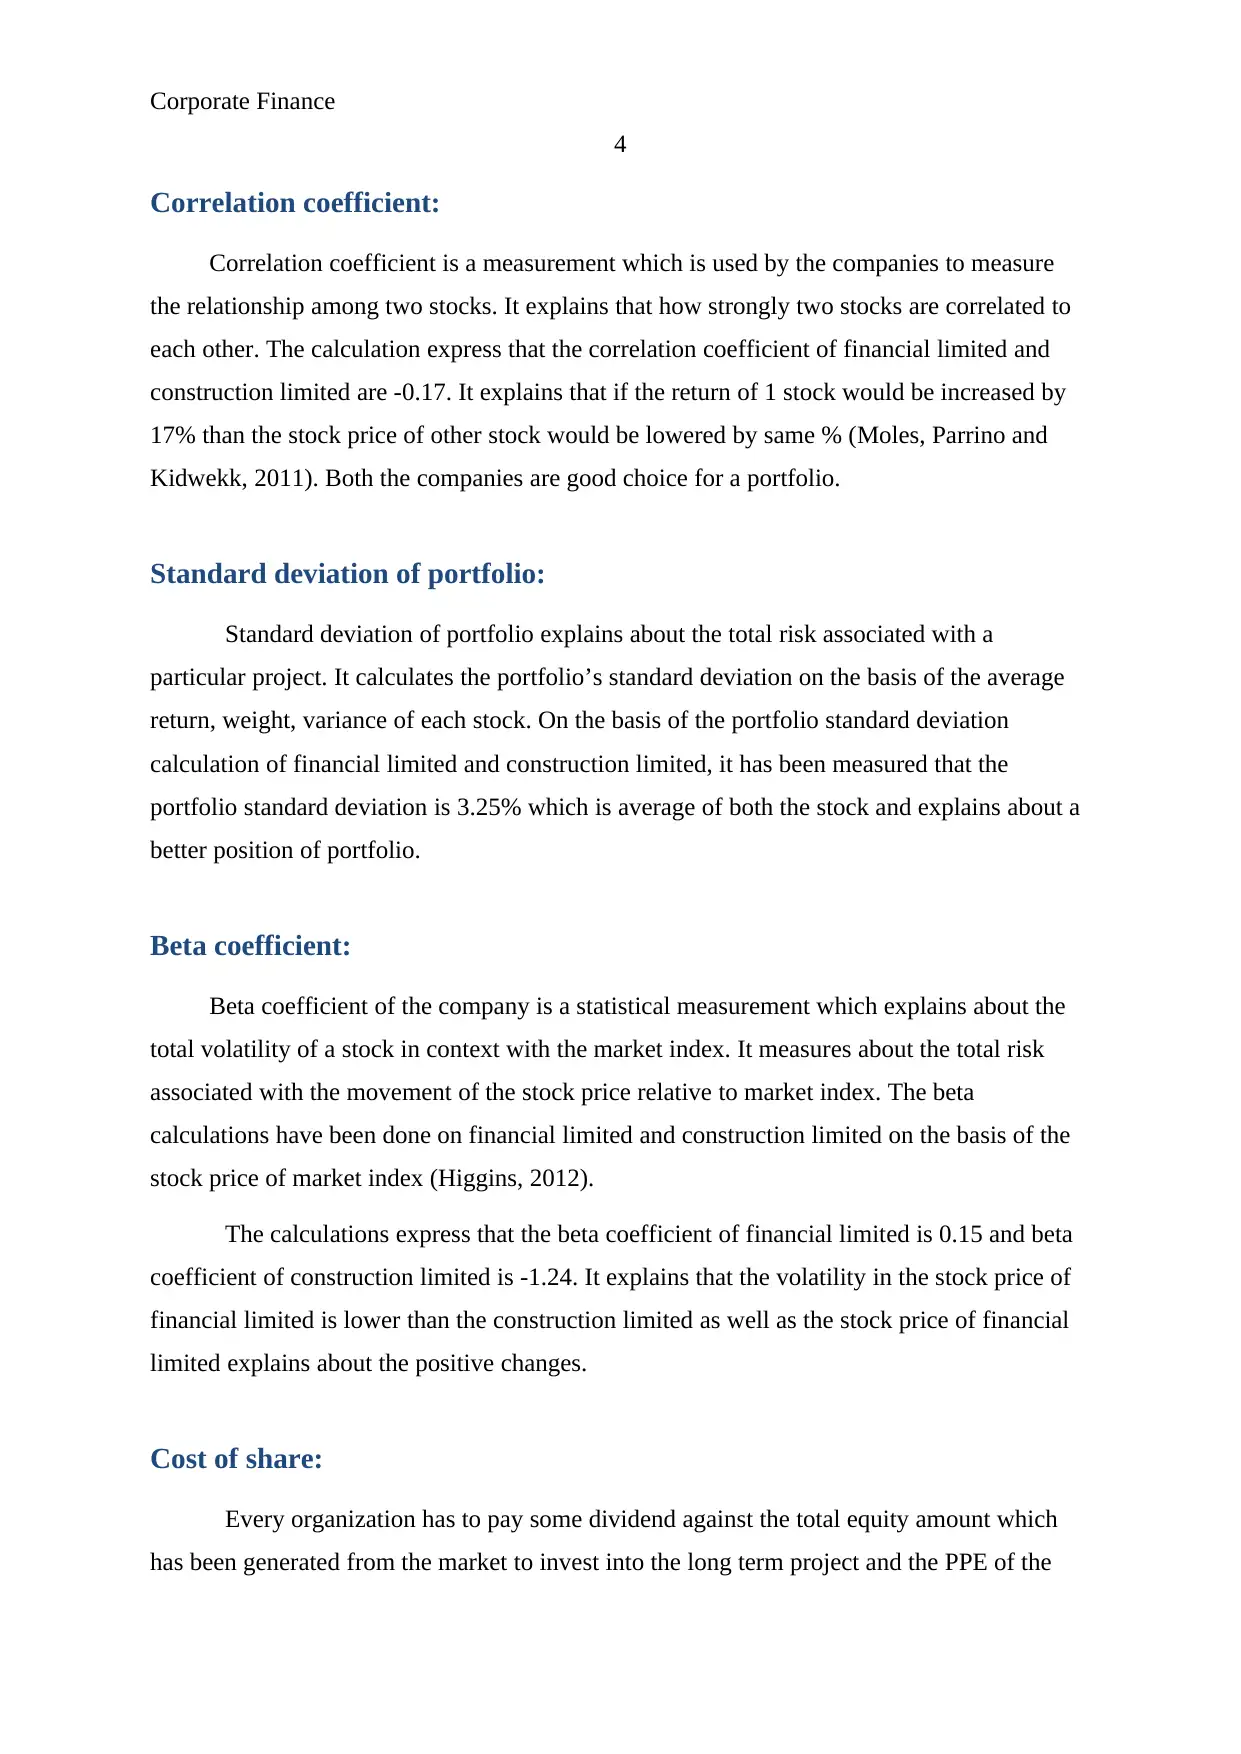
This report provides an analysis of the stock performance of Financial Limited and Construction Limited, along with their market index. It delves into key metrics such as average return, standard deviation, coefficient of variance, correlation coefficient, standard deviation of portfolio, beta coefficient, and cost of share to evaluate the companies' performance. The average returns for Financial Limited, Construction Limited, and the market index are 1.56%, 1.56%, and 0.92%, respectively, indicating better performance of the companies compared to the index. However, the standard deviation reveals higher risk for both stocks compared to the market index, with Construction Limited exhibiting the highest risk. The correlation coefficient between Financial Limited and Construction Limited is -0.17, suggesting a potential diversification benefit in a portfolio. The portfolio standard deviation is 3.25%, indicating an average risk level. Beta coefficients for Financial Limited and Construction Limited are 0.15 and -1.24, respectively, reflecting different volatility levels relative to the market. Finally, the cost of equity is calculated using both dividend and CAPM models, showing that Financial Limited has a lower cost of equity compared to Construction Limited, making the portfolio of both companies a suitable choice for investment. Desklib provides access to similar solved assignments for students.
Document Page
Running Head: Corporate Finance
1
Project Report: corporate Finance
tabler-icon-diamond-filled.svg

Paraphrase This Document

Need a fresh take? Get an instant paraphrase of this document with our AI Paraphraser
Document Page
Corporate Finance
2
Contents
Introduction:.....................................................................................................................3
Average return:.................................................................................................................3
Standard deviation:...........................................................................................................3
Coefficient of variance:....................................................................................................3
Correlation coefficient:.....................................................................................................4
Standard deviation of portfolio:........................................................................................4
Beta coefficient:................................................................................................................4
Cost of share:....................................................................................................................4
Conclusion:.......................................................................................................................5
References:.......................................................................................................................6
Document Page
Corporate Finance
3
Introduction:
The report explains about the stock performance of two companies, financial limited
and construction limited and their market index. In focuses on the total return, standard
deviation, variance, correlation, portfolio, cost of share etc to measure the performance of the
company.
Average return:
Average return explains about the returns generated over a period of time. It measures
the expected return from a particular stock. Average return of financial limited, construction
limited and market index has been measured through excel function and it has been measured
that the average return of financial limited, construction limited and market limited are
1.56%, 1.56% and 0.92% respectively. It explains that the performance of both the companies
is quite better than the index price (Madhura, 2014).
Standard deviation:
Standard deviation is a measurement of risk. It explains about the total associate risk
of a particular stock. The calculation express that the standard deviation of financial limited,
construction limited and market limited are 2.75%, 5.96% and 1.69%. It explains that the risk
of both the stock is higher than the market index. The stock of construction limited has
highest risk.
Coefficient of variance:
Coefficient of variance is a measurement of risk and return of an organization. It
divides the risk of the company from return to measure the performance of a particular stock.
The calculation express that the coefficient of variance of financial limited, construction
limited and market limited are 1.76, 3.81 and 1.84 (Kaplan and Atkinson, 2015). It explains
that the performance of Financial limited is way better than the construction limited and the
market index.
Document Page
Corporate Finance
4
Correlation coefficient:
Correlation coefficient is a measurement which is used by the companies to measure
the relationship among two stocks. It explains that how strongly two stocks are correlated to
each other. The calculation express that the correlation coefficient of financial limited and
construction limited are -0.17. It explains that if the return of 1 stock would be increased by
17% than the stock price of other stock would be lowered by same % (Moles, Parrino and
Kidwekk, 2011). Both the companies are good choice for a portfolio.
Standard deviation of portfolio:
Standard deviation of portfolio explains about the total risk associated with a
particular project. It calculates the portfolio’s standard deviation on the basis of the average
return, weight, variance of each stock. On the basis of the portfolio standard deviation
calculation of financial limited and construction limited, it has been measured that the
portfolio standard deviation is 3.25% which is average of both the stock and explains about a
better position of portfolio.
Beta coefficient:
Beta coefficient of the company is a statistical measurement which explains about the
total volatility of a stock in context with the market index. It measures about the total risk
associated with the movement of the stock price relative to market index. The beta
calculations have been done on financial limited and construction limited on the basis of the
stock price of market index (Higgins, 2012).
The calculations express that the beta coefficient of financial limited is 0.15 and beta
coefficient of construction limited is -1.24. It explains that the volatility in the stock price of
financial limited is lower than the construction limited as well as the stock price of financial
limited explains about the positive changes.
Cost of share:
Every organization has to pay some dividend against the total equity amount which
has been generated from the market to invest into the long term project and the PPE of the
tabler-icon-diamond-filled.svg

Paraphrase This Document

Need a fresh take? Get an instant paraphrase of this document with our AI Paraphraser
Document Page
Corporate Finance
5
company. these dividend amounts are the cost of equity of the company. In case of financial
limited and construction limited, dividend model has been used to measure the total cost of
equity of the company.
The financial limited explains that the market price of share is $ 18.75, the expected
dividend is $ 1.19 (1.15*103.56%), and the growth rate of dividend of the company is 3.56%.
thus the cost of equity of the company is 9.91% (Gapenski, 2008). Further, the CAPM model
explains that the cost of equity of the company is 2.68%.
Further, the construction limited calculations explain that the market price of share is
$ 11.15, the expected dividend is $ 0.78 (0.74*105.38%), and the growth rate of dividend of
the company is 5.38%. thus the cost of equity of the company is 12.38%. Further, the CAPM
model explains that the cost of equity of the company is 5.58%.
It explains that the cost of financial limited is lower than the construction limited as the
average cost of equity of financial limited is 6.29% and construction limited is 8.98%.
Conclusion:
To conclude, the portfolio of both the companies is a better choice for the purpose of
investment.
Document Page
Corporate Finance
6
References:
Gapenski, L.C., 2008. Healthcare finance: an introduction to accounting and financial
management. Health Administration Press.
Higgins, R. C., 2012. Analysis for financial management. McGraw-Hill/Irwin.
Kaplan, R.S. and Atkinson, A.A., 2015. Advanced management accounting. PHI Learning.
Madura, J. 2014. Financial Markets and Institutions. Cengage Learning.
Moles, P. Parrino, R and Kidwekk, D. 2011. Corporate finance, European edition, John
Wiley &sons, United Kingdom.
chevron_up_icon
1 out of 6
circle_padding
hide_on_mobile
zoom_out_icon
[object Object]