Accounting and Finance Report: Cranswick Plc Financial Analysis
VerifiedAdded on 2020/06/04
|17
|3805
|20
Report
AI Summary
This report presents a comprehensive financial analysis of Cranswick Plc, a leading British food production company. It examines the company's financial position from 2013 to 2017 using ratio analysis, focusing on profitability, earnings, and dividends to assess business performance. The analysis includes calculations and interpretations of gross profit ratio, net profit ratio, earnings per share, price-earnings ratio, and dividend per share. Furthermore, the report evaluates financial stability and liquidity through current and acid-test ratios, and solvency using debt-to-equity and interest-bearing ratios. The corporate governance mechanism is also evaluated. The report concludes with an assessment of investment opportunities based on the financial data, offering insights into Cranswick's performance and future prospects within the food industry.
ACCOUNTING AND
FINANCE
FINANCE
Paraphrase This Document
Need a fresh take? Get an instant paraphrase of this document with our AI Paraphraser
TABLE OF CONTENTS
INTRODUCTION...........................................................................................................................1
SECTION A.....................................................................................................................................1
Profit, earnings & dividends...................................................................................................1
Profitability ratios..............................................................................................................1
Earnings ratios...................................................................................................................3
Dividend ratios...................................................................................................................5
Financial stability & liquidity.................................................................................................7
Liquidity analysis ..............................................................................................................7
Solvency analysis...............................................................................................................8
SECTION B.....................................................................................................................................9
Critical reflection on the company portrayed by financial reports.........................................9
An evaluation of the corporate governance ...........................................................................9
Identify the assets value per share and the current market share price to assess investment
opportunity...........................................................................................................................12
CONCLUSION..............................................................................................................................12
REFERENCES..............................................................................................................................14
INTRODUCTION
Accounting is a major area of the business functions which is concerned with the
recording, organizing and interpretation of the historical transactions that took place in an
organization. Finance, on the other hand, is a primary requirement of any establishment because
none of the firm regardless to their sizes can operate and survive in the market with inadequate
funding. Cranswick Plc is a British leading food production company which is listed on LSE at a
constituent of FTSE 250 Index. It offers premium, organic and sustainable food products in
variety of range to the consumers. The thrust of the report is to examine its financial position
through ratio analysis technique for evaluating its investment opportunity. Besides this, its
corporate governance mechanism also will be examined for sustainable success.
100
SECTION A
Profit, earnings & dividends
In order to determine performance of the company in its respective industry, there are
several numbers of ratios are calculated and then analysed. In the present section basically three
types of the ratios considered for assessing Cranswick's business performance which are
profitability, earnings and dividends (Uechi and et.al., 2015). Moreover, interpretation of such
ratios are given as below:
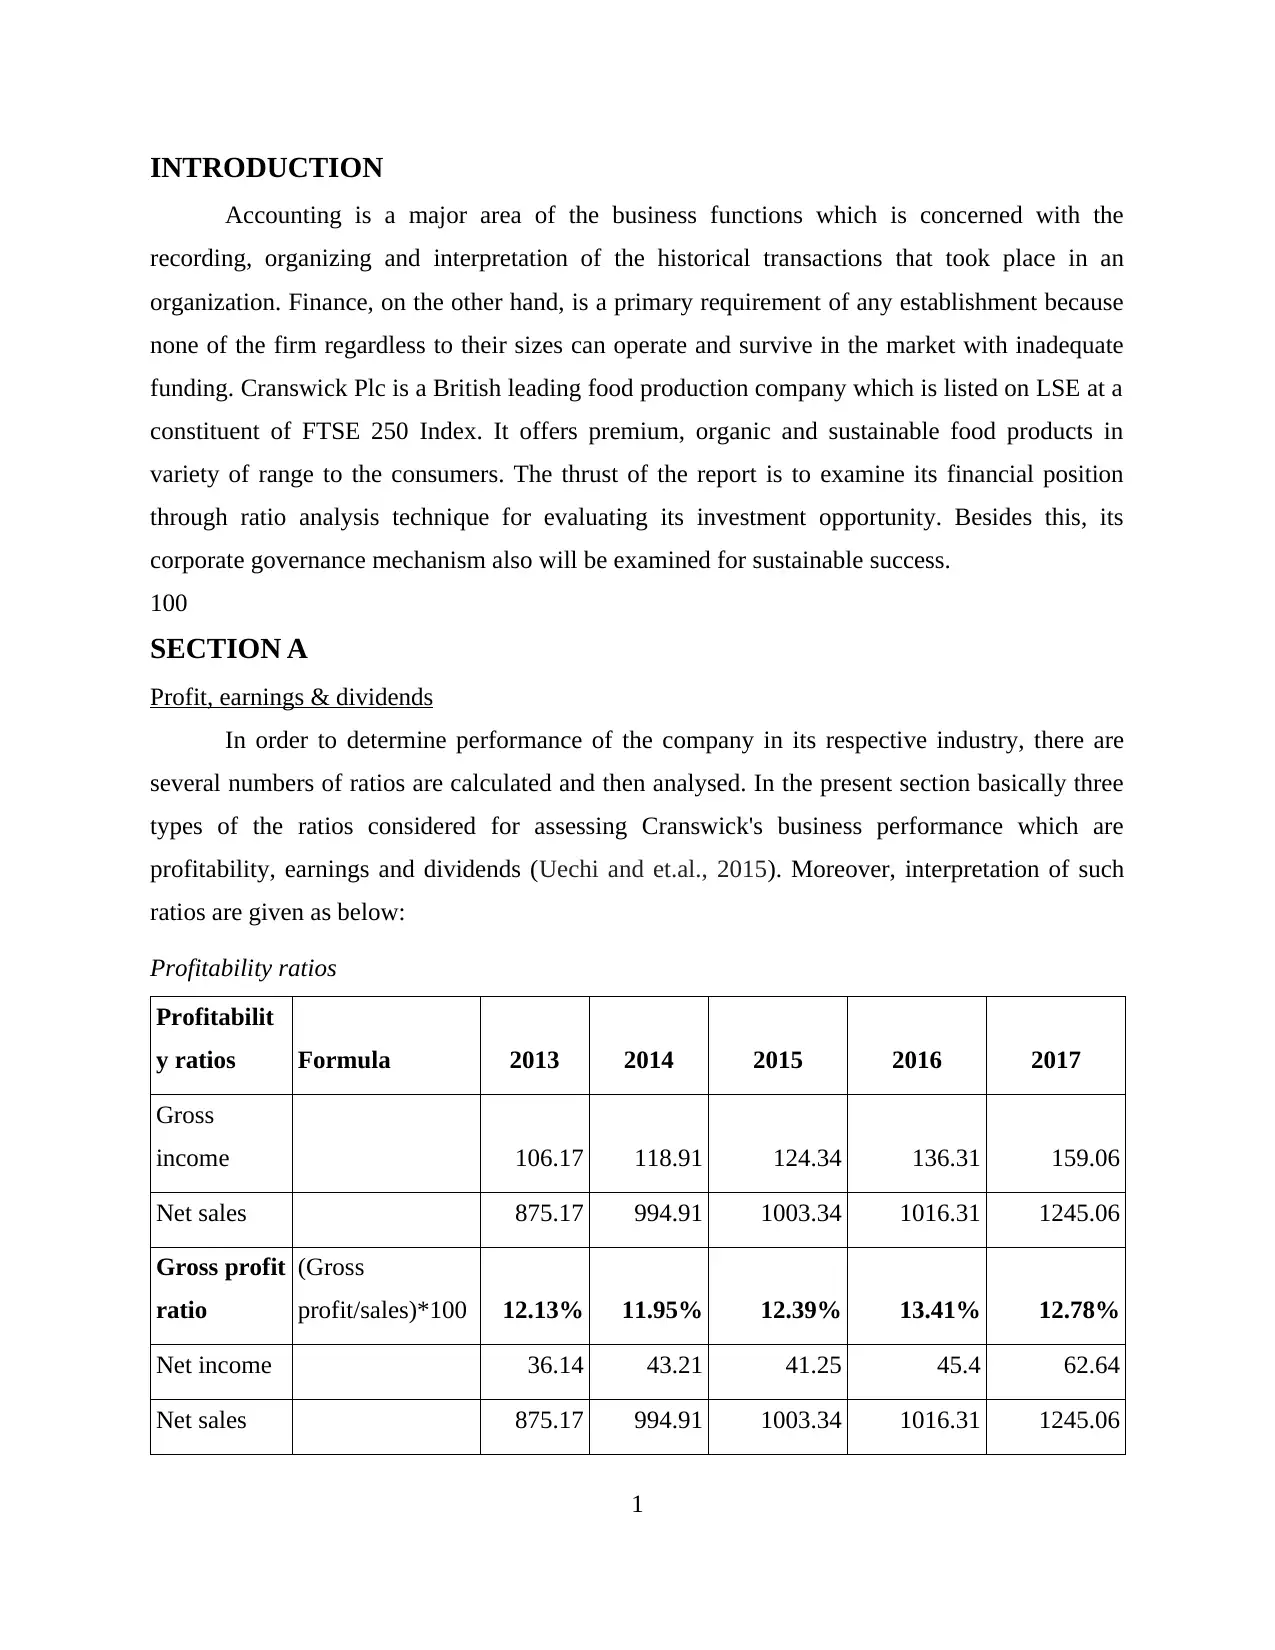
Profitability ratios
Profitabilit
y ratios Formula 2013 2014 2015 2016 2017
Gross
income 106.17 118.91 124.34 136.31 159.06
Net sales 875.17 994.91 1003.34 1016.31 1245.06
Gross profit
ratio
(Gross
profit/sales)*100 12.13% 11.95% 12.39% 13.41% 12.78%
Net income 36.14 43.21 41.25 45.4 62.64
Net sales 875.17 994.91 1003.34 1016.31 1245.06
1
Accounting is a major area of the business functions which is concerned with the
recording, organizing and interpretation of the historical transactions that took place in an
organization. Finance, on the other hand, is a primary requirement of any establishment because
none of the firm regardless to their sizes can operate and survive in the market with inadequate
funding. Cranswick Plc is a British leading food production company which is listed on LSE at a
constituent of FTSE 250 Index. It offers premium, organic and sustainable food products in
variety of range to the consumers. The thrust of the report is to examine its financial position
through ratio analysis technique for evaluating its investment opportunity. Besides this, its
corporate governance mechanism also will be examined for sustainable success.
100
SECTION A
Profit, earnings & dividends
In order to determine performance of the company in its respective industry, there are
several numbers of ratios are calculated and then analysed. In the present section basically three
types of the ratios considered for assessing Cranswick's business performance which are
profitability, earnings and dividends (Uechi and et.al., 2015). Moreover, interpretation of such
ratios are given as below:
Profitability ratios
Profitabilit
y ratios Formula 2013 2014 2015 2016 2017
Gross
income 106.17 118.91 124.34 136.31 159.06
Net sales 875.17 994.91 1003.34 1016.31 1245.06
Gross profit
ratio
(Gross
profit/sales)*100 12.13% 11.95% 12.39% 13.41% 12.78%
Net income 36.14 43.21 41.25 45.4 62.64
Net sales 875.17 994.91 1003.34 1016.31 1245.06
1
⊘ This is a preview!⊘
Do you want full access?
Subscribe today to unlock all pages.
Trusted by 1+ million students worldwide
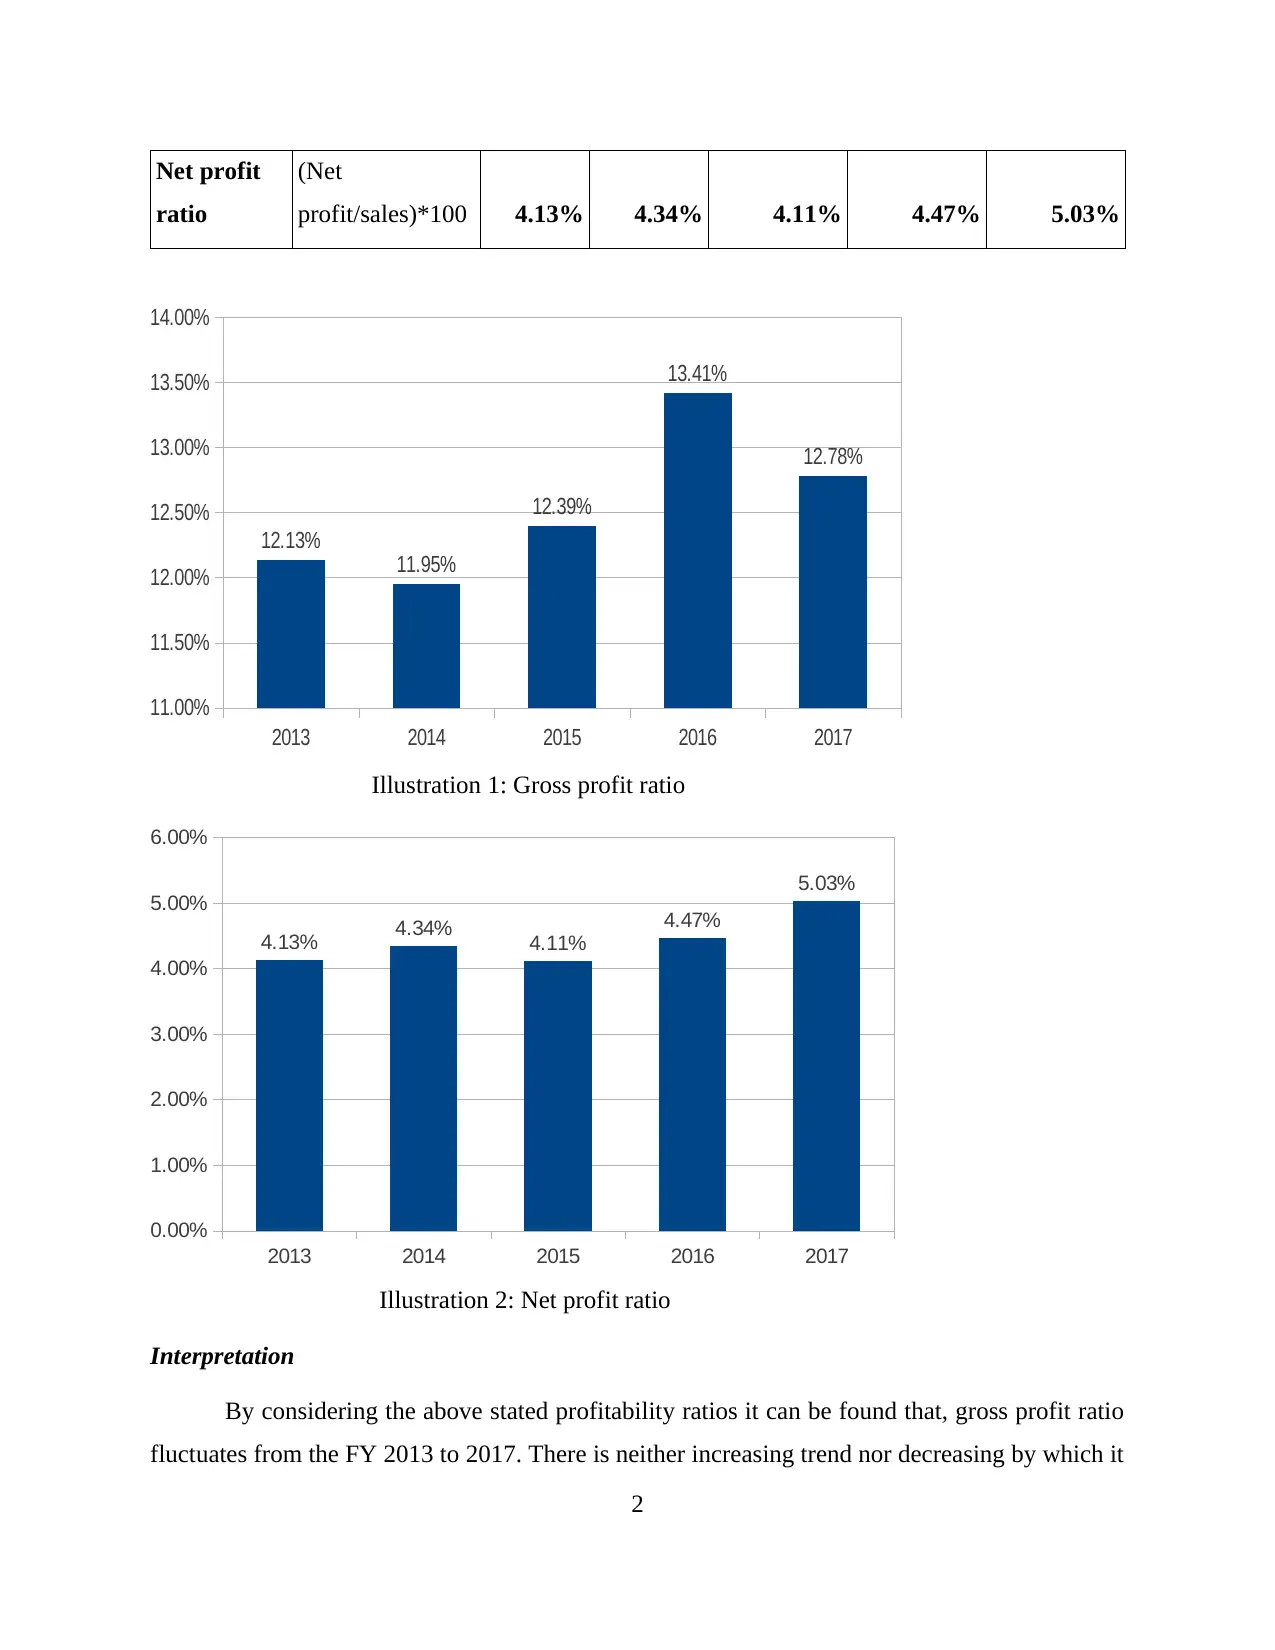
Net profit
ratio
(Net
profit/sales)*100 4.13% 4.34% 4.11% 4.47% 5.03%
2013 2014 2015 2016 2017
11.00%
11.50%
12.00%
12.50%
13.00%
13.50%
14.00%
12.13%
11.95%
12.39%
13.41%
12.78%
Illustration 1: Gross profit ratio
2013 2014 2015 2016 2017
0.00%
1.00%
2.00%
3.00%
4.00%
5.00%
6.00%
4.13% 4.34% 4.11%
4.47%
5.03%
Illustration 2: Net profit ratio
Interpretation
By considering the above stated profitability ratios it can be found that, gross profit ratio
fluctuates from the FY 2013 to 2017. There is neither increasing trend nor decreasing by which it
2
Paraphrase This Document
Need a fresh take? Get an instant paraphrase of this document with our AI Paraphraser
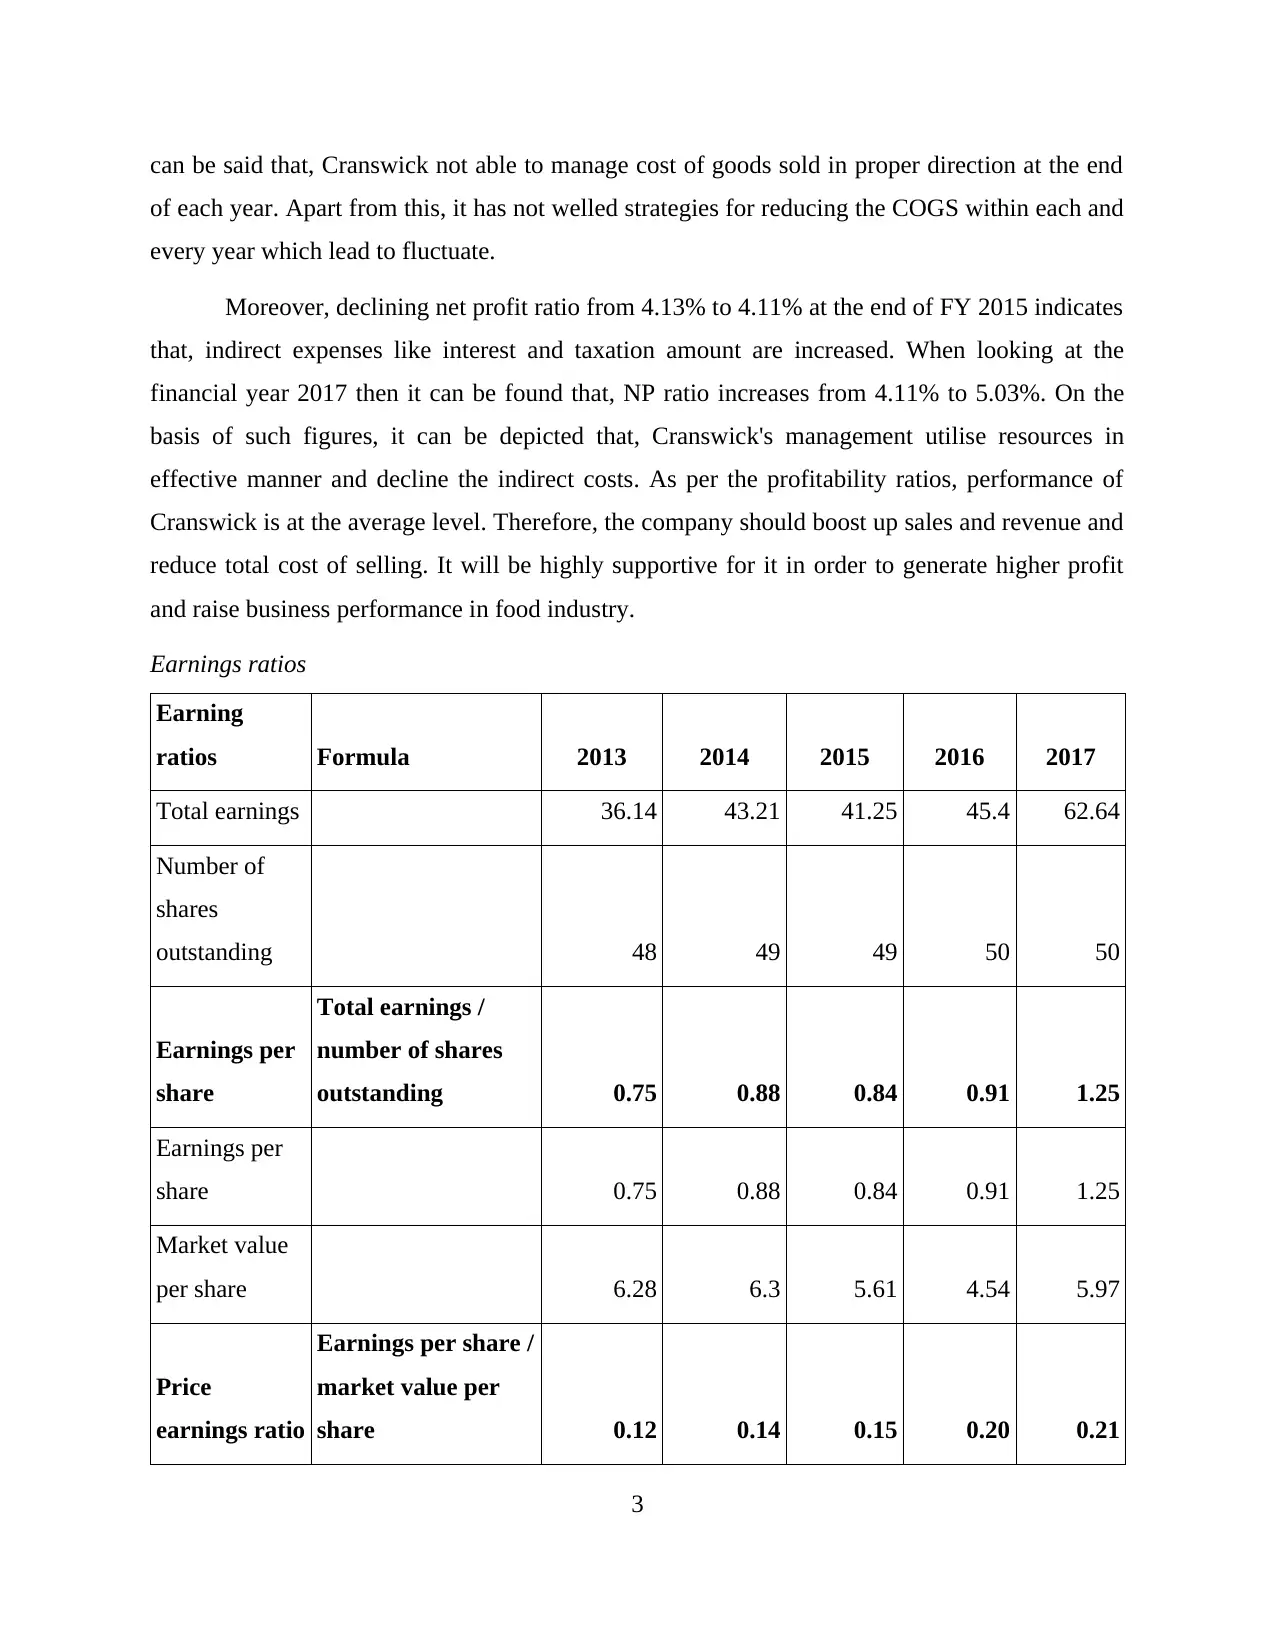
can be said that, Cranswick not able to manage cost of goods sold in proper direction at the end
of each year. Apart from this, it has not welled strategies for reducing the COGS within each and
every year which lead to fluctuate.
Moreover, declining net profit ratio from 4.13% to 4.11% at the end of FY 2015 indicates
that, indirect expenses like interest and taxation amount are increased. When looking at the
financial year 2017 then it can be found that, NP ratio increases from 4.11% to 5.03%. On the
basis of such figures, it can be depicted that, Cranswick's management utilise resources in
effective manner and decline the indirect costs. As per the profitability ratios, performance of
Cranswick is at the average level. Therefore, the company should boost up sales and revenue and
reduce total cost of selling. It will be highly supportive for it in order to generate higher profit
and raise business performance in food industry.
Earnings ratios
Earning
ratios Formula 2013 2014 2015 2016 2017
Total earnings 36.14 43.21 41.25 45.4 62.64
Number of
shares
outstanding 48 49 49 50 50
Earnings per
share
Total earnings /
number of shares
outstanding 0.75 0.88 0.84 0.91 1.25
Earnings per
share 0.75 0.88 0.84 0.91 1.25
Market value
per share 6.28 6.3 5.61 4.54 5.97
Price
earnings ratio
Earnings per share /
market value per
share 0.12 0.14 0.15 0.20 0.21
3
2013 2014 2015 2016 2017
0.00
0.20
0.40
0.60
0.80
1.00
1.20
1.40
0.75
0.88 0.84 0.91
1.25
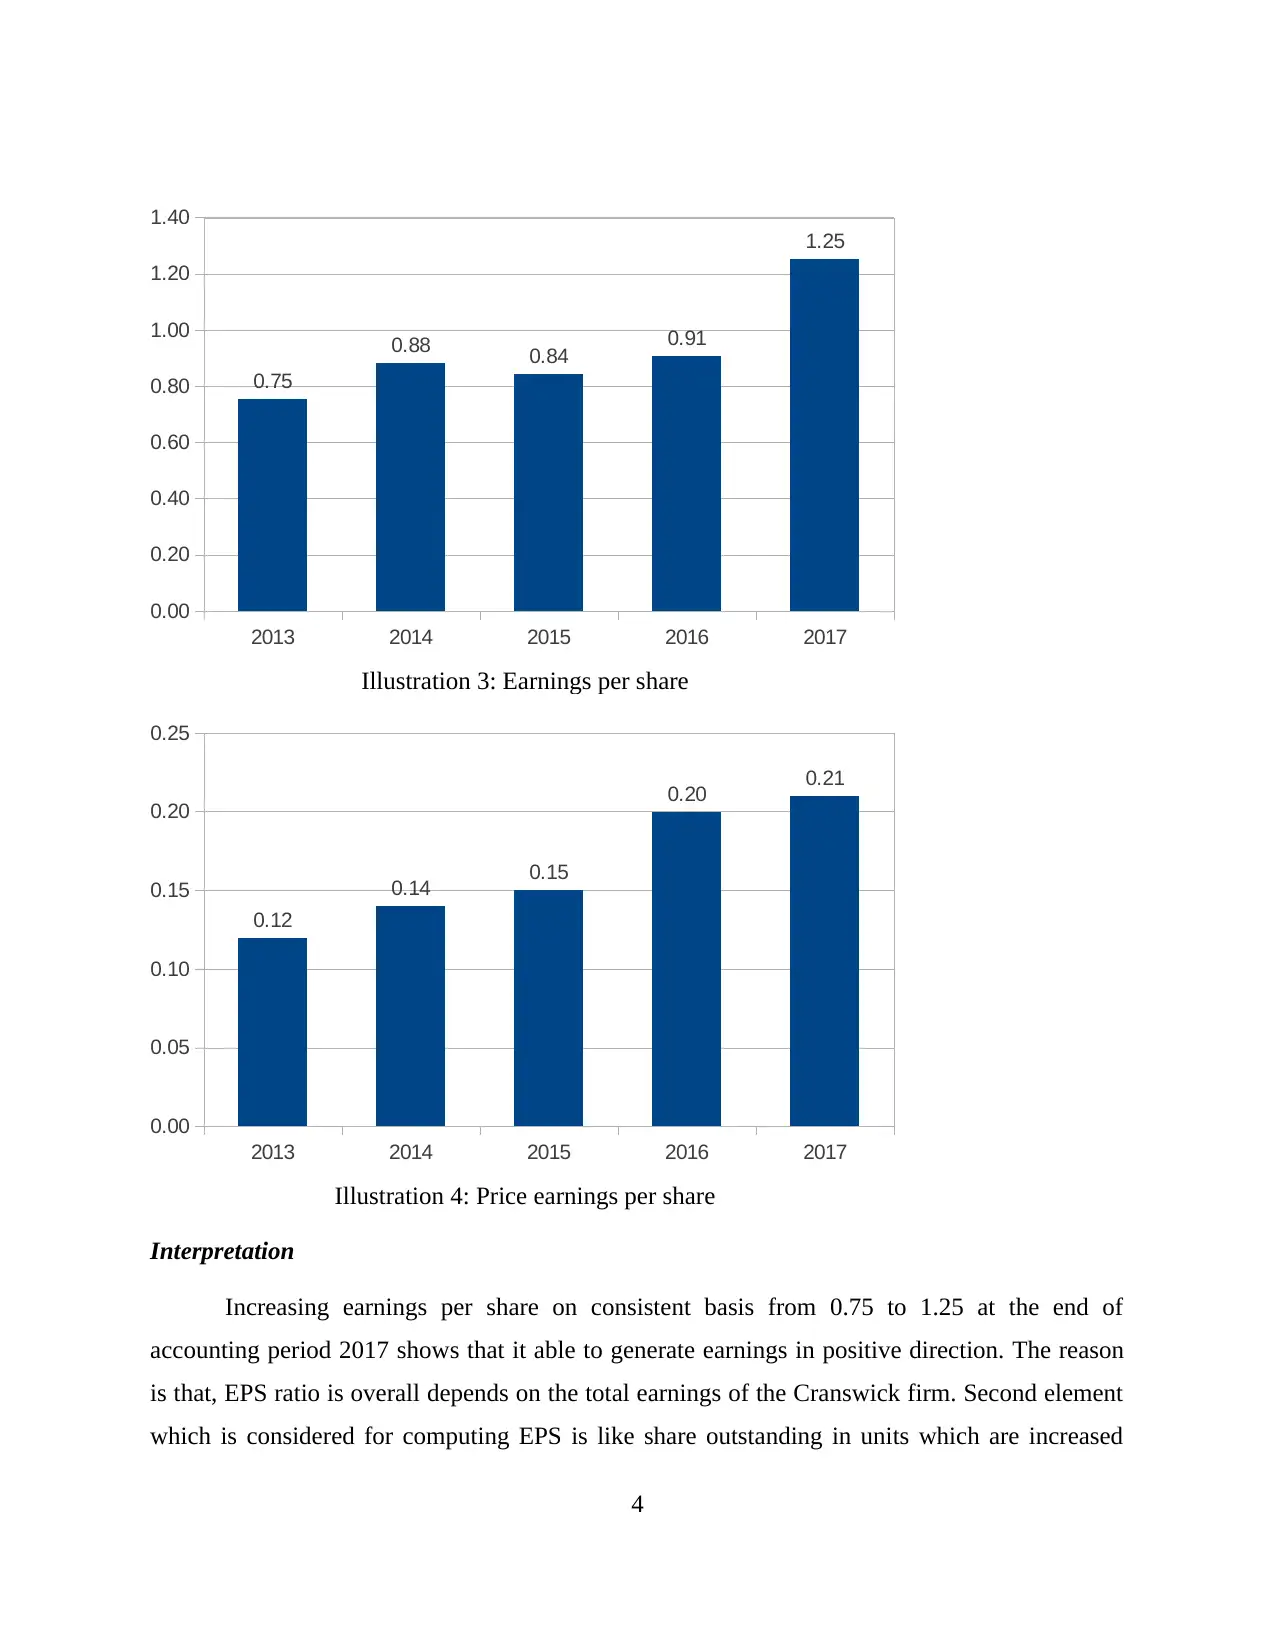
Illustration 3: Earnings per share
2013 2014 2015 2016 2017
0.00
0.05
0.10
0.15
0.20
0.25
0.12
0.14 0.15
0.20 0.21
Illustration 4: Price earnings per share
Interpretation
Increasing earnings per share on consistent basis from 0.75 to 1.25 at the end of
accounting period 2017 shows that it able to generate earnings in positive direction. The reason
is that, EPS ratio is overall depends on the total earnings of the Cranswick firm. Second element
which is considered for computing EPS is like share outstanding in units which are increased
4
0.00
0.20
0.40
0.60
0.80
1.00
1.20
1.40
0.75
0.88 0.84 0.91
1.25
Illustration 3: Earnings per share
2013 2014 2015 2016 2017
0.00
0.05
0.10
0.15
0.20
0.25
0.12
0.14 0.15
0.20 0.21
Illustration 4: Price earnings per share
Interpretation
Increasing earnings per share on consistent basis from 0.75 to 1.25 at the end of
accounting period 2017 shows that it able to generate earnings in positive direction. The reason
is that, EPS ratio is overall depends on the total earnings of the Cranswick firm. Second element
which is considered for computing EPS is like share outstanding in units which are increased
4
⊘ This is a preview!⊘
Do you want full access?
Subscribe today to unlock all pages.
Trusted by 1+ million students worldwide
within every two years (Robinson and et.al., 2015). From the fiscal year 2013 to 2016, EPS
enhances from 0.75 to 0.91 only in which growth rate is very slow. From the FY 2016 to 2017, it
able to earn per share with the highest rate due to increasing from 0.91 to 1.25.
When looking at the price-earnings ratio then it can be analysed that, company generates
positive value in each financial period. At the end of FY 2013 value of this ratio is 0.12 which
enhanced up to 0.21 at the end of FY 2017. According to such both the ratios it can be said that,
Cranswick company performs better within food industry up to certain extent. This performance
is gained by the management with the help of EPS because market value of each share is
declining or fluctuating over the years. Henceforth, the Cranswick enterprise needs to boost up
market value on consistent basis which is supportive for increasing business performance at the
end of year.
Dividend ratios
Dividend
ratios Formula 2013 2014 2015 2016 2017
Total
dividends 13.92 15.19 16.17 17.5 19.5
Number of
shares 48 49 49 50 50
Dividend
per share
Total dividends
/ Number of
shares 0.29 0.31 0.33 0.35 0.39
5
Paraphrase This Document
Need a fresh take? Get an instant paraphrase of this document with our AI Paraphraser
2013 2014 2015 2016 2017
0
0.05
0.1
0.15
0.2
0.25
0.3
0.35
0.4
0.45
0.29 0.31 0.33 0.35
0.39
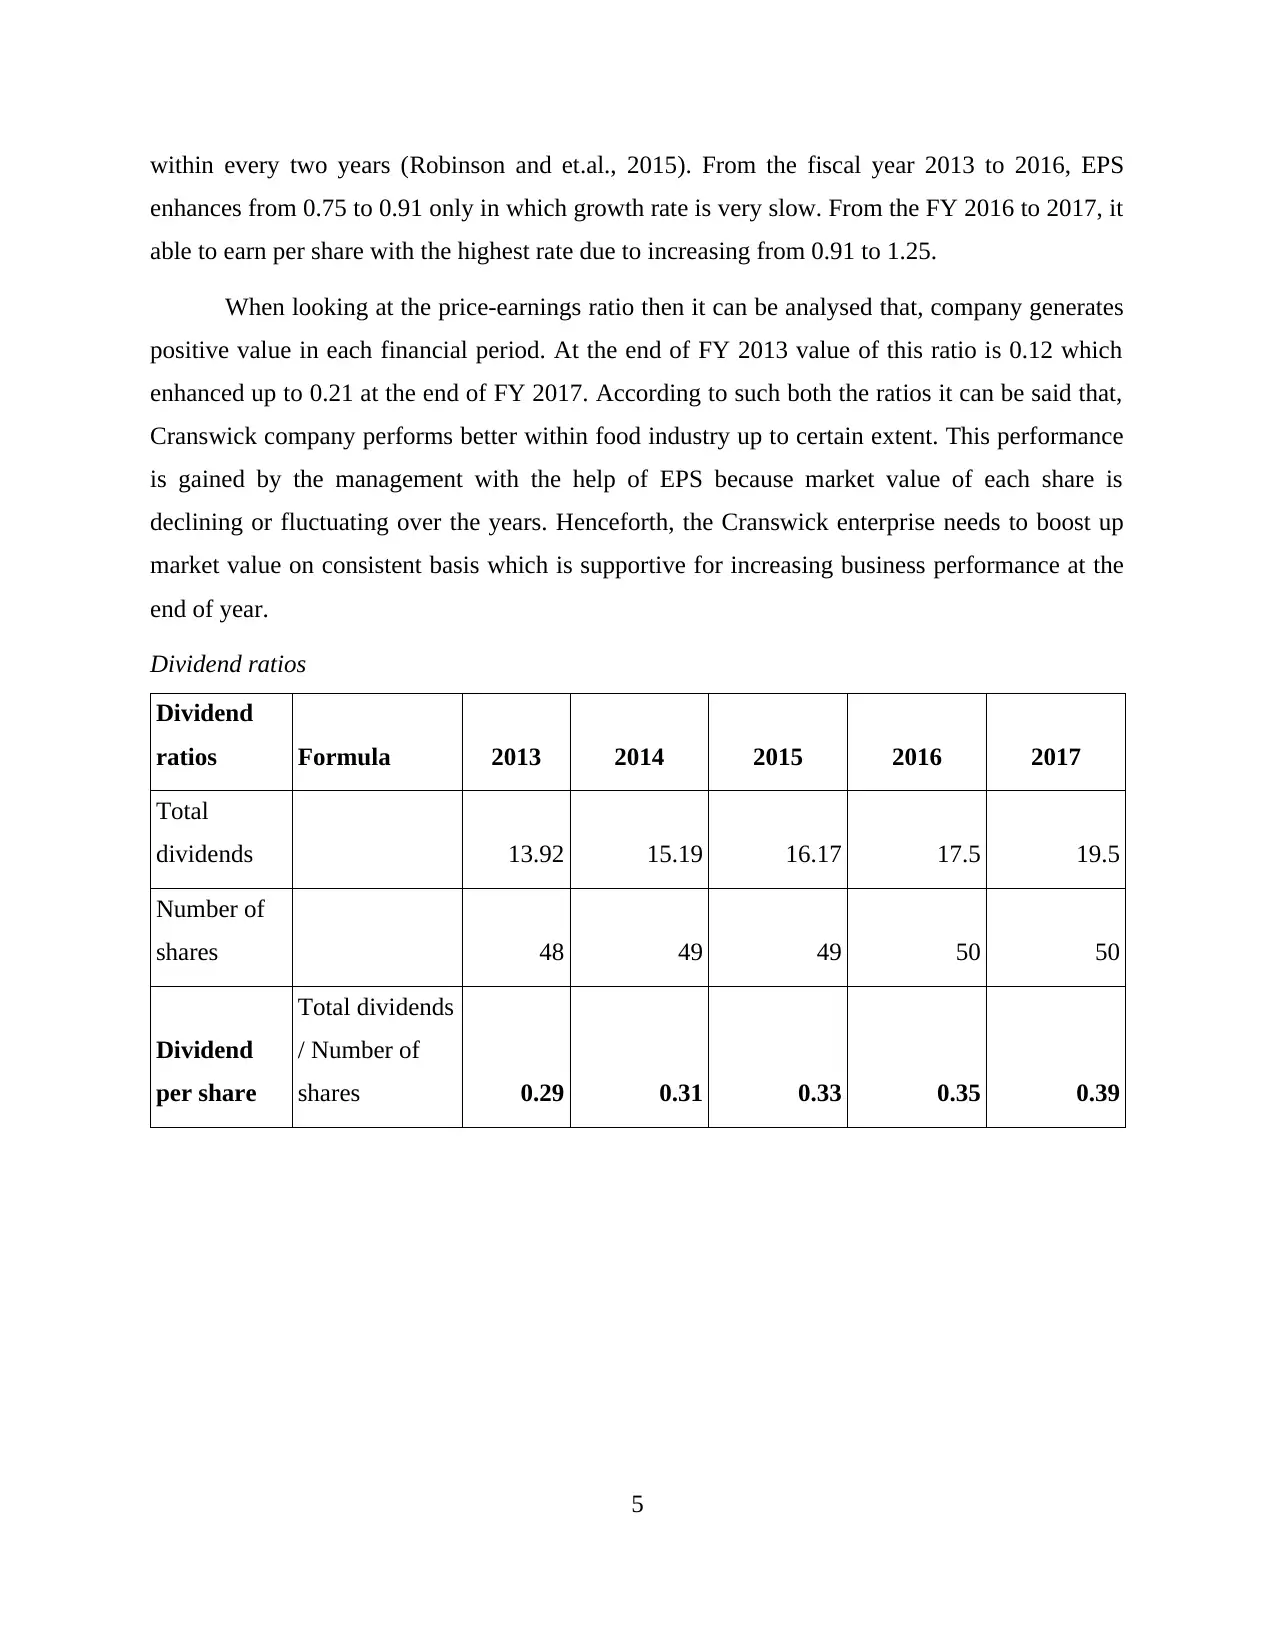
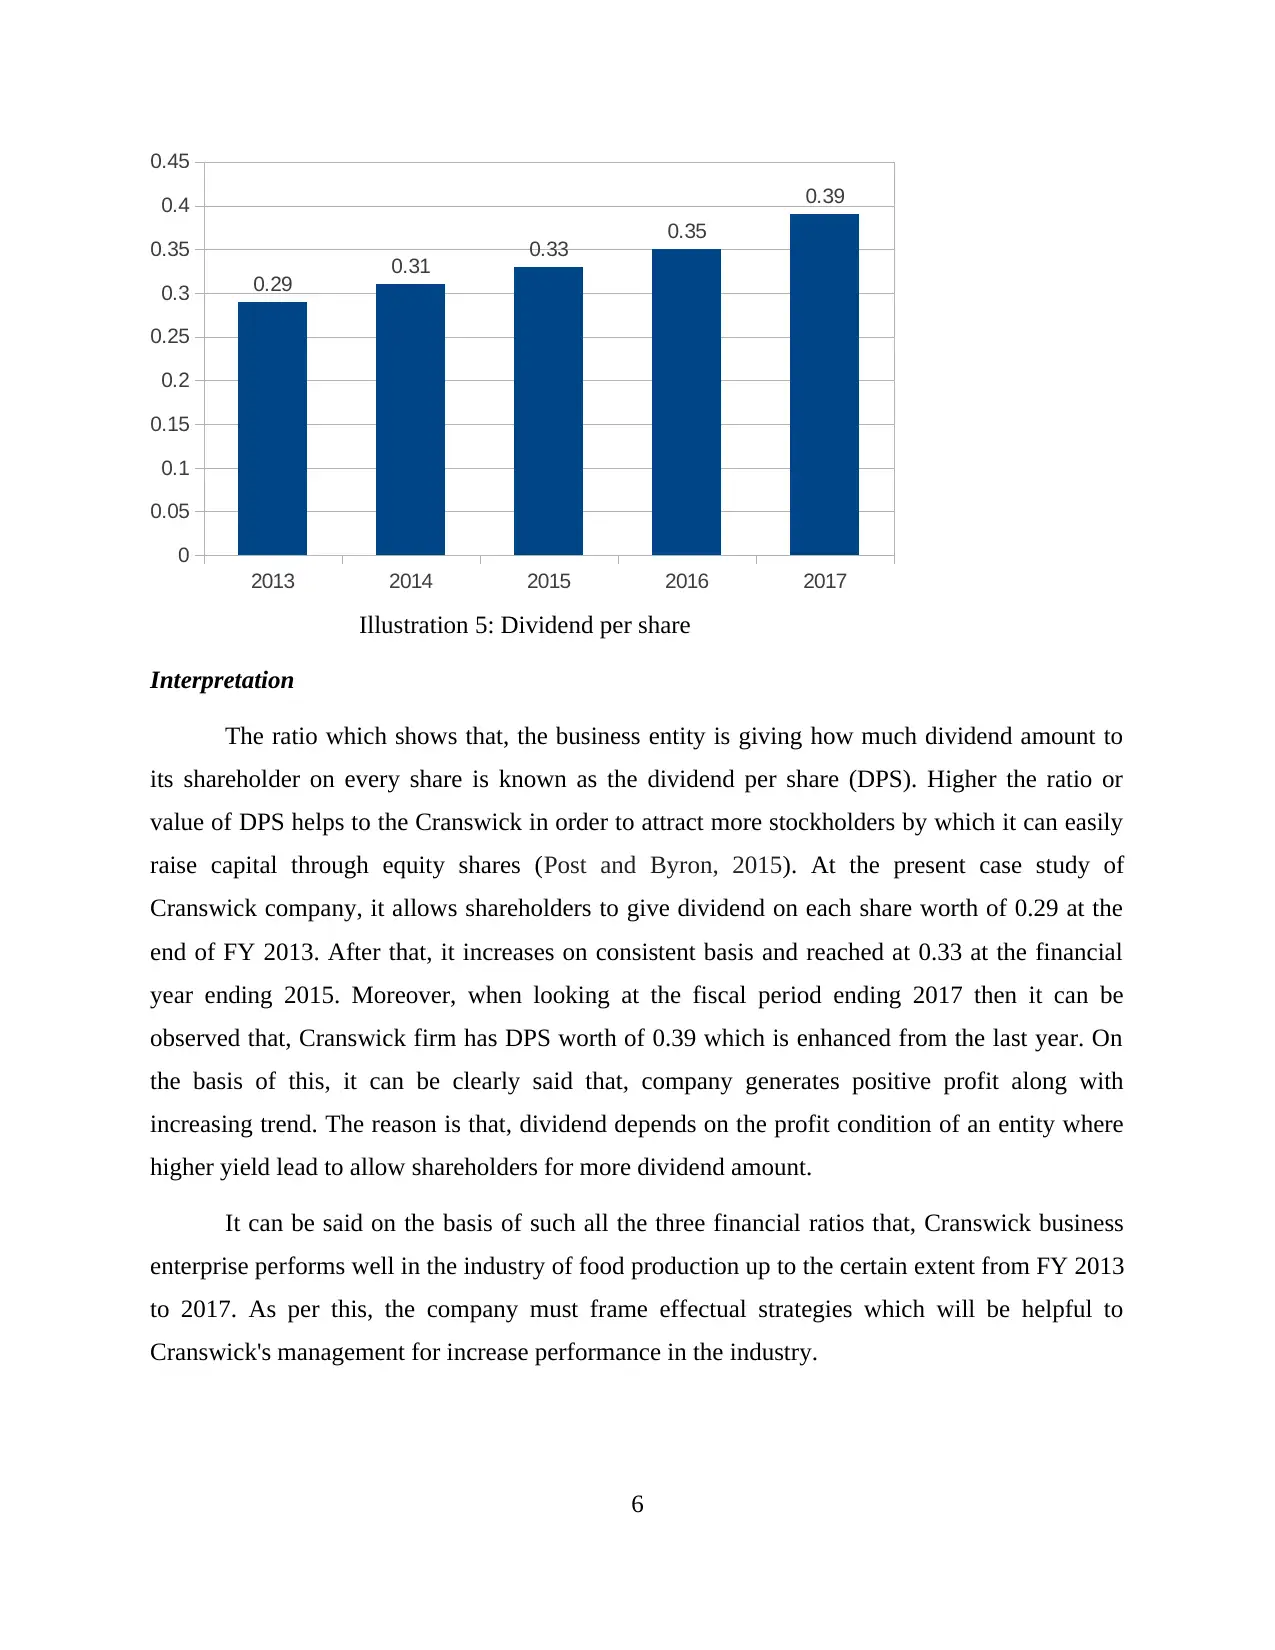
Illustration 5: Dividend per share
Interpretation
The ratio which shows that, the business entity is giving how much dividend amount to
its shareholder on every share is known as the dividend per share (DPS). Higher the ratio or
value of DPS helps to the Cranswick in order to attract more stockholders by which it can easily
raise capital through equity shares (Post and Byron, 2015). At the present case study of
Cranswick company, it allows shareholders to give dividend on each share worth of 0.29 at the
end of FY 2013. After that, it increases on consistent basis and reached at 0.33 at the financial
year ending 2015. Moreover, when looking at the fiscal period ending 2017 then it can be
observed that, Cranswick firm has DPS worth of 0.39 which is enhanced from the last year. On
the basis of this, it can be clearly said that, company generates positive profit along with
increasing trend. The reason is that, dividend depends on the profit condition of an entity where
higher yield lead to allow shareholders for more dividend amount.
It can be said on the basis of such all the three financial ratios that, Cranswick business
enterprise performs well in the industry of food production up to the certain extent from FY 2013
to 2017. As per this, the company must frame effectual strategies which will be helpful to
Cranswick's management for increase performance in the industry.
6
0
0.05
0.1
0.15
0.2
0.25
0.3
0.35
0.4
0.45
0.29 0.31 0.33 0.35
0.39
Illustration 5: Dividend per share
Interpretation
The ratio which shows that, the business entity is giving how much dividend amount to
its shareholder on every share is known as the dividend per share (DPS). Higher the ratio or
value of DPS helps to the Cranswick in order to attract more stockholders by which it can easily
raise capital through equity shares (Post and Byron, 2015). At the present case study of
Cranswick company, it allows shareholders to give dividend on each share worth of 0.29 at the
end of FY 2013. After that, it increases on consistent basis and reached at 0.33 at the financial
year ending 2015. Moreover, when looking at the fiscal period ending 2017 then it can be
observed that, Cranswick firm has DPS worth of 0.39 which is enhanced from the last year. On
the basis of this, it can be clearly said that, company generates positive profit along with
increasing trend. The reason is that, dividend depends on the profit condition of an entity where
higher yield lead to allow shareholders for more dividend amount.
It can be said on the basis of such all the three financial ratios that, Cranswick business
enterprise performs well in the industry of food production up to the certain extent from FY 2013
to 2017. As per this, the company must frame effectual strategies which will be helpful to
Cranswick's management for increase performance in the industry.
6
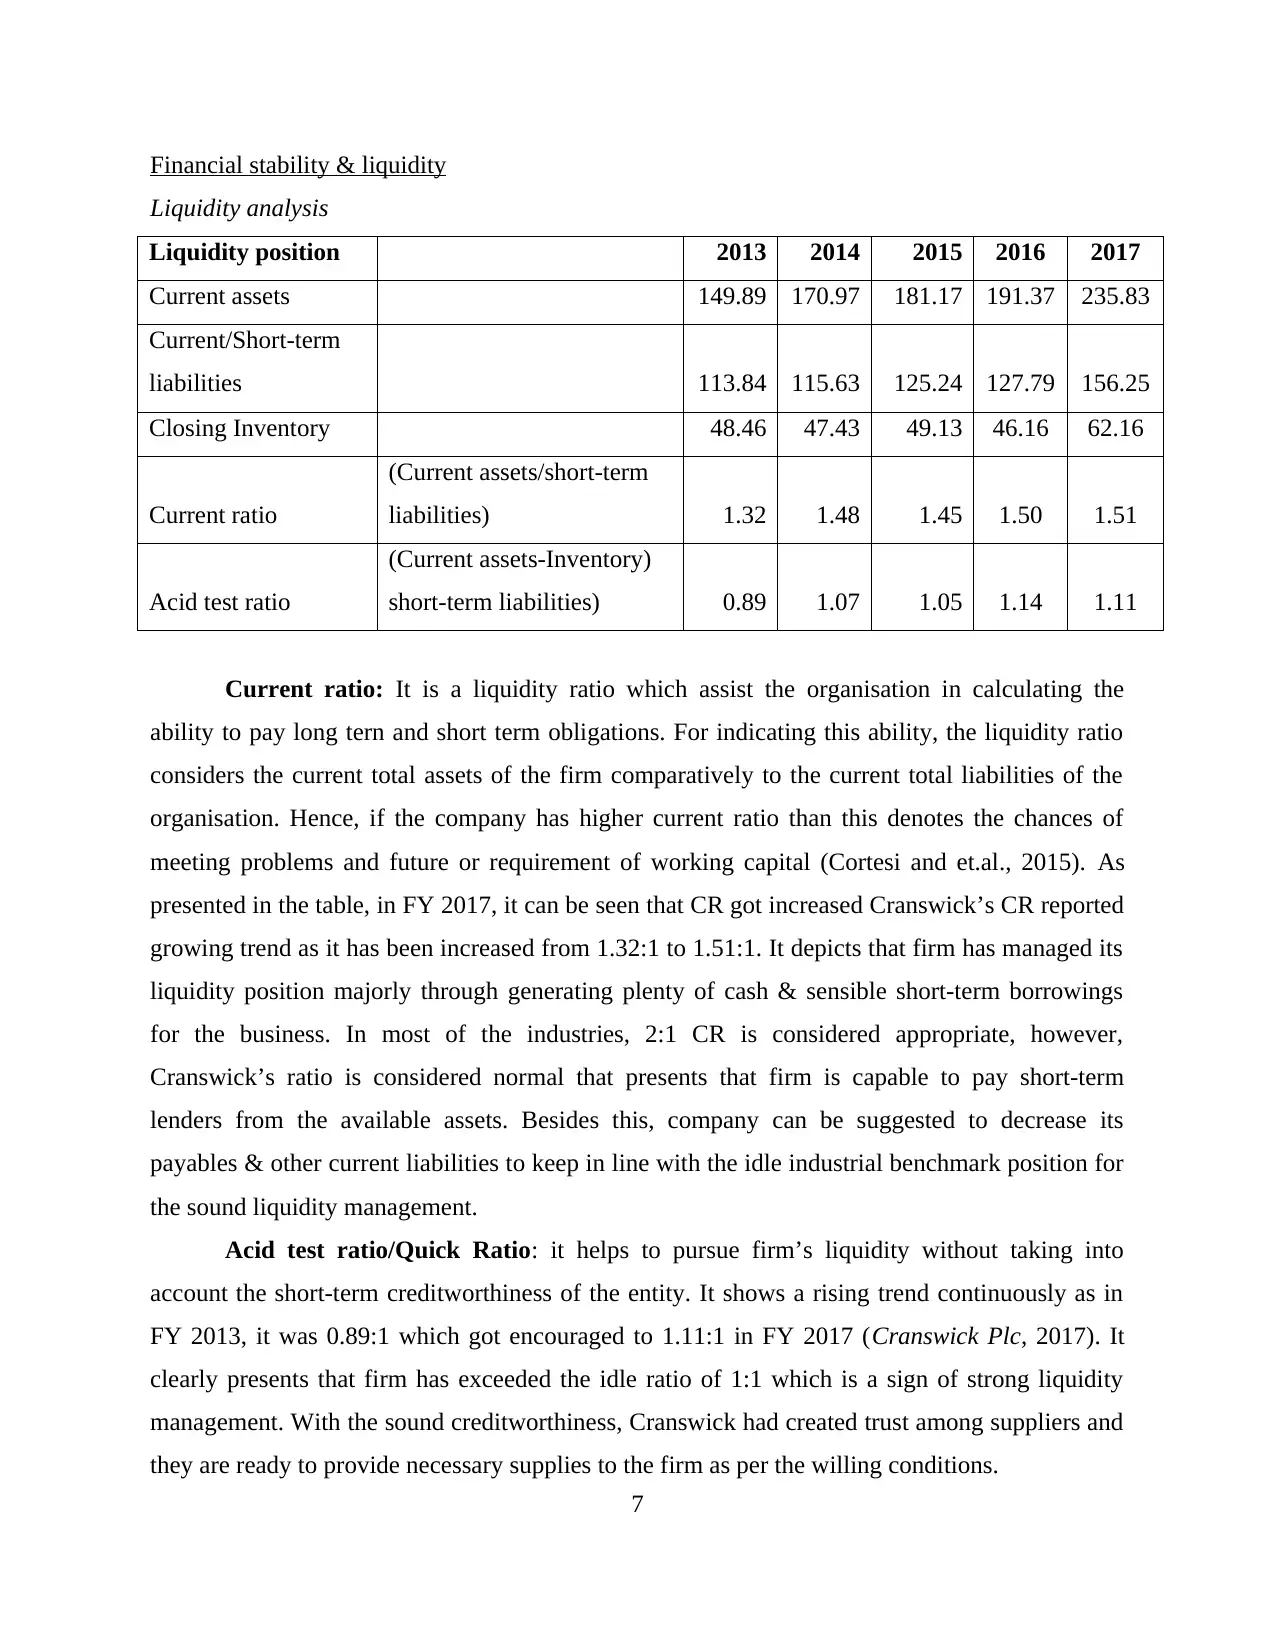
Financial stability & liquidity
Liquidity analysis
Liquidity position 2013 2014 2015 2016 2017
Current assets 149.89 170.97 181.17 191.37 235.83
Current/Short-term
liabilities 113.84 115.63 125.24 127.79 156.25
Closing Inventory 48.46 47.43 49.13 46.16 62.16
Current ratio
(Current assets/short-term
liabilities) 1.32 1.48 1.45 1.50 1.51
Acid test ratio
(Current assets-Inventory)
short-term liabilities) 0.89 1.07 1.05 1.14 1.11
Current ratio: It is a liquidity ratio which assist the organisation in calculating the
ability to pay long tern and short term obligations. For indicating this ability, the liquidity ratio
considers the current total assets of the firm comparatively to the current total liabilities of the
organisation. Hence, if the company has higher current ratio than this denotes the chances of
meeting problems and future or requirement of working capital (Cortesi and et.al., 2015). As
presented in the table, in FY 2017, it can be seen that CR got increased Cranswick’s CR reported
growing trend as it has been increased from 1.32:1 to 1.51:1. It depicts that firm has managed its
liquidity position majorly through generating plenty of cash & sensible short-term borrowings
for the business. In most of the industries, 2:1 CR is considered appropriate, however,
Cranswick’s ratio is considered normal that presents that firm is capable to pay short-term
lenders from the available assets. Besides this, company can be suggested to decrease its
payables & other current liabilities to keep in line with the idle industrial benchmark position for
the sound liquidity management.
Acid test ratio/Quick Ratio: it helps to pursue firm’s liquidity without taking into
account the short-term creditworthiness of the entity. It shows a rising trend continuously as in
FY 2013, it was 0.89:1 which got encouraged to 1.11:1 in FY 2017 (Cranswick Plc, 2017). It
clearly presents that firm has exceeded the idle ratio of 1:1 which is a sign of strong liquidity
management. With the sound creditworthiness, Cranswick had created trust among suppliers and
they are ready to provide necessary supplies to the firm as per the willing conditions.
7
⊘ This is a preview!⊘
Do you want full access?
Subscribe today to unlock all pages.
Trusted by 1+ million students worldwide
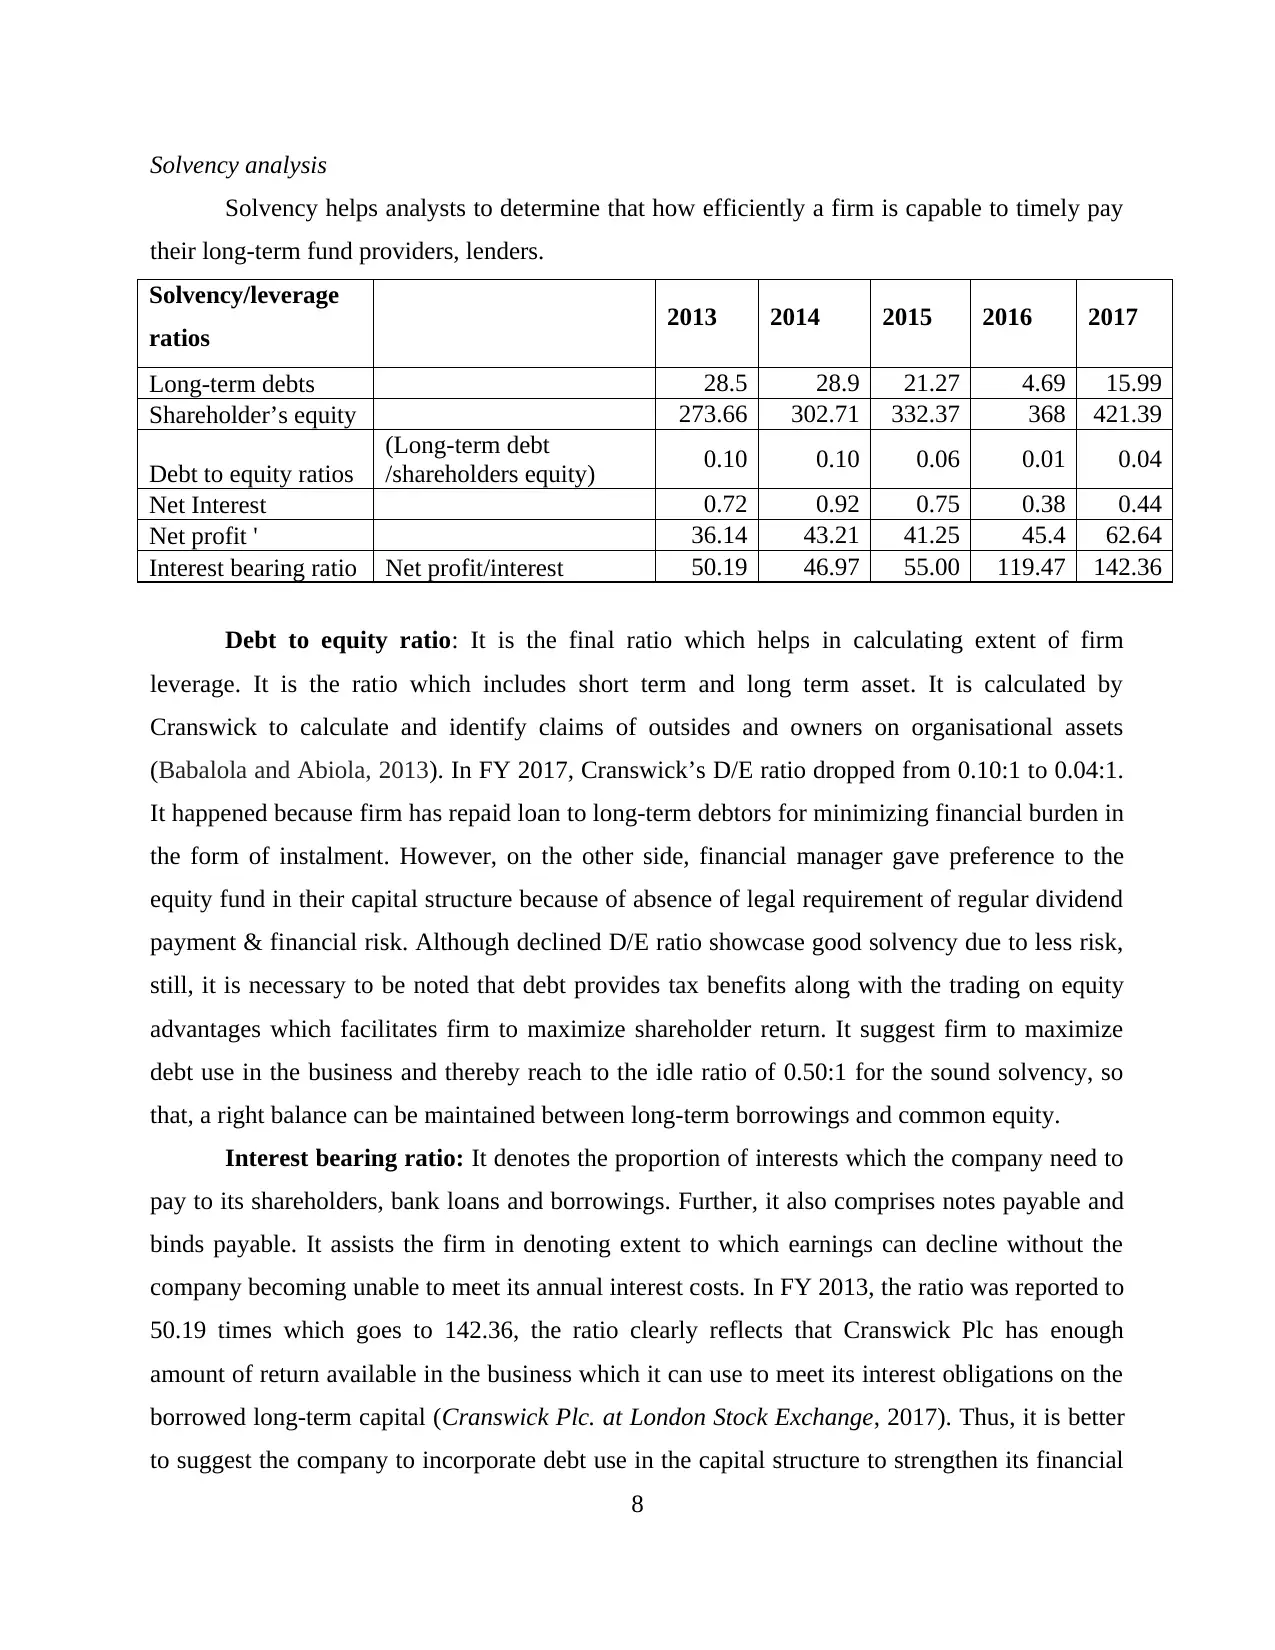
Solvency analysis
Solvency helps analysts to determine that how efficiently a firm is capable to timely pay
their long-term fund providers, lenders.
Solvency/leverage
ratios 2013 2014 2015 2016 2017
Long-term debts 28.5 28.9 21.27 4.69 15.99
Shareholder’s equity 273.66 302.71 332.37 368 421.39
Debt to equity ratios
(Long-term debt
/shareholders equity) 0.10 0.10 0.06 0.01 0.04
Net Interest 0.72 0.92 0.75 0.38 0.44
Net profit ' 36.14 43.21 41.25 45.4 62.64
Interest bearing ratio Net profit/interest 50.19 46.97 55.00 119.47 142.36
Debt to equity ratio: It is the final ratio which helps in calculating extent of firm
leverage. It is the ratio which includes short term and long term asset. It is calculated by
Cranswick to calculate and identify claims of outsides and owners on organisational assets
(Babalola and Abiola, 2013). In FY 2017, Cranswick’s D/E ratio dropped from 0.10:1 to 0.04:1.
It happened because firm has repaid loan to long-term debtors for minimizing financial burden in
the form of instalment. However, on the other side, financial manager gave preference to the
equity fund in their capital structure because of absence of legal requirement of regular dividend
payment & financial risk. Although declined D/E ratio showcase good solvency due to less risk,
still, it is necessary to be noted that debt provides tax benefits along with the trading on equity
advantages which facilitates firm to maximize shareholder return. It suggest firm to maximize
debt use in the business and thereby reach to the idle ratio of 0.50:1 for the sound solvency, so
that, a right balance can be maintained between long-term borrowings and common equity.
Interest bearing ratio: It denotes the proportion of interests which the company need to
pay to its shareholders, bank loans and borrowings. Further, it also comprises notes payable and
binds payable. It assists the firm in denoting extent to which earnings can decline without the
company becoming unable to meet its annual interest costs. In FY 2013, the ratio was reported to
50.19 times which goes to 142.36, the ratio clearly reflects that Cranswick Plc has enough
amount of return available in the business which it can use to meet its interest obligations on the
borrowed long-term capital (Cranswick Plc. at London Stock Exchange, 2017). Thus, it is better
to suggest the company to incorporate debt use in the capital structure to strengthen its financial
8
Paraphrase This Document
Need a fresh take? Get an instant paraphrase of this document with our AI Paraphraser
stability and solvency. It will offer benefit of TOE wherein Cranswick can reduce its tax burden
through getting deductions and thereby maximize return for the shareholders.
SECTION B
Critical reflection on the company portrayed by financial reports
Cranswick the leading food producer of UK, has earned 1245 million pound in 2017 by
22.5%. Further, according to the scholars, revenue was up by 12.7 percent and before tax profit
was 75.5 Million pound which was increased by 17.2%. Besides, the organisations earning per
share was 17.6%. As per researchers, the earnings increased by 18.1 pens from 2016 to 2017.
Further, the statutory profit before tax while functioning increased by 24.8% in 2017
while in 2016 the share was 62.1 Million pound but not it has increased to 77.5 Million pound.
Moreover, as per the researchers the earning per share during the operations of 2017 increased by
25.6% which was very beneficial for company as in 2016 it was only 98.9 Pens and in 2017 it
increased rapidly to 124.2 Pens. Hence, scholar stated that final dividend of Cranswick has been
increased by 19.7 percent in 2017 which created a revolution in food industry of UK because it
was 25.9 pens in 2016 and in 2017 it increased to 31.0 pens.
Henceforth, from analysis of financial report of the company scholar stated that, the
company is improving its functions and operations every year to increase its revenue and profits.
Further, from the analysis it can be said that the company has continuous growth and has stable
market in UK (Delen, Kuzey and Uyar, 2013). The secret behind rapid growth and increasing
profit is following the proper regulations and serving customer satisfaction in order to maximize
profits.
An evaluation of the corporate governance
Corporate governance is defined as an integrated system of corporate rules, regulations,
principles and practices that is followed in the daily operations for meeting out stakeholder’s
responsibilities. In order to implement quality governing framework for the stewardship,
Cranswick’s board of directors are responsible to overlook the business code of conduct and
regular affairs so as to ensure sustainable value for all the stakeholders (Revell, 2016). The board
member gives respect to their key stakeholders including suppliers, employees, community,
customers, investors and others by complying with the Financial Reporting Council’s
professional code of conduct i.e. trustworthiness, integrity, environmental sustainability and
9

others. Cranswick prepare their financial statement and publish it to the public to provide them
required information. However, for the employees, the board members believes in blending
varied skills, knowledge and talent of the employees through hiring diversified workers at the
workplace. They are also provided with the training programmes to support their career growth
opportunities.
Figure 1 Risk management & governance of Cranswick Plc
(Source: Business model & strategy, 2013)
As illustrated above, company’s risk committee is accountable to identify various
business risks i.e. financial, operational and regulatory risk and use suitable plans and strategies
to address it effectively. Internal control mechanism is also used for directing and supervision of
the regular activities. Risk committee report possible risks and advise risk mitigation plans to the
Cranswick’s Audit committee (Lee, Sameen and Cowling, 2015). Company also audited their
10
⊘ This is a preview!⊘
Do you want full access?
Subscribe today to unlock all pages.
Trusted by 1+ million students worldwide
1 out of 17
Related Documents


Your All-in-One AI-Powered Toolkit for Academic Success.
+13062052269
info@desklib.com
Available 24*7 on WhatsApp / Email
![[object Object]](/_next/static/media/star-bottom.7253800d.svg)
Unlock your academic potential
Copyright © 2020–2026 A2Z Services. All Rights Reserved. Developed and managed by ZUCOL.