MAA716 Financial Accounting: Earnings Management During Crisis
VerifiedAdded on 2023/01/18
|24
|15057
|69
Literature Review
AI Summary
This paper investigates the impact of the 2008-2009 financial crisis on earnings management practices among European-listed firms. The study analyzes data from 16 European countries between 2006 and 2009, finding a significant decrease in earnings management during the crisis years. The research uses income smoothing and accrual quality measures to assess earnings management, revealing a direct link between the level of earnings management and the economic growth rate. Furthermore, the study indicates that national characteristics and market forces influence income smoothing but not accruals quality. The findings suggest that earnings manipulations are more prevalent in growth periods than in crisis years, highlighting the sensitivity of earnings management to general economic conditions. The paper contributes to the accounting literature by demonstrating that institutional and market characteristics have varying effects on different types of earnings management, emphasizing the need for nuanced consideration in future research.
Financial Crisis And Earnings
Management: The European Evidence☆
Andrei Filipa,⁎, Bernard Raffournierb
a ESSEC Business School, France
b GSEM, University of Geneva, Switzerland
Received 28 March 2013
Available online 28 October 2014
Abstract
We examine the impact of the 2008–2009 financial crisis on the earnings management b
European-listed firms. We find that earnings management has significantly decreased in th
This trend is confirmed in most of the 16 countries under review. We also report a link betw
of earnings management and the economic growth rate and provide evidence suggesting t
characteristics and market forces affect the propensity of income smoothing but not accrua
© 2014 University of Illinois. All rights reserved.
JEL Classification: G01 Financial Crises; M41 Accounting
Keywords: Financial crisis; Earnings management; Europe; IFRS; Investor protection; Accounting quality
1. Introduction
In recentyears,earningsmanagementhas received considerableattention from
academics, to the point that there is now an extensive body of research on the det
and consequences ofthe manipulation ofearnings.A common characteristic ofthese
studies is that they do not take into consideration the macroeconomic environmen
firm.In other words,generaleconomic conditions are held constantor supposed notto
influence the incentives for earnings management.Nevertheless,it can be assumed that
dramatic changes in the economic climate have an impacton the firm's propensity to
http://dx.doi.org/10.1016/j.intacc.2014.10.004
0020-7063/© 2014 University of Illinois. All rights reserved.
Available online at www.sciencedirect.com
ScienceDirect
The International Journal of Accounting 49 (2014) 455 – 478
☆ We acknowledge with great appreciation the CPA Ontario for supporting The Journal of International A
Symposium held at Brock University on July 5–7, 2012. We appreciate the helpful comments and sugges
during the Symposium and from conference participants at the 2012. AMIS conference (especially from
⁎ Corresponding author.
E-mail addresses: filip@essec.fr (A. Filip), bernard.raffournier@unige.ch (B. Raffournier).
Paraphrase This Document
Need a fresh take? Get an instant paraphrase of this document with our AI Paraphraser
manipulate earnings and/or the sign of these manipulations. The purpose of this pa
explore the influence of significant variations in the economic environment by comp
the earnings management practices of European companies during the 2008 –2009
crisis and in the years before.
According to the accounting literature, the motivations for earnings managemen
classified into two categories: those relating to the market, and those resulting from
relationships. Concerning the market influence, several studies provide evidence co
with the intuition that firms manage earnings upward to avoid reporting losses,earnings
declines, or negative earnings surprises (Ayers, Jiang, & Yeung, 2006; Burgstahler &
1997;Degeorge,Patel,& Zeckhauser,1999).Firms are also suspected ofmanipulating
earnings to facilitate the success of security issues. This hypothesis is supported by
studies showing that firms tend to inflate their earnings prior to seasoned equity off
(Rangan, 1998; Teoh, Welch, & Wong, 1998) or initial public offerings (Teoh, Wong,
1998). Earnings management can also be used as a tool to influence the execution
between the firm and its stakeholders. Empirical studies also provide evidence cons
the idea that managers manipulate earnings to increase their earnings-based comp
(Guidry,Leone,& Rock,1999;Holthausen,Larcker,& Sloan,1995),or to avoid debt
covenant violations (DeFond & Jiambalvo, 1994; Dichev & Skinner, 2002).
Prior studiesinvestigatehow firm's attributes(e.g., presenceof bonusplans,
earnings-based managementcompensation,or debtcovenants) or a particular event(bond
or equity issue) create incentives to manage earnings. Nevertheless, there is also e
macroeconomicconditionsdo affectearningsquality.Johnson (1999),for example,
documents that the value relevance of accounting earnings is sensitive to the busin
0
500
1,000
1,500
2,000
2,500
3,000
3,500
4,000
4,500
5,000
2003 2004 2005 2006 2007 2008 2009 2010
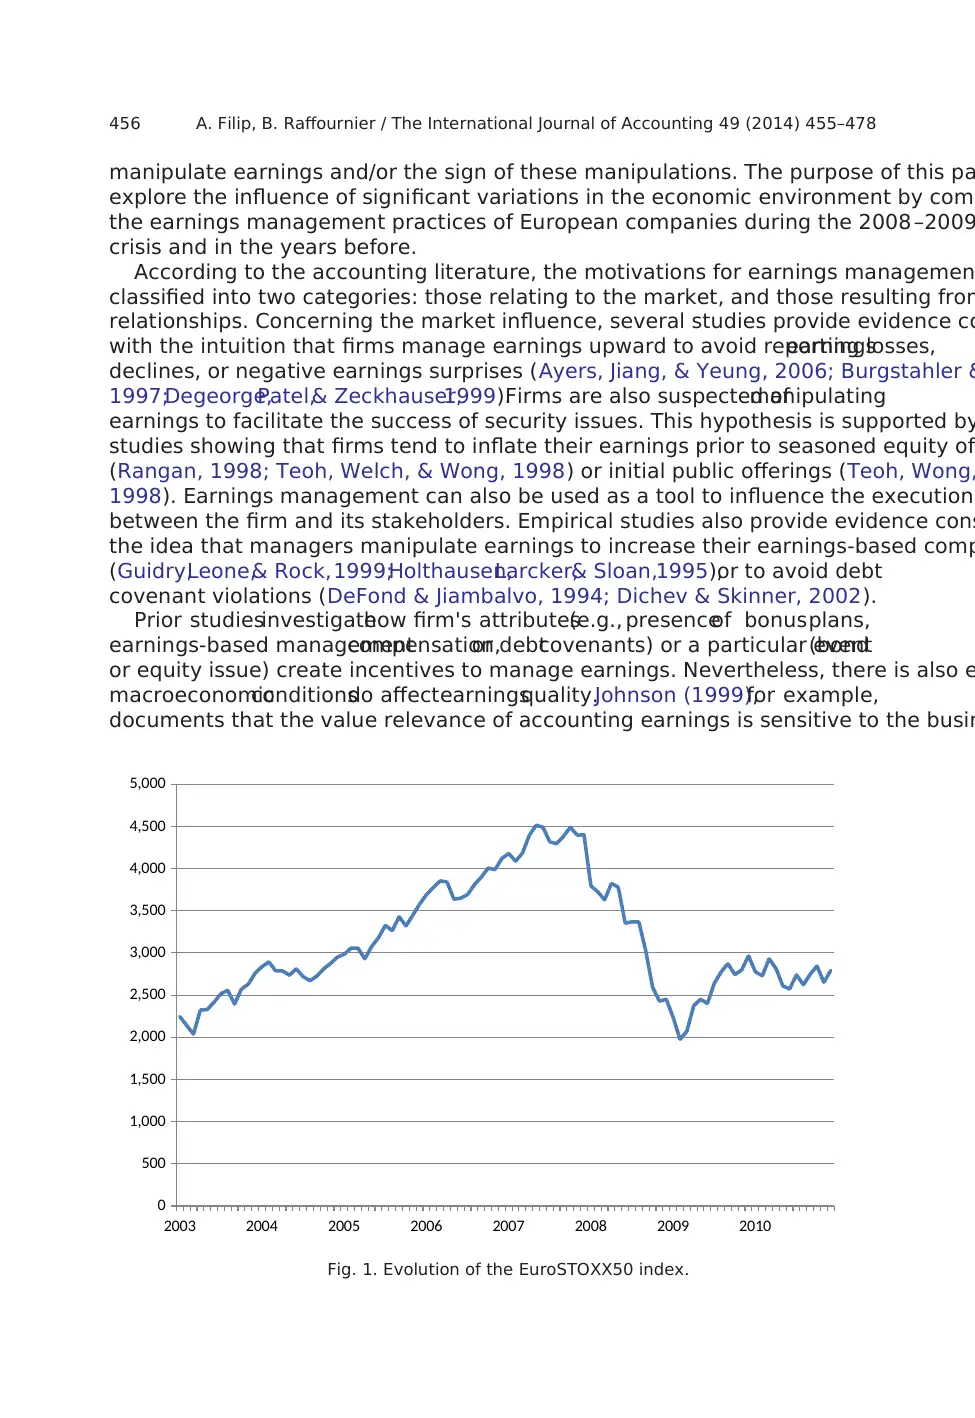
Fig. 1. Evolution of the EuroSTOXX50 index.
456 A. Filip, B. Raffournier / The International Journal of Accounting 49 (2014) 455–478
explore the influence of significant variations in the economic environment by comp
the earnings management practices of European companies during the 2008 –2009
crisis and in the years before.
According to the accounting literature, the motivations for earnings managemen
classified into two categories: those relating to the market, and those resulting from
relationships. Concerning the market influence, several studies provide evidence co
with the intuition that firms manage earnings upward to avoid reporting losses,earnings
declines, or negative earnings surprises (Ayers, Jiang, & Yeung, 2006; Burgstahler &
1997;Degeorge,Patel,& Zeckhauser,1999).Firms are also suspected ofmanipulating
earnings to facilitate the success of security issues. This hypothesis is supported by
studies showing that firms tend to inflate their earnings prior to seasoned equity off
(Rangan, 1998; Teoh, Welch, & Wong, 1998) or initial public offerings (Teoh, Wong,
1998). Earnings management can also be used as a tool to influence the execution
between the firm and its stakeholders. Empirical studies also provide evidence cons
the idea that managers manipulate earnings to increase their earnings-based comp
(Guidry,Leone,& Rock,1999;Holthausen,Larcker,& Sloan,1995),or to avoid debt
covenant violations (DeFond & Jiambalvo, 1994; Dichev & Skinner, 2002).
Prior studiesinvestigatehow firm's attributes(e.g., presenceof bonusplans,
earnings-based managementcompensation,or debtcovenants) or a particular event(bond
or equity issue) create incentives to manage earnings. Nevertheless, there is also e
macroeconomicconditionsdo affectearningsquality.Johnson (1999),for example,
documents that the value relevance of accounting earnings is sensitive to the busin
0
500
1,000
1,500
2,000
2,500
3,000
3,500
4,000
4,500
5,000
2003 2004 2005 2006 2007 2008 2009 2010
Fig. 1. Evolution of the EuroSTOXX50 index.
456 A. Filip, B. Raffournier / The International Journal of Accounting 49 (2014) 455–478
more precisely thatthe association between earnings and stock returns is higherduring
expansion periods than during contraction years.
Similarly,Jenkins,Kane,and Velury (2009) argue thatsince accounting information
reflects both the consequences of generaleconomic conditions and the effects of firm's
activities, its information content may vary across the business cycle. Contrary to J
(1999), they find that earnings are more value relevant during contraction years th
expansion periods.If macroeconomicconditionsaffectthe information contentof
accounting data, it can be expected that the predictive ability of accounting-based
prediction models varies across the business cycle. Consistent with this conjecture
studies reportthatthese models are sensitive to the occurrence ofa recession (Kane,
Richarson, & Graybeal, 1996; Richardson, Kane, & Lobingier, 1998).
These findings highlight the need for contextual earnings management studies,
research thatwould take into accountthe macroeconomic conditionsin which firms
operate. The 2008–2009 financial crisis and the preceding years provide a unique
for such analysis.From 2003 to 2007,the European financialmarketexperienced a
moderate but continuous growth, reflected by the EuroSTOXX50 index, whose valu
from 2000 to 4500 points during this period. Following the subprime crisis, the ind
to less than 2000 points in February 2009.Since then,it partially recovered without
exceeding the 3000-point threshold (see Fig. 1).
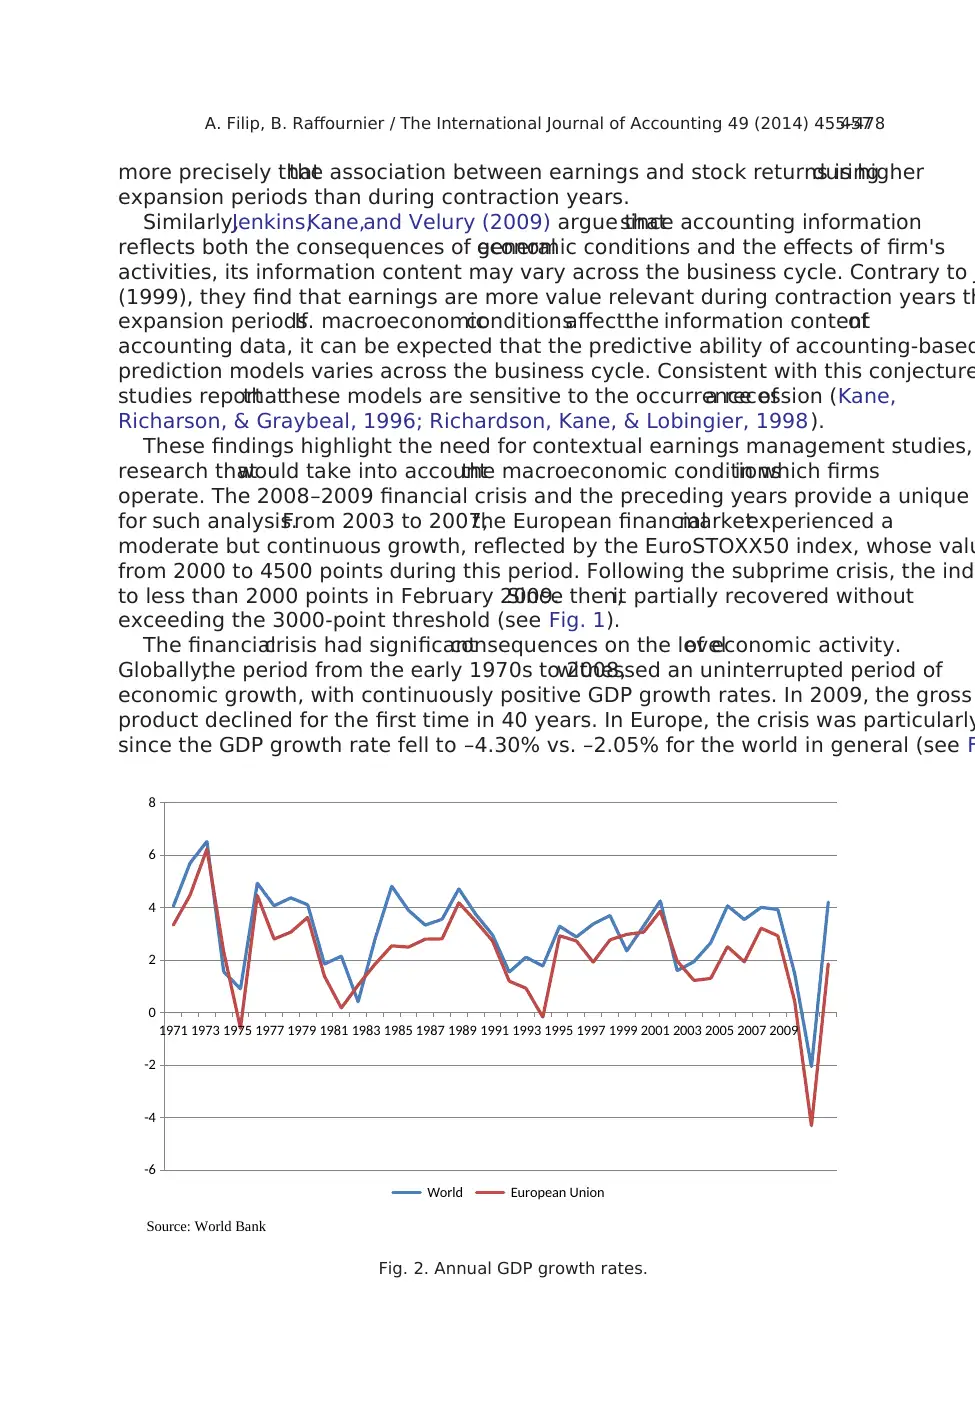
The financialcrisis had significantconsequences on the levelof economic activity.
Globally,the period from the early 1970s to 2008,witnessed an uninterrupted period of
economic growth, with continuously positive GDP growth rates. In 2009, the gross
product declined for the first time in 40 years. In Europe, the crisis was particularly
since the GDP growth rate fell to –4.30% vs. –2.05% for the world in general (see F
Source: World Bank
-6
-4
-2
0
2
4
6
8
1971 1973 1975 1977 1979 1981 1983 1985 1987 1989 1991 1993 1995 1997 1999 2001 2003 2005 2007 2009
World European Union
Fig. 2. Annual GDP growth rates.
457A. Filip, B. Raffournier / The International Journal of Accounting 49 (2014) 455–478
expansion periods than during contraction years.
Similarly,Jenkins,Kane,and Velury (2009) argue thatsince accounting information
reflects both the consequences of generaleconomic conditions and the effects of firm's
activities, its information content may vary across the business cycle. Contrary to J
(1999), they find that earnings are more value relevant during contraction years th
expansion periods.If macroeconomicconditionsaffectthe information contentof
accounting data, it can be expected that the predictive ability of accounting-based
prediction models varies across the business cycle. Consistent with this conjecture
studies reportthatthese models are sensitive to the occurrence ofa recession (Kane,
Richarson, & Graybeal, 1996; Richardson, Kane, & Lobingier, 1998).
These findings highlight the need for contextual earnings management studies,
research thatwould take into accountthe macroeconomic conditionsin which firms
operate. The 2008–2009 financial crisis and the preceding years provide a unique
for such analysis.From 2003 to 2007,the European financialmarketexperienced a
moderate but continuous growth, reflected by the EuroSTOXX50 index, whose valu
from 2000 to 4500 points during this period. Following the subprime crisis, the ind
to less than 2000 points in February 2009.Since then,it partially recovered without
exceeding the 3000-point threshold (see Fig. 1).
The financialcrisis had significantconsequences on the levelof economic activity.
Globally,the period from the early 1970s to 2008,witnessed an uninterrupted period of
economic growth, with continuously positive GDP growth rates. In 2009, the gross
product declined for the first time in 40 years. In Europe, the crisis was particularly
since the GDP growth rate fell to –4.30% vs. –2.05% for the world in general (see F
Source: World Bank
-6
-4
-2
0
2
4
6
8
1971 1973 1975 1977 1979 1981 1983 1985 1987 1989 1991 1993 1995 1997 1999 2001 2003 2005 2007 2009
World European Union
Fig. 2. Annual GDP growth rates.
457A. Filip, B. Raffournier / The International Journal of Accounting 49 (2014) 455–478
⊘ This is a preview!⊘
Do you want full access?
Subscribe today to unlock all pages.
Trusted by 1+ million students worldwide
To measure the impact of the financial crisis on accounting manipulations, we analy
leveland sign of earnings managementby European companies over the period 2006–
2009.The choice ofEurope has severaladvantages.First,Europe has been severely
affected by the 2008–2009 financial crisis. Accordingly, if macroeconomic condition
affect earnings manipulations, significant differences in the magnitude and sign of
management are expected between the expansion period (2006–2007) and the cris
(2008–2009).1 Second, most prior studies were conducted at a single-country level, w
makes the external validity of their findings questionable. Extending the analysis to
geographicalarea neutralizescountry-specific influencesand,consequently,provides
strongerevidence.Assigning countriesinto subgroupswill also make itpossible to
examine the impact of transnational factors such as the legal regime or the prevaili
of financing.
Finally,in order to isolate the impact of macroeconomic conditions,it is necessary to
hold other factors constant.In this regard,the European experimentalsetting is a good
choice inasmuch as since 2005,European-listed companies must comply with IFRS.All
firms in the sample are thus subject to the same accounting regulation regardless o
nationality. As a result, country differences in the level of earnings management ca
interpreted as reflecting differences in the permissiveness of local accounting stand
Following prior research,earnings managementis measured with severalindicators:
two metrics of income smoothing and three accrual quality measures. Our data com
16 European countries and coverthe period 2006–2009,leading to a sample of8266
firm-year observations. We provide evidence that earnings management has signi fi
decreased in the crisis years and that this trend is confirmed in most of the countrie
review.Further,we testand find a directlink between the magnitude ofearnings
management and the economic growth rate of the firm's country.Finally,we also report
that institutional and market characteristics are associated with income-smoothing
but not with accrual quality measures.
The main contribution of this study is to show that earnings management is sens
generaleconomicconditions,a factorthat was omittedby prior research.More
specifically,it documents thatincome manipulations are more likely in growth periods
than in crisis years,a finding thatshould be ofinterestto investors.This paperalso
contributes to the accounting literature by providing evidence that national charact
do not equally affect all types of earnings management. In particular, income smoo
shown as more closely reflecting institutionaland marketcharacteristics than accruals
manipulations,suggesting thatfuture research should notindiscriminately considerall
types of earnings management.
The restof the paper is organized as follows.First,we presenta brief review of the
literature and discuss factors thatmay affectearnings managementduring periods of
1 The financial crisis started in the US in 2007 but hit its peak in September and October 2008 with the
severalmajor financialinstitutions (Lehman Brothers,MerrillLynch,Fannie Mae,Freddie Mac,Washington
Mutual,Wachovia,Citigroup,and AIG).However,as shown by Figs.1 and 2,the consequences of the crisis
started to be felt in Europe mostly in 2008. We thus refer to 2006 and 2007 as pre-crisis years, and 2008
as crisis years.
458 A. Filip, B. Raffournier / The International Journal of Accounting 49 (2014) 455–478
Paraphrase This Document
Need a fresh take? Get an instant paraphrase of this document with our AI Paraphraser
economic stress. Second, we present the research design and the sample. Third, w
the results and make additional analyses to explain country differences. We conclu
a summary of the findings and their implications for further research.
2. Earnings management in troubled periods: the conflicting views
There are a number of reasons to believe that earnings management should be
periods of economic stress. First, in such periods, most firms probably exhibit lowe
which should motivate managers to engage in income-increasing earnings manage
compensate forthe decrease ofoperationalperformance (Ahmad-Zaluki,Campbell,&
Goodacre, 2011). Managers of the most affected firms in particular may manipulat
upward to avoid a large decline of the firm's stock price that would negatively imp
compensation (Charitou, Lambertides, & Trigeorgis, 2007).
Another reason is the presence of debt covenants. Because such covenants are
based on earnings (Dichev & Skinner,2002),income-increasing manipulations should
reduce the probability of violations (DeFond & Jiambalvo,1994;Iatridis & Kadorinis,
2009; Saleh & Ahmed, 2005; Sweeney, 1994).
Consistentwith the intuition thatperiods of economic turbulence incite managers to
manipulate earnings upward,Ahmad-Zalukiet al. (2011) reportthatincome-increasing
earnings management by Malaysian firms engaged in initial public offerings was lim
IPOs that occurred during the Asian crisis period (1997–1998).
Adversely,in troubled periods,some firms may have incentives to manage earnings
downward, in particular those that must undertake debt restructuring due to debt
violation or failure to meet a debt repayment.For these firms,reporting losses may help
obtain concessions from lenders.Banks have the option to refuse these concessions and
require the firm's liquidation. However, in recession periods, the realizable value o
assets is probably low (Shleifer& Vishny,1992),which should incite them to accept
conditionsthatthey would ordinarily refuse.Consistentwith thisintuition,Asquith,
Gertner, and Scharfstein (1994) provide evidence that rather than exercising their
call the loan, banks generally prefer to restructure the debt by waiving covenants,
principal and interest, or reducing the interest rate.
Income-reducing earnings managementmightalso resultfrom agency relationships
with employees.DeAngelo,DeAngelo,and Skinner(1994),for example,note thatby
reporting losses, managers portray the firm as seriously troubled, which may be us
extractconcessionsfrom employeeswho otherwisewould doubtthe existenceand
persistence of the firm's difficulties. In support of this assertion, DeAngelo and DeA
(1991) show that reported earnings are lower during union renegotiations.
The search for political advantage can also motivate the reduction of earnings. I
periods, governments are likely to provide support to firms in financial distress (Pe
1976). Governmental support may take various forms. Ahmed, Godfrey, and Saleh
mention thatduring the Asian financialcrisis,the Malaysian governmentinstituted
mechanisms to facilitate the debt restructuring of companies. In 2008–2009, gove
of many countries provided banks with public funds to mitigate the credit crisis. Fir
also use the economic downturn asa pretextto obtain advantagesor oppose new
regulations.Because the probability of obtaining governmental aid increases as finan
459A. Filip, B. Raffournier / The International Journal of Accounting 49 (2014) 455–478
performance worsens, firms have an incentive to deflate earnings. The literature pr
evidence of income-reducing earnings management to obtain advantages from the
(Jones, 1991; Lim & Matolcsy, 1999; Navissi, 1999). In an analysis of accounting cho
troubled companies,DeAngelo etal.(1994) reportthatseveraldistressed firms used their
financial difficulties to argue for import relief or antitrust clearance.
All previous arguments suggest that periods of economic downturn should be ass
with higher level of earnings management, although they do not agree with the sig
manipulations. Nevertheless, there are also reasons to believe that crises are less f
earnings management than expansion periods.
First, it can be argued that during crises, firms are subject to increased monitorin
auditors,creditors,and other stakeholders,which should resultin managers having less
discretion to manage earnings (Chia,Lapsley,& Lee, 2007).Anotherreason is that
litigation risk is probably higher during periods of economic decline, when equity m
experience sharp drops in stock prices. Managers should respond to this risk increa
limitation of earnings management. Contraction periods should thus be associated
earnings managementand,consequently,more conservative (i.e.,more timely) earnings
(Jenkins et al., 2009). The influence of litigation risk on conservatism is well docume
Huijgen and Lubberink (2005),for example,show thatfirms reportmore conservative
earnings in high legalliability regimes.Clients of Big 4 firms have also been shown as
reporting more conservatively in the post-Enron contextthan before (Krishnan,2007;
Willekens & Bauwhede, 2003).
Lower level of earnings management in recession periods may also result from a
demand forconservative earnings.Because ofthe transitory nature ofcrises,earnings
reported in such periods are less persistent, and thus less useful for predictions. Co
with this assertion, several studies show that the value relevance of earnings (i.e., t
of association between accounting data and market prices) varies across the busine
(Ball & Shivakumar,2005; Brown,He,& Teitel,2006).This increased uncertainty about
future outcomes should motivate marketforces to demand more conservative earnings in
crisis periods (Jenkins et al., 2009), which should dissuade companies to manipulate
earnings. One can also consider that in crisis periods, the market is more inclined to
poor performance (Ahmad-Zaluki et al., 2011). As a consequence, firms have less in
engage in earnings management activities.
Bertomeu and Magee (2011) modelthe dynamics between accounting standards,the
quality of financial reporting, and the state of the economy. Their analytical results
thatfinancialreporting quality should reach its maximum when the economy is good
(expansionarytimes),decreaseas the economicconditionsbecomeless favorable
(moderate times),and increase again ifthe economy becomes recessionary.Therefore,
the financial reporting quality is non-monotonic with the state of the economy. Alth
their model refers to the regulator point of view,it assumes that the regulator passes the
reporting quality levelthatis supported by a majority ofthe agents in the economy
(Wagenhofer, 2011).
On the basis of the existing literature,the effectthat economic crises should have on
earnings managementis unclear.Some argue thatin such periods,firms are induced to
manipulate their earnings,whereas others think thatthey have more incentives to report
unbiased net income. Even among the proponents of increased earnings managem
460 A. Filip, B. Raffournier / The International Journal of Accounting 49 (2014) 455–478
⊘ This is a preview!⊘
Do you want full access?
Subscribe today to unlock all pages.
Trusted by 1+ million students worldwide
opinion is divided, some of them expecting income-increasing manipulations, while
argue thatperiodsof economic stressshould be associated with downward income
adjustments. The empirical analysis should tell us which of these conflicting views
most likely.
3. Measuring earnings management
To testif firms exhibitunusualearnings managementbehaviorduring the financial
crisis,we employ standard techniques from the income smoothing and accruals qua
literature. This section presents the research design and the econometric models u
firsttwo metrics capture income smoothing,whereas the lastthree are accrualquality
measures.
Our firstattribute of income smoothing is adapted from Leuz,Nanda,and Wysocki
(2003)and focuses on insiders'reporting choices.Specifically,IS1 is defined as the
standard deviation of cash flow from operations divided by the standard deviation
income.In case of income smoothing,the variability ofearnings (as measured by the
standard deviation ofnet income)should be lessthan the variability ofcash flow.
Following Leuz etal. (2003),2 we thus interprethigh values ofIS1 as evidence that
managers exercise accounting discretion to smooth reported earnings.
The second indicator of income smoothing is also taken from Leuz etal. (2003).It
represents the Spearman correlation between variations in accruals and variations
flow from operations.Because accruals buffer cash flow shocks,the correlation between
changesin accrualsand changesin cash flow should be negative (Dechow,1994).
However,if accruals are manipulated to smooth income,the absolute value oftheir
correlation with cash flowsshould be particularly high.We define accrualsas the
difference between net income and cash flow from operations. As in prior research
Shivakumar, 2005; Barth, Landsman, & Lang, 2008; Lang, Raedy, & Wilson, 2006 ),
interpret a high negative correlation as evidence of earnings smoothing. For consis
presentation and interpretation,the Spearman coefficientwas multiplied by − 1 so that
higher IS2 scores reflect higher level of income smoothing.
Our first accrualquality metric isbased on the modified Jonesmodel.Although
differentmodels have been developed to detectearnings management,the Jones (1991)
model and the modified Jones model developed by Dechow, Sloan, and Sweeney (1
are the mostextensively used in identifying discretionary accruals.The only difference
between them is the inclusion of changes in accounts receivables in the modi fied J
model.In addition,followingKothari,Leone,and Wasley(2005),we includea
performance measure, i.e., return on assets, to control for the impact of firm perfo
on unexpected accruals. We require at least 20 observations in the same industry
2 Leuz et al. (2003) use the ratio of the standard deviation of net income to the standard deviation of c
from operations. For consistency in presenting and interpreting our results, we reverse the ratio so that
mean high levels of income smoothing.
461A. Filip, B. Raffournier / The International Journal of Accounting 49 (2014) 455–478
Paraphrase This Document
Need a fresh take? Get an instant paraphrase of this document with our AI Paraphraser
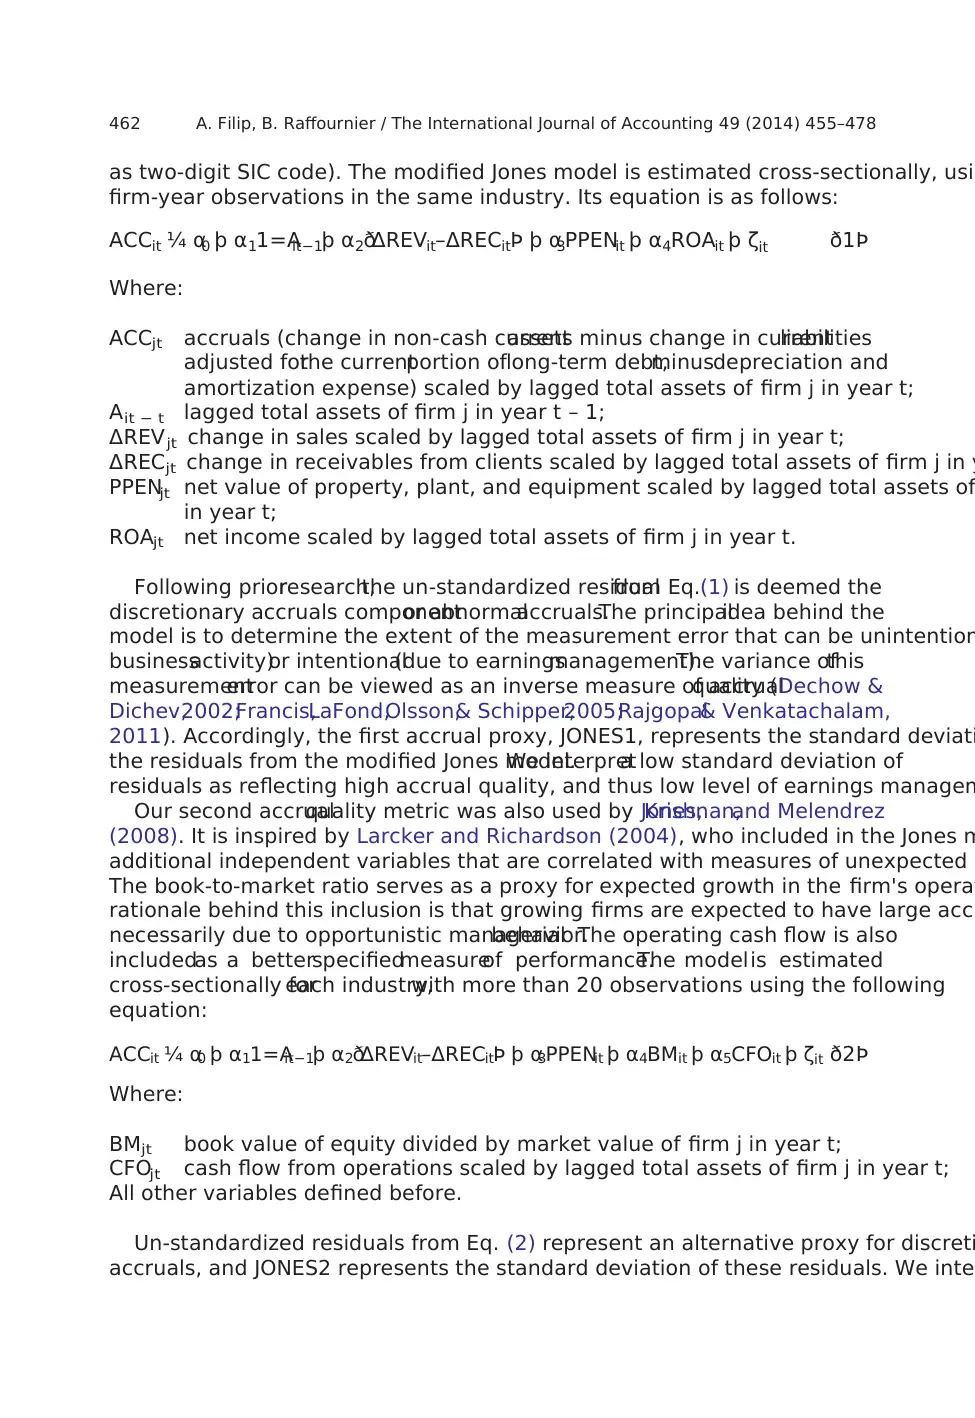
as two-digit SIC code). The modified Jones model is estimated cross-sectionally, usin
firm-year observations in the same industry. Its equation is as follows:
ACCit ¼ α0 þ α11=Ait−1þ α2 ΔREVit–ΔRECitð Þ þ α3PPENit þ α4ROAit þ ζit ð1Þ
Where:
ACCjt accruals (change in non-cash currentassets minus change in currentliabilities
adjusted forthe currentportion oflong-term debt,minusdepreciation and
amortization expense) scaled by lagged total assets of firm j in year t;
A it − t lagged total assets of firm j in year t – 1;
ΔREV jt change in sales scaled by lagged total assets of firm j in year t;
ΔREC jt change in receivables from clients scaled by lagged total assets of firm j in y
PPENjt net value of property, plant, and equipment scaled by lagged total assets of
in year t;
ROAjt net income scaled by lagged total assets of firm j in year t.
Following priorresearch,the un-standardized residualfrom Eq.(1) is deemed the
discretionary accruals componentor abnormalaccruals.The principalidea behind the
model is to determine the extent of the measurement error that can be unintention
businessactivity)or intentional(due to earningsmanagement).The variance ofthis
measurementerror can be viewed as an inverse measure of accrualquality (Dechow &
Dichev,2002;Francis,LaFond,Olsson,& Schipper,2005;Rajgopal& Venkatachalam,
2011). Accordingly, the first accrual proxy, JONES1, represents the standard deviati
the residuals from the modified Jones model.We interpreta low standard deviation of
residuals as reflecting high accrual quality, and thus low level of earnings managem
Our second accrualquality metric was also used by Jones,Krishnan,and Melendrez
(2008). It is inspired by Larcker and Richardson (2004), who included in the Jones m
additional independent variables that are correlated with measures of unexpected a
The book-to-market ratio serves as a proxy for expected growth in the firm's operat
rationale behind this inclusion is that growing firms are expected to have large accr
necessarily due to opportunistic managerialbehavior.The operating cash flow is also
includedas a betterspecifiedmeasureof performance.The modelis estimated
cross-sectionally foreach industry,with more than 20 observations using the following
equation:
ACCit ¼ α0 þ α11=Ait−1þ α2 ΔREVit–ΔRECitð Þ þ α3PPENit þ α4BMit þ α5CFOit þ ζit ð2Þ
Where:
BM jt book value of equity divided by market value of firm j in year t;
CFOjt cash flow from operations scaled by lagged total assets of firm j in year t;
All other variables defined before.
Un-standardized residuals from Eq. (2) represent an alternative proxy for discreti
accruals, and JONES2 represents the standard deviation of these residuals. We inte
462 A. Filip, B. Raffournier / The International Journal of Accounting 49 (2014) 455–478
low standard deviation of residuals as reflecting high accrual quality, and thus low
earnings management.
The last accrual quality metric is based on the cross-sectional Dechow and Dich
model, as modified by McNichols (2002) and Francis et al. (2005). Some recent stu
Chen, Hope, Li, & Wang, 2011; Core, Guay, & Verdi, 2008; Jones et al., 2008; Kim &
2010) apply this modelto assess accruals as a measure of earnings quality,arguing that
accruals are temporary adjustments made to better measure firm performance. Fr
(2005) argue that the Dechow and Dichev (2002) approach is superior to the modi
(1991)model'sidentification ofabnormalaccrualsbecause ofa more directlink to
information risk. The intuition behind this model is that accrual quality may be de fi
extent to which accruals map into cash flow realizations. We estimate the following
each industry with more than 20 observations as follows:
ACCit ¼ α0 þ α1CFOit−1þ α2CFOit þ α3CFOitþ1 þ α4 ΔREVit–ΔRECitð Þ
þ α5PPENit þ ζit ð3Þ
Where: All variables defined before.
The residuals from Eq. (3) represent the estimation errors in the current accrual
notassociated with operating cash flows and thatcannotbe explained by the change in
revenue orthe levelof property,plant,and equipment.Our metric DD represents the
standard deviation of these residuals. We interpret a low value of DD as evidence o
accrualquality.In all variations ofthese proxies,a low value indicates high accruals
quality and thus a low level of earnings management.
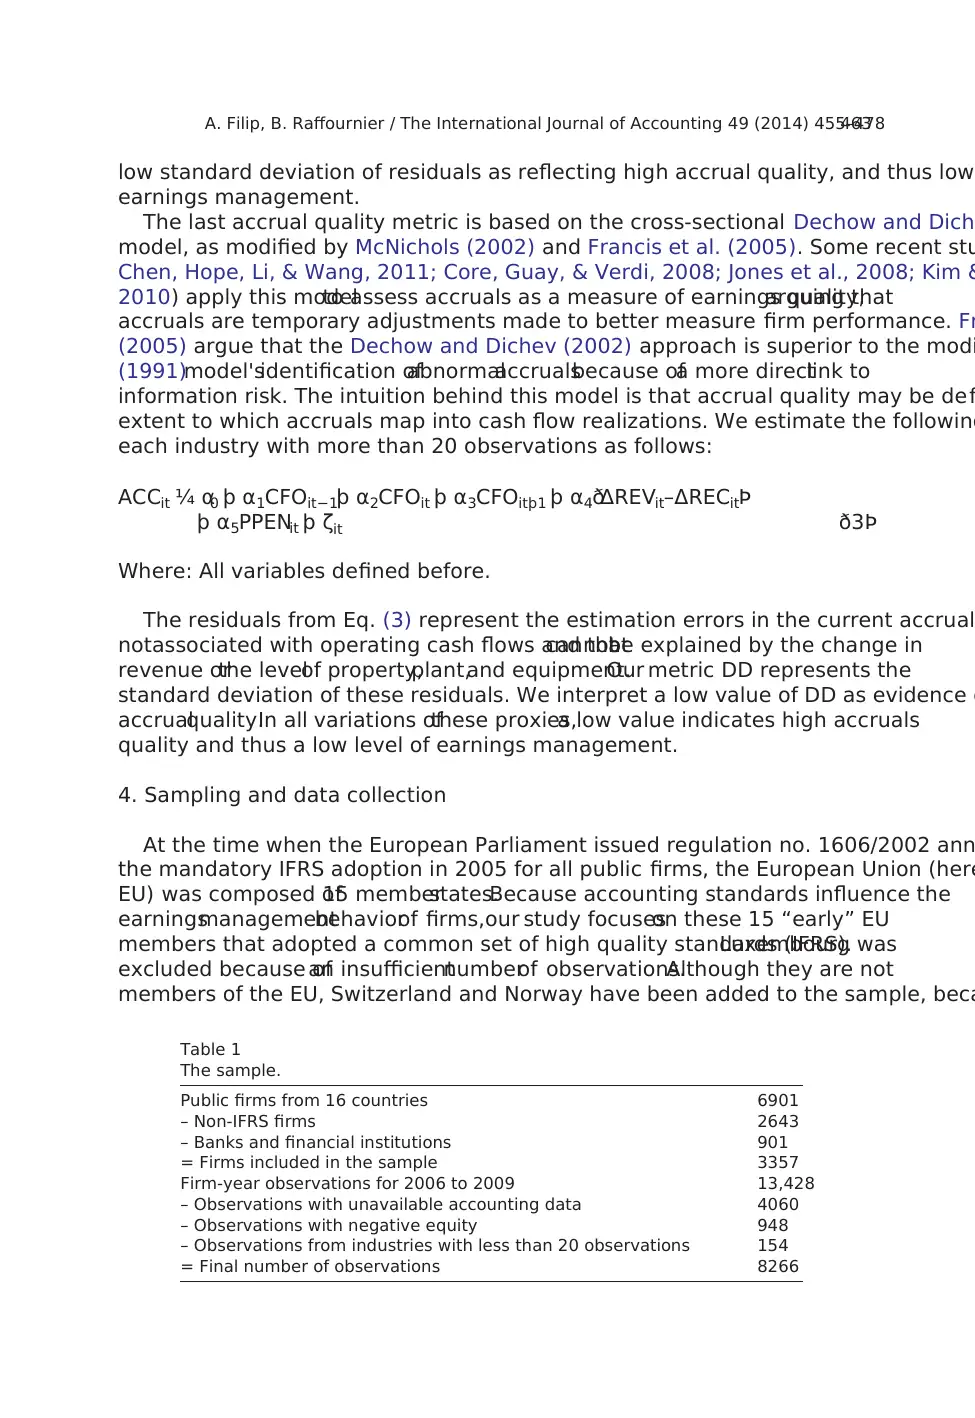
4. Sampling and data collection
At the time when the European Parliament issued regulation no. 1606/2002 ann
the mandatory IFRS adoption in 2005 for all public firms, the European Union (here
EU) was composed of15 memberstates.Because accounting standards influence the
earningsmanagementbehaviorof firms,our study focuseson these 15 “early” EU
members that adopted a common set of high quality standards (IFRS).Luxembourg was
excluded because ofan insufficientnumberof observations.Although they are not
members of the EU, Switzerland and Norway have been added to the sample, beca
Table 1
The sample.
Public firms from 16 countries 6901
– Non-IFRS firms 2643
– Banks and financial institutions 901
= Firms included in the sample 3357
Firm-year observations for 2006 to 2009 13,428
– Observations with unavailable accounting data 4060
– Observations with negative equity 948
– Observations from industries with less than 20 observations 154
= Final number of observations 8266
463A. Filip, B. Raffournier / The International Journal of Accounting 49 (2014) 455–478
earnings management.
The last accrual quality metric is based on the cross-sectional Dechow and Dich
model, as modified by McNichols (2002) and Francis et al. (2005). Some recent stu
Chen, Hope, Li, & Wang, 2011; Core, Guay, & Verdi, 2008; Jones et al., 2008; Kim &
2010) apply this modelto assess accruals as a measure of earnings quality,arguing that
accruals are temporary adjustments made to better measure firm performance. Fr
(2005) argue that the Dechow and Dichev (2002) approach is superior to the modi
(1991)model'sidentification ofabnormalaccrualsbecause ofa more directlink to
information risk. The intuition behind this model is that accrual quality may be de fi
extent to which accruals map into cash flow realizations. We estimate the following
each industry with more than 20 observations as follows:
ACCit ¼ α0 þ α1CFOit−1þ α2CFOit þ α3CFOitþ1 þ α4 ΔREVit–ΔRECitð Þ
þ α5PPENit þ ζit ð3Þ
Where: All variables defined before.
The residuals from Eq. (3) represent the estimation errors in the current accrual
notassociated with operating cash flows and thatcannotbe explained by the change in
revenue orthe levelof property,plant,and equipment.Our metric DD represents the
standard deviation of these residuals. We interpret a low value of DD as evidence o
accrualquality.In all variations ofthese proxies,a low value indicates high accruals
quality and thus a low level of earnings management.
4. Sampling and data collection
At the time when the European Parliament issued regulation no. 1606/2002 ann
the mandatory IFRS adoption in 2005 for all public firms, the European Union (here
EU) was composed of15 memberstates.Because accounting standards influence the
earningsmanagementbehaviorof firms,our study focuseson these 15 “early” EU
members that adopted a common set of high quality standards (IFRS).Luxembourg was
excluded because ofan insufficientnumberof observations.Although they are not
members of the EU, Switzerland and Norway have been added to the sample, beca
Table 1
The sample.
Public firms from 16 countries 6901
– Non-IFRS firms 2643
– Banks and financial institutions 901
= Firms included in the sample 3357
Firm-year observations for 2006 to 2009 13,428
– Observations with unavailable accounting data 4060
– Observations with negative equity 948
– Observations from industries with less than 20 observations 154
= Final number of observations 8266
463A. Filip, B. Raffournier / The International Journal of Accounting 49 (2014) 455–478
⊘ This is a preview!⊘
Do you want full access?
Subscribe today to unlock all pages.
Trusted by 1+ million students worldwide
also issued regulations requiring the use of IFRS by all listed companies. This leads
sample of6901 firms coming from 16 countries with data available on Worldscope.
Table 1 describes the sampling and data collection process.
To avoid ambiguity,2643 firmsfollowing accounting standardsotherthan IFRS
(mainly US orlocalGAAP) during the period 2005 to 2010 were dropped from the
sample.3 Although mostEuropean banks and financialinstitutions apply IFRS,they are
also subject to specific reporting regulations. Moreover, the empirical models that c
earnings managementbehavior have been developed for commercialor industrialfirms
and, as such, are not appropriate for the financial industry. Banks and financial inst
were thus excluded from the sample.
Accounting data were collected for the four-year period 2006–2009. According to
Cazavan-Jeny, Jeanjean, and Weiss (2011), managers may use discretion allowed un
(which regulates first-time adoption of IFRS) to increase earnings management. As
first IFRS reporting period for most companies, this year was not included in the ana
assure comparability across our differentmetrics of financialreporting quality,we required
available financialstatements data for allour variables.Data were notavailable for 4060
firm-year observations,and another 948 observations were dropped from the sample du
negative equity. Finally, we required at least 20 observations for each industry (two
code). Our final sample consists therefore of 8266 firm-year observations.
Our income-smoothing metrics (IS1 and IS2) are computed by pooling all observa
of a particular year or time period.Our measures of accrualquality (JONES1,JONES2,
and DD) are obtained in two steps.First,we compute discretionary accruals with each
modelby pooling allobservations from allcountries and years within the same 2-digit
industry SIC code. These discretionary accruals are then grouped by year or time pe
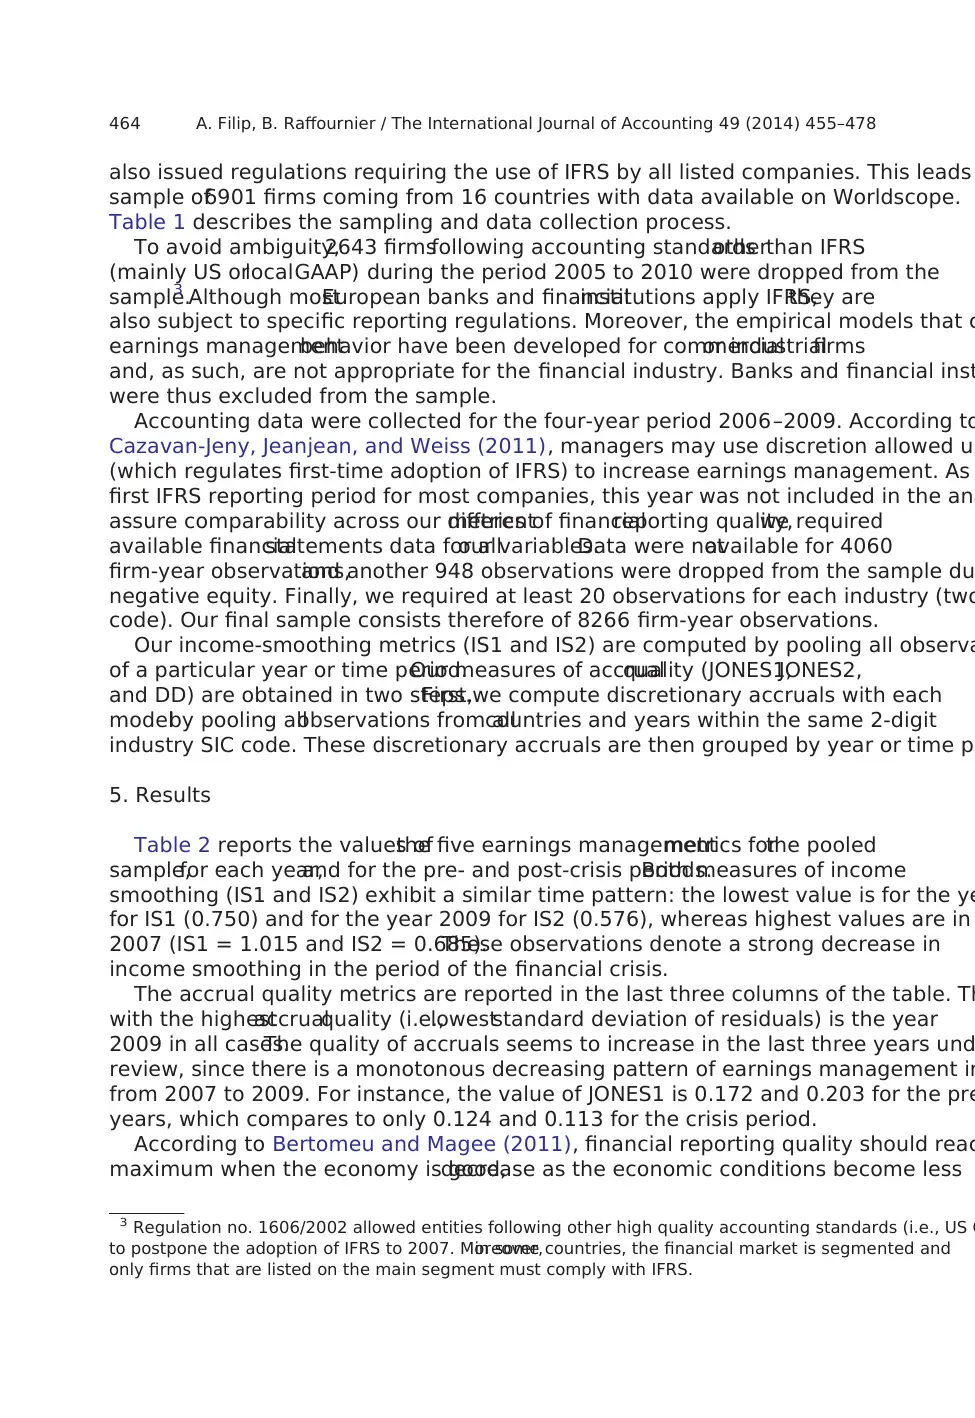
5. Results
Table 2 reports the values ofthe five earnings managementmetrics forthe pooled
sample,for each year,and for the pre- and post-crisis periods.Both measures of income
smoothing (IS1 and IS2) exhibit a similar time pattern: the lowest value is for the ye
for IS1 (0.750) and for the year 2009 for IS2 (0.576), whereas highest values are in
2007 (IS1 = 1.015 and IS2 = 0.685).These observations denote a strong decrease in
income smoothing in the period of the financial crisis.
The accrual quality metrics are reported in the last three columns of the table. Th
with the highestaccrualquality (i.e.,loweststandard deviation of residuals) is the year
2009 in all cases.The quality of accruals seems to increase in the last three years und
review, since there is a monotonous decreasing pattern of earnings management in
from 2007 to 2009. For instance, the value of JONES1 is 0.172 and 0.203 for the pre
years, which compares to only 0.124 and 0.113 for the crisis period.
According to Bertomeu and Magee (2011), financial reporting quality should reac
maximum when the economy is good,decrease as the economic conditions become less
3 Regulation no. 1606/2002 allowed entities following other high quality accounting standards (i.e., US G
to postpone the adoption of IFRS to 2007. Moreover,in some countries, the financial market is segmented and
only firms that are listed on the main segment must comply with IFRS.
464 A. Filip, B. Raffournier / The International Journal of Accounting 49 (2014) 455–478
sample of6901 firms coming from 16 countries with data available on Worldscope.
Table 1 describes the sampling and data collection process.
To avoid ambiguity,2643 firmsfollowing accounting standardsotherthan IFRS
(mainly US orlocalGAAP) during the period 2005 to 2010 were dropped from the
sample.3 Although mostEuropean banks and financialinstitutions apply IFRS,they are
also subject to specific reporting regulations. Moreover, the empirical models that c
earnings managementbehavior have been developed for commercialor industrialfirms
and, as such, are not appropriate for the financial industry. Banks and financial inst
were thus excluded from the sample.
Accounting data were collected for the four-year period 2006–2009. According to
Cazavan-Jeny, Jeanjean, and Weiss (2011), managers may use discretion allowed un
(which regulates first-time adoption of IFRS) to increase earnings management. As
first IFRS reporting period for most companies, this year was not included in the ana
assure comparability across our differentmetrics of financialreporting quality,we required
available financialstatements data for allour variables.Data were notavailable for 4060
firm-year observations,and another 948 observations were dropped from the sample du
negative equity. Finally, we required at least 20 observations for each industry (two
code). Our final sample consists therefore of 8266 firm-year observations.
Our income-smoothing metrics (IS1 and IS2) are computed by pooling all observa
of a particular year or time period.Our measures of accrualquality (JONES1,JONES2,
and DD) are obtained in two steps.First,we compute discretionary accruals with each
modelby pooling allobservations from allcountries and years within the same 2-digit
industry SIC code. These discretionary accruals are then grouped by year or time pe
5. Results
Table 2 reports the values ofthe five earnings managementmetrics forthe pooled
sample,for each year,and for the pre- and post-crisis periods.Both measures of income
smoothing (IS1 and IS2) exhibit a similar time pattern: the lowest value is for the ye
for IS1 (0.750) and for the year 2009 for IS2 (0.576), whereas highest values are in
2007 (IS1 = 1.015 and IS2 = 0.685).These observations denote a strong decrease in
income smoothing in the period of the financial crisis.
The accrual quality metrics are reported in the last three columns of the table. Th
with the highestaccrualquality (i.e.,loweststandard deviation of residuals) is the year
2009 in all cases.The quality of accruals seems to increase in the last three years und
review, since there is a monotonous decreasing pattern of earnings management in
from 2007 to 2009. For instance, the value of JONES1 is 0.172 and 0.203 for the pre
years, which compares to only 0.124 and 0.113 for the crisis period.
According to Bertomeu and Magee (2011), financial reporting quality should reac
maximum when the economy is good,decrease as the economic conditions become less
3 Regulation no. 1606/2002 allowed entities following other high quality accounting standards (i.e., US G
to postpone the adoption of IFRS to 2007. Moreover,in some countries, the financial market is segmented and
only firms that are listed on the main segment must comply with IFRS.
464 A. Filip, B. Raffournier / The International Journal of Accounting 49 (2014) 455–478
Paraphrase This Document
Need a fresh take? Get an instant paraphrase of this document with our AI Paraphraser
favorable,and increase again ifthe economy becomes recessionary.Our results seem
consistent with this conjecture.
This intuition is confirmed by the comparison of the average values of indicators
pre-crisis(2006–2007)and the crisisperiod (2008–2009).All earningsmanagement
metrics experience a sharp decrease in the crisis years. Indicators of income-smoo
and IS2 dropped from 0.981 to 0.810 and 0.678 to 0.600 respectively. Similarly, th
of accrual quality measures fell from 0.189 to 0.119 (JONES1), 0.176 to 0.115 (JON
and 0.169 to 0.111 (DD).
The significance of these differences was tested using a bootstrapping procedur
randomly chooses a sample of100 firms-yearobservations with replacementfrom a
period.We computed our attributes of earnings management and repeated the proc
10,000 times. We next performed an independent-samples t-test. All differences b
the two sub-periods are statistically significant at usual levels, which is consistent
conjecture that firms engage less in earnings management during crisis periods.
The impact of the financial crisis on the earnings management behavior of firms
influenced by the management's incentives to manipulate earnings upwards or do
Therefore we separate the sample in positive and negative discretionary accruals.
Table 2
Earnings management metrics by period.
Year N Income smoothing Accrual quality
IS1 IS2 JONES1 JONES2 DD
Pool 8266 0.894 0.625 0.156 0.147 0.143
2006 1897 0.942 0.668 0.172 0.166 0.159
2007 2041 1.015 0.685 0.203 0.186 0.177
2008 2146 0.750 0.628 0.124 0.118 0.116
2009 2182 0.946 0.576 0.113 0.112 0.106
2006–2007 3938 0.981 0.678 0.189 0.176 0.169
2008–2009 4328 0.810 0.600 0.119 0.115 0.111
Difference 0.171***
(21.36)
0.078***
(66.95)
0.070***
(86.36)
0.061***
(88.17)
0.057***
(90.28)
IS1 is the ratio of the standard deviation of CFOjt to the standard deviation of NIjt; IS2 is the Spearman correlation
between variations in accruals (defined as the difference between net income and cash flow from opera
lagged assets and variations in CFOjt, multiplied by minus one; JONES1 is the standard deviation of the residuals
the modified Jones model:ACCjt = α0 + α11/Ajt − 1+ α2(ΔREVjt − ΔRECjt) + α3PPENjt + α4ROAjt + εjt (1);
JONES2 is the standard deviation ofthe residuals from the modified Jones model:ACCjt = α0 + α11/Ajt − 1+
α2(ΔREVjt − ΔRECjt) + α3PPENjt + α4BMjt + α5CFOjt + εjt (2); DD is the standard deviation of the residuals from
the modified Dechow and Dichev model:ACCjt = α0 + α1CFOjt − 1+ α2CFOjt + α3CFOjt + 1+ α4(ΔREVjt −
ΔRECjt) + α5PPENjt + εjt (3).
Where ACCjt = accruals (change in non-cash current assets minus change in current liabilities adjusted fo
current portion of long-term debt minus depreciation and amortization expense) scaled by lagged total
firm j in year t; Ajt − 1= lagged total assets of firm j in year t − 1; ΔREVjt = change in sales scaled by lagged total
assets of firm j in year t; ΔRECjt = change in receivables from clients scaled by lagged total assets of firm j in
t; PPENjt = netvalue of the property,plantand equipmentscaled by lagged totalassets of firm jin year t;
ROAjt = net income scaled by lagged total assets of firm j in year t; BMjt = book-to-market ratio of firm j in year
t; CFOjt = operating cash flow of firm j in year t scaled by lagged total assets; NIjt = net income of firm j in year t
scaled by lagged total assets.
*, **, *** indicate statistical significance at 0.10, 0.05, and 0.01 respectively; t-statistics into brackets.
465A. Filip, B. Raffournier / The International Journal of Accounting 49 (2014) 455–478
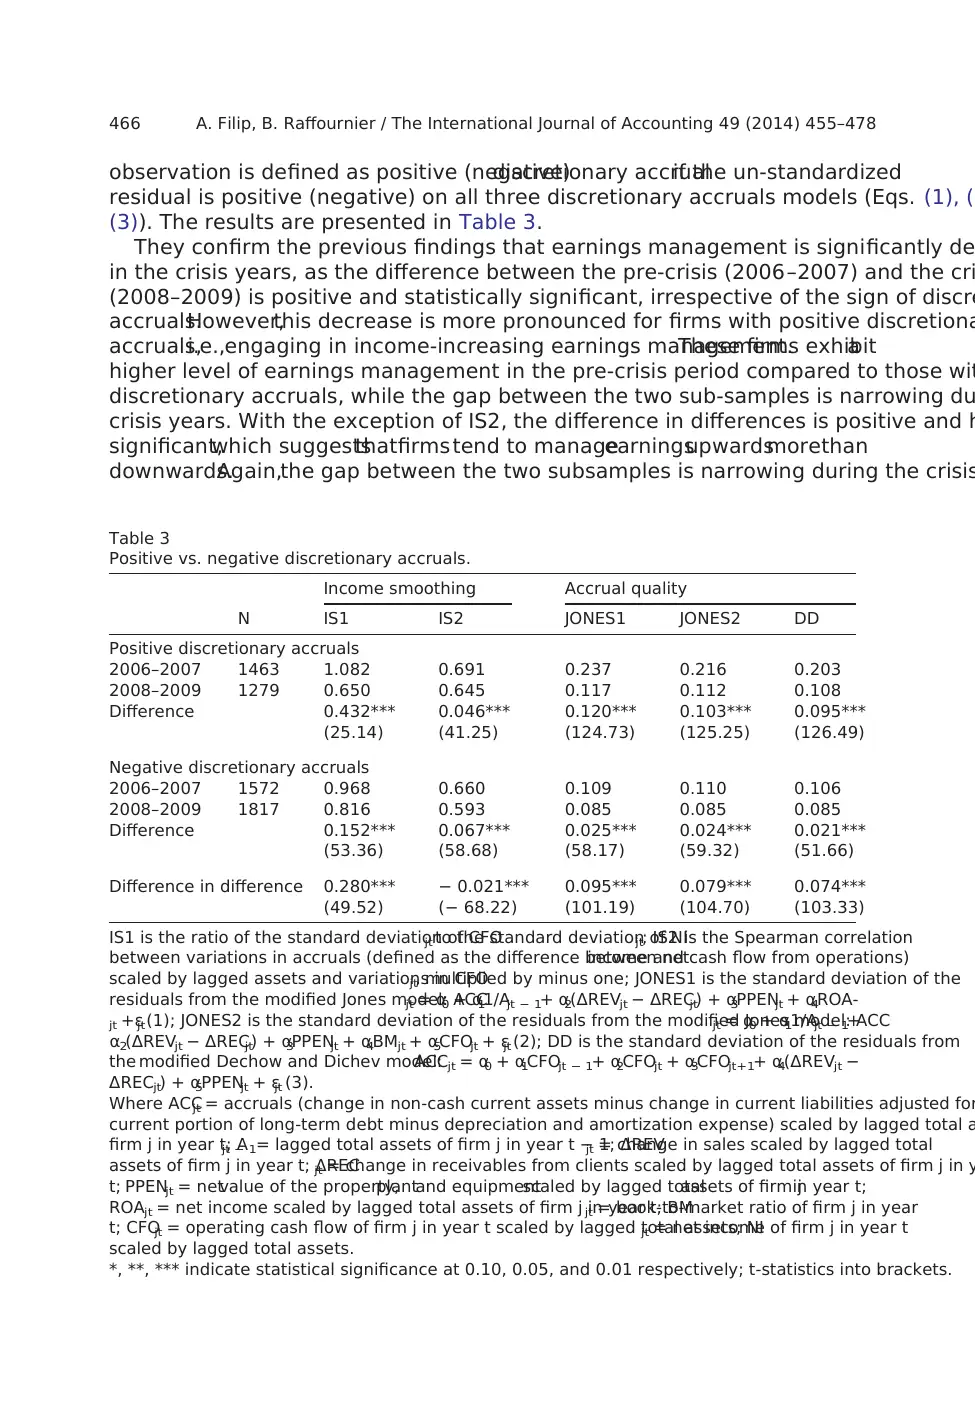
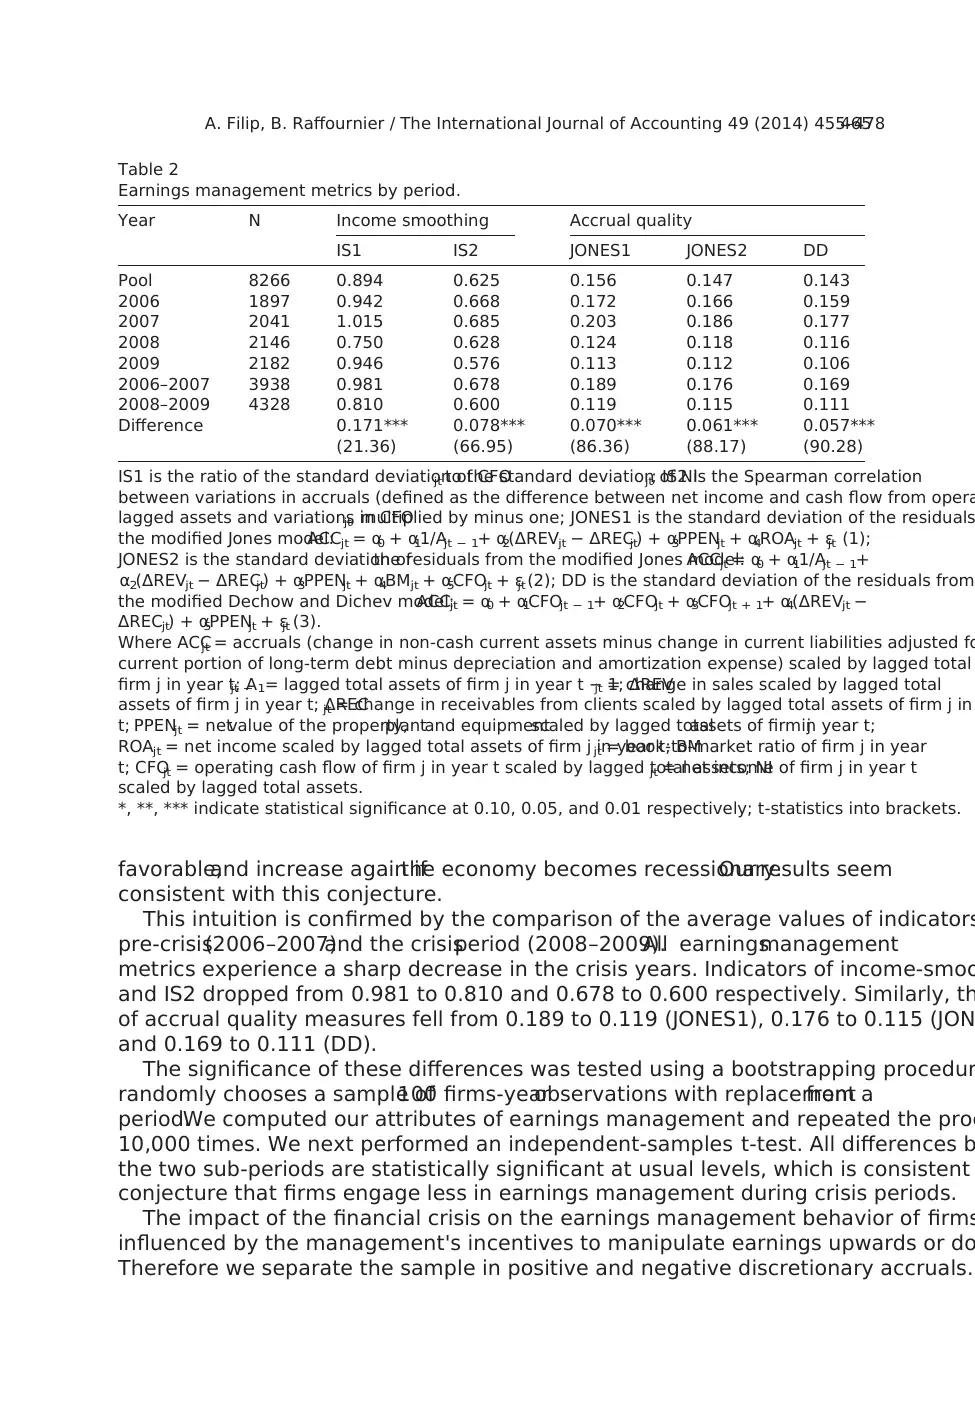
observation is defined as positive (negative)discretionary accrualif the un-standardized
residual is positive (negative) on all three discretionary accruals models (Eqs. (1), (2
(3)). The results are presented in Table 3.
They confirm the previous findings that earnings management is significantly de
in the crisis years, as the difference between the pre-crisis (2006–2007) and the cri
(2008–2009) is positive and statistically significant, irrespective of the sign of discre
accruals.However,this decrease is more pronounced for firms with positive discretiona
accruals,i.e.,engaging in income-increasing earnings management.These firms exhibita
higher level of earnings management in the pre-crisis period compared to those wit
discretionary accruals, while the gap between the two sub-samples is narrowing du
crisis years. With the exception of IS2, the difference in differences is positive and h
significant,which suggeststhatfirms tend to manageearningsupwardsmorethan
downwards.Again,the gap between the two subsamples is narrowing during the crisis
Table 3
Positive vs. negative discretionary accruals.
Income smoothing Accrual quality
N IS1 IS2 JONES1 JONES2 DD
Positive discretionary accruals
2006–2007 1463 1.082 0.691 0.237 0.216 0.203
2008–2009 1279 0.650 0.645 0.117 0.112 0.108
Difference 0.432***
(25.14)
0.046***
(41.25)
0.120***
(124.73)
0.103***
(125.25)
0.095***
(126.49)
Negative discretionary accruals
2006–2007 1572 0.968 0.660 0.109 0.110 0.106
2008–2009 1817 0.816 0.593 0.085 0.085 0.085
Difference 0.152***
(53.36)
0.067***
(58.68)
0.025***
(58.17)
0.024***
(59.32)
0.021***
(51.66)
Difference in difference 0.280***
(49.52)
− 0.021***
(− 68.22)
0.095***
(101.19)
0.079***
(104.70)
0.074***
(103.33)
IS1 is the ratio of the standard deviation of CFOjt to the standard deviation of NIjt; IS2 is the Spearman correlation
between variations in accruals (defined as the difference between netincome and cash flow from operations)
scaled by lagged assets and variations in CFOjt, multiplied by minus one; JONES1 is the standard deviation of the
residuals from the modified Jones model: ACCjt = α0 + α11/Ajt − 1+ α2(ΔREVjt − ΔRECjt) + α3PPENjt + α4ROA-
jt +εjt(1); JONES2 is the standard deviation of the residuals from the modified Jones model: ACCjt = α0 + α11/Ajt − 1+
α2(ΔREVjt − ΔRECjt) + α3PPENjt + α4BMjt + α5CFOjt + εjt (2); DD is the standard deviation of the residuals from
the modified Dechow and Dichev model:ACCjt = α0 + α1CFOjt − 1+ α2CFOjt + α3CFOjt+1+ α4(ΔREVjt −
ΔRECjt) + α5PPENjt + εjt (3).
Where ACCjt = accruals (change in non-cash current assets minus change in current liabilities adjusted for
current portion of long-term debt minus depreciation and amortization expense) scaled by lagged total a
firm j in year t; Ajt − 1= lagged total assets of firm j in year t − 1; ΔREVjt = change in sales scaled by lagged total
assets of firm j in year t; ΔRECjt = change in receivables from clients scaled by lagged total assets of firm j in y
t; PPENjt = netvalue of the property,plantand equipmentscaled by lagged totalassets of firm jin year t;
ROAjt = net income scaled by lagged total assets of firm j in year t; BMjt = book-to-market ratio of firm j in year
t; CFOjt = operating cash flow of firm j in year t scaled by lagged total assets; NIjt = net income of firm j in year t
scaled by lagged total assets.
*, **, *** indicate statistical significance at 0.10, 0.05, and 0.01 respectively; t-statistics into brackets.
466 A. Filip, B. Raffournier / The International Journal of Accounting 49 (2014) 455–478
⊘ This is a preview!⊘
Do you want full access?
Subscribe today to unlock all pages.
Trusted by 1+ million students worldwide
1 out of 24
Your All-in-One AI-Powered Toolkit for Academic Success.
+13062052269
info@desklib.com
Available 24*7 on WhatsApp / Email
![[object Object]](/_next/static/media/star-bottom.7253800d.svg)
Unlock your academic potential
Copyright © 2020–2026 A2Z Services. All Rights Reserved. Developed and managed by ZUCOL.