Money and Banking: Impacts of the Financial Crisis on US Economy
VerifiedAdded on 2020/07/22
|16
|3872
|239
Essay
AI Summary
This essay delves into the complexities of the US banking and monetary system, emphasizing the influence of banking authorities, particularly the Federal Bank, in shaping economic outcomes during financial crises. The analysis examines the interplay of various economic indicators such as GDP rates and inflation, to understand the impact of monetary circulation and investment trends. The essay explores the causes and consequences of the global financial crisis, including the role of sub-prime mortgages and their negative effects on governmental reserves and small businesses. It further analyzes the impact of financial crises on consumer confidence, governmental debt, and economic growth, highlighting the need for effective governmental policies. The essay uses a table of quarterly data from 2000-2008 to demonstrate the relationship between various economic factors such as PCECTPI_PC1, GDPC1, GDPPOT, inflation, and the Federal Fund Rate (FFR). The analysis concludes by emphasizing the importance of proactive economic and monetary policies to mitigate the negative impacts of financial crises and maintain economic stability.

MONEY AND BANKING
Paraphrase This Document
Need a fresh take? Get an instant paraphrase of this document with our AI Paraphraser

TABLE OF CONTENTS
ESSAY.............................................................................................................................................1
REFERENCES..............................................................................................................................13
ESSAY.............................................................................................................................................1
REFERENCES..............................................................................................................................13
ESSAY
To ascertain the banking and monetary system in various nations there has been main
influence of banking authorities to bring the recession and financial crisis. Moreover, in the
present study there will be discussion based on Federal bank in US and the banking policies
implied by them. Moreover, there has been adequate analysis through various operation such as
GDP rates, Inflation etc. Thus, in order to improve the financial conditions there are various filed
which are needed to be improved by the government (Travis, Harris and Larson, 2017). There
has been various impacts of such as huge level of monetary circulation in the market. Consumers
were having interest in investing the money over long term investment plans as the loans and
interest rates were comparatively lower. The banks allowed lower rates as they wanted to meet
the challenges and competition in the market. The impacts as well as influences of financial
crisis were direct and indirect over such economies.
As per analysing the GDP rates during the period 2000 to 2017 there has been huge
variations. Thus, during the crisis there has been downfall of economy which are impacted over
the rise in the prices of commodities (Aaronson and et.al., 2018). Moreover, the main reason
behind the crisis was excessive sub-prime mortgage has been facilitated in the market with lower
returns. Thus, it has negatively impacted over the governmental reserves (Ruhl and Willis,
2017). Banks become bankrupt as there were no money left. It also affecting the increment of
rises of commodities which has bound the consumers in not making expenses which results in
demolish of huge numbers of small businesses (Bernanke, banking crashes and recessions,
2013). Therefore, to analyse the GDP and inflation impacts over the rate of return of banking
sector the below listed table will be helpful in analysing the impacts of financial crisis.
Moreover, in relation with analysing the impacts of Global financial crisis there has been huge
negative fall of the GDP rate of the country. Thus, due to such impacts over economy as it
affects the small scale businesses. Thus, it has effected over reduction in the economic growth
and the circulation of money in the market. There has been reduction in the consumer confidence
index numbers which emphasis over the negative trade practices (Delis, Hasan and Mylonidis,
2017). The governmental policies to overcome with the impacts of GFC in the nation there can
be reduction in the operational activities. Thus, at the time of great depression there has been
increment in the mortgage level. Moreover, people started taking loan and making investments
into the real estate and properties which were having the negative impacts over the increment in
1
⊘ This is a preview!⊘
Do you want full access?
Subscribe today to unlock all pages.
Trusted by 1+ million students worldwide
the level of loans and mortgaged were grant to the consumers. There has been various impacts of
such as huge level of monetary circulation in the market. Consumers were having interest in
investing the money over long term investment plans as the loans and interest rates were
comparatively lower. The banks allowed lower rates as they wanted to meet the challenges and
competition in the market, Thus, due to lower interest rates there will be less collection of money
and at the time of global financial crisis impacts over the national economy, there is no money
left with the banks (Buyl, Boone and Wade, 2017). There has been huge reduction in the
governmental reserves and funds which has eventually lowers down the revenue of citizens.
There has been negative impacts over the growth of economy. Thus, the per capita GDP has the
negative outcomes which indicates that during such period the small or medium size
organisations has negative impacts of the global financial crisis (Laux and Rauter, 2017). This in
turn reduces the economic level as well as living standard of the people.
It has been observed here that the speculative boom was extended due to derivatives in
the global financial crisis which was not in at the time of great depression. The impacts of great
depression was originated from United state there has been major fall in the stock value of
various industries. Therefore, During such a phase there has been reduction in the prices of the
share values of the firm which indicates the downfall of the economy (Bai, Krishnamurthy and
Weymuller, 2018). There are various entities which were bankrupt and have no capital amount to
operate their business activities. Moreover, it has affected the banks with not money to grant
them from better operations in the time. Similarly, the global financial crisis has impacted over
the nation as per the poor banking policies of the government. To meet the competition the
private and public sector of financial authorities has facilitated the loans in the market at lower
returns which indicates economic crisis (Irani and Meisenzahl, 2017). During such period there
are various issues arises such as inflation, fall of GDP rates, unemployment, fall in national
income as well as economic rates. The liquidity and current ability of nations has been
challenged through such variations in the economy.
The banks in United States has started making the excessive Sub prime loans to the
consumers at very lower rate of return. Thus, the motive of these financial institution is to have
better efficiency as to meet the challenges in the market. It has impacted over various economies
such as developing and developed (Aaronson and et.al., 2018). The impacts as well as influences
of financial crisis were direct and indirect. Moreover, due to such regards many of the small
2
Paraphrase This Document
Need a fresh take? Get an instant paraphrase of this document with our AI Paraphraser
business has demolished as there are no money left wit the bank which will be helpful to them as
per growth and operations. Thus, such impacts in bringing the unemployment in the national
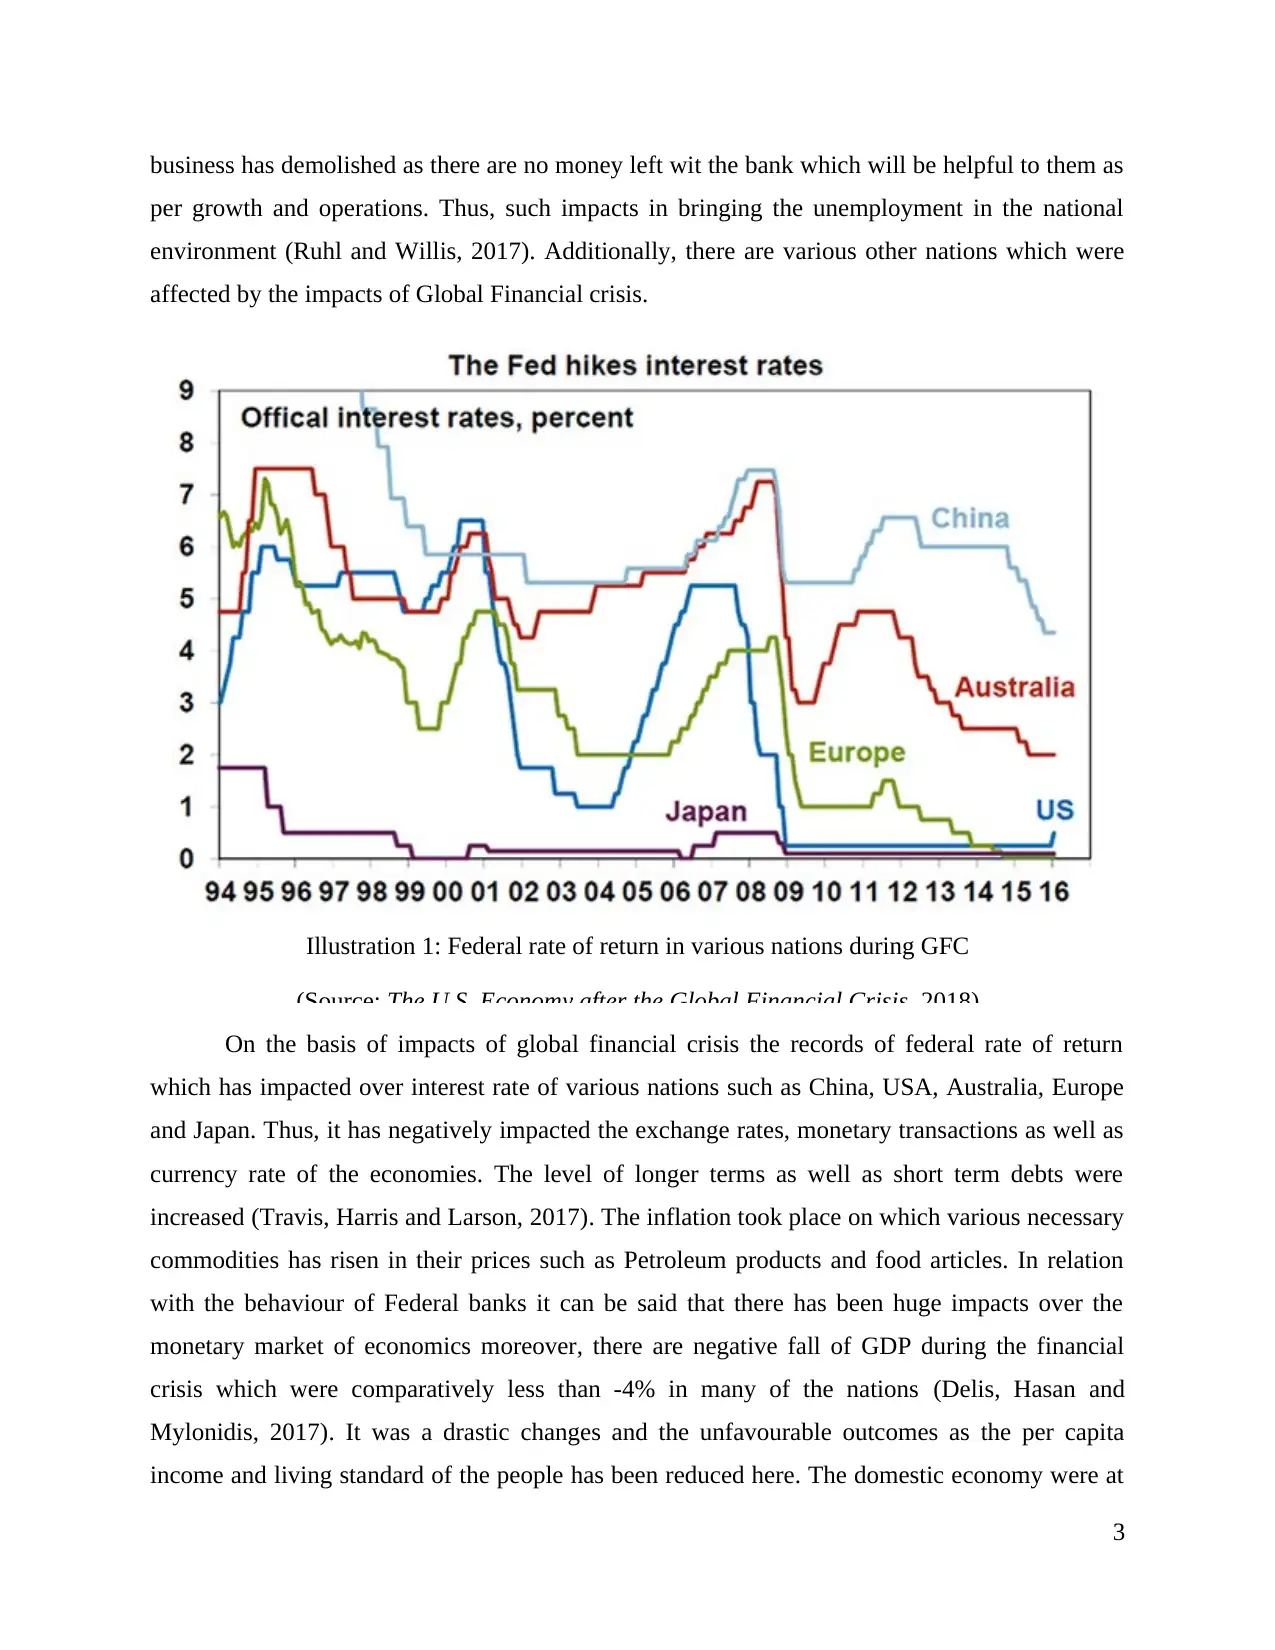
environment (Ruhl and Willis, 2017). Additionally, there are various other nations which were
affected by the impacts of Global Financial crisis.
Illustration 1: Federal rate of return in various nations during GFC
(Source: The U.S. Economy after the Global Financial Crisis, 2018)
On the basis of impacts of global financial crisis the records of federal rate of return
which has impacted over interest rate of various nations such as China, USA, Australia, Europe
and Japan. Thus, it has negatively impacted the exchange rates, monetary transactions as well as
currency rate of the economies. The level of longer terms as well as short term debts were
increased (Travis, Harris and Larson, 2017). The inflation took place on which various necessary
commodities has risen in their prices such as Petroleum products and food articles. In relation
with the behaviour of Federal banks it can be said that there has been huge impacts over the
monetary market of economics moreover, there are negative fall of GDP during the financial
crisis which were comparatively less than -4% in many of the nations (Delis, Hasan and
Mylonidis, 2017). It was a drastic changes and the unfavourable outcomes as the per capita
income and living standard of the people has been reduced here. The domestic economy were at
3
per growth and operations. Thus, such impacts in bringing the unemployment in the national
environment (Ruhl and Willis, 2017). Additionally, there are various other nations which were
affected by the impacts of Global Financial crisis.
Illustration 1: Federal rate of return in various nations during GFC
(Source: The U.S. Economy after the Global Financial Crisis, 2018)
On the basis of impacts of global financial crisis the records of federal rate of return
which has impacted over interest rate of various nations such as China, USA, Australia, Europe
and Japan. Thus, it has negatively impacted the exchange rates, monetary transactions as well as
currency rate of the economies. The level of longer terms as well as short term debts were
increased (Travis, Harris and Larson, 2017). The inflation took place on which various necessary
commodities has risen in their prices such as Petroleum products and food articles. In relation
with the behaviour of Federal banks it can be said that there has been huge impacts over the
monetary market of economics moreover, there are negative fall of GDP during the financial
crisis which were comparatively less than -4% in many of the nations (Delis, Hasan and
Mylonidis, 2017). It was a drastic changes and the unfavourable outcomes as the per capita
income and living standard of the people has been reduced here. The domestic economy were at
3
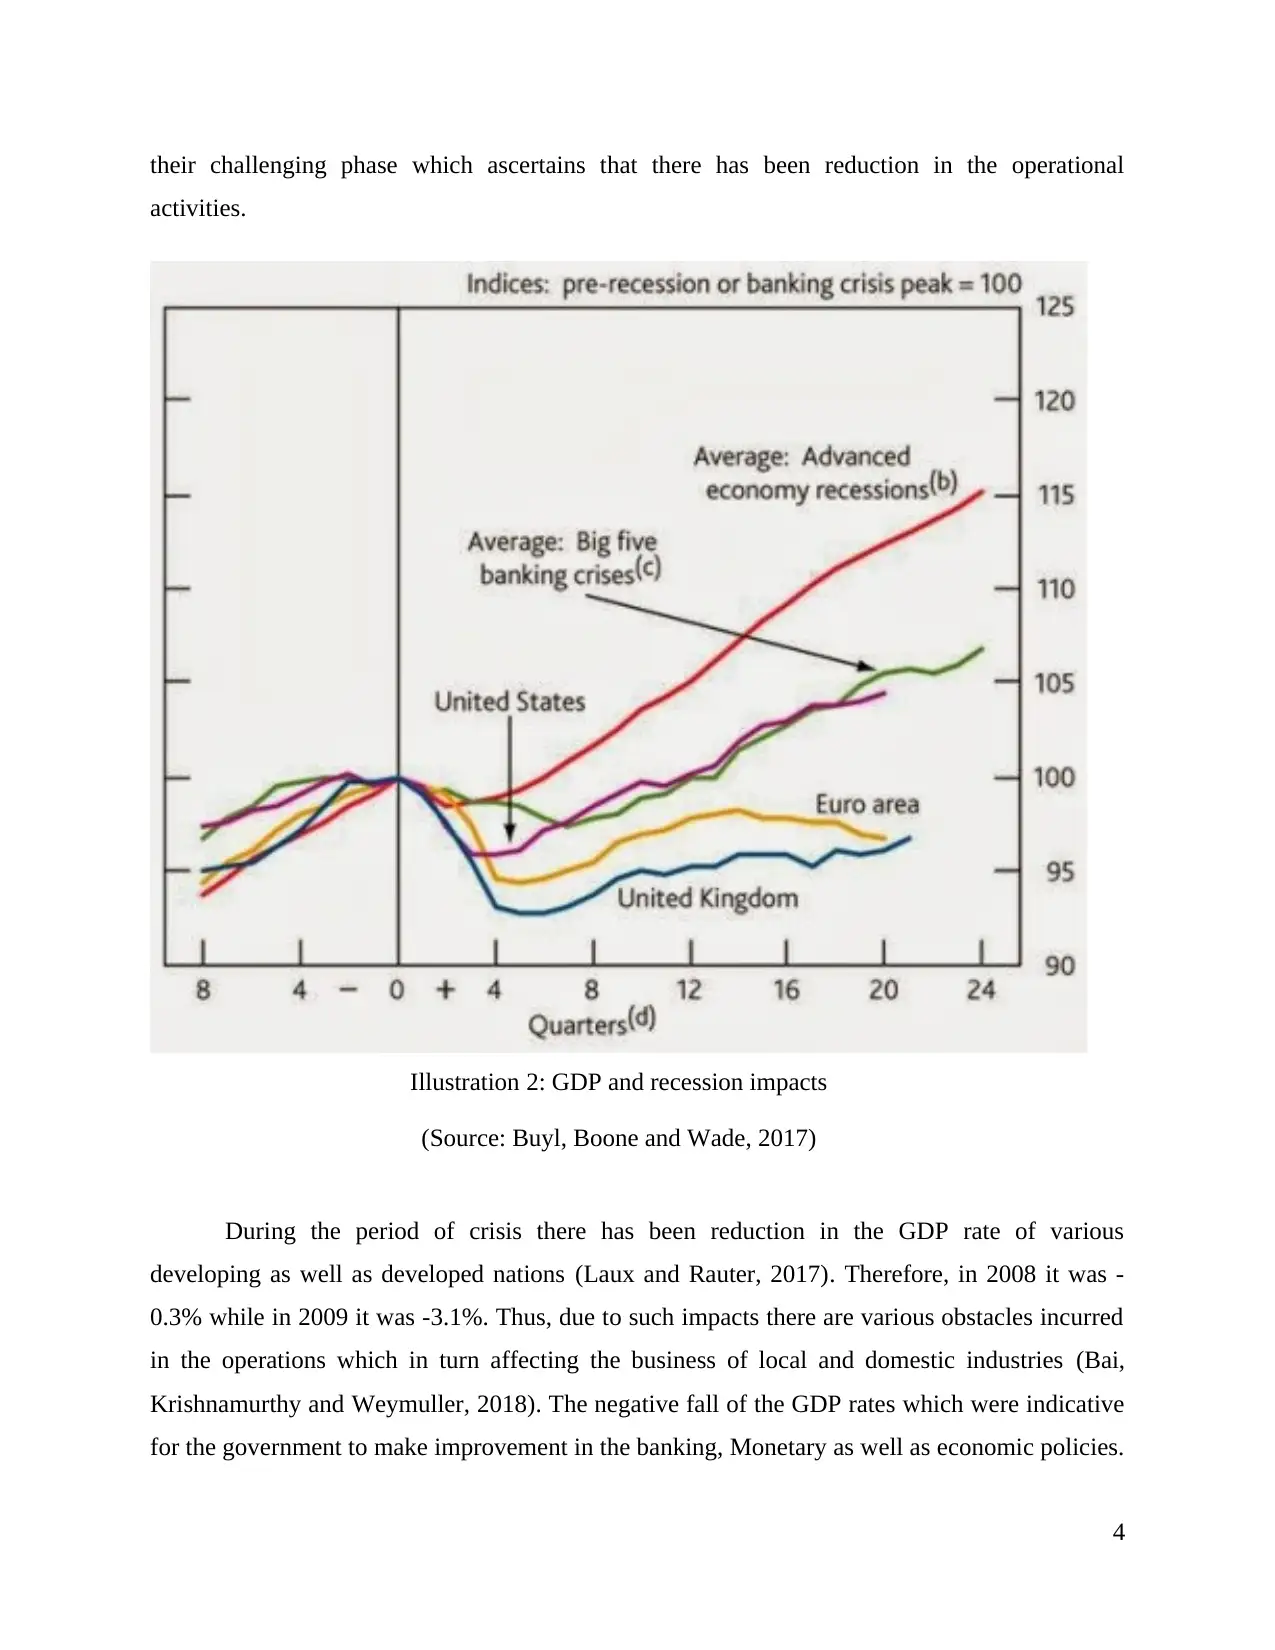
their challenging phase which ascertains that there has been reduction in the operational
activities.
Illustration 2: GDP and recession impacts
(Source: Buyl, Boone and Wade, 2017)
During the period of crisis there has been reduction in the GDP rate of various
developing as well as developed nations (Laux and Rauter, 2017). Therefore, in 2008 it was -
0.3% while in 2009 it was -3.1%. Thus, due to such impacts there are various obstacles incurred
in the operations which in turn affecting the business of local and domestic industries (Bai,
Krishnamurthy and Weymuller, 2018). The negative fall of the GDP rates which were indicative
for the government to make improvement in the banking, Monetary as well as economic policies.
4
⊘ This is a preview!⊘
Do you want full access?
Subscribe today to unlock all pages.
Trusted by 1+ million students worldwide
The level of imports were higher than compared to the exports. It has incurred due to no micro
level of economic policies were effective to build the economic standard of the citizens (Irani
and Meisenzahl, 2017). Later on it took time in again stabilised at GDP for the period of 2010 to
13 which was 1.95%. Thus, the rate was not that adequate appropriate as there is need to have
appropriate changes in the governmental policies to improve the financial environment of nations
(Aaronson and et.al., 2018). The impacts of global financial crisis has made reduction in the
economic viability as well as improper management of the financial activities in the economy.
The invitation of the inflation has incurred the big monetary losses to the government as well as
to the small scale enterprises (Travis, Harris and Larson, 2017). Due to impacts of the global
financial crisis there has been negative impacts over the consumer confidence level. Thus, it
impacts over their buying behaviour as the rise in the prices took place due to inflation which
impacts consumers to save their money.
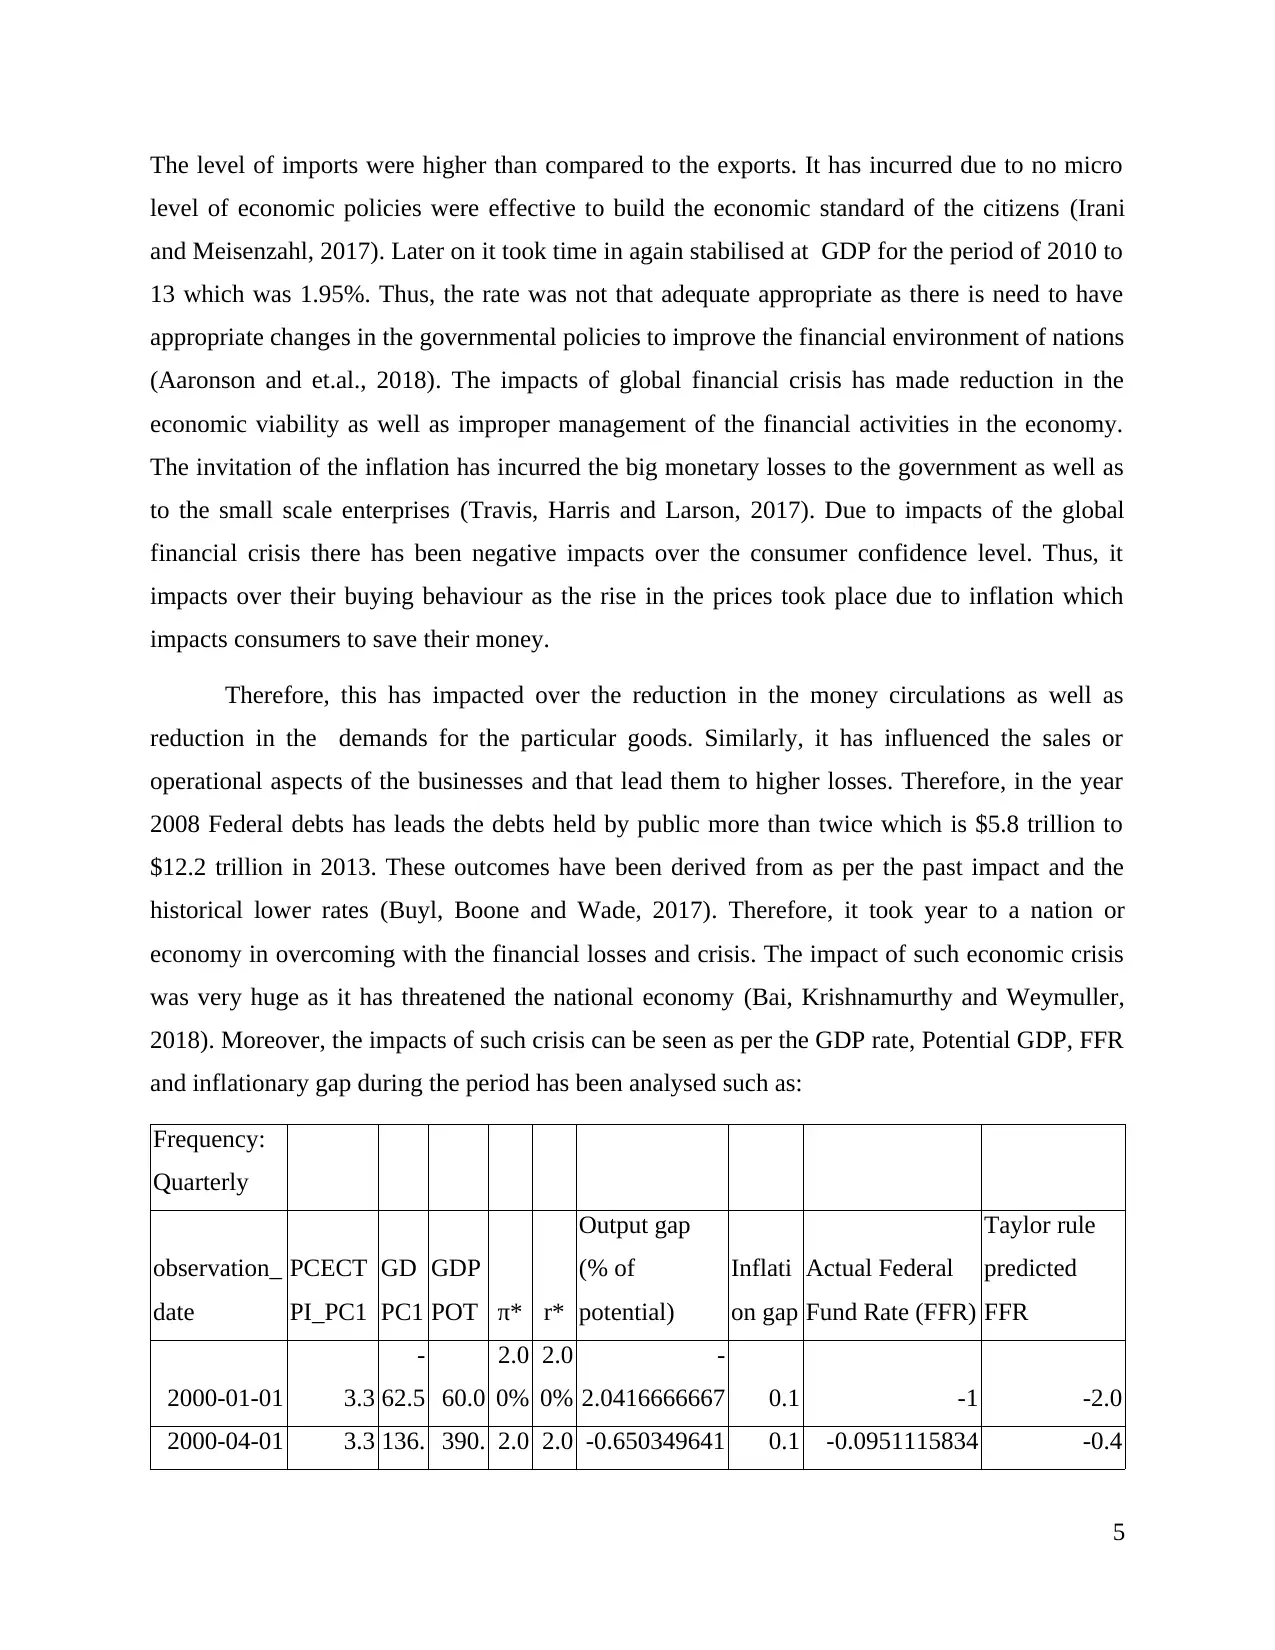
Therefore, this has impacted over the reduction in the money circulations as well as
reduction in the demands for the particular goods. Similarly, it has influenced the sales or
operational aspects of the businesses and that lead them to higher losses. Therefore, in the year
2008 Federal debts has leads the debts held by public more than twice which is $5.8 trillion to
$12.2 trillion in 2013. These outcomes have been derived from as per the past impact and the
historical lower rates (Buyl, Boone and Wade, 2017). Therefore, it took year to a nation or
economy in overcoming with the financial losses and crisis. The impact of such economic crisis
was very huge as it has threatened the national economy (Bai, Krishnamurthy and Weymuller,
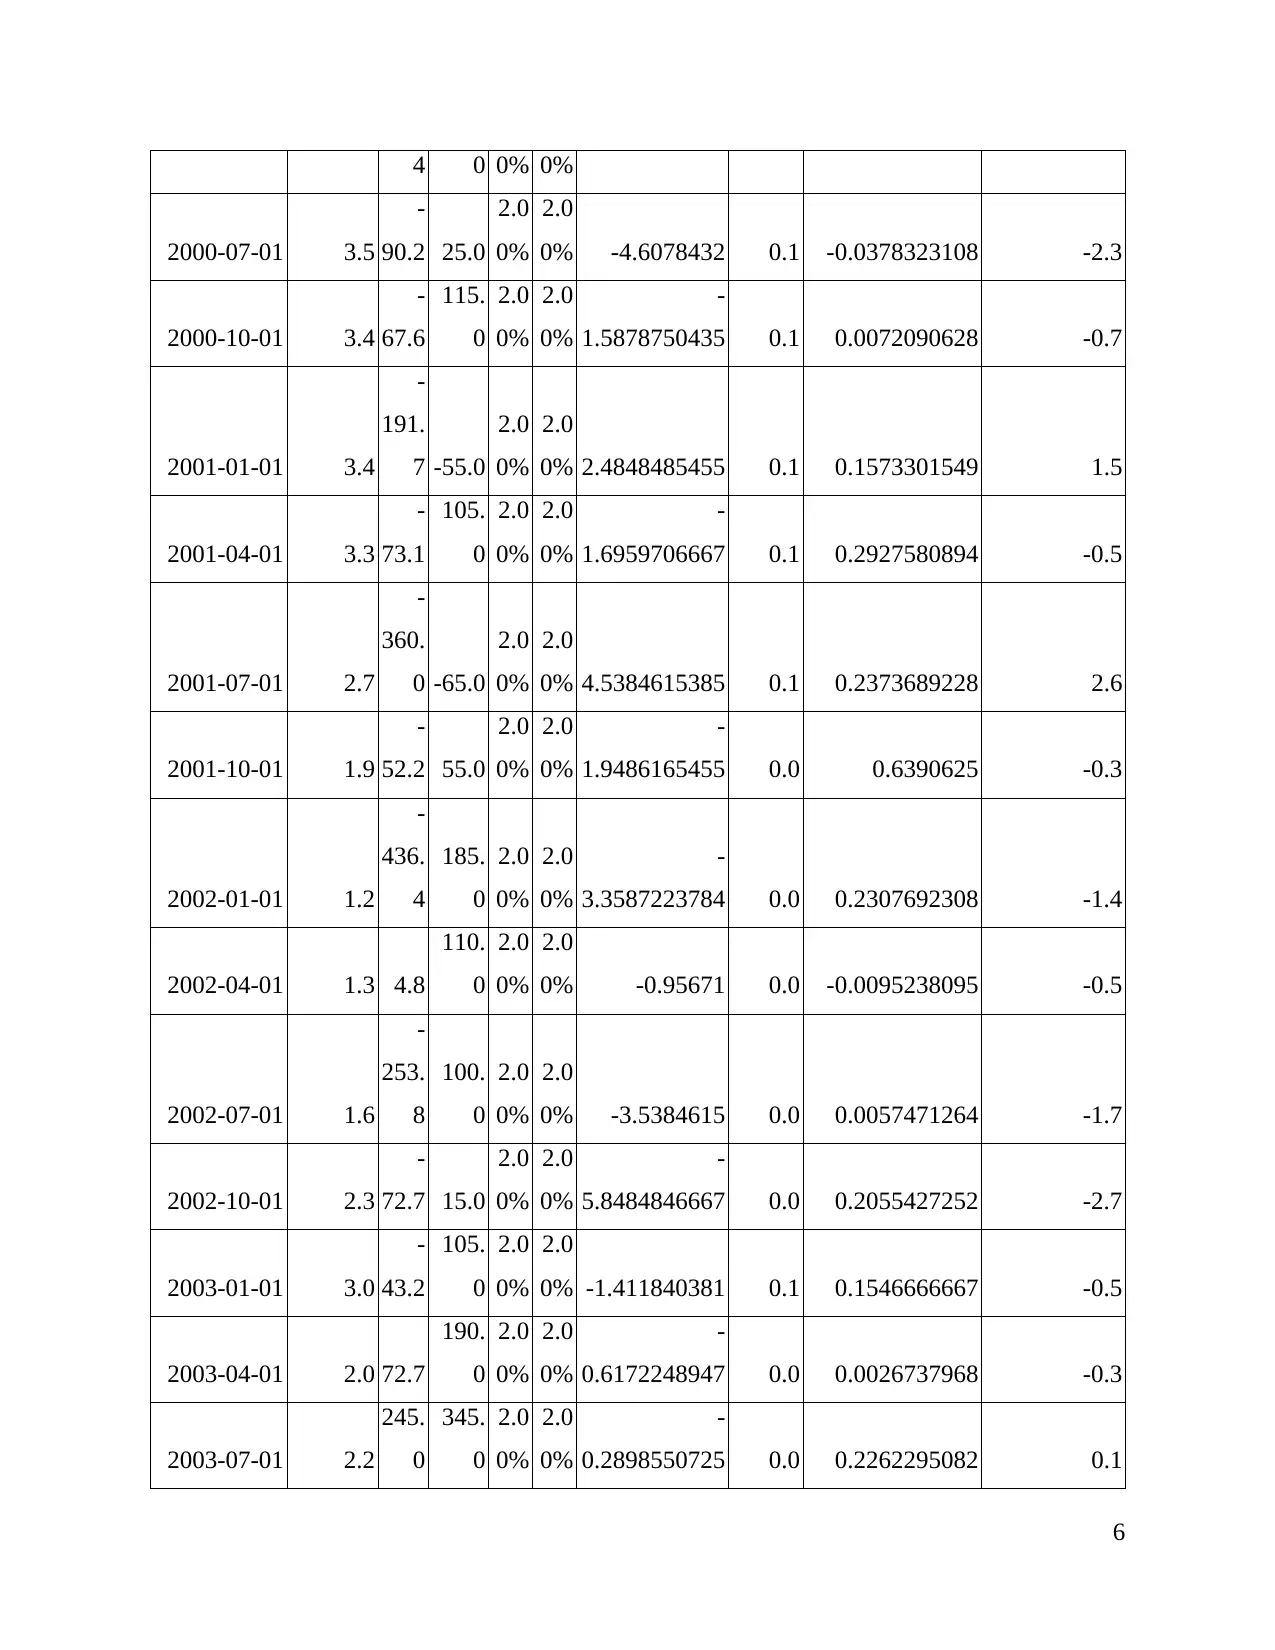
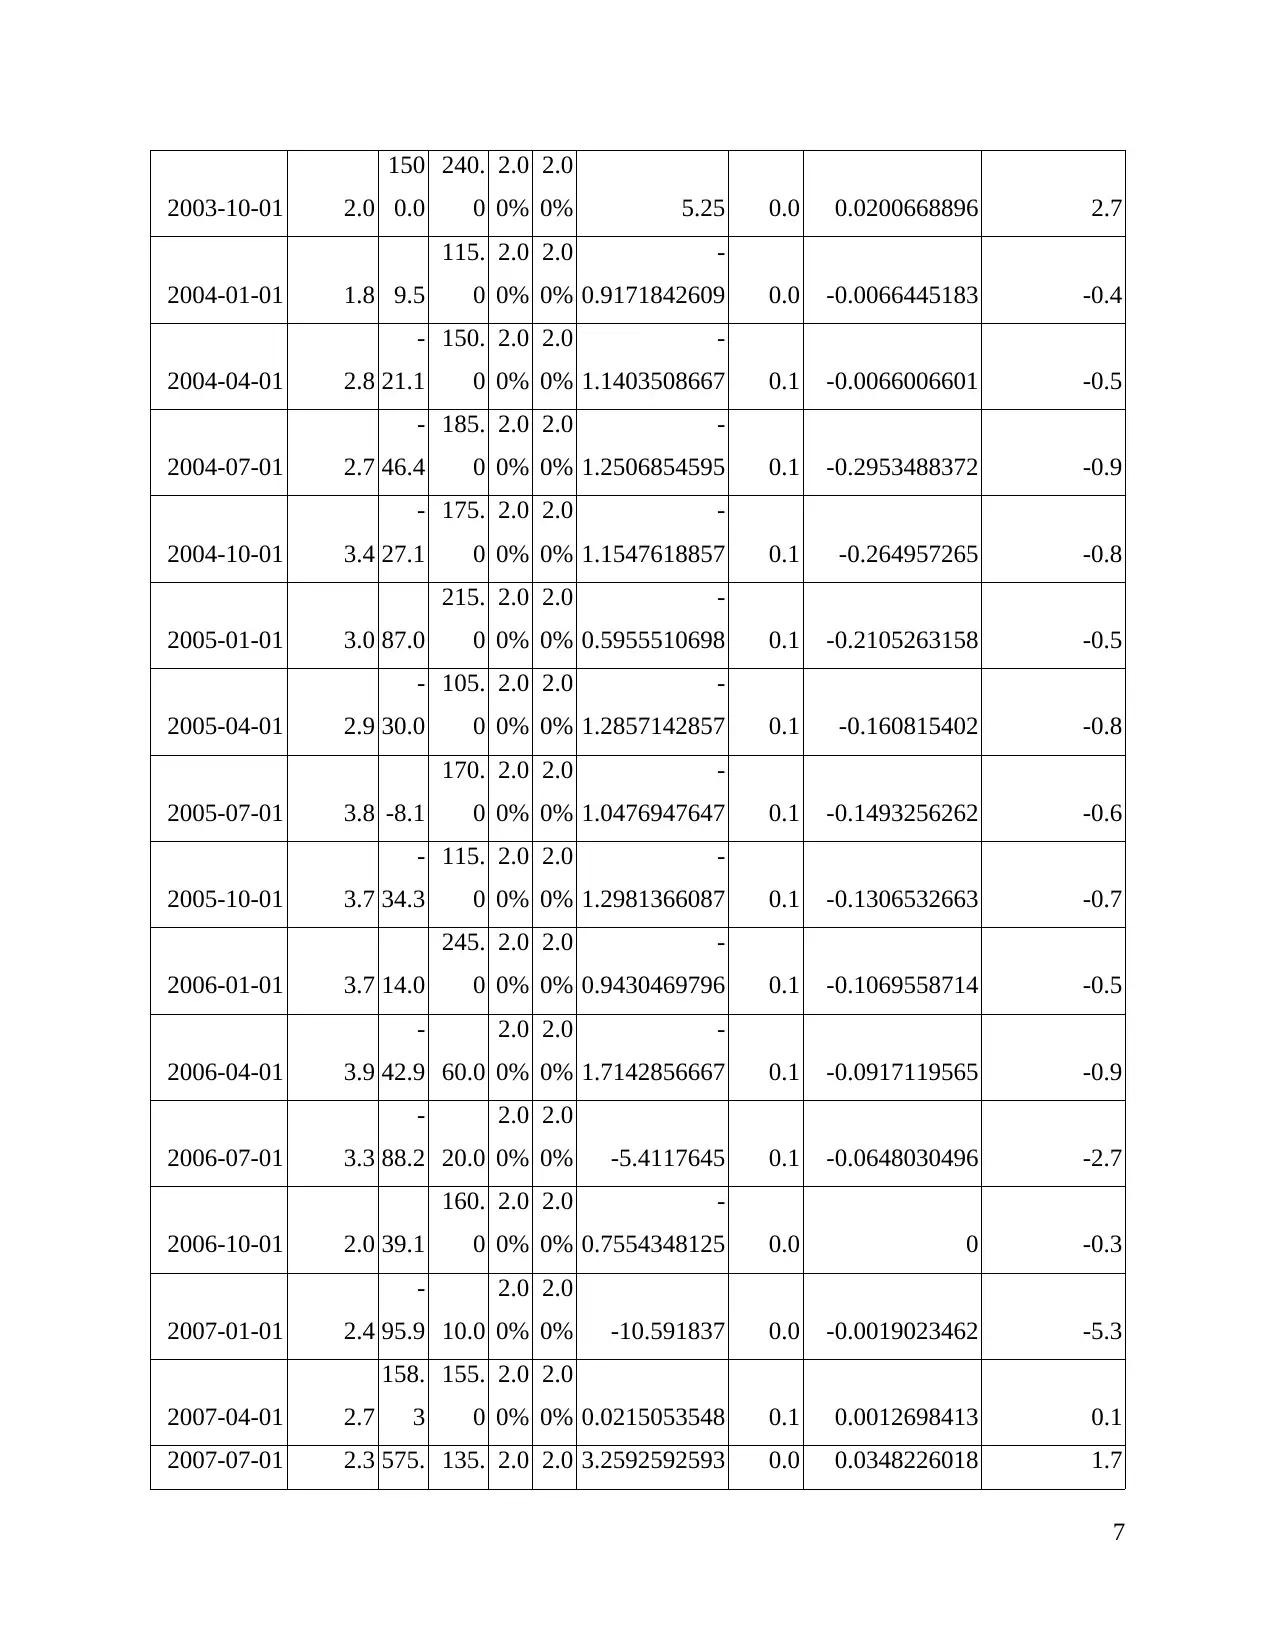
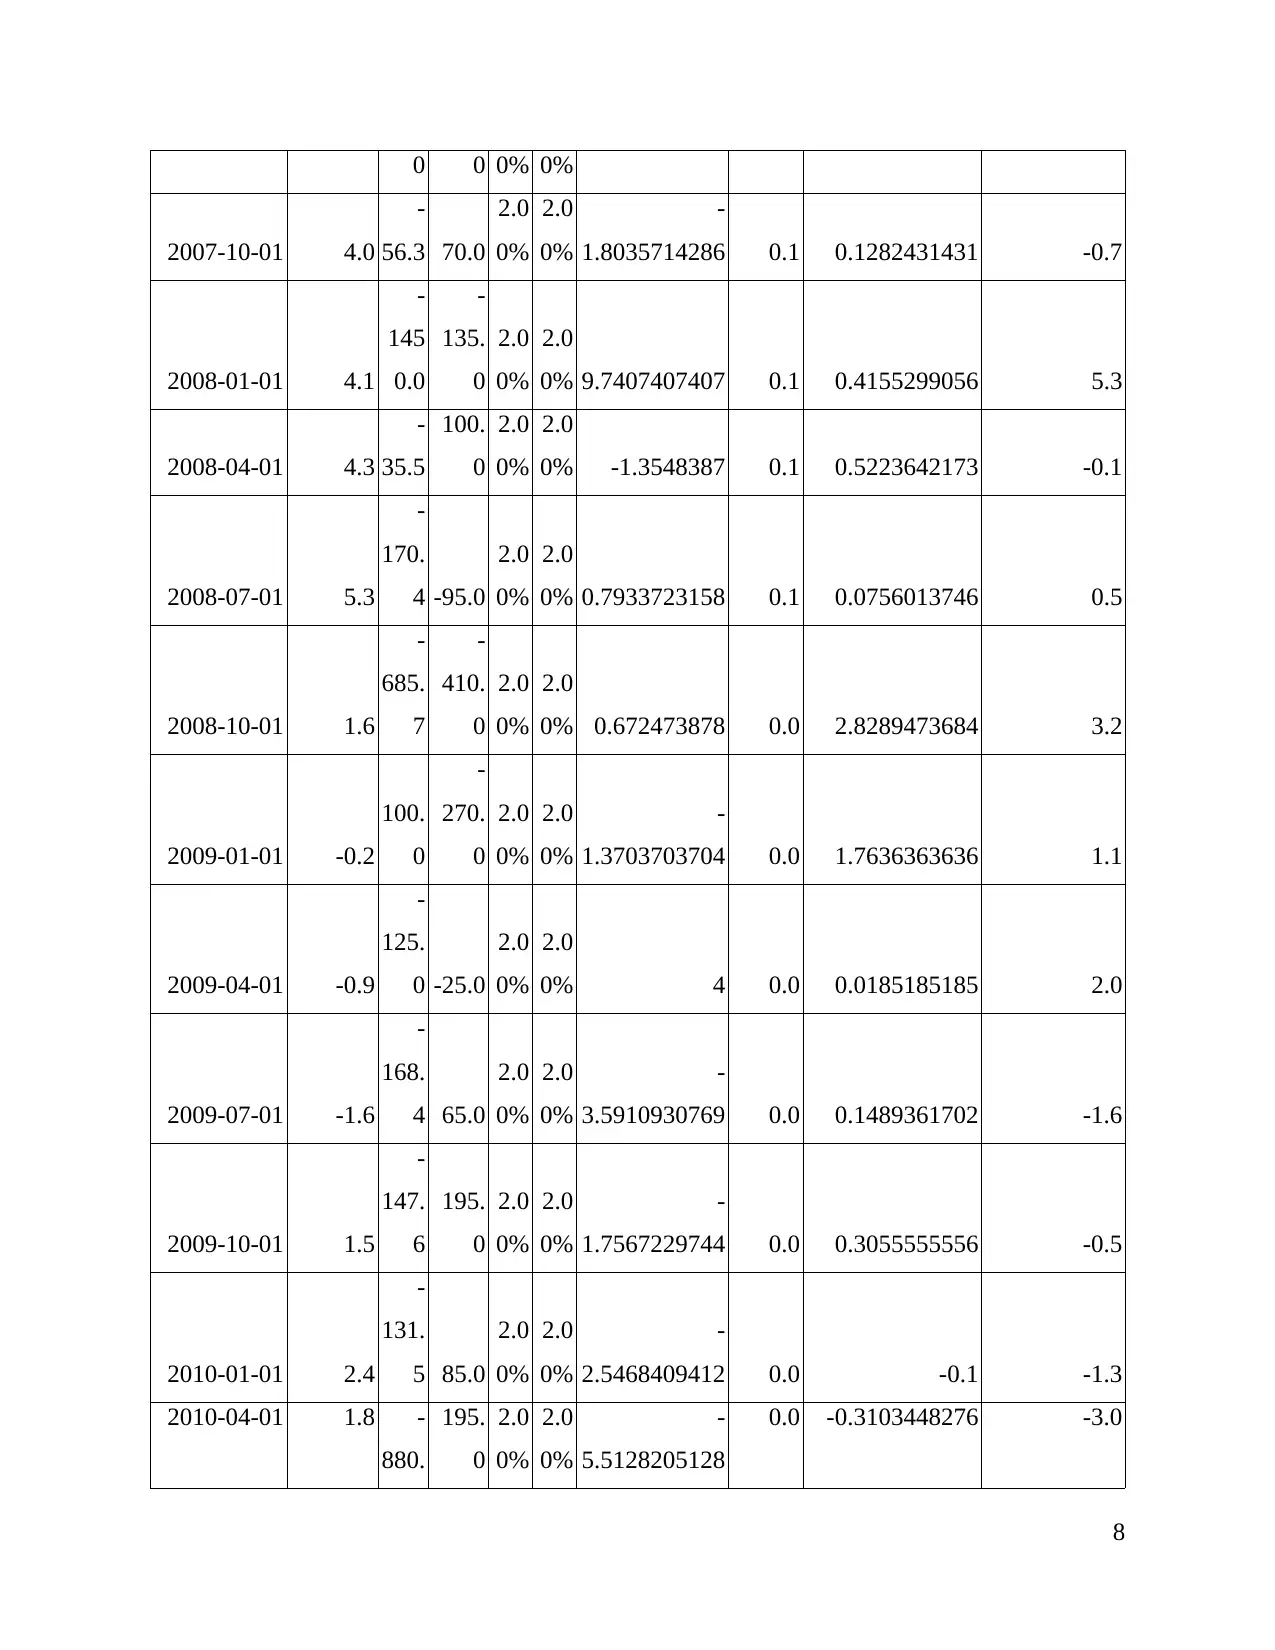
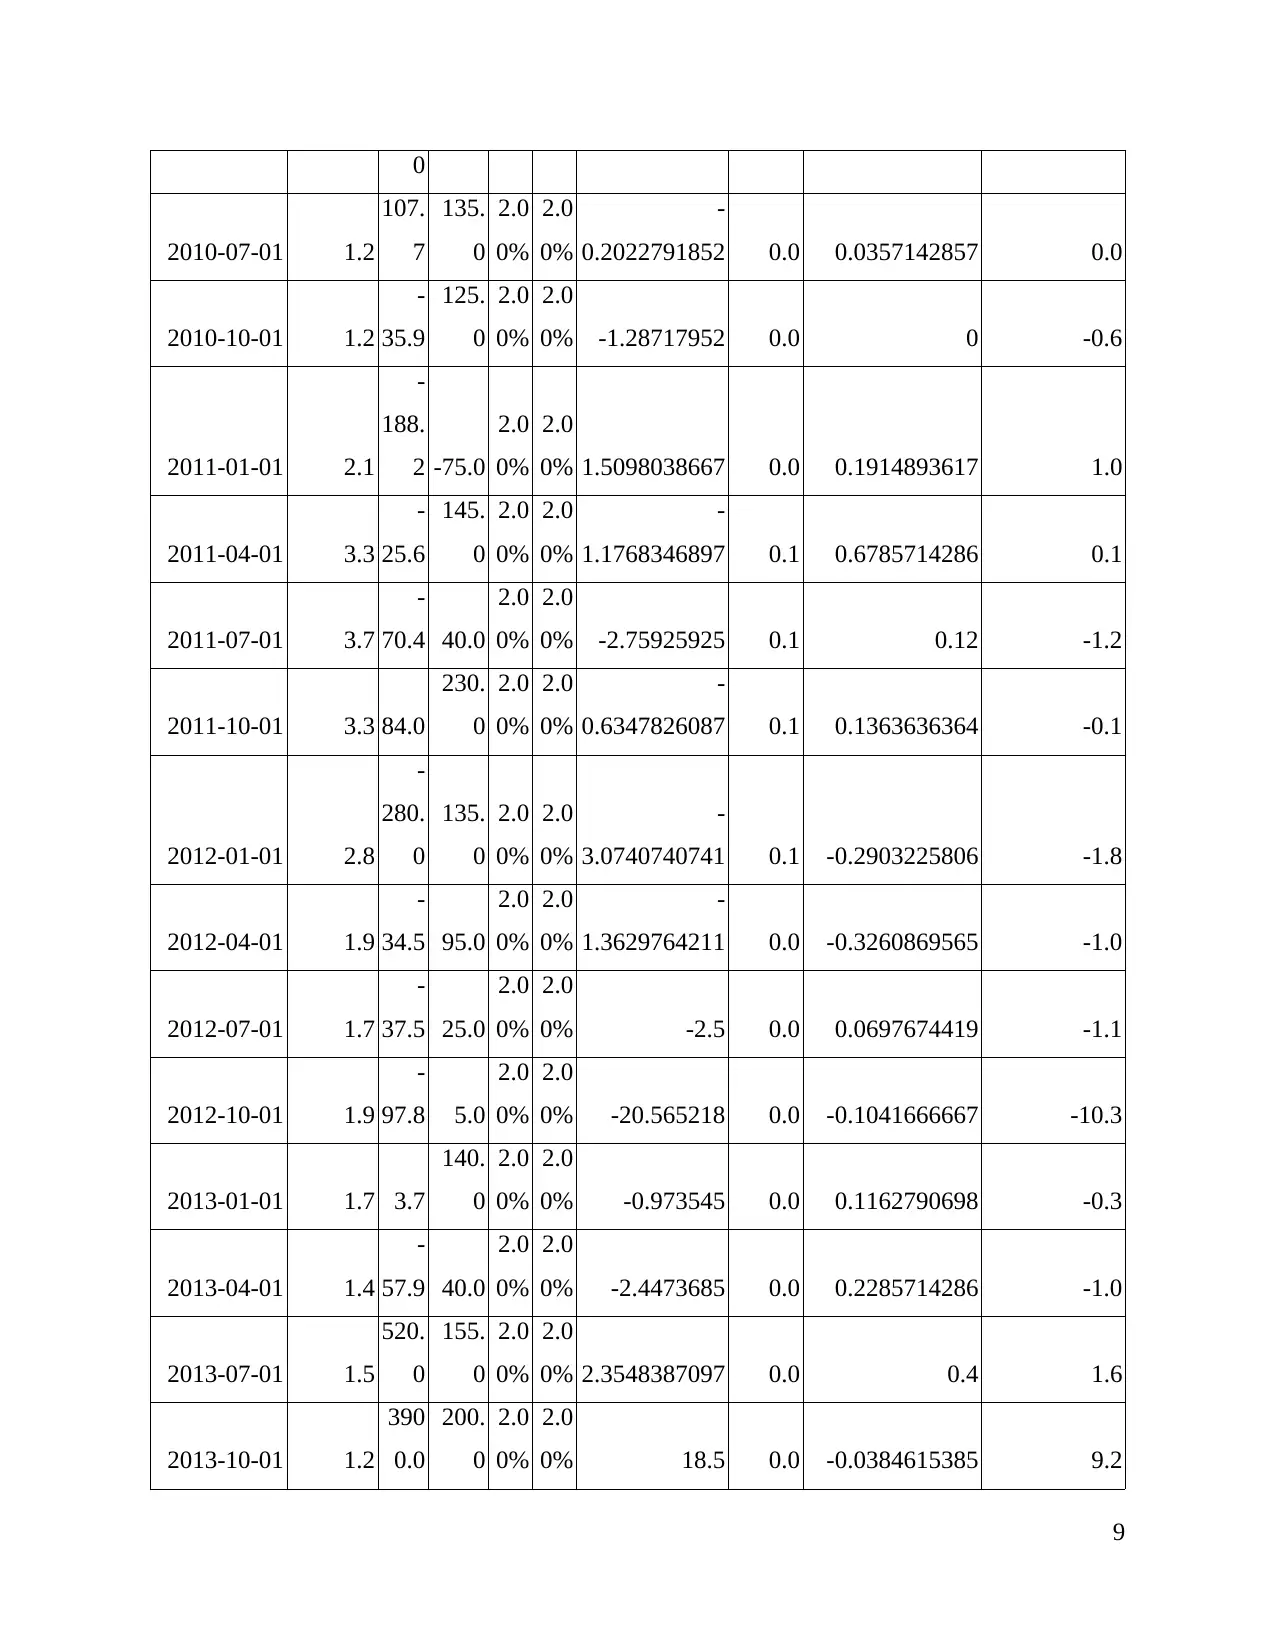
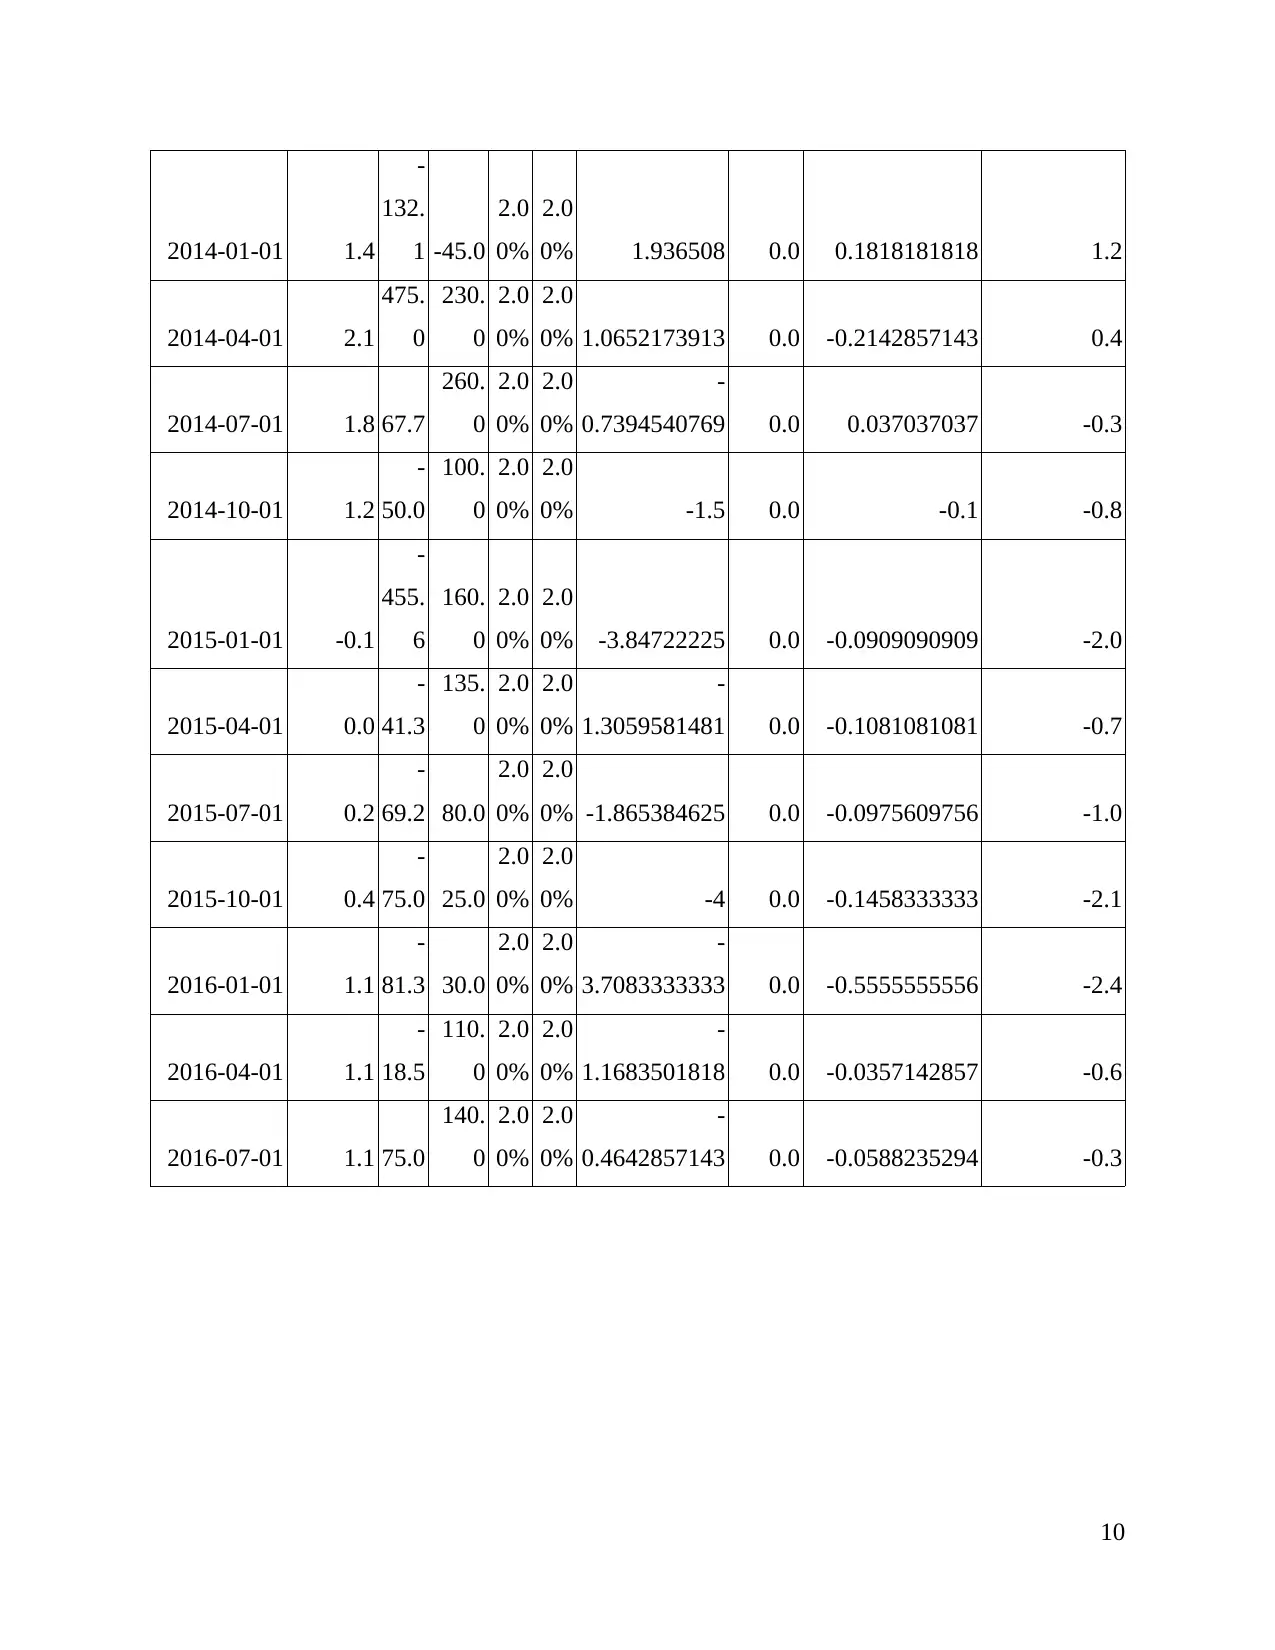
2018). Moreover, the impacts of such crisis can be seen as per the GDP rate, Potential GDP, FFR
and inflationary gap during the period has been analysed such as:
Frequency:
Quarterly
observation_
date
PCECT
PI_PC1
GD
PC1
GDP
POT π* r*
Output gap
(% of
potential)
Inflati
on gap
Actual Federal
Fund Rate (FFR)
Taylor rule
predicted
FFR
2000-01-01 3.3
-
62.5 60.0
2.0
0%
2.0
0%
-
2.0416666667 0.1 -1 -2.0
2000-04-01 3.3 136. 390. 2.0 2.0 -0.650349641 0.1 -0.0951115834 -0.4
5
level of economic policies were effective to build the economic standard of the citizens (Irani
and Meisenzahl, 2017). Later on it took time in again stabilised at GDP for the period of 2010 to
13 which was 1.95%. Thus, the rate was not that adequate appropriate as there is need to have
appropriate changes in the governmental policies to improve the financial environment of nations
(Aaronson and et.al., 2018). The impacts of global financial crisis has made reduction in the
economic viability as well as improper management of the financial activities in the economy.
The invitation of the inflation has incurred the big monetary losses to the government as well as
to the small scale enterprises (Travis, Harris and Larson, 2017). Due to impacts of the global
financial crisis there has been negative impacts over the consumer confidence level. Thus, it
impacts over their buying behaviour as the rise in the prices took place due to inflation which
impacts consumers to save their money.
Therefore, this has impacted over the reduction in the money circulations as well as
reduction in the demands for the particular goods. Similarly, it has influenced the sales or
operational aspects of the businesses and that lead them to higher losses. Therefore, in the year
2008 Federal debts has leads the debts held by public more than twice which is $5.8 trillion to
$12.2 trillion in 2013. These outcomes have been derived from as per the past impact and the
historical lower rates (Buyl, Boone and Wade, 2017). Therefore, it took year to a nation or
economy in overcoming with the financial losses and crisis. The impact of such economic crisis
was very huge as it has threatened the national economy (Bai, Krishnamurthy and Weymuller,
2018). Moreover, the impacts of such crisis can be seen as per the GDP rate, Potential GDP, FFR
and inflationary gap during the period has been analysed such as:
Frequency:
Quarterly
observation_
date
PCECT
PI_PC1
GD
PC1
GDP
POT π* r*
Output gap
(% of
potential)
Inflati
on gap
Actual Federal
Fund Rate (FFR)
Taylor rule
predicted
FFR
2000-01-01 3.3
-
62.5 60.0
2.0
0%
2.0
0%
-
2.0416666667 0.1 -1 -2.0
2000-04-01 3.3 136. 390. 2.0 2.0 -0.650349641 0.1 -0.0951115834 -0.4
5
Paraphrase This Document
Need a fresh take? Get an instant paraphrase of this document with our AI Paraphraser
4 0 0% 0%
2000-07-01 3.5
-
90.2 25.0
2.0
0%
2.0
0% -4.6078432 0.1 -0.0378323108 -2.3
2000-10-01 3.4
-
67.6
115.
0
2.0
0%
2.0
0%
-
1.5878750435 0.1 0.0072090628 -0.7
2001-01-01 3.4
-
191.
7 -55.0
2.0
0%
2.0
0% 2.4848485455 0.1 0.1573301549 1.5
2001-04-01 3.3
-
73.1
105.
0
2.0
0%
2.0
0%
-
1.6959706667 0.1 0.2927580894 -0.5
2001-07-01 2.7
-
360.
0 -65.0
2.0
0%
2.0
0% 4.5384615385 0.1 0.2373689228 2.6
2001-10-01 1.9
-
52.2 55.0
2.0
0%
2.0
0%
-
1.9486165455 0.0 0.6390625 -0.3
2002-01-01 1.2
-
436.
4
185.
0
2.0
0%
2.0
0%
-
3.3587223784 0.0 0.2307692308 -1.4
2002-04-01 1.3 4.8
110.
0
2.0
0%
2.0
0% -0.95671 0.0 -0.0095238095 -0.5
2002-07-01 1.6
-
253.
8
100.
0
2.0
0%
2.0
0% -3.5384615 0.0 0.0057471264 -1.7
2002-10-01 2.3
-
72.7 15.0
2.0
0%
2.0
0%
-
5.8484846667 0.0 0.2055427252 -2.7
2003-01-01 3.0
-
43.2
105.
0
2.0
0%
2.0
0% -1.411840381 0.1 0.1546666667 -0.5
2003-04-01 2.0 72.7
190.
0
2.0
0%
2.0
0%
-
0.6172248947 0.0 0.0026737968 -0.3
2003-07-01 2.2
245.
0
345.
0
2.0
0%
2.0
0%
-
0.2898550725 0.0 0.2262295082 0.1
6
2003-10-01 2.0
150
0.0
240.
0
2.0
0%
2.0
0% 5.25 0.0 0.0200668896 2.7
2004-01-01 1.8 9.5
115.
0
2.0
0%
2.0
0%
-
0.9171842609 0.0 -0.0066445183 -0.4
2004-04-01 2.8
-
21.1
150.
0
2.0
0%
2.0
0%
-
1.1403508667 0.1 -0.0066006601 -0.5
2004-07-01 2.7
-
46.4
185.
0
2.0
0%
2.0
0%
-
1.2506854595 0.1 -0.2953488372 -0.9
2004-10-01 3.4
-
27.1
175.
0
2.0
0%
2.0
0%
-
1.1547618857 0.1 -0.264957265 -0.8
2005-01-01 3.0 87.0
215.
0
2.0
0%
2.0
0%
-
0.5955510698 0.1 -0.2105263158 -0.5
2005-04-01 2.9
-
30.0
105.
0
2.0
0%
2.0
0%
-
1.2857142857 0.1 -0.160815402 -0.8
2005-07-01 3.8 -8.1
170.
0
2.0
0%
2.0
0%
-
1.0476947647 0.1 -0.1493256262 -0.6
2005-10-01 3.7
-
34.3
115.
0
2.0
0%
2.0
0%
-
1.2981366087 0.1 -0.1306532663 -0.7
2006-01-01 3.7 14.0
245.
0
2.0
0%
2.0
0%
-
0.9430469796 0.1 -0.1069558714 -0.5
2006-04-01 3.9
-
42.9 60.0
2.0
0%
2.0
0%
-
1.7142856667 0.1 -0.0917119565 -0.9
2006-07-01 3.3
-
88.2 20.0
2.0
0%
2.0
0% -5.4117645 0.1 -0.0648030496 -2.7
2006-10-01 2.0 39.1
160.
0
2.0
0%
2.0
0%
-
0.7554348125 0.0 0 -0.3
2007-01-01 2.4
-
95.9 10.0
2.0
0%
2.0
0% -10.591837 0.0 -0.0019023462 -5.3
2007-04-01 2.7
158.
3
155.
0
2.0
0%
2.0
0% 0.0215053548 0.1 0.0012698413 0.1
2007-07-01 2.3 575. 135. 2.0 2.0 3.2592592593 0.0 0.0348226018 1.7
7
⊘ This is a preview!⊘
Do you want full access?
Subscribe today to unlock all pages.
Trusted by 1+ million students worldwide
0 0 0% 0%
2007-10-01 4.0
-
56.3 70.0
2.0
0%
2.0
0%
-
1.8035714286 0.1 0.1282431431 -0.7
2008-01-01 4.1
-
145
0.0
-
135.
0
2.0
0%
2.0
0% 9.7407407407 0.1 0.4155299056 5.3
2008-04-01 4.3
-
35.5
100.
0
2.0
0%
2.0
0% -1.3548387 0.1 0.5223642173 -0.1
2008-07-01 5.3
-
170.
4 -95.0
2.0
0%
2.0
0% 0.7933723158 0.1 0.0756013746 0.5
2008-10-01 1.6
-
685.
7
-
410.
0
2.0
0%
2.0
0% 0.672473878 0.0 2.8289473684 3.2
2009-01-01 -0.2
100.
0
-
270.
0
2.0
0%
2.0
0%
-
1.3703703704 0.0 1.7636363636 1.1
2009-04-01 -0.9
-
125.
0 -25.0
2.0
0%
2.0
0% 4 0.0 0.0185185185 2.0
2009-07-01 -1.6
-
168.
4 65.0
2.0
0%
2.0
0%
-
3.5910930769 0.0 0.1489361702 -1.6
2009-10-01 1.5
-
147.
6
195.
0
2.0
0%
2.0
0%
-
1.7567229744 0.0 0.3055555556 -0.5
2010-01-01 2.4
-
131.
5 85.0
2.0
0%
2.0
0%
-
2.5468409412 0.0 -0.1 -1.3
2010-04-01 1.8 -
880.
195.
0
2.0
0%
2.0
0%
-
5.5128205128
0.0 -0.3103448276 -3.0
8
Paraphrase This Document
Need a fresh take? Get an instant paraphrase of this document with our AI Paraphraser
0
2010-07-01 1.2
107.
7
135.
0
2.0
0%
2.0
0%
-
0.2022791852 0.0 0.0357142857 0.0
2010-10-01 1.2
-
35.9
125.
0
2.0
0%
2.0
0% -1.28717952 0.0 0 -0.6
2011-01-01 2.1
-
188.
2 -75.0
2.0
0%
2.0
0% 1.5098038667 0.0 0.1914893617 1.0
2011-04-01 3.3
-
25.6
145.
0
2.0
0%
2.0
0%
-
1.1768346897 0.1 0.6785714286 0.1
2011-07-01 3.7
-
70.4 40.0
2.0
0%
2.0
0% -2.75925925 0.1 0.12 -1.2
2011-10-01 3.3 84.0
230.
0
2.0
0%
2.0
0%
-
0.6347826087 0.1 0.1363636364 -0.1
2012-01-01 2.8
-
280.
0
135.
0
2.0
0%
2.0
0%
-
3.0740740741 0.1 -0.2903225806 -1.8
2012-04-01 1.9
-
34.5 95.0
2.0
0%
2.0
0%
-
1.3629764211 0.0 -0.3260869565 -1.0
2012-07-01 1.7
-
37.5 25.0
2.0
0%
2.0
0% -2.5 0.0 0.0697674419 -1.1
2012-10-01 1.9
-
97.8 5.0
2.0
0%
2.0
0% -20.565218 0.0 -0.1041666667 -10.3
2013-01-01 1.7 3.7
140.
0
2.0
0%
2.0
0% -0.973545 0.0 0.1162790698 -0.3
2013-04-01 1.4
-
57.9 40.0
2.0
0%
2.0
0% -2.4473685 0.0 0.2285714286 -1.0
2013-07-01 1.5
520.
0
155.
0
2.0
0%
2.0
0% 2.3548387097 0.0 0.4 1.6
2013-10-01 1.2
390
0.0
200.
0
2.0
0%
2.0
0% 18.5 0.0 -0.0384615385 9.2
9
2014-01-01 1.4
-
132.
1 -45.0
2.0
0%
2.0
0% 1.936508 0.0 0.1818181818 1.2
2014-04-01 2.1
475.
0
230.
0
2.0
0%
2.0
0% 1.0652173913 0.0 -0.2142857143 0.4
2014-07-01 1.8 67.7
260.
0
2.0
0%
2.0
0%
-
0.7394540769 0.0 0.037037037 -0.3
2014-10-01 1.2
-
50.0
100.
0
2.0
0%
2.0
0% -1.5 0.0 -0.1 -0.8
2015-01-01 -0.1
-
455.
6
160.
0
2.0
0%
2.0
0% -3.84722225 0.0 -0.0909090909 -2.0
2015-04-01 0.0
-
41.3
135.
0
2.0
0%
2.0
0%
-
1.3059581481 0.0 -0.1081081081 -0.7
2015-07-01 0.2
-
69.2 80.0
2.0
0%
2.0
0% -1.865384625 0.0 -0.0975609756 -1.0
2015-10-01 0.4
-
75.0 25.0
2.0
0%
2.0
0% -4 0.0 -0.1458333333 -2.1
2016-01-01 1.1
-
81.3 30.0
2.0
0%
2.0
0%
-
3.7083333333 0.0 -0.5555555556 -2.4
2016-04-01 1.1
-
18.5
110.
0
2.0
0%
2.0
0%
-
1.1683501818 0.0 -0.0357142857 -0.6
2016-07-01 1.1 75.0
140.
0
2.0
0%
2.0
0%
-
0.4642857143 0.0 -0.0588235294 -0.3
10
-
132.
1 -45.0
2.0
0%
2.0
0% 1.936508 0.0 0.1818181818 1.2
2014-04-01 2.1
475.
0
230.
0
2.0
0%
2.0
0% 1.0652173913 0.0 -0.2142857143 0.4
2014-07-01 1.8 67.7
260.
0
2.0
0%
2.0
0%
-
0.7394540769 0.0 0.037037037 -0.3
2014-10-01 1.2
-
50.0
100.
0
2.0
0%
2.0
0% -1.5 0.0 -0.1 -0.8
2015-01-01 -0.1
-
455.
6
160.
0
2.0
0%
2.0
0% -3.84722225 0.0 -0.0909090909 -2.0
2015-04-01 0.0
-
41.3
135.
0
2.0
0%
2.0
0%
-
1.3059581481 0.0 -0.1081081081 -0.7
2015-07-01 0.2
-
69.2 80.0
2.0
0%
2.0
0% -1.865384625 0.0 -0.0975609756 -1.0
2015-10-01 0.4
-
75.0 25.0
2.0
0%
2.0
0% -4 0.0 -0.1458333333 -2.1
2016-01-01 1.1
-
81.3 30.0
2.0
0%
2.0
0%
-
3.7083333333 0.0 -0.5555555556 -2.4
2016-04-01 1.1
-
18.5
110.
0
2.0
0%
2.0
0%
-
1.1683501818 0.0 -0.0357142857 -0.6
2016-07-01 1.1 75.0
140.
0
2.0
0%
2.0
0%
-
0.4642857143 0.0 -0.0588235294 -0.3
10
⊘ This is a preview!⊘
Do you want full access?
Subscribe today to unlock all pages.
Trusted by 1+ million students worldwide
1 out of 16
Related Documents


Your All-in-One AI-Powered Toolkit for Academic Success.
+13062052269
info@desklib.com
Available 24*7 on WhatsApp / Email
![[object Object]](/_next/static/media/star-bottom.7253800d.svg)
Unlock your academic potential
Copyright © 2020–2026 A2Z Services. All Rights Reserved. Developed and managed by ZUCOL.