Financial Analysis: Cryptocurrency Portfolio and Trading Strategy
VerifiedAdded on 2022/11/13
|15
|2955
|226
Project
AI Summary
This project presents a comprehensive analysis of cryptocurrency portfolios using data from BTC, ETH, XRP, and LTC between February 15, 2017, and February 15, 2019. It begins with an overview of cryptography, economics, and their intersection in cryptoeconomics and blockchain technology. The project then examines key events affecting cryptocurrencies in 2018, including hacks, regulatory changes, and market fluctuations. A portfolio analysis is conducted using Python's Pandas package, calculating Sharpe ratios, volatility, average daily returns, and cumulative returns. Furthermore, an event study is developed to measure the impact of specific events on stock prices, followed by a proposed trading strategy based on the analysis of negative and positive sentiment events. The project provides detailed plots and data analysis to support the findings and conclusions, offering valuable insights into cryptocurrency market dynamics.
Declaration
Data used in this assignment was obtained from yahoo finance. The data relates to the BTC,
ETH, XRP , LTC and NASDAQ trade between Feb 15, 2017 and Feb 15, 2019.
Question 1
Cryptography and Economics
Theoretically, Cryptography refers to techniques applied in protecting information and
communications by use of codes. The approaches ensure that only the intended parties can read
and process information within a given communication system. The techniques that constitute
Cryptography are largely derived from mathematical concepts with application of special
algorithms that transforms messages into cipher text, through encryption; and extract messages
from cipher text through decryption. Modern cryptography primarily focuses on ensuring
confidentiality; ensuring that information is not exposed to unintended parties, integrity; ensure
information cannot be altered while on transit or in storage, non-repudiation and authentication.
On the other hand, is defined as a social science that focuses on the “production, distribution, and
consumption of goods and services”. Economics endeavors to satisfy needs and wants, “through
the allocation of scarce resources which have alternative uses”. The subject is founded on the fact
that resources are finite, and choices have to be made in order to utilize available resources,
prudently; creating a balance between demand and supply. Economics finds usage in all facets of
life. As such, its use in cryptography comes in naturally.
From a technological standpoint, Cryptography and economics interacts in a number of ways.
Since cryptography is the engine behind the production, distribution and use of currency within
the digital economy, it has to be governed by some economics rules and protocols. The two
disciplines therefore interact to establish rules and protocols, which governs the production,
Paraphrase This Document
Need a fresh take? Get an instant paraphrase of this document with our AI Paraphraser
distribution and consumption of goods and services within the decentralized digital economy.
The interaction between cryptography and economics has led to the birth of Cryptoeconomics; a
field of study that focuses on the design of principles for governing the block-chain technology.
Blockchain Technology
A blockchain can be defined as a distributed ledger, that’s holds and preserves an ever increasing
list of openly shared and accessible records, which are cryptographically secured from tampering
and alteration (Ahram et al. 2017). A node in a blockchain network holds a copy of the
blockchain. Blocks in a blockchain is linked to another by use of a hash pointer, and are
cryptographically secured. The linkage between one block to another consists of a hash pointer,
transactional data and a timestamp. The chain facilitates the creation of a continually growing
public ledger that is persistent, immutable and can only be updated by appending additionally
information by use of cryptographic digital signatures (Lemieux, 2017).
By design, blockchain technology makes it almost impossible to alter any data. As such, it
provides a near permanent approach to maintain historical transaction records between two
parties, while ensuring that such information is permanent, openly accessible, distributed and
verifiable. The technology therefore, facilitates the creation of a permanent, distributed ledger
than can hold transaction data. Where the technology is used as a distributed ledger, a blockchain
is normally administered by a peer-to-peer network, where each and every node in the network
adheres to a set of rules that guide the validation of new blocks.
Data recorded in any block of a blockchain cannot be changed, without changing all the other
blocks. Changing a single block requires a decentralized consensus between all or most of the
nodes in the network. These restrictions make it almost impossible to change information
recorded on a block, and makes blockchain technology to be highly secure. The constraint also
makes the technology ideal for recording critical information such as land ownership, identity
management, medical records and other transactional data.
Blockchain technology was first conceptualized by Satoshi Nakamoto in 2008 and implemented
as a distributed blockchain in 2009. The initial implementation was in form of a public ledger
which forms the core of the Bitcoin digital currency.
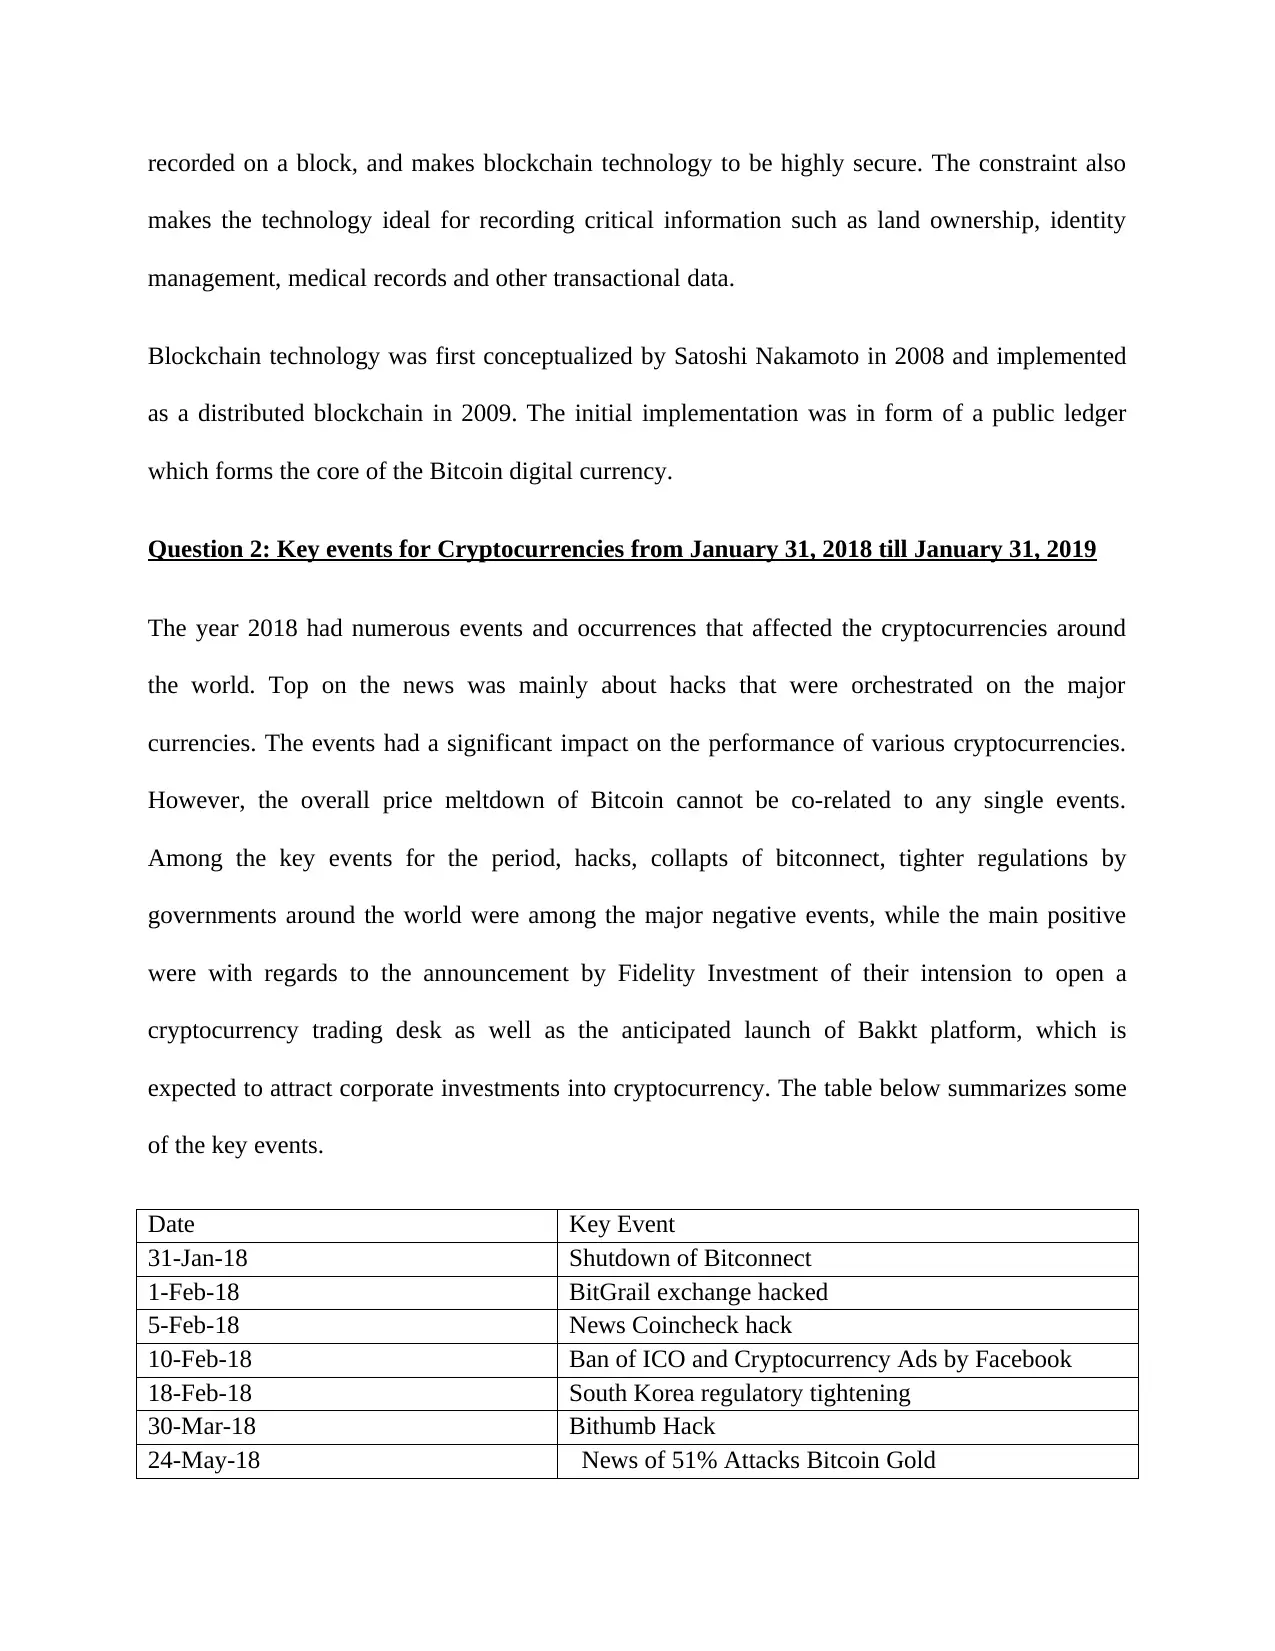
Question 2: Key events for Cryptocurrencies from January 31, 2018 till January 31, 2019
The year 2018 had numerous events and occurrences that affected the cryptocurrencies around
the world. Top on the news was mainly about hacks that were orchestrated on the major
currencies. The events had a significant impact on the performance of various cryptocurrencies.
However, the overall price meltdown of Bitcoin cannot be co-related to any single events.
Among the key events for the period, hacks, collapts of bitconnect, tighter regulations by
governments around the world were among the major negative events, while the main positive
were with regards to the announcement by Fidelity Investment of their intension to open a
cryptocurrency trading desk as well as the anticipated launch of Bakkt platform, which is
expected to attract corporate investments into cryptocurrency. The table below summarizes some
of the key events.
Date Key Event
31-Jan-18 Shutdown of Bitconnect
1-Feb-18 BitGrail exchange hacked
5-Feb-18 News Coincheck hack
10-Feb-18 Ban of ICO and Cryptocurrency Ads by Facebook
18-Feb-18 South Korea regulatory tightening
30-Mar-18 Bithumb Hack
24-May-18 News of 51% Attacks Bitcoin Gold
makes the technology ideal for recording critical information such as land ownership, identity
management, medical records and other transactional data.
Blockchain technology was first conceptualized by Satoshi Nakamoto in 2008 and implemented
as a distributed blockchain in 2009. The initial implementation was in form of a public ledger
which forms the core of the Bitcoin digital currency.
Question 2: Key events for Cryptocurrencies from January 31, 2018 till January 31, 2019
The year 2018 had numerous events and occurrences that affected the cryptocurrencies around
the world. Top on the news was mainly about hacks that were orchestrated on the major
currencies. The events had a significant impact on the performance of various cryptocurrencies.
However, the overall price meltdown of Bitcoin cannot be co-related to any single events.
Among the key events for the period, hacks, collapts of bitconnect, tighter regulations by
governments around the world were among the major negative events, while the main positive
were with regards to the announcement by Fidelity Investment of their intension to open a
cryptocurrency trading desk as well as the anticipated launch of Bakkt platform, which is
expected to attract corporate investments into cryptocurrency. The table below summarizes some
of the key events.
Date Key Event
31-Jan-18 Shutdown of Bitconnect
1-Feb-18 BitGrail exchange hacked
5-Feb-18 News Coincheck hack
10-Feb-18 Ban of ICO and Cryptocurrency Ads by Facebook
18-Feb-18 South Korea regulatory tightening
30-Mar-18 Bithumb Hack
24-May-18 News of 51% Attacks Bitcoin Gold
⊘ This is a preview!⊘
Do you want full access?
Subscribe today to unlock all pages.
Trusted by 1+ million students worldwide
15-Oct-18 Fidelity Investments intension to open a cryptocurrency
trading desk
24-Oct-2018 Coinbase Gets Approval to Offer Crypto Custody
Services
15-Nov-18 Bitcoin Cash hard fork
15-Jan-2019 Anticipated Launch of Bakkt
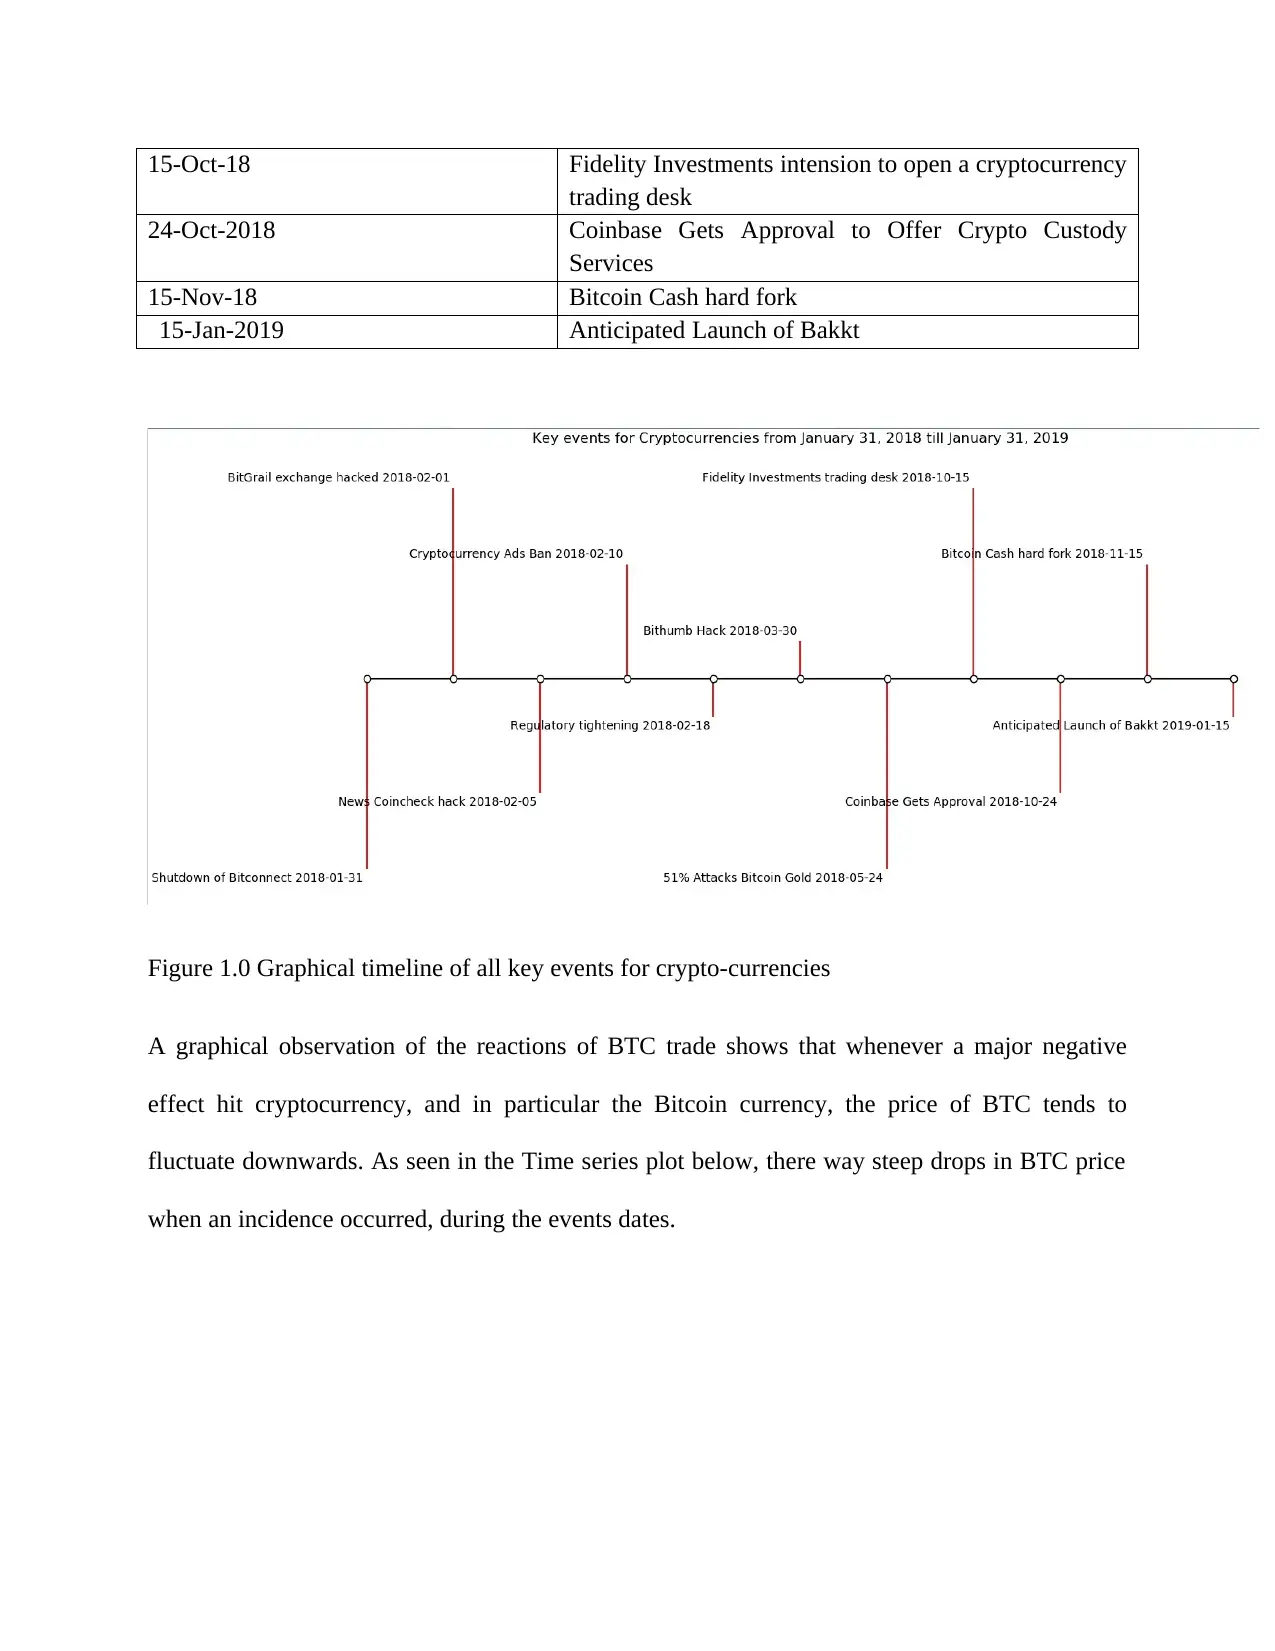
Figure 1.0 Graphical timeline of all key events for crypto-currencies
A graphical observation of the reactions of BTC trade shows that whenever a major negative
effect hit cryptocurrency, and in particular the Bitcoin currency, the price of BTC tends to
fluctuate downwards. As seen in the Time series plot below, there way steep drops in BTC price
when an incidence occurred, during the events dates.
trading desk
24-Oct-2018 Coinbase Gets Approval to Offer Crypto Custody
Services
15-Nov-18 Bitcoin Cash hard fork
15-Jan-2019 Anticipated Launch of Bakkt
Figure 1.0 Graphical timeline of all key events for crypto-currencies
A graphical observation of the reactions of BTC trade shows that whenever a major negative
effect hit cryptocurrency, and in particular the Bitcoin currency, the price of BTC tends to
fluctuate downwards. As seen in the Time series plot below, there way steep drops in BTC price
when an incidence occurred, during the events dates.
Paraphrase This Document
Need a fresh take? Get an instant paraphrase of this document with our AI Paraphraser
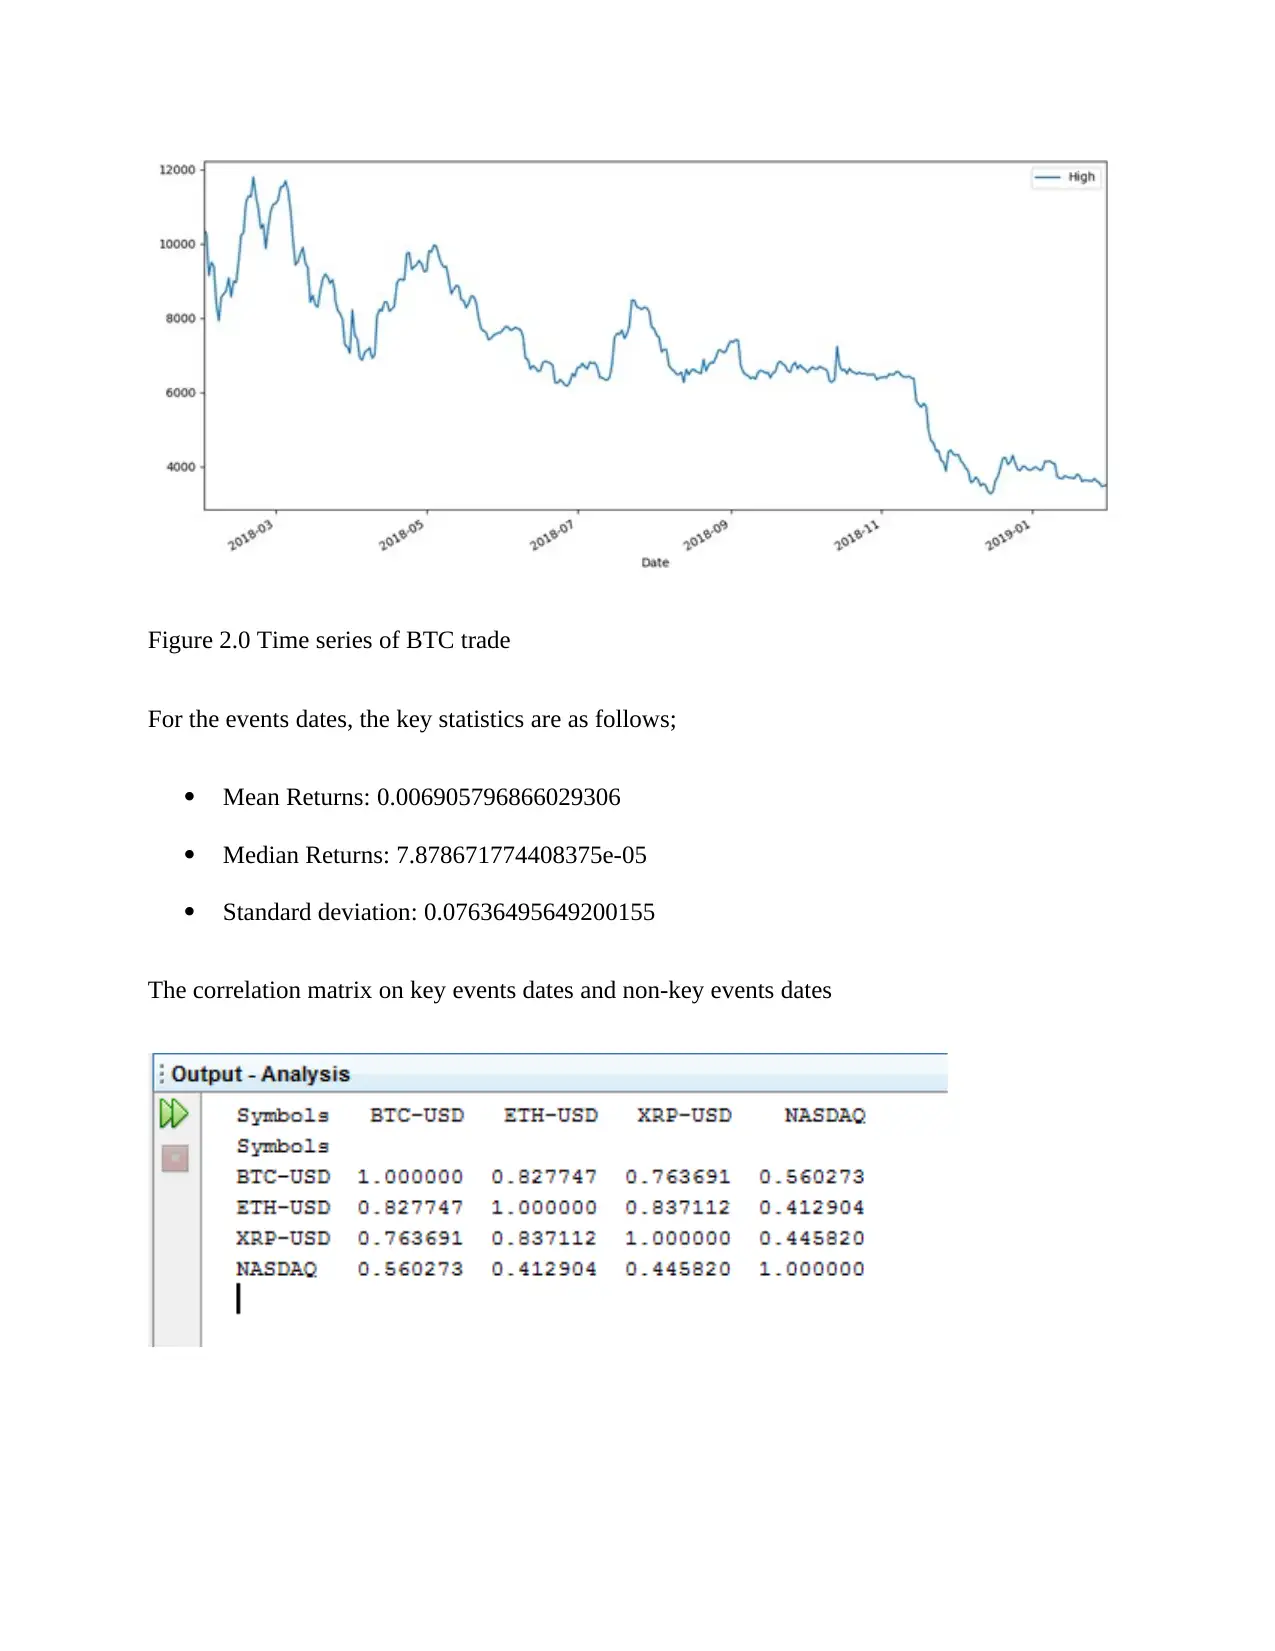
Figure 2.0 Time series of BTC trade
For the events dates, the key statistics are as follows;
Mean Returns: 0.006905796866029306
Median Returns: 7.878671774408375e-05
Standard deviation: 0.07636495649200155
The correlation matrix on key events dates and non-key events dates
For the events dates, the key statistics are as follows;
Mean Returns: 0.006905796866029306
Median Returns: 7.878671774408375e-05
Standard deviation: 0.07636495649200155
The correlation matrix on key events dates and non-key events dates
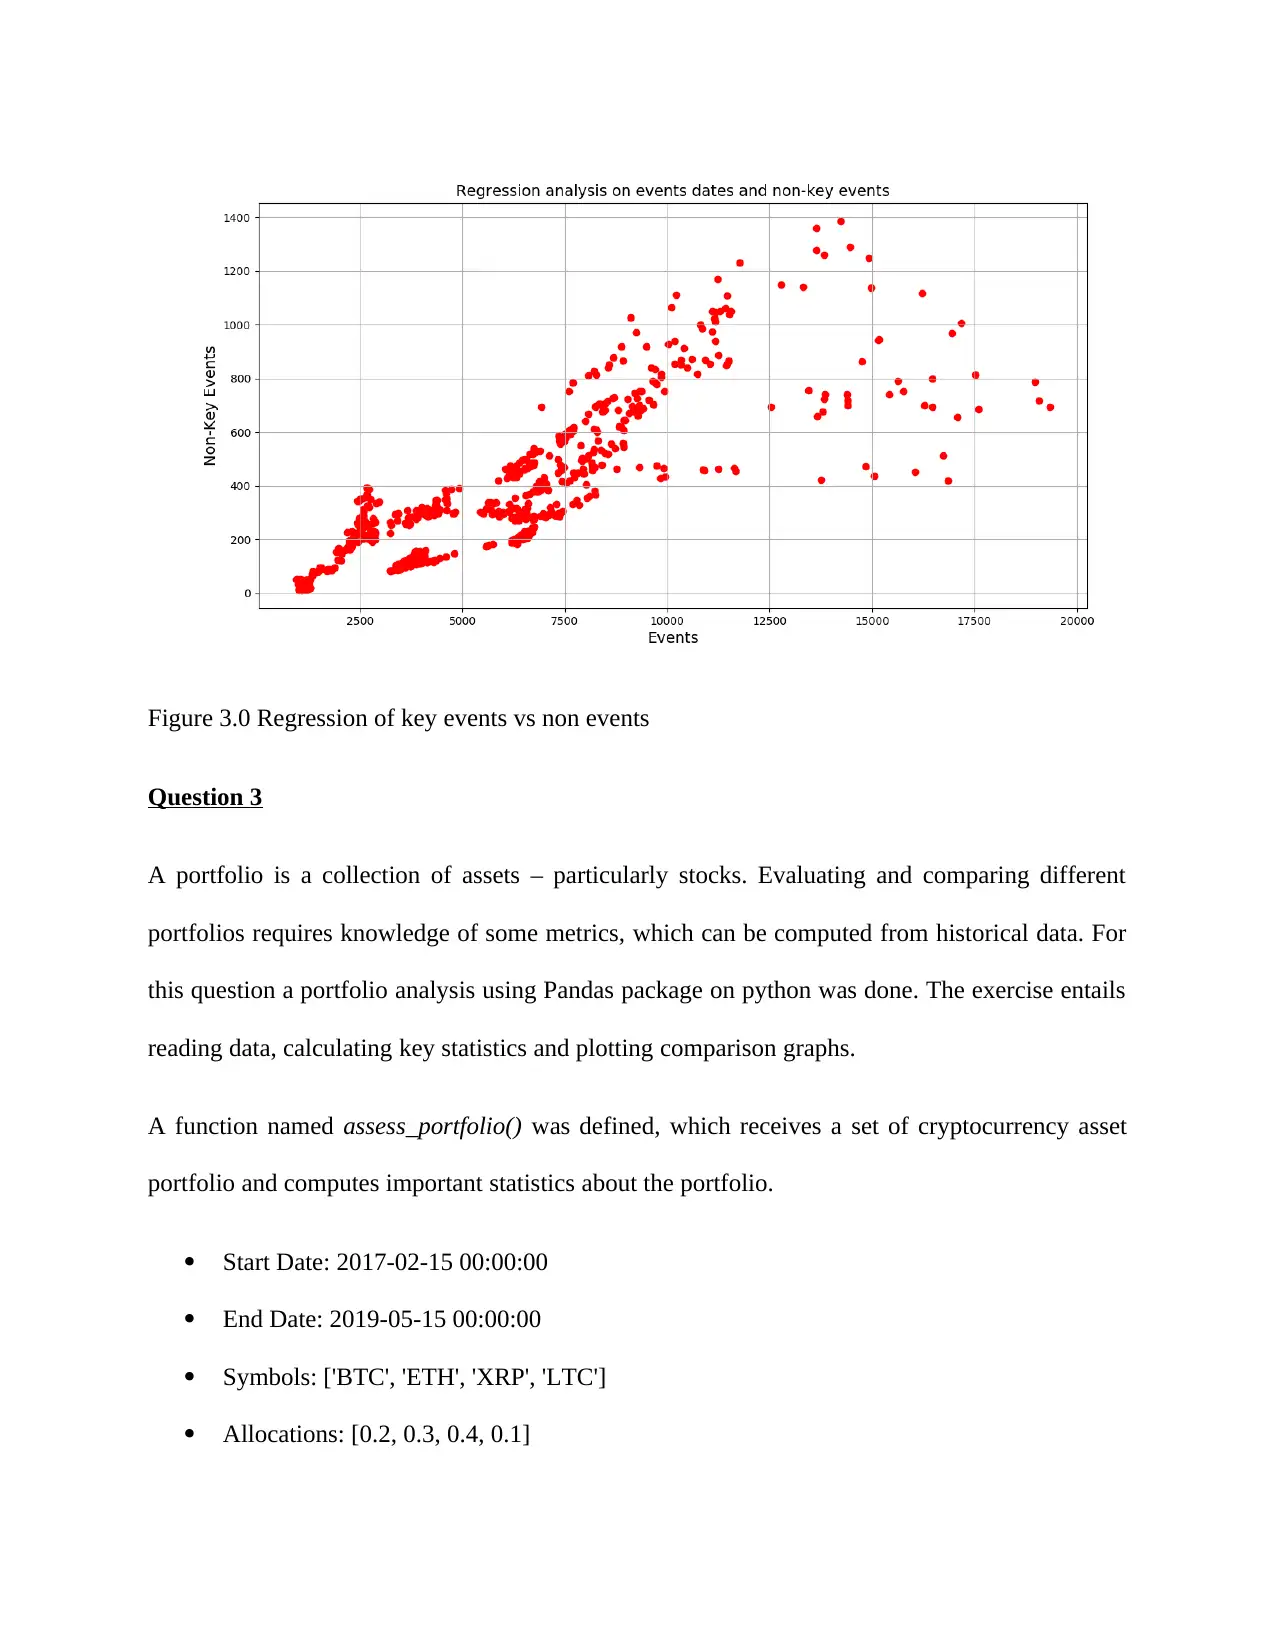
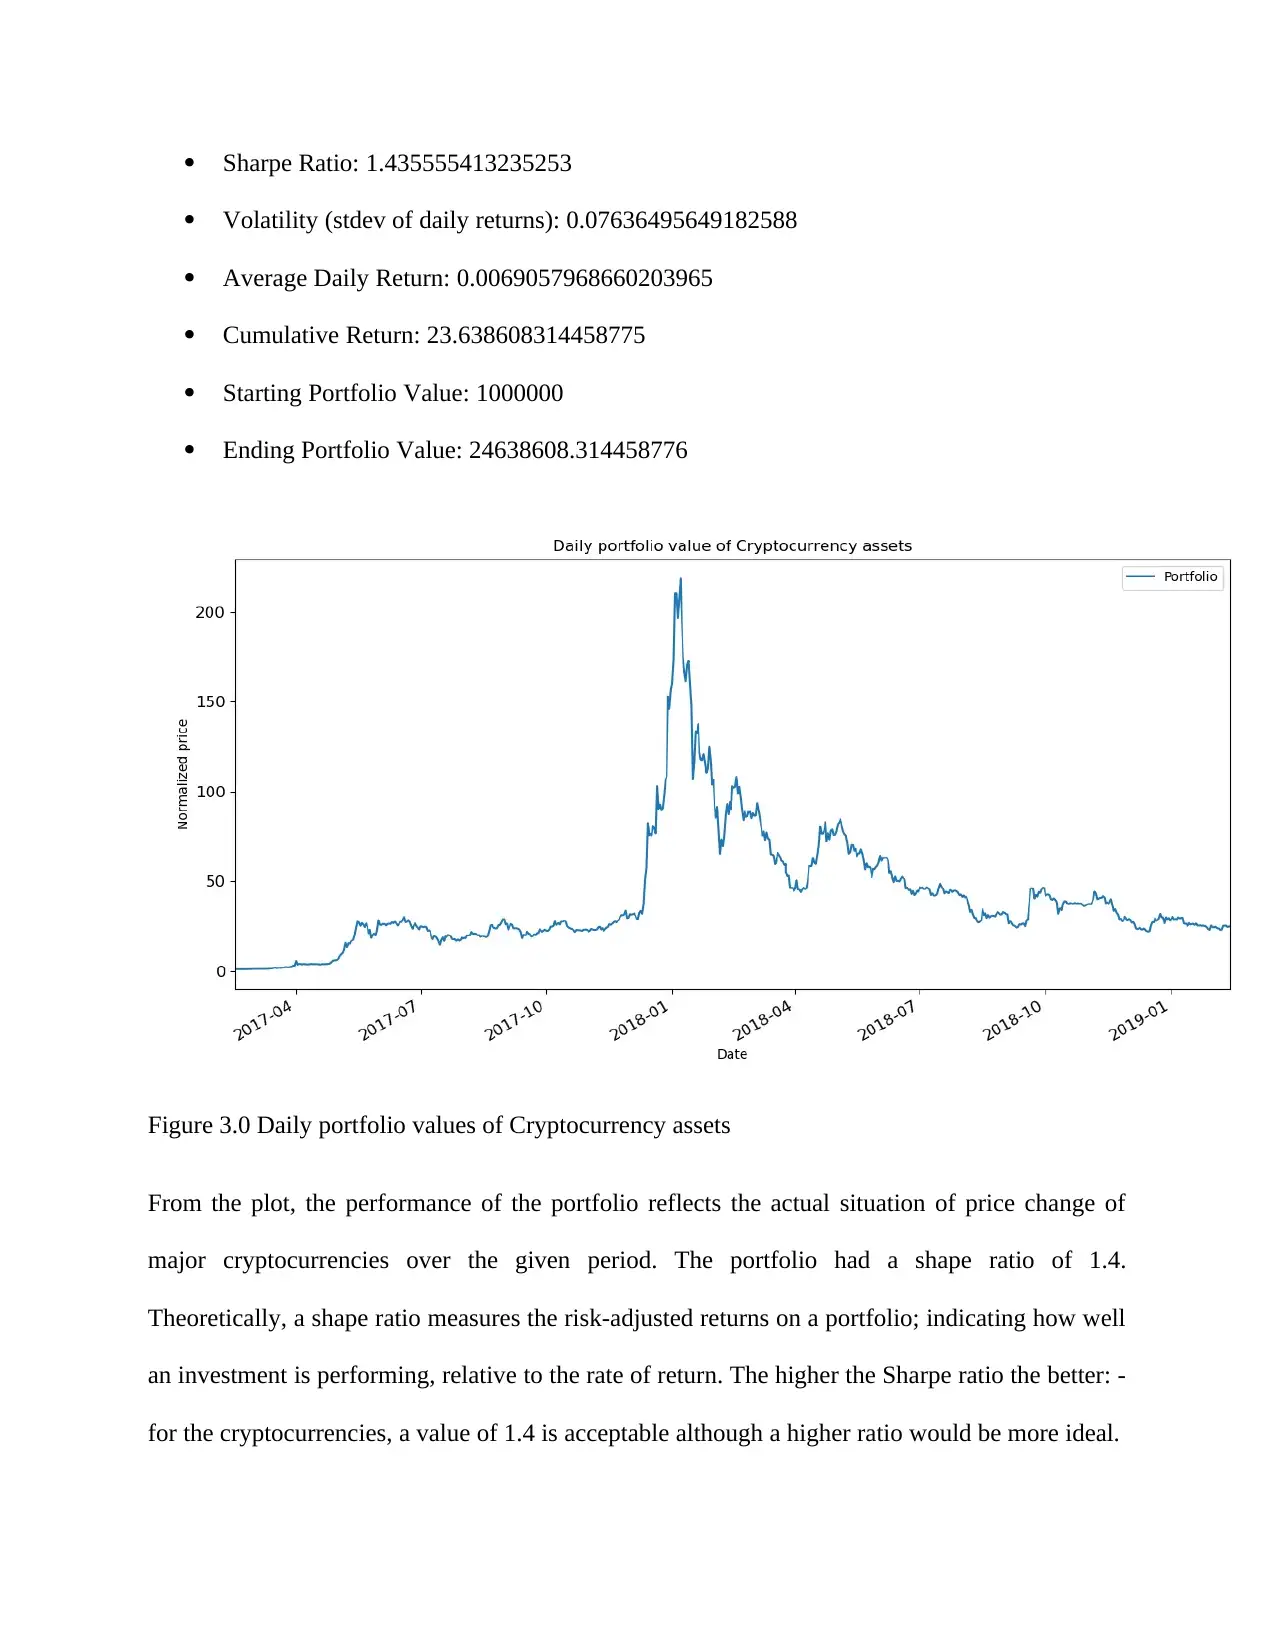
Figure 3.0 Regression of key events vs non events
Question 3
A portfolio is a collection of assets – particularly stocks. Evaluating and comparing different
portfolios requires knowledge of some metrics, which can be computed from historical data. For
this question a portfolio analysis using Pandas package on python was done. The exercise entails
reading data, calculating key statistics and plotting comparison graphs.
A function named assess_portfolio() was defined, which receives a set of cryptocurrency asset
portfolio and computes important statistics about the portfolio.
Start Date: 2017-02-15 00:00:00
End Date: 2019-05-15 00:00:00
Symbols: ['BTC', 'ETH', 'XRP', 'LTC']
Allocations: [0.2, 0.3, 0.4, 0.1]
⊘ This is a preview!⊘
Do you want full access?
Subscribe today to unlock all pages.
Trusted by 1+ million students worldwide
Sharpe Ratio: 1.435555413235253
Volatility (stdev of daily returns): 0.07636495649182588
Average Daily Return: 0.0069057968660203965
Cumulative Return: 23.638608314458775
Starting Portfolio Value: 1000000
Ending Portfolio Value: 24638608.314458776
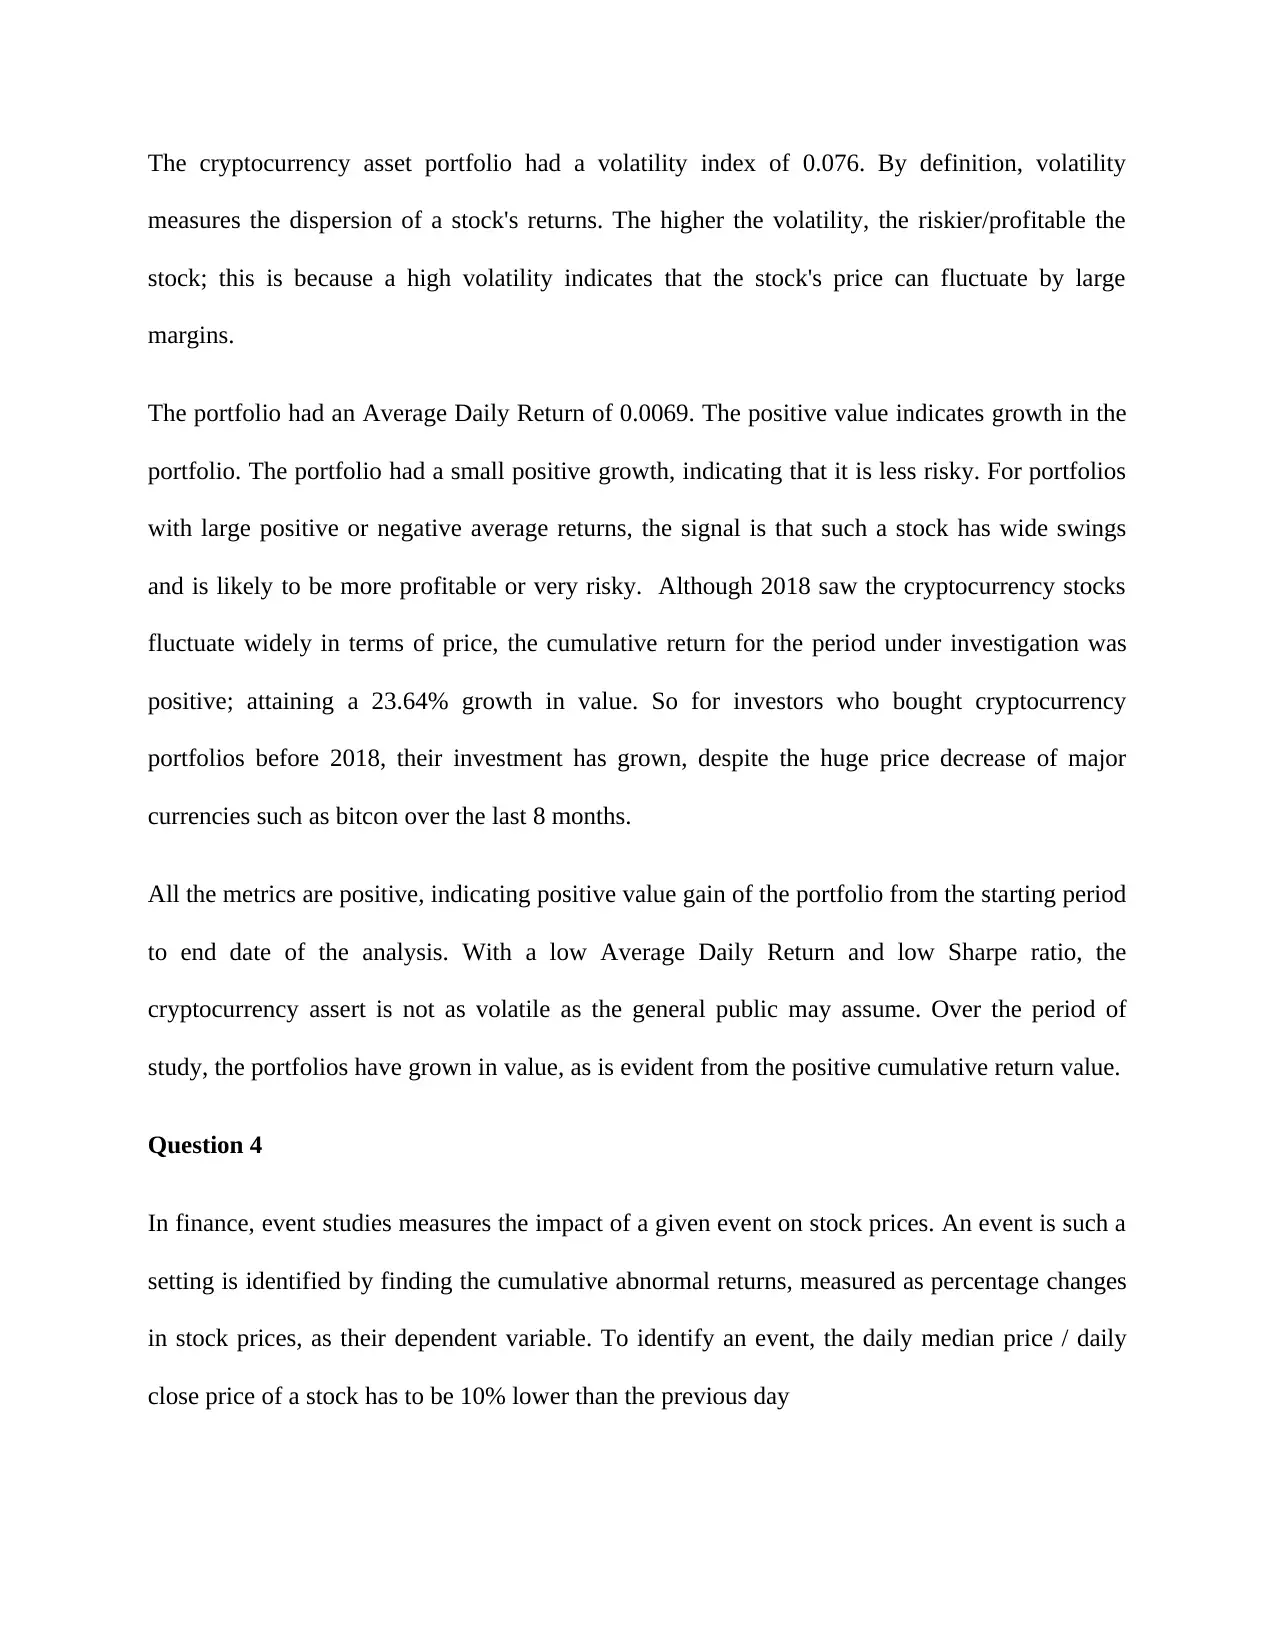
Figure 3.0 Daily portfolio values of Cryptocurrency assets
From the plot, the performance of the portfolio reflects the actual situation of price change of
major cryptocurrencies over the given period. The portfolio had a shape ratio of 1.4.
Theoretically, a shape ratio measures the risk-adjusted returns on a portfolio; indicating how well
an investment is performing, relative to the rate of return. The higher the Sharpe ratio the better: -
for the cryptocurrencies, a value of 1.4 is acceptable although a higher ratio would be more ideal.
Volatility (stdev of daily returns): 0.07636495649182588
Average Daily Return: 0.0069057968660203965
Cumulative Return: 23.638608314458775
Starting Portfolio Value: 1000000
Ending Portfolio Value: 24638608.314458776
Figure 3.0 Daily portfolio values of Cryptocurrency assets
From the plot, the performance of the portfolio reflects the actual situation of price change of
major cryptocurrencies over the given period. The portfolio had a shape ratio of 1.4.
Theoretically, a shape ratio measures the risk-adjusted returns on a portfolio; indicating how well
an investment is performing, relative to the rate of return. The higher the Sharpe ratio the better: -
for the cryptocurrencies, a value of 1.4 is acceptable although a higher ratio would be more ideal.
Paraphrase This Document
Need a fresh take? Get an instant paraphrase of this document with our AI Paraphraser
The cryptocurrency asset portfolio had a volatility index of 0.076. By definition, volatility
measures the dispersion of a stock's returns. The higher the volatility, the riskier/profitable the
stock; this is because a high volatility indicates that the stock's price can fluctuate by large
margins.
The portfolio had an Average Daily Return of 0.0069. The positive value indicates growth in the
portfolio. The portfolio had a small positive growth, indicating that it is less risky. For portfolios
with large positive or negative average returns, the signal is that such a stock has wide swings
and is likely to be more profitable or very risky. Although 2018 saw the cryptocurrency stocks
fluctuate widely in terms of price, the cumulative return for the period under investigation was
positive; attaining a 23.64% growth in value. So for investors who bought cryptocurrency
portfolios before 2018, their investment has grown, despite the huge price decrease of major
currencies such as bitcon over the last 8 months.
All the metrics are positive, indicating positive value gain of the portfolio from the starting period
to end date of the analysis. With a low Average Daily Return and low Sharpe ratio, the
cryptocurrency assert is not as volatile as the general public may assume. Over the period of
study, the portfolios have grown in value, as is evident from the positive cumulative return value.
Question 4
In finance, event studies measures the impact of a given event on stock prices. An event is such a
setting is identified by finding the cumulative abnormal returns, measured as percentage changes
in stock prices, as their dependent variable. To identify an event, the daily median price / daily
close price of a stock has to be 10% lower than the previous day
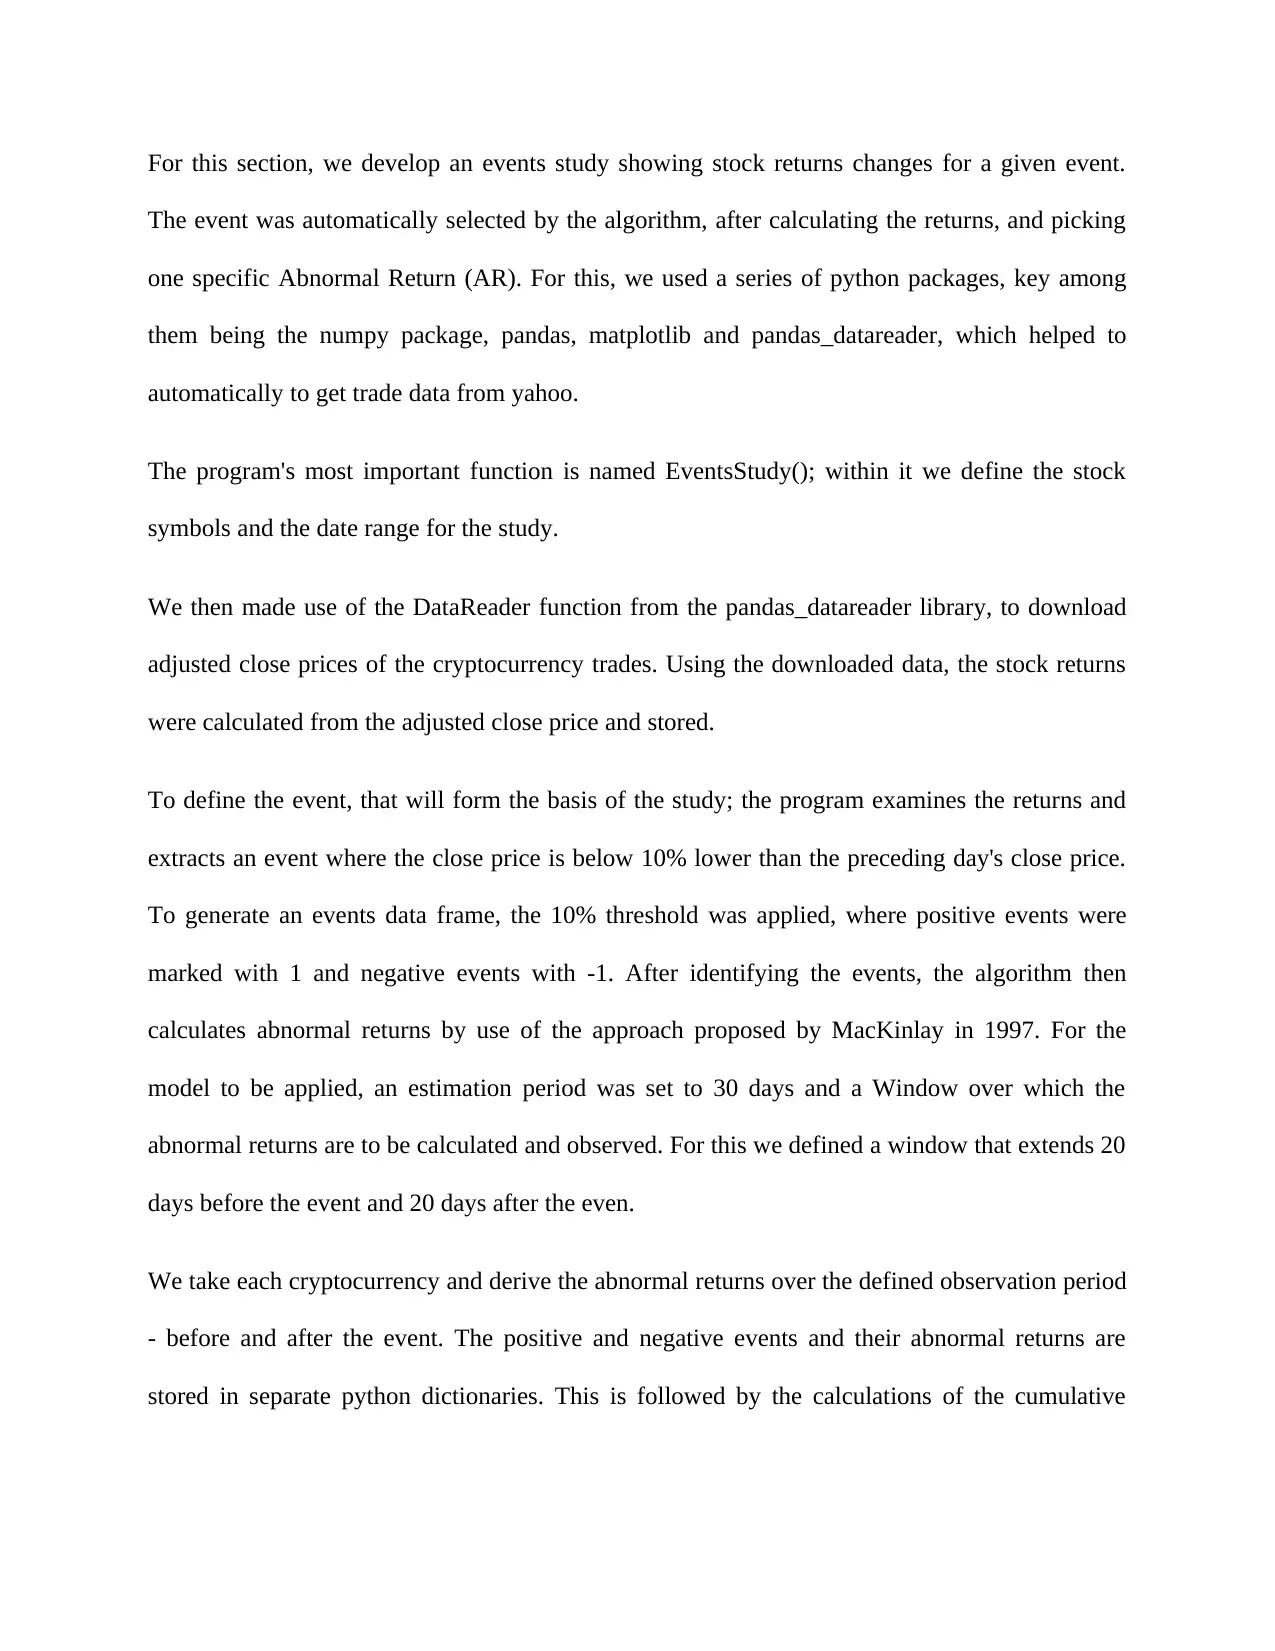
For this section, we develop an events study showing stock returns changes for a given event.
The event was automatically selected by the algorithm, after calculating the returns, and picking
one specific Abnormal Return (AR). For this, we used a series of python packages, key among
them being the numpy package, pandas, matplotlib and pandas_datareader, which helped to
automatically to get trade data from yahoo.
The program's most important function is named EventsStudy(); within it we define the stock
symbols and the date range for the study.
We then made use of the DataReader function from the pandas_datareader library, to download
adjusted close prices of the cryptocurrency trades. Using the downloaded data, the stock returns
were calculated from the adjusted close price and stored.
To define the event, that will form the basis of the study; the program examines the returns and
extracts an event where the close price is below 10% lower than the preceding day's close price.
To generate an events data frame, the 10% threshold was applied, where positive events were
marked with 1 and negative events with -1. After identifying the events, the algorithm then
calculates abnormal returns by use of the approach proposed by MacKinlay in 1997. For the
model to be applied, an estimation period was set to 30 days and a Window over which the
abnormal returns are to be calculated and observed. For this we defined a window that extends 20
days before the event and 20 days after the even.
We take each cryptocurrency and derive the abnormal returns over the defined observation period
- before and after the event. The positive and negative events and their abnormal returns are
stored in separate python dictionaries. This is followed by the calculations of the cumulative
⊘ This is a preview!⊘
Do you want full access?
Subscribe today to unlock all pages.
Trusted by 1+ million students worldwide
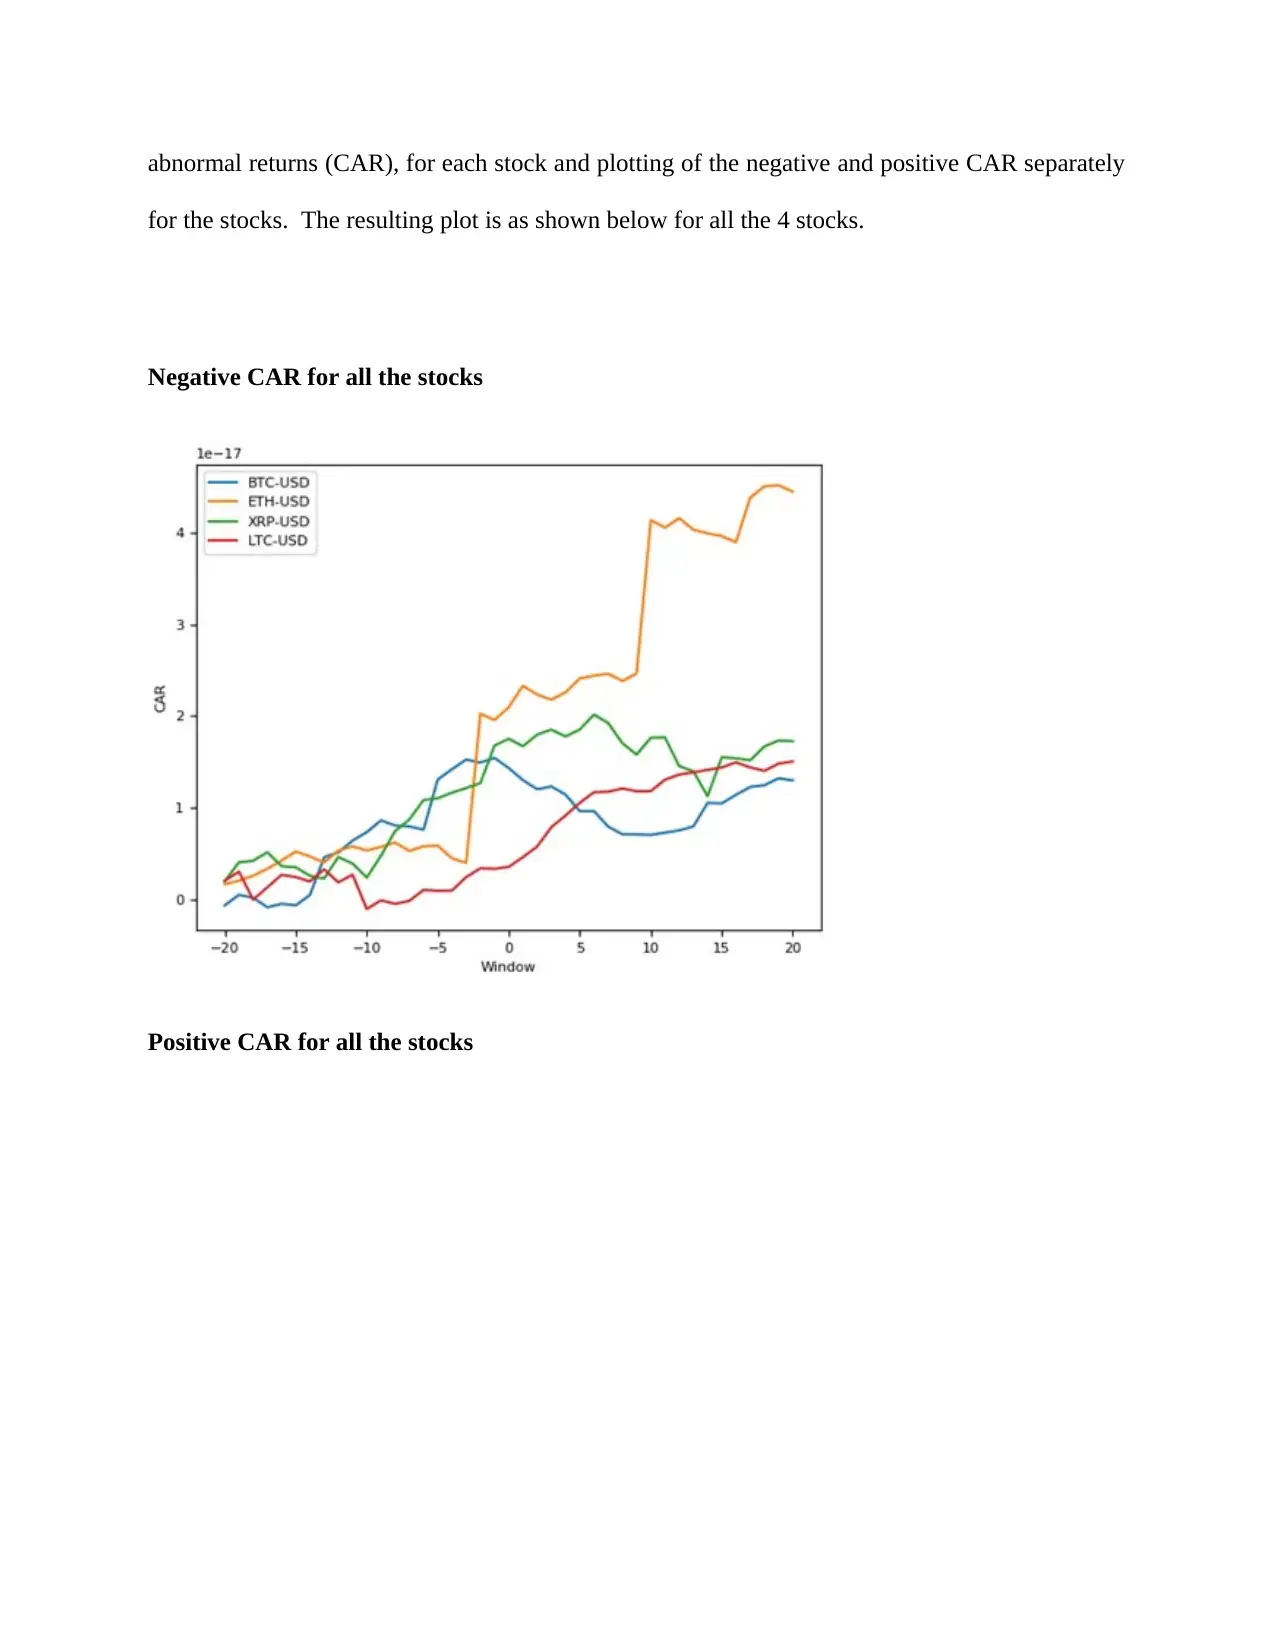
abnormal returns (CAR), for each stock and plotting of the negative and positive CAR separately
for the stocks. The resulting plot is as shown below for all the 4 stocks.
Negative CAR for all the stocks
Positive CAR for all the stocks
for the stocks. The resulting plot is as shown below for all the 4 stocks.
Negative CAR for all the stocks
Positive CAR for all the stocks
Paraphrase This Document
Need a fresh take? Get an instant paraphrase of this document with our AI Paraphraser
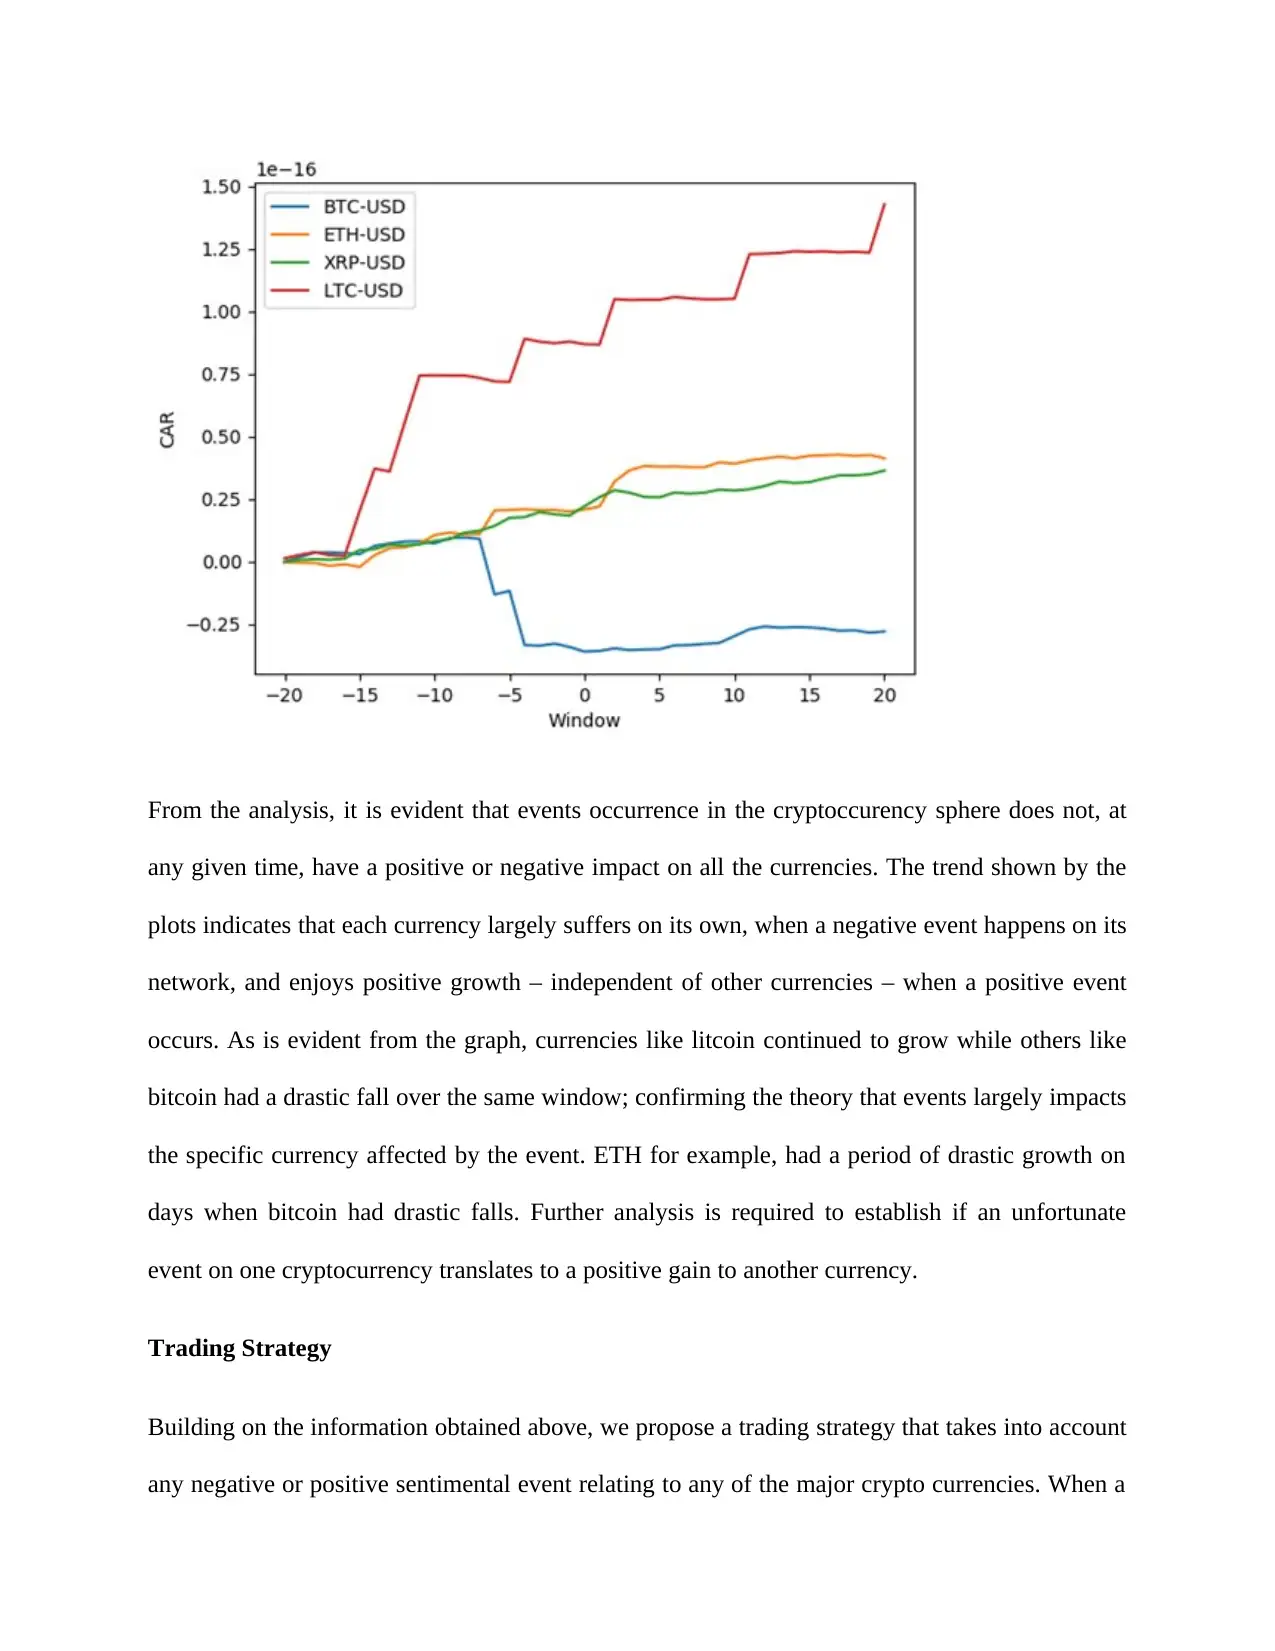
From the analysis, it is evident that events occurrence in the cryptoccurency sphere does not, at
any given time, have a positive or negative impact on all the currencies. The trend shown by the
plots indicates that each currency largely suffers on its own, when a negative event happens on its
network, and enjoys positive growth – independent of other currencies – when a positive event
occurs. As is evident from the graph, currencies like litcoin continued to grow while others like
bitcoin had a drastic fall over the same window; confirming the theory that events largely impacts
the specific currency affected by the event. ETH for example, had a period of drastic growth on
days when bitcoin had drastic falls. Further analysis is required to establish if an unfortunate
event on one cryptocurrency translates to a positive gain to another currency.
Trading Strategy
Building on the information obtained above, we propose a trading strategy that takes into account
any negative or positive sentimental event relating to any of the major crypto currencies. When a
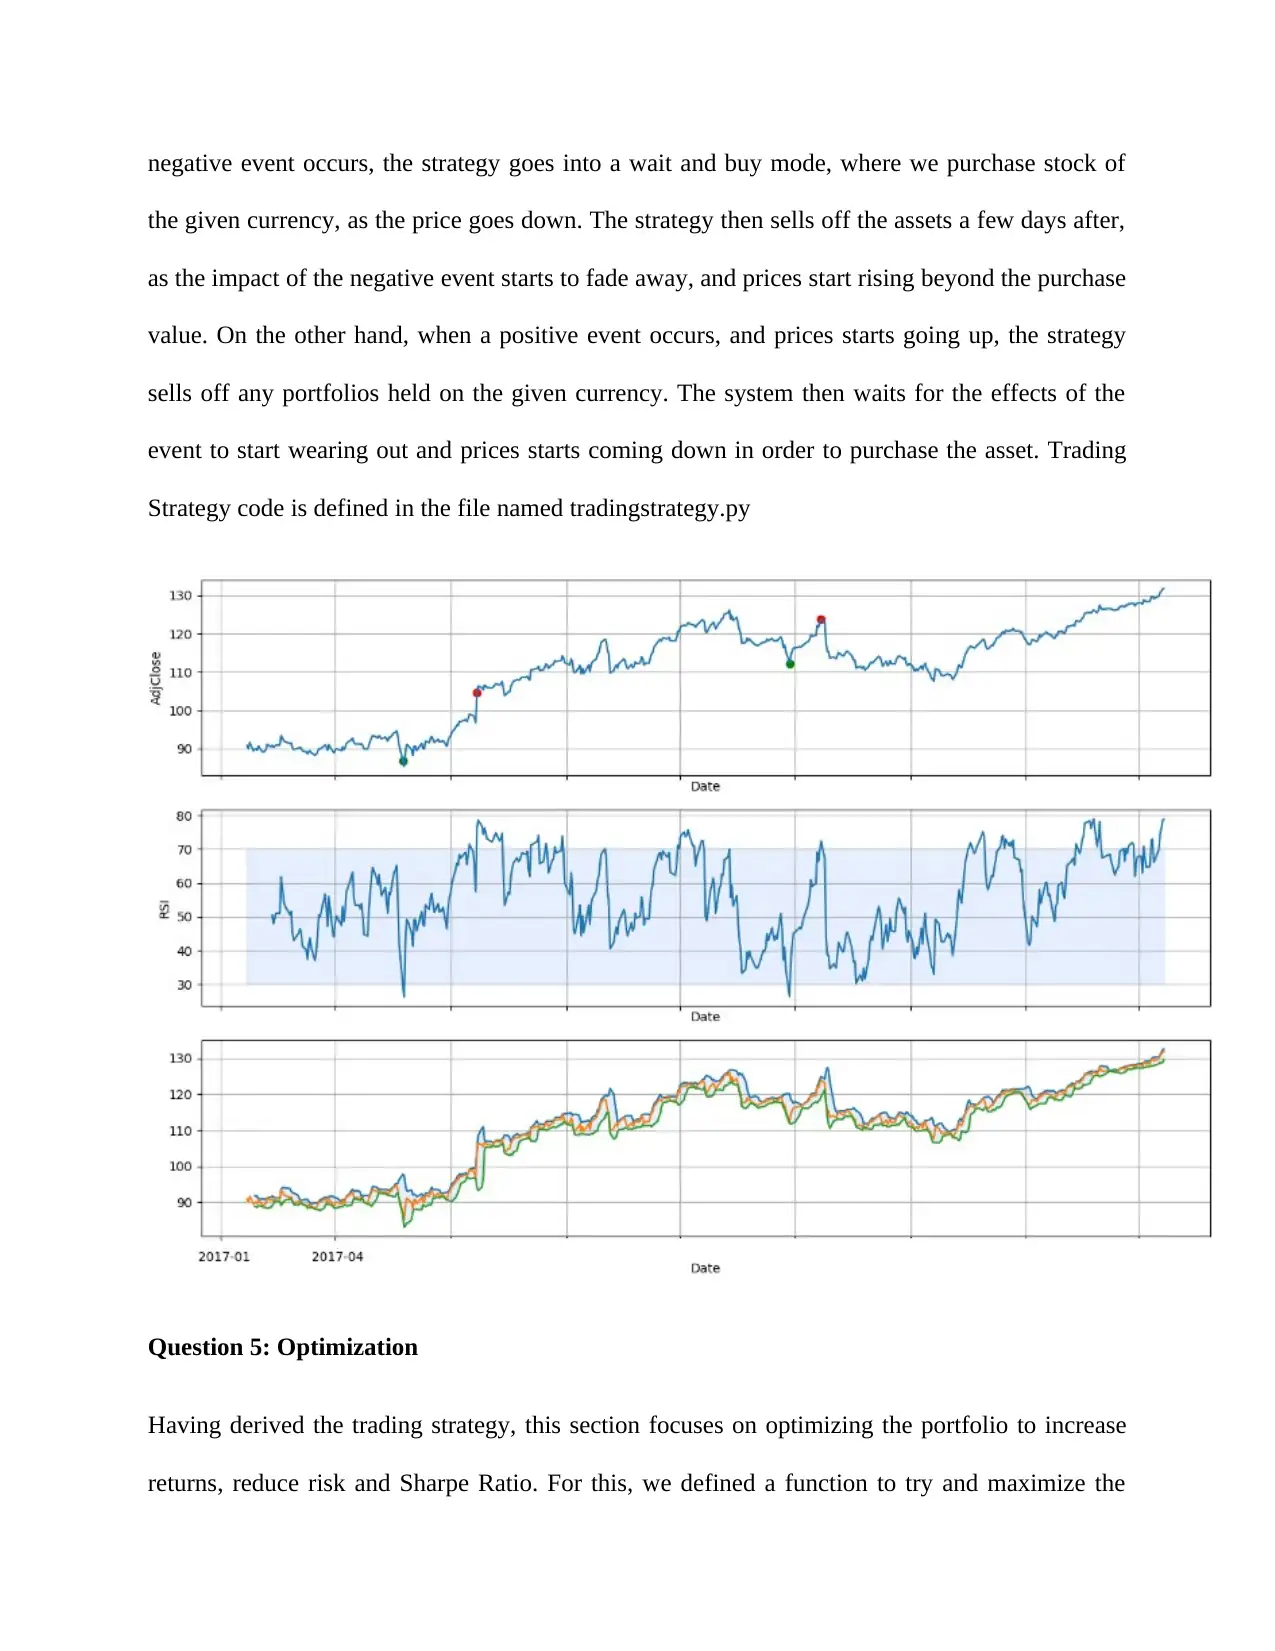
negative event occurs, the strategy goes into a wait and buy mode, where we purchase stock of
the given currency, as the price goes down. The strategy then sells off the assets a few days after,
as the impact of the negative event starts to fade away, and prices start rising beyond the purchase
value. On the other hand, when a positive event occurs, and prices starts going up, the strategy
sells off any portfolios held on the given currency. The system then waits for the effects of the
event to start wearing out and prices starts coming down in order to purchase the asset. Trading
Strategy code is defined in the file named tradingstrategy.py
Question 5: Optimization
Having derived the trading strategy, this section focuses on optimizing the portfolio to increase
returns, reduce risk and Sharpe Ratio. For this, we defined a function to try and maximize the
⊘ This is a preview!⊘
Do you want full access?
Subscribe today to unlock all pages.
Trusted by 1+ million students worldwide
1 out of 15
Related Documents


Your All-in-One AI-Powered Toolkit for Academic Success.
+13062052269
info@desklib.com
Available 24*7 on WhatsApp / Email
![[object Object]](/_next/static/media/star-bottom.7253800d.svg)
Unlock your academic potential
Copyright © 2020–2026 A2Z Services. All Rights Reserved. Developed and managed by ZUCOL.