Comparative Analysis of Tour Business Revenue Data: 2014-2016 Report
VerifiedAdded on 2023/04/04
|17
|563
|258
Report
AI Summary
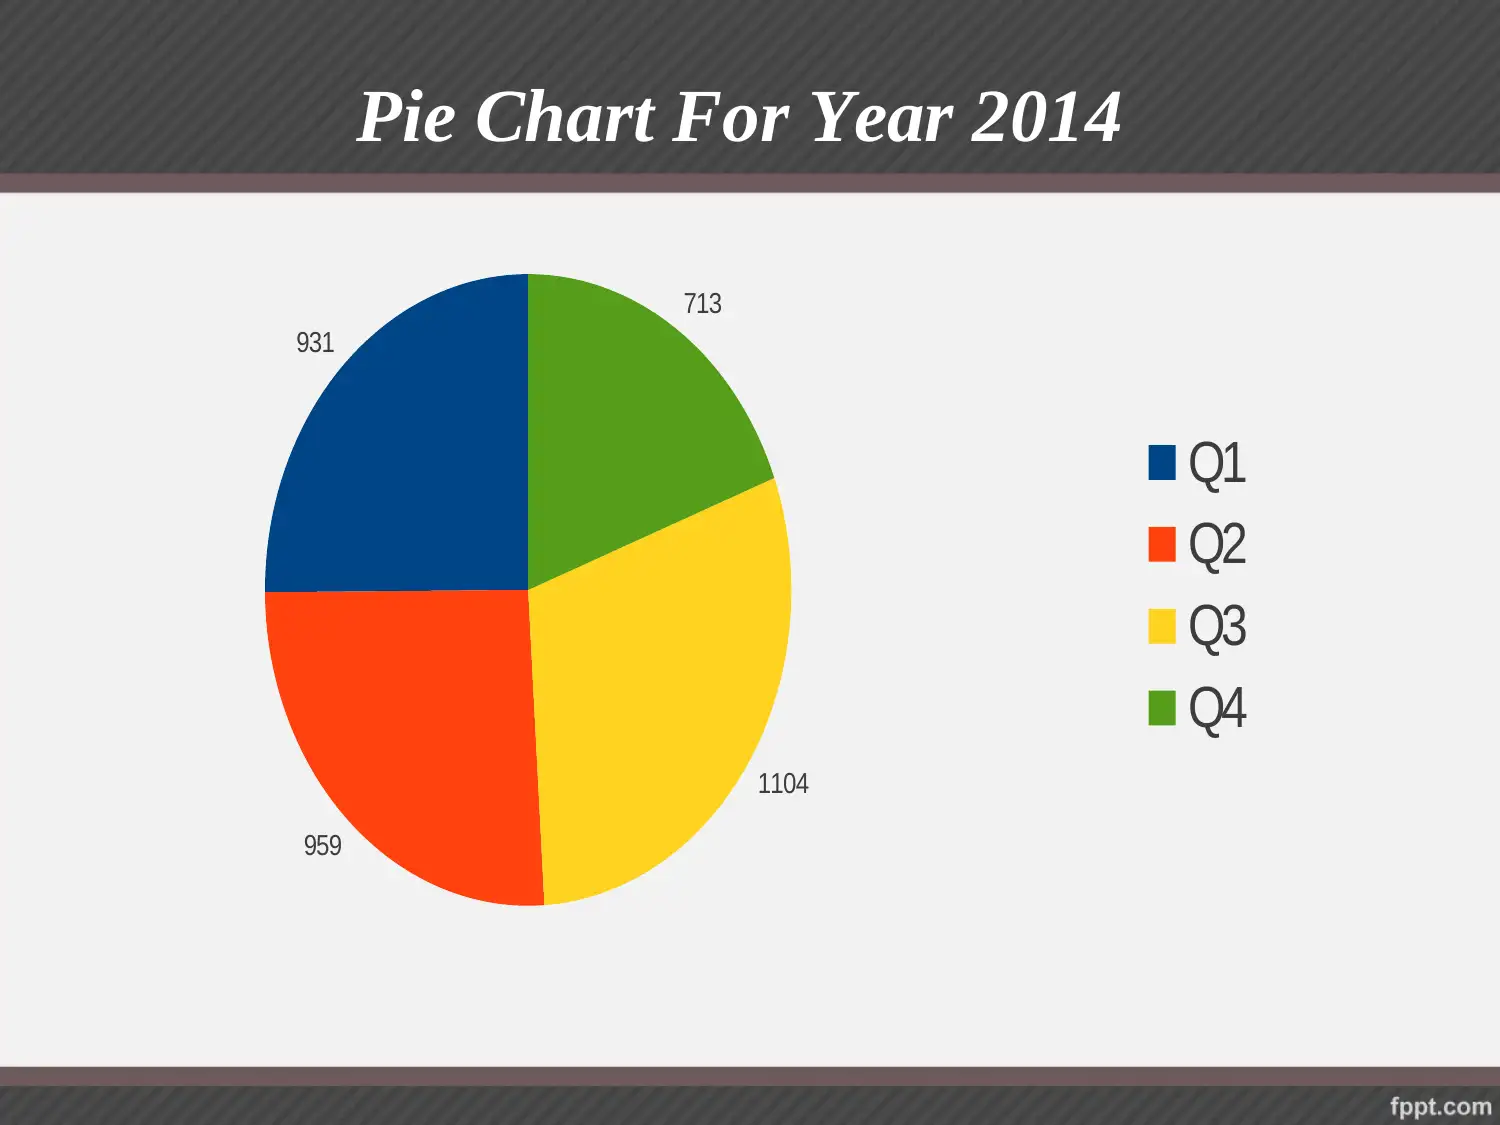
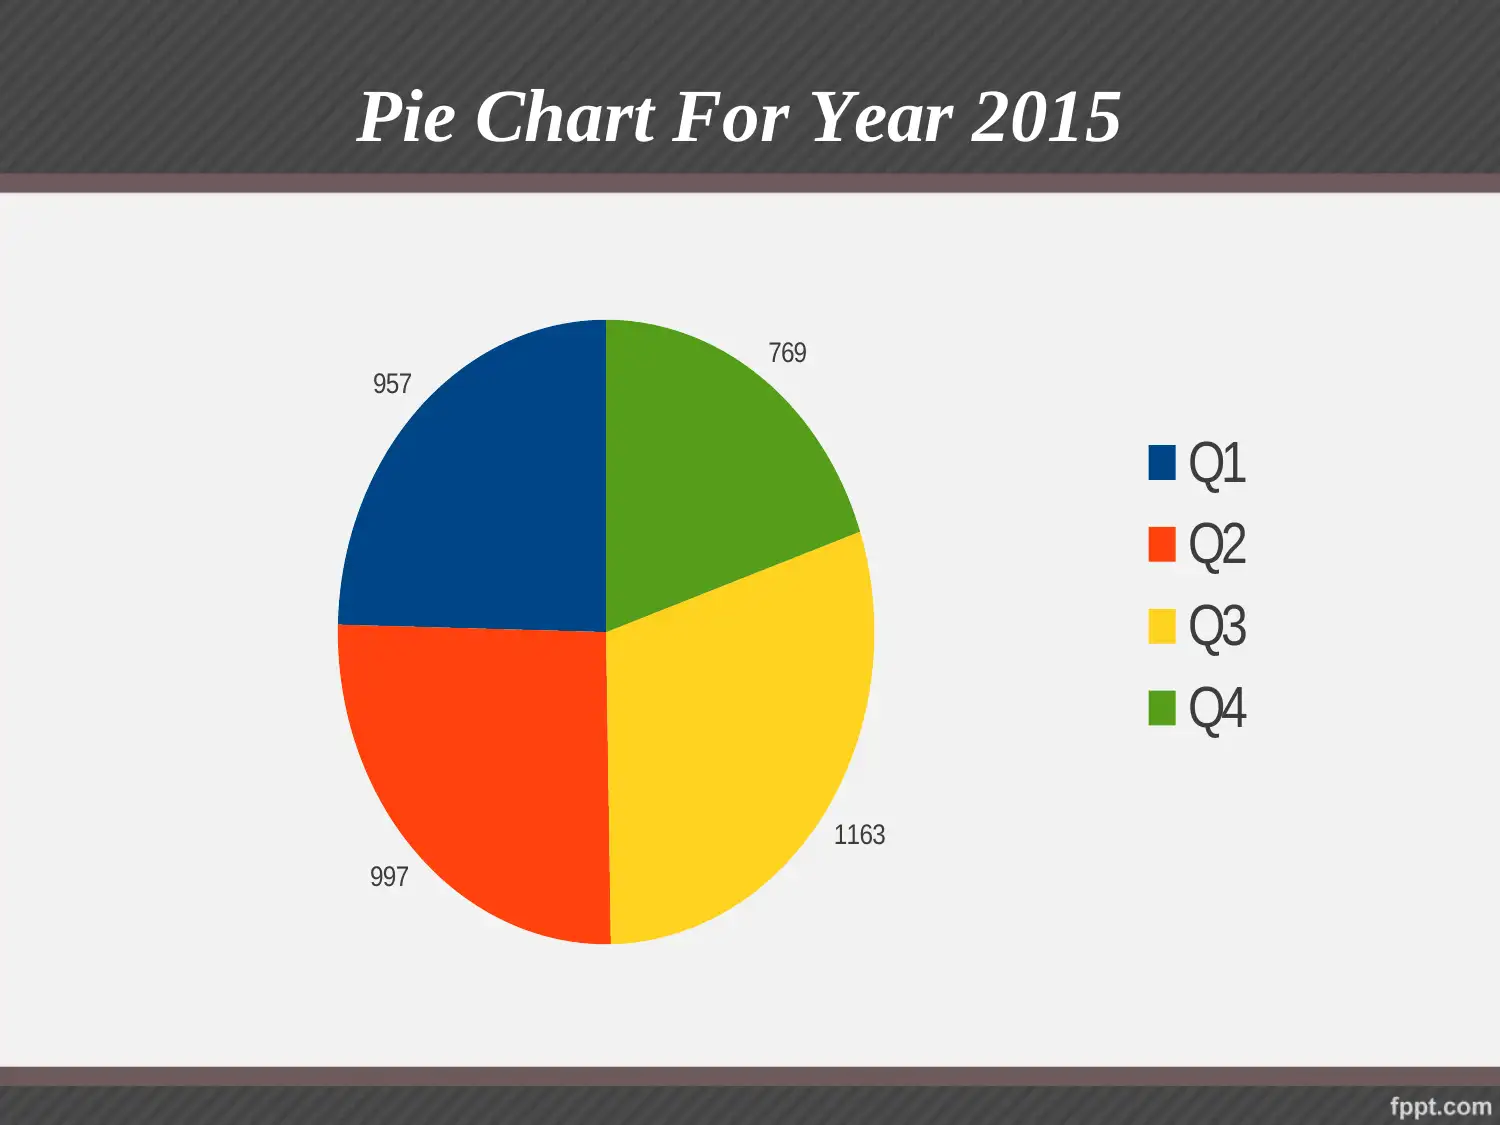
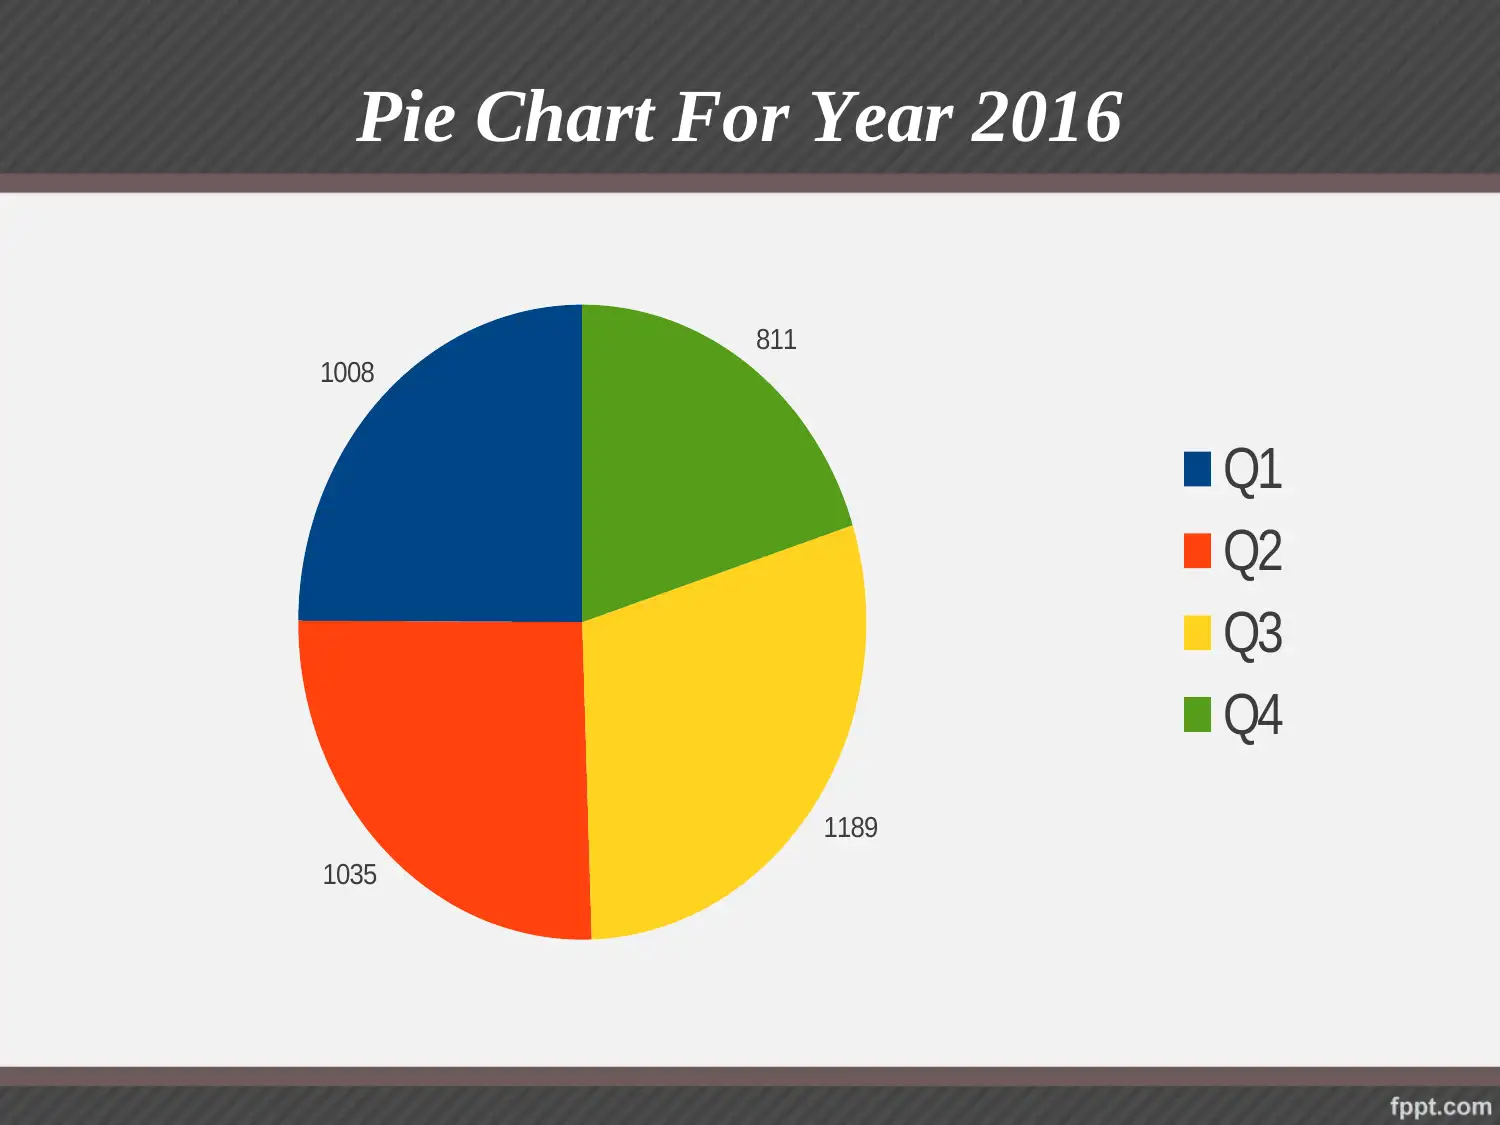
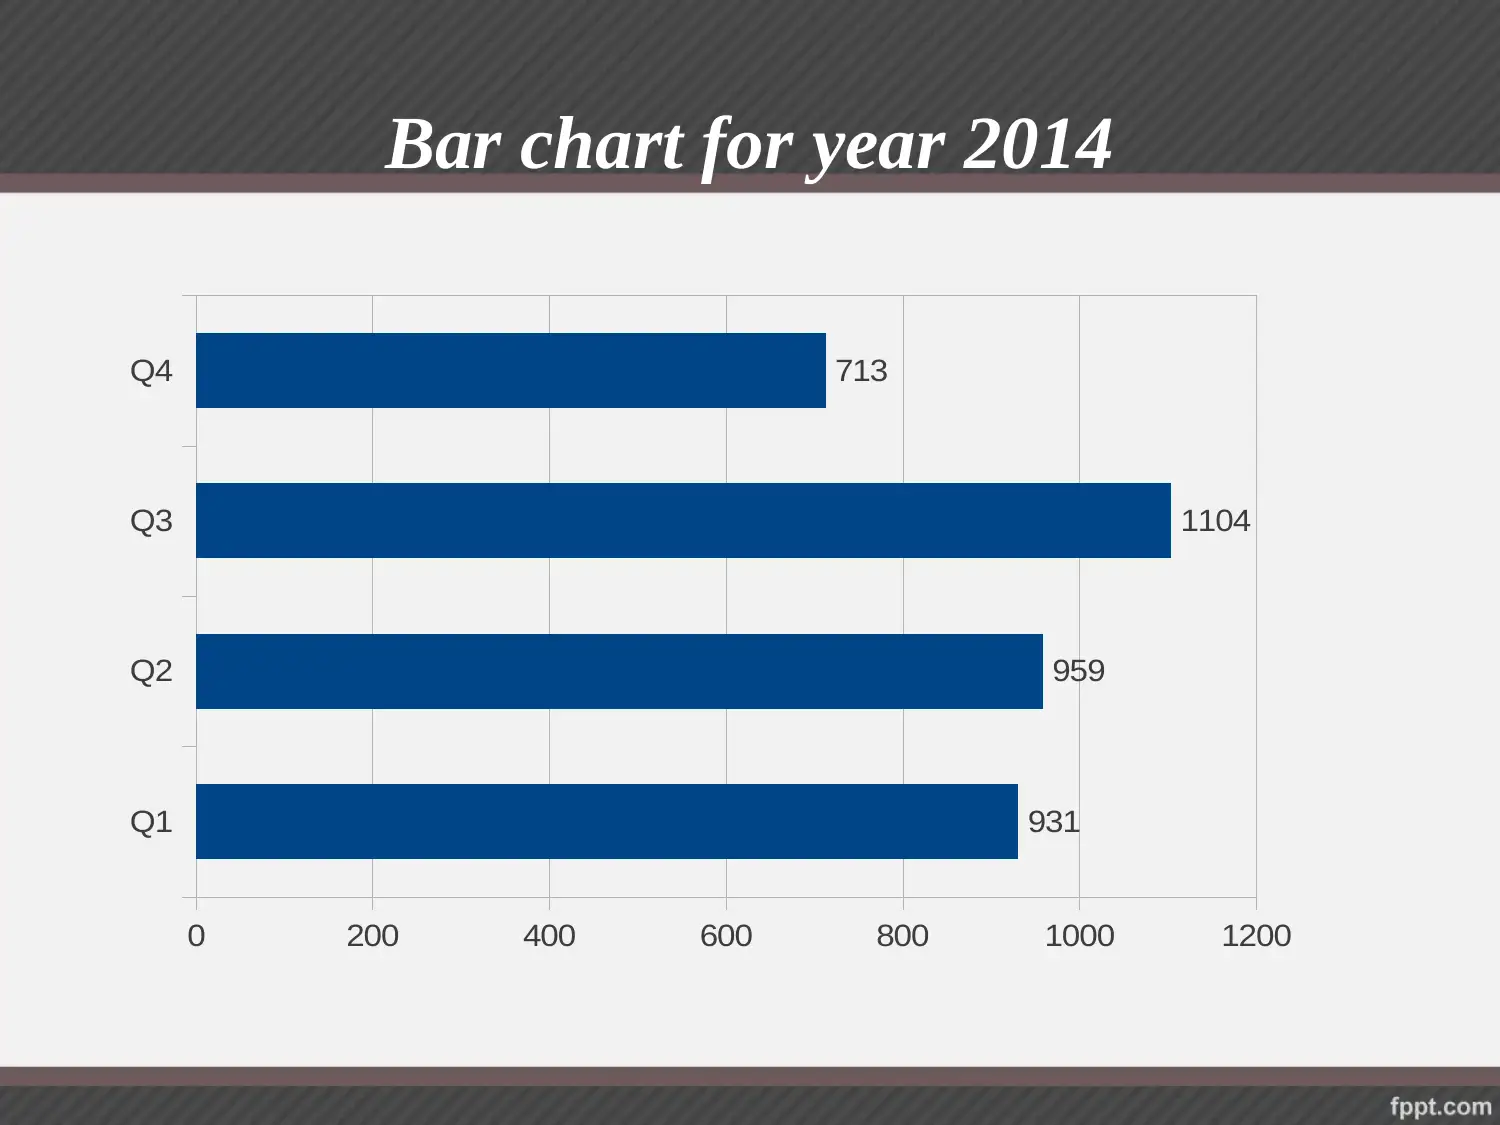
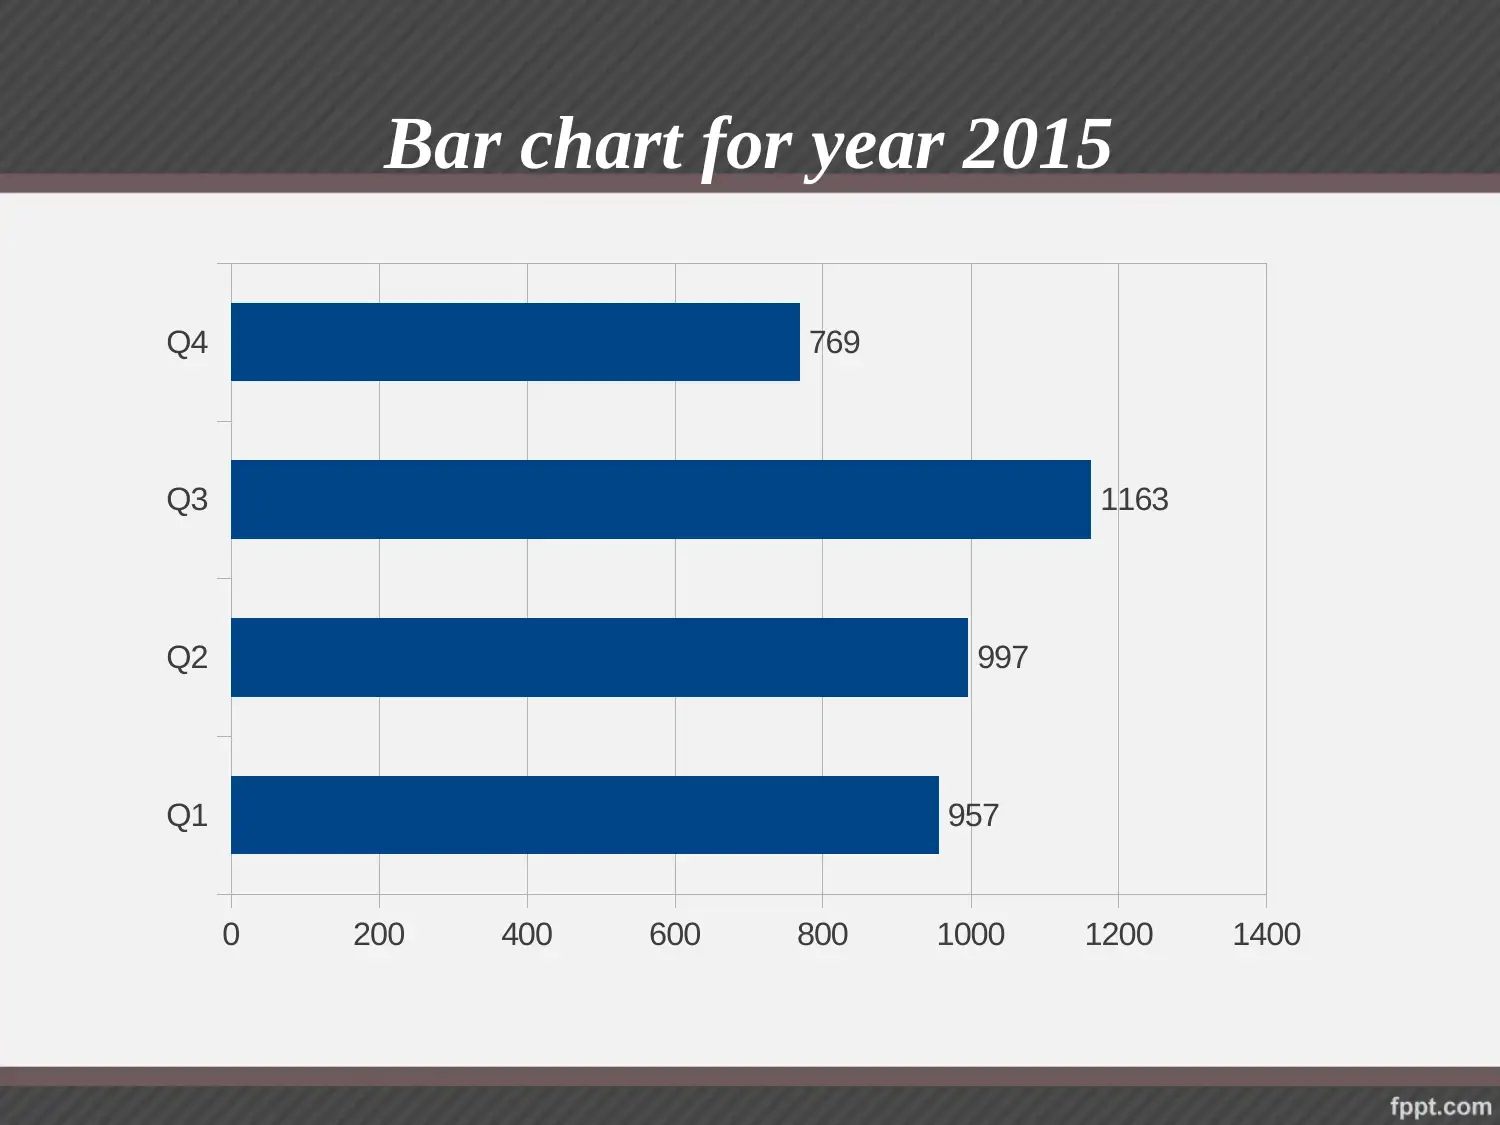
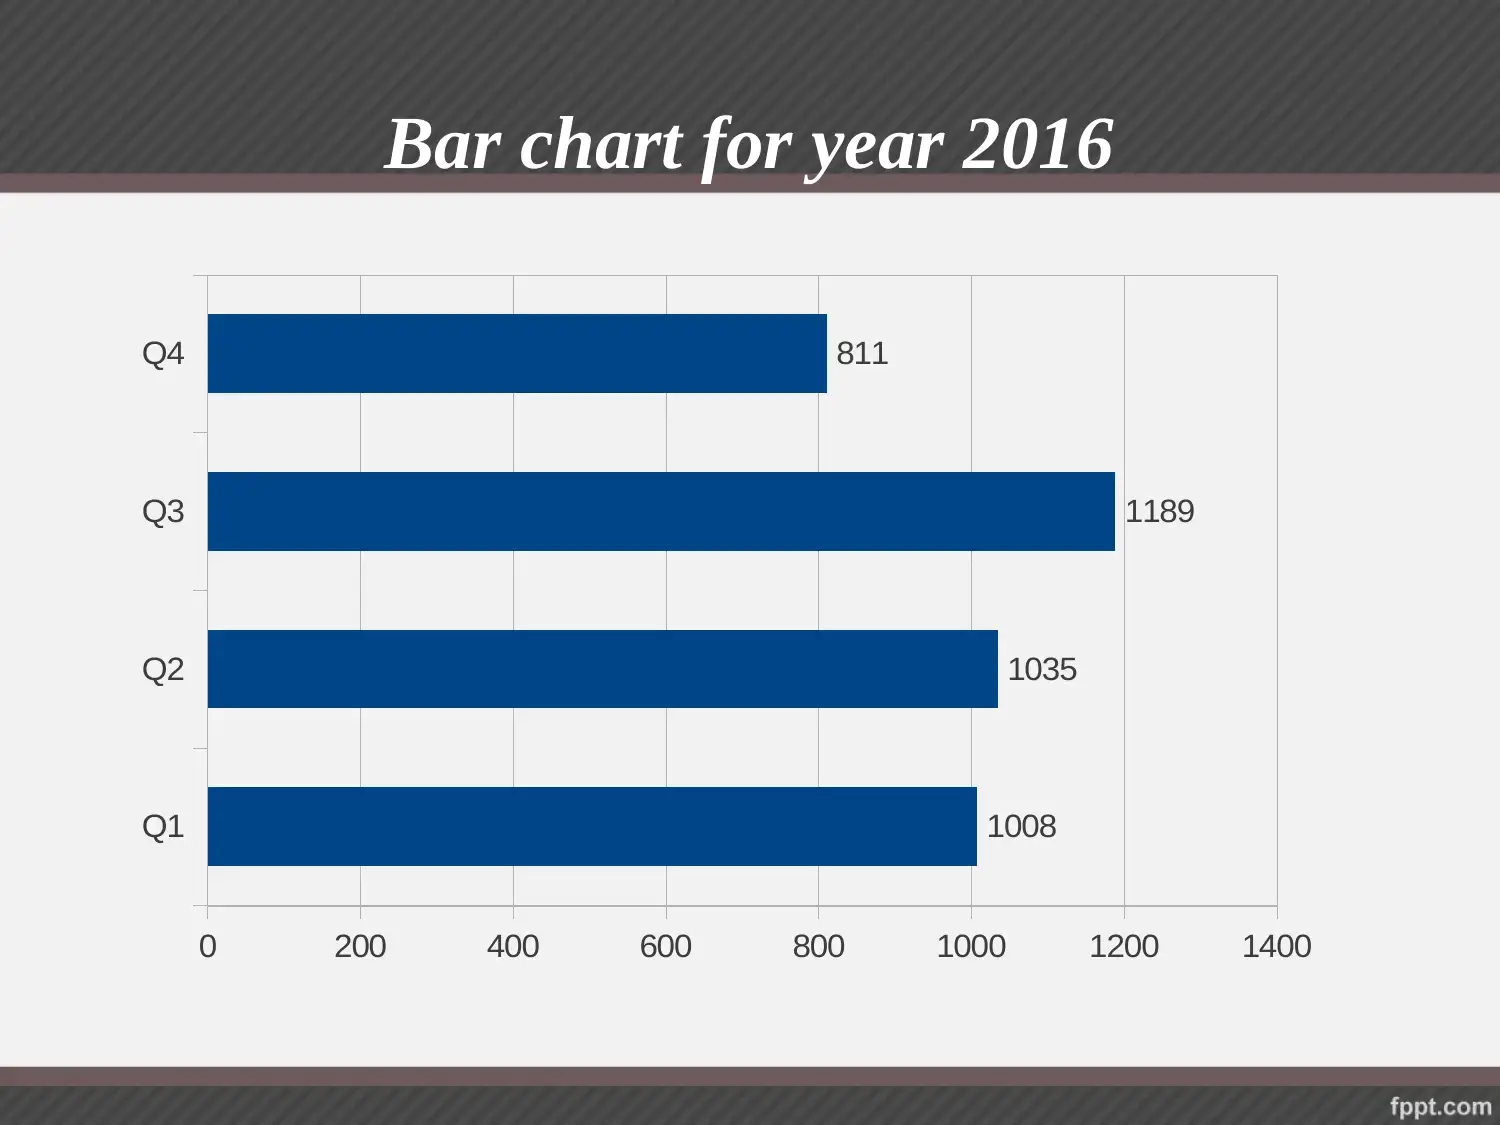
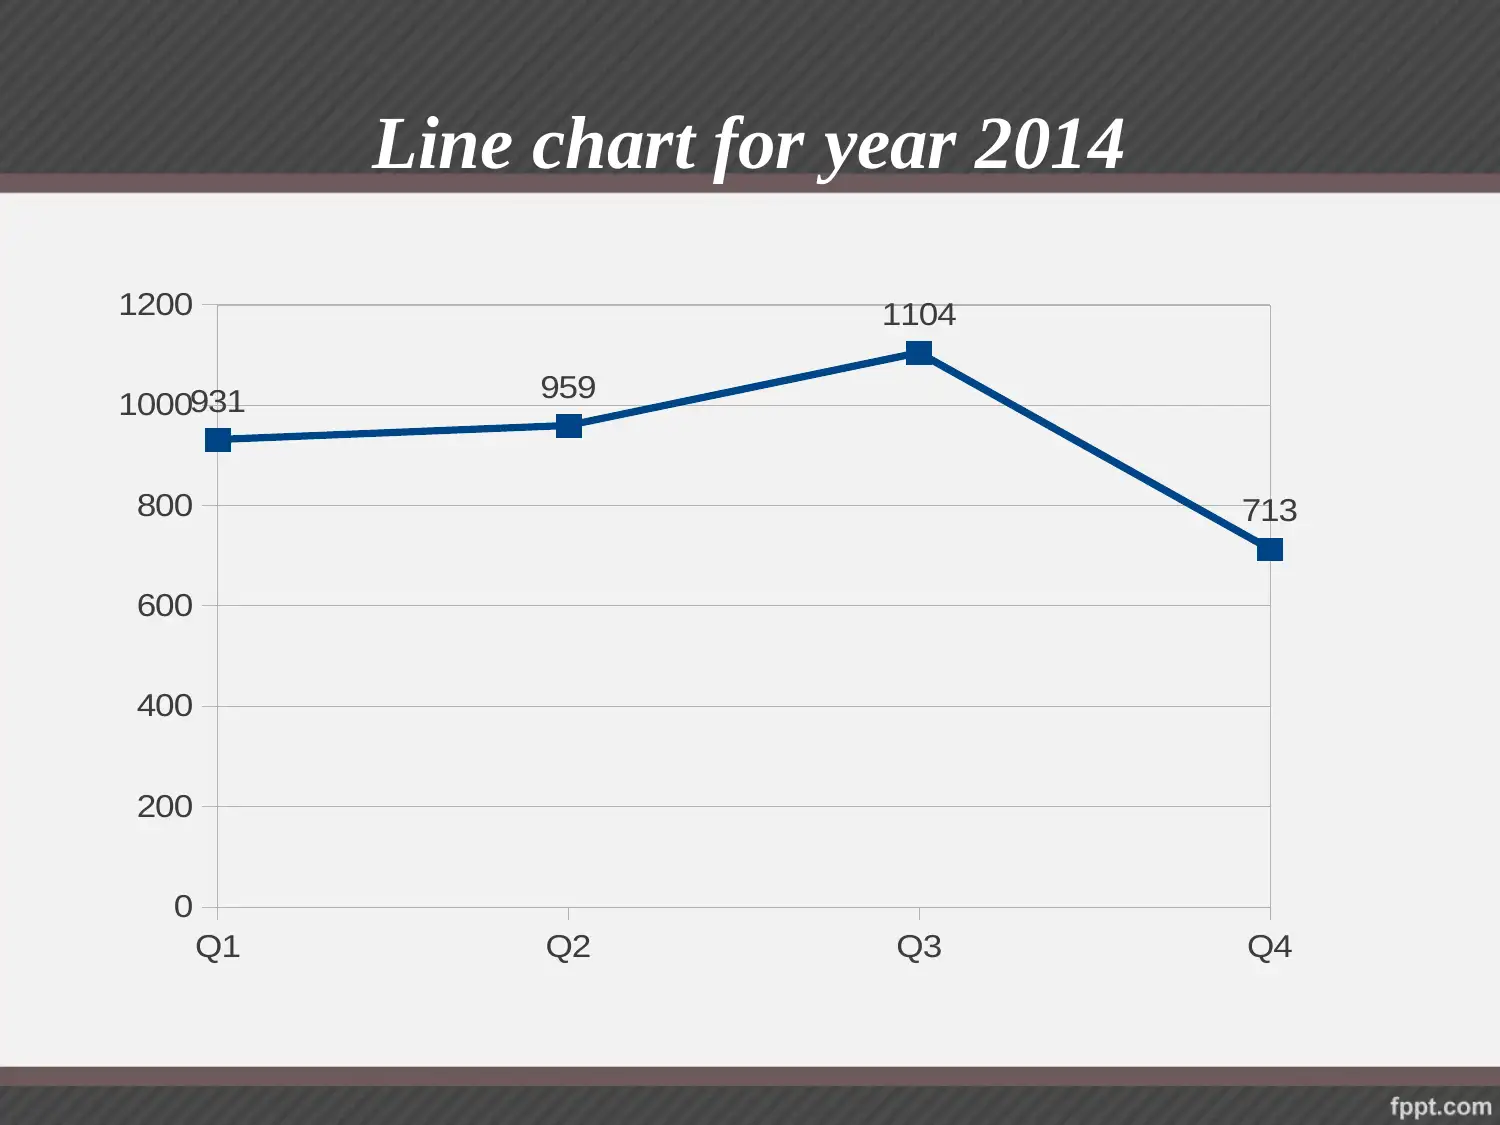
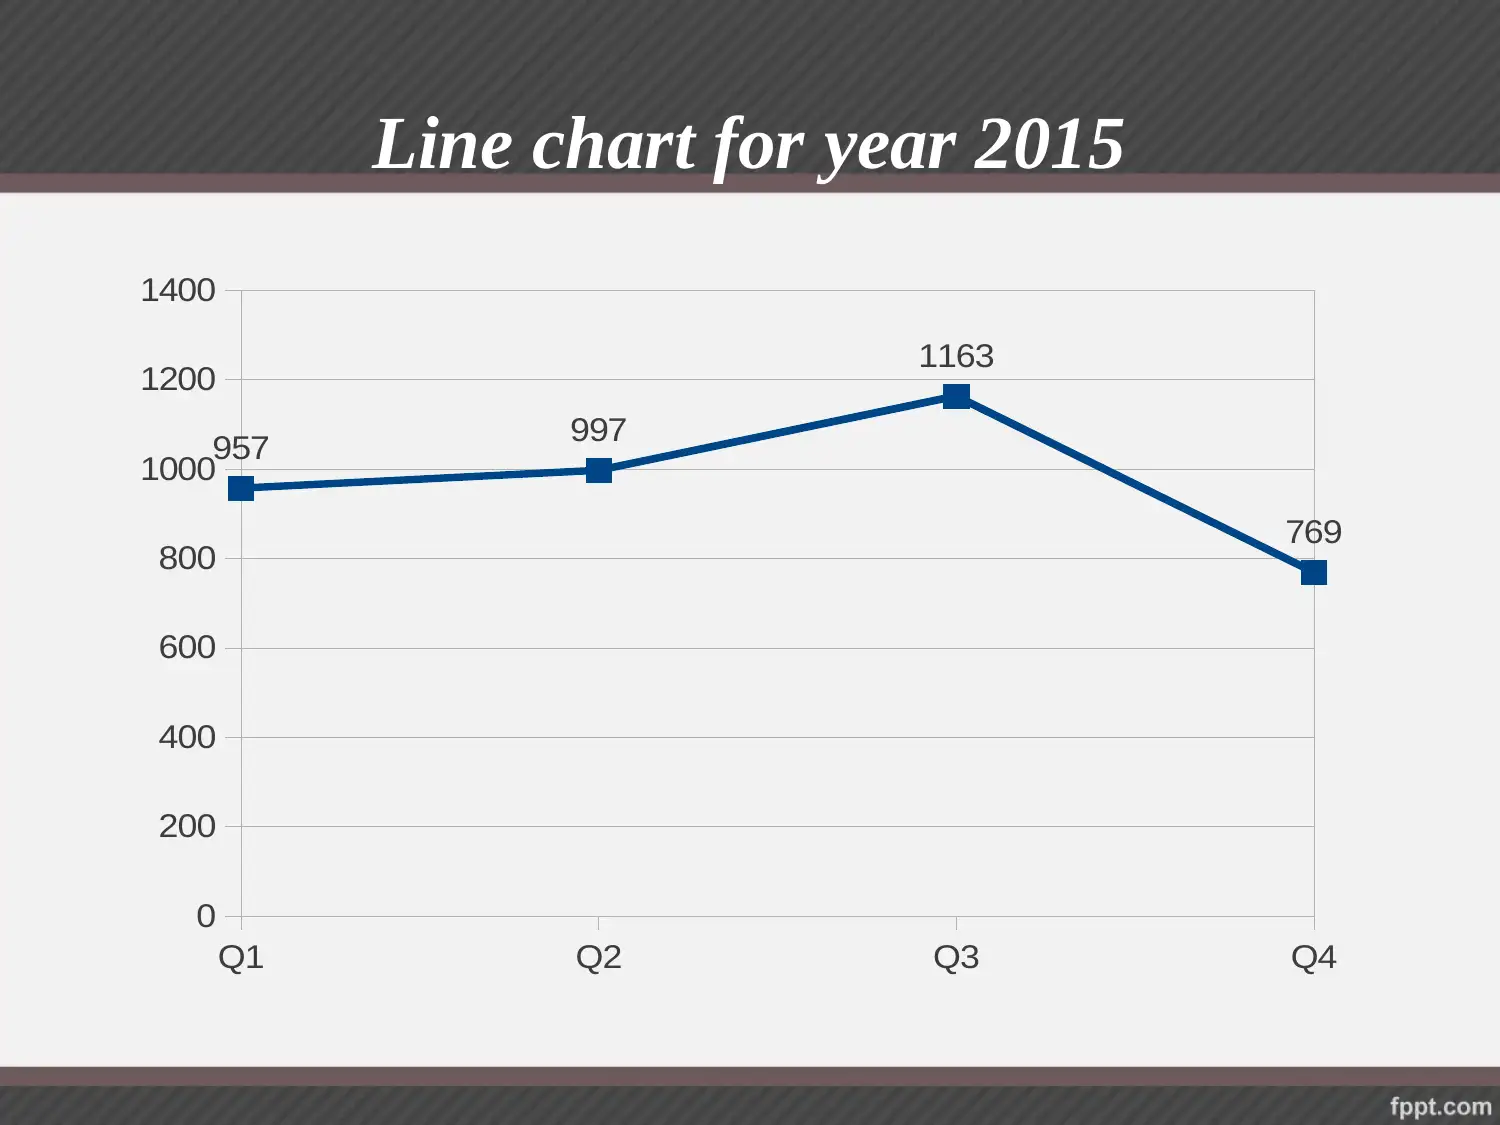
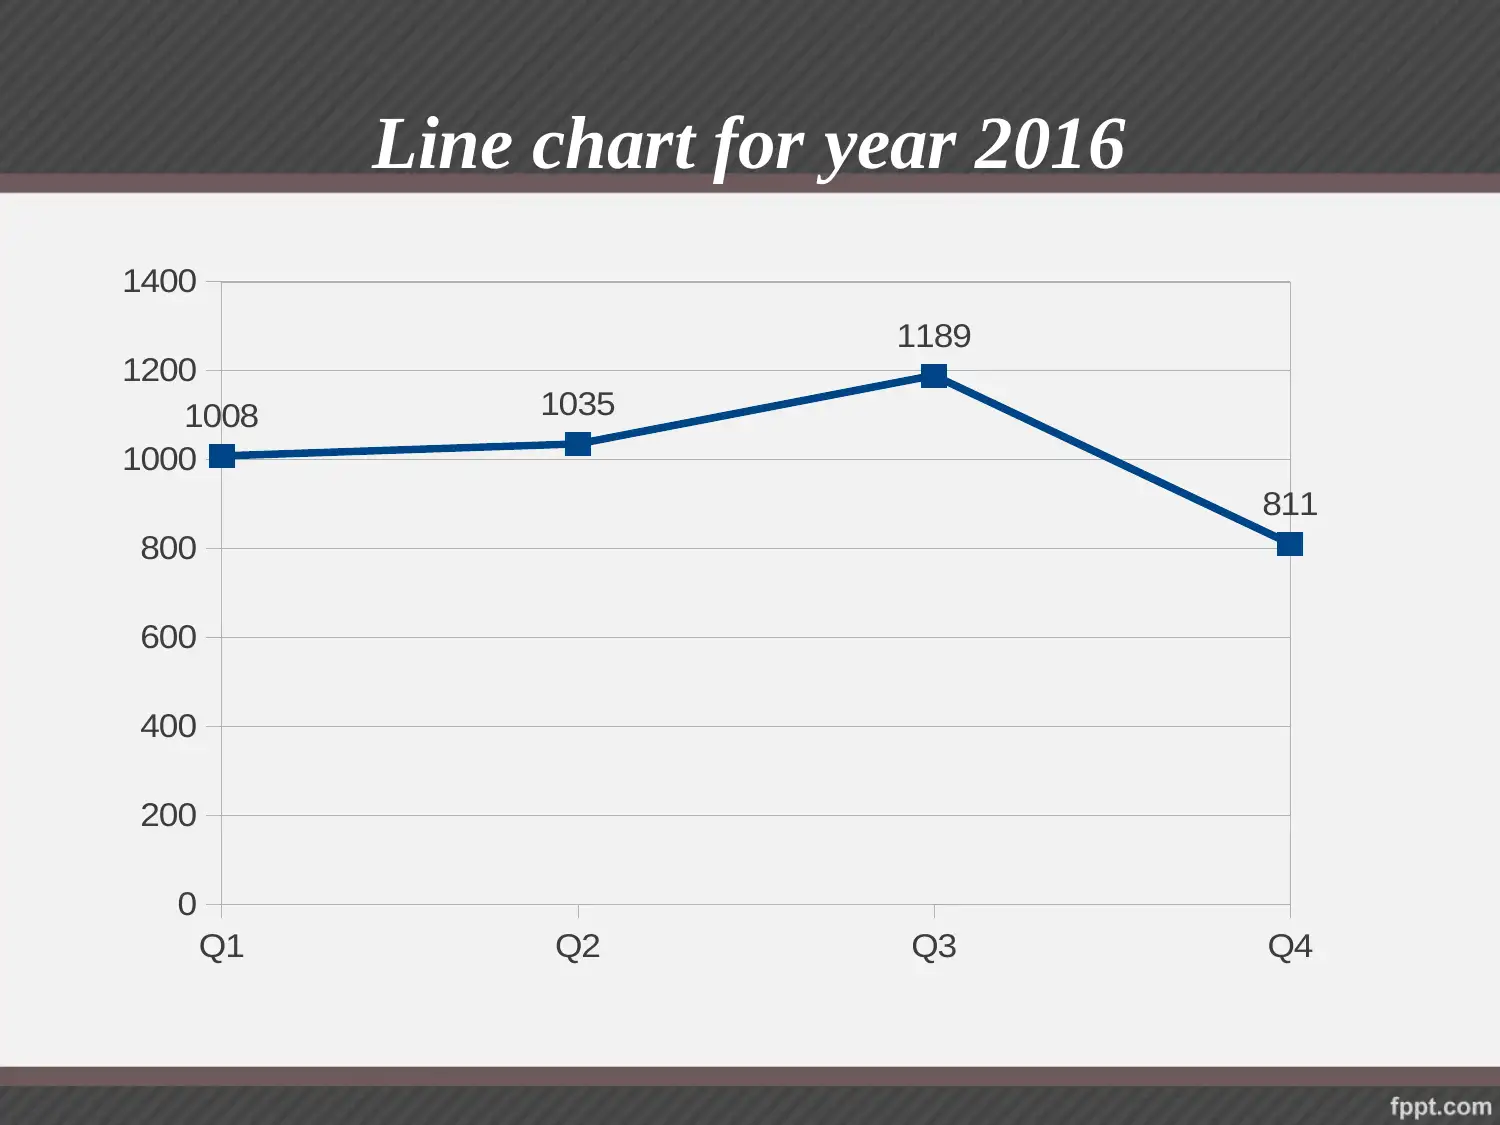
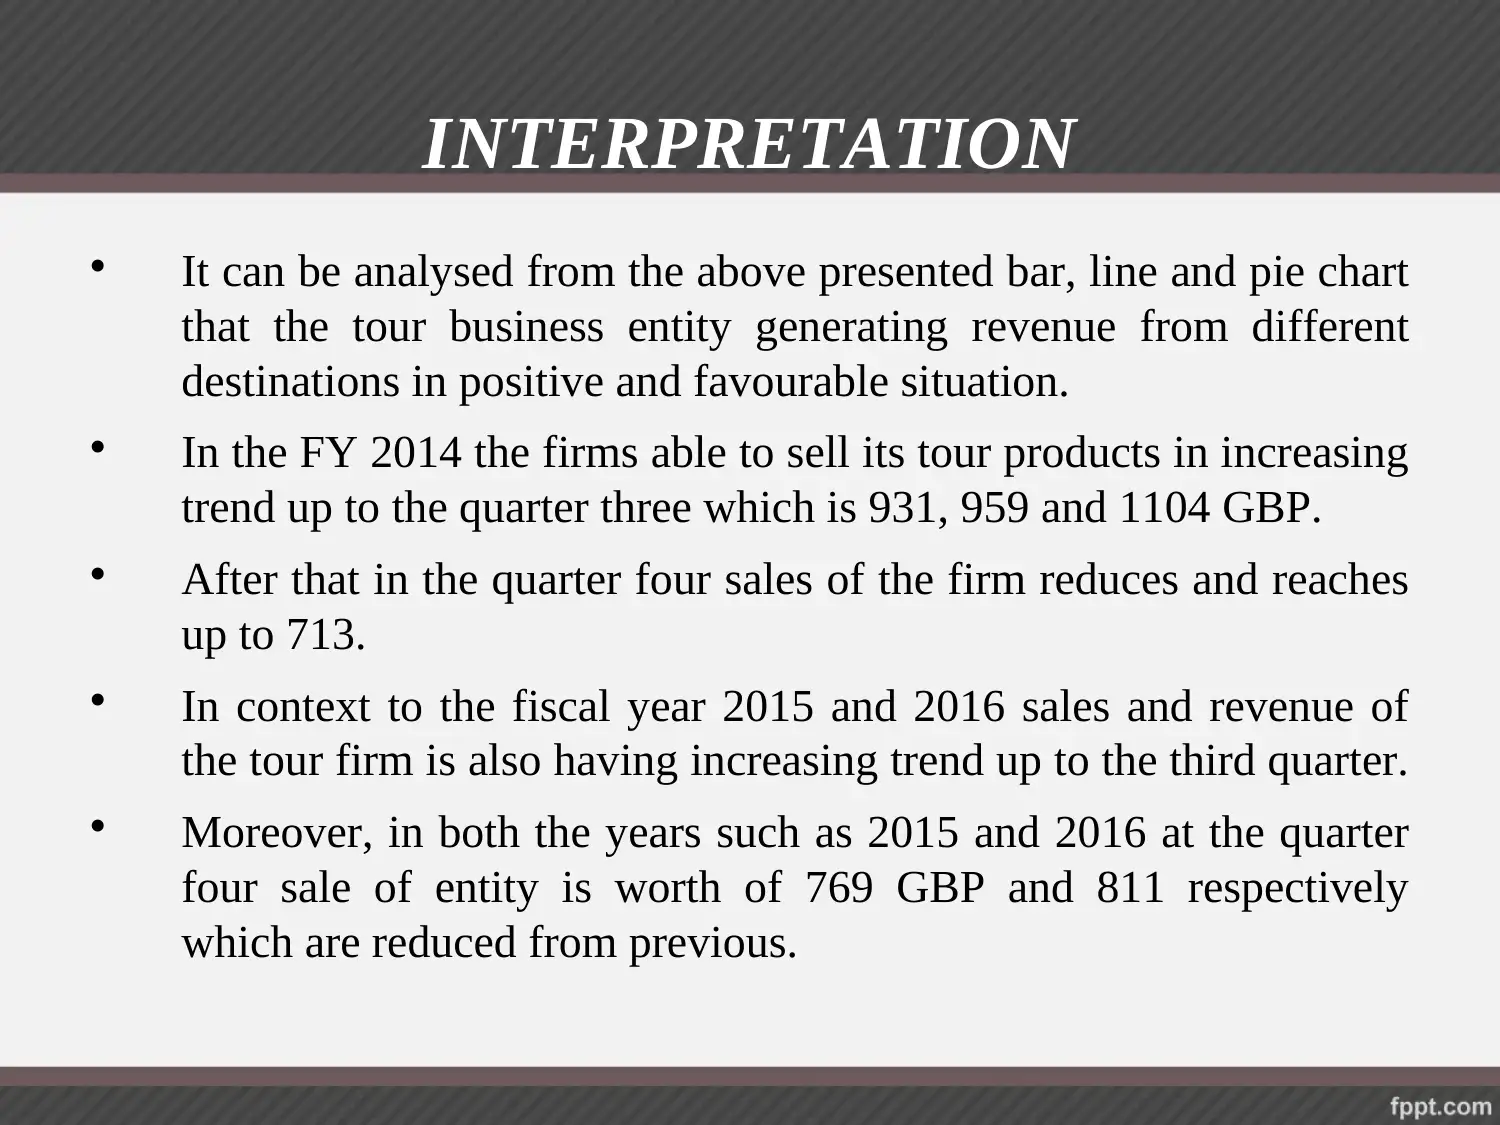
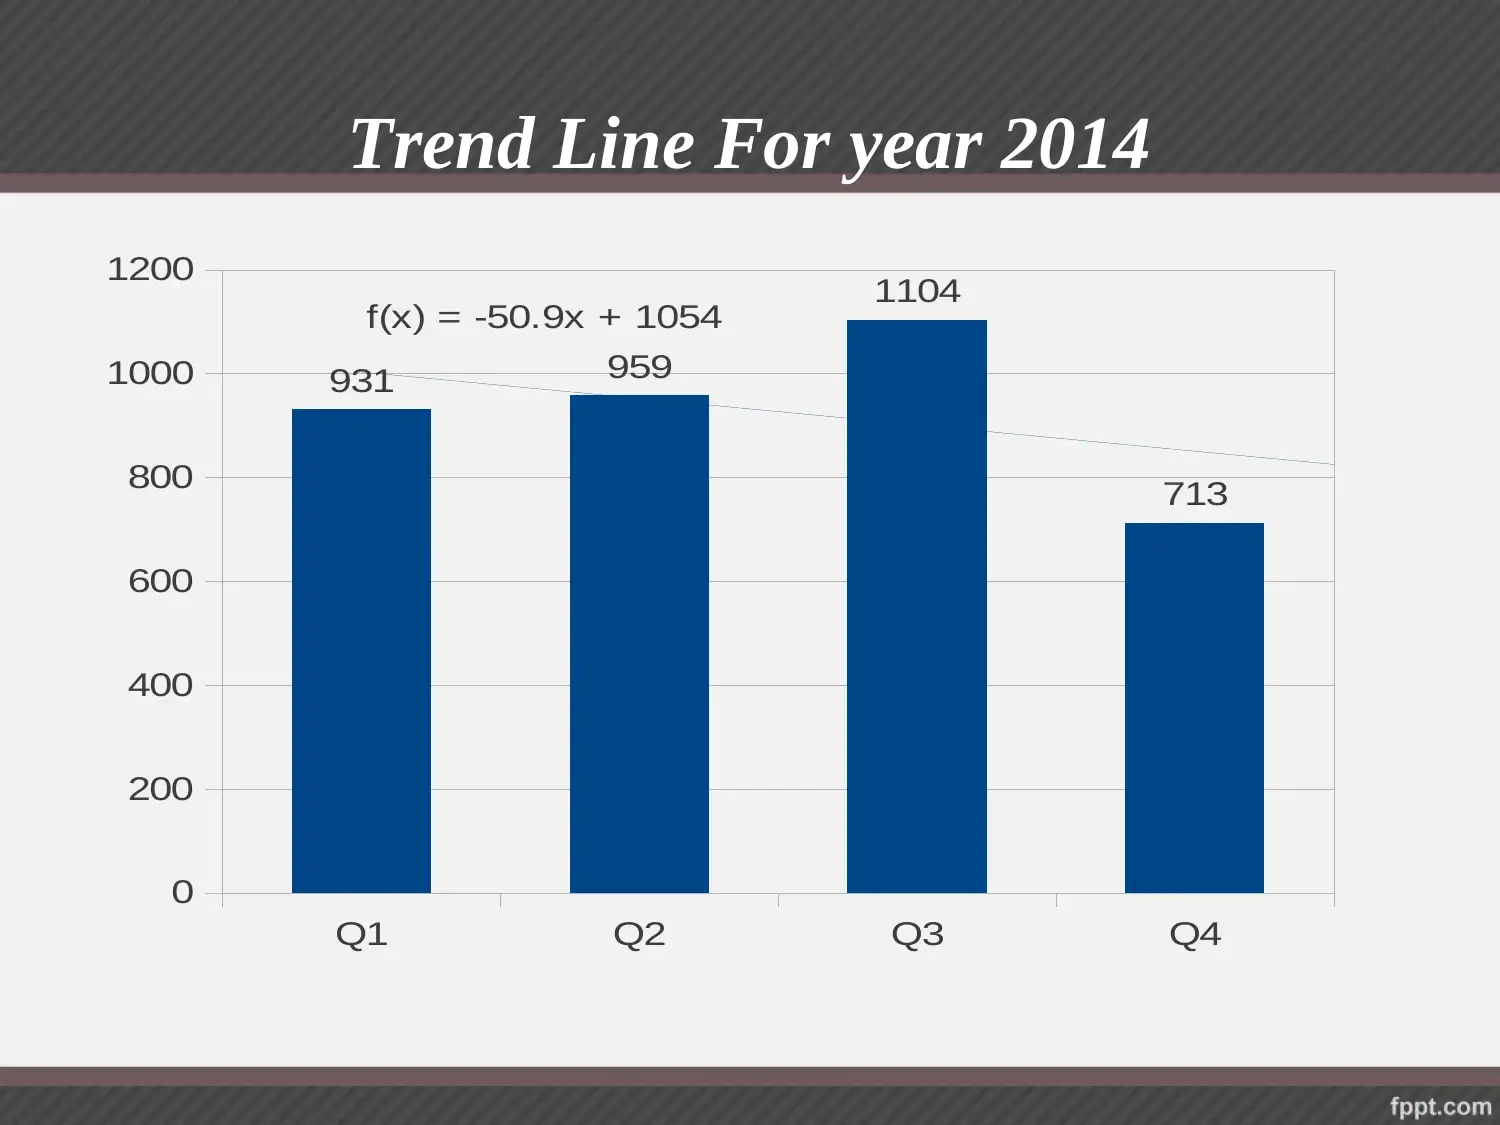
This report provides a detailed analysis of a tour business's quarterly revenue data from 2014 to 2016. The analysis utilizes pie charts, bar charts, and line charts to visualize sales trends across different quarters. The report interprets the data, highlighting both positive and negative trends, such as the initial increasing sales up to Q3 followed by a decline in Q4 for each year. Trend lines are also presented, indicating a decreasing sales trend over the years, with the most significant decline in 2014. The interpretations suggest the need for effective marketing strategies to attract more customers and improve profitability. The report concludes with references to relevant academic sources.

1 out of 17
Related Documents


Your All-in-One AI-Powered Toolkit for Academic Success.
+13062052269
info@desklib.com
Available 24*7 on WhatsApp / Email
![[object Object]](/_next/static/media/star-bottom.7253800d.svg)
Copyright © 2020–2026 A2Z Services. All Rights Reserved. Developed and managed by ZUCOL.