Statistics Assignment: Financial Data Analysis and Hypothesis Testing
VerifiedAdded on 2019/11/08
|20
|1881
|308
Homework Assignment
AI Summary
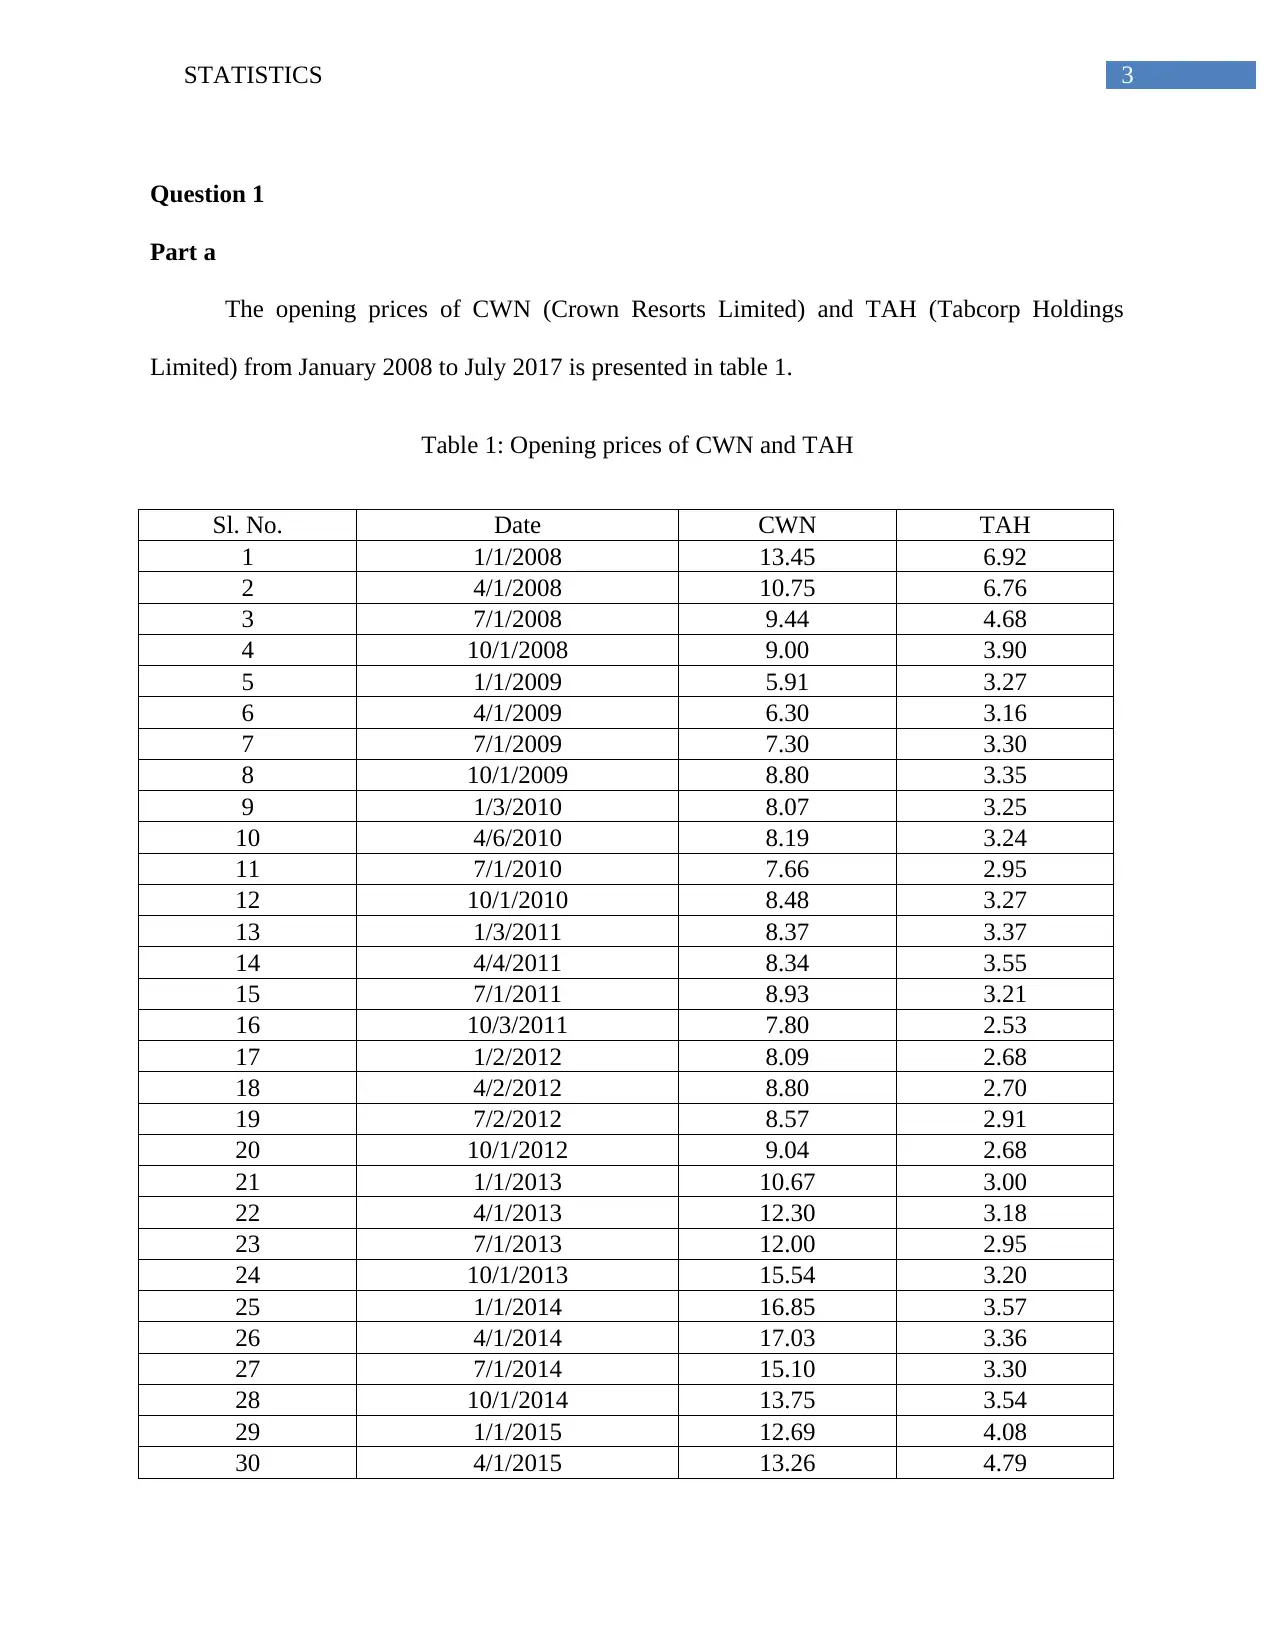
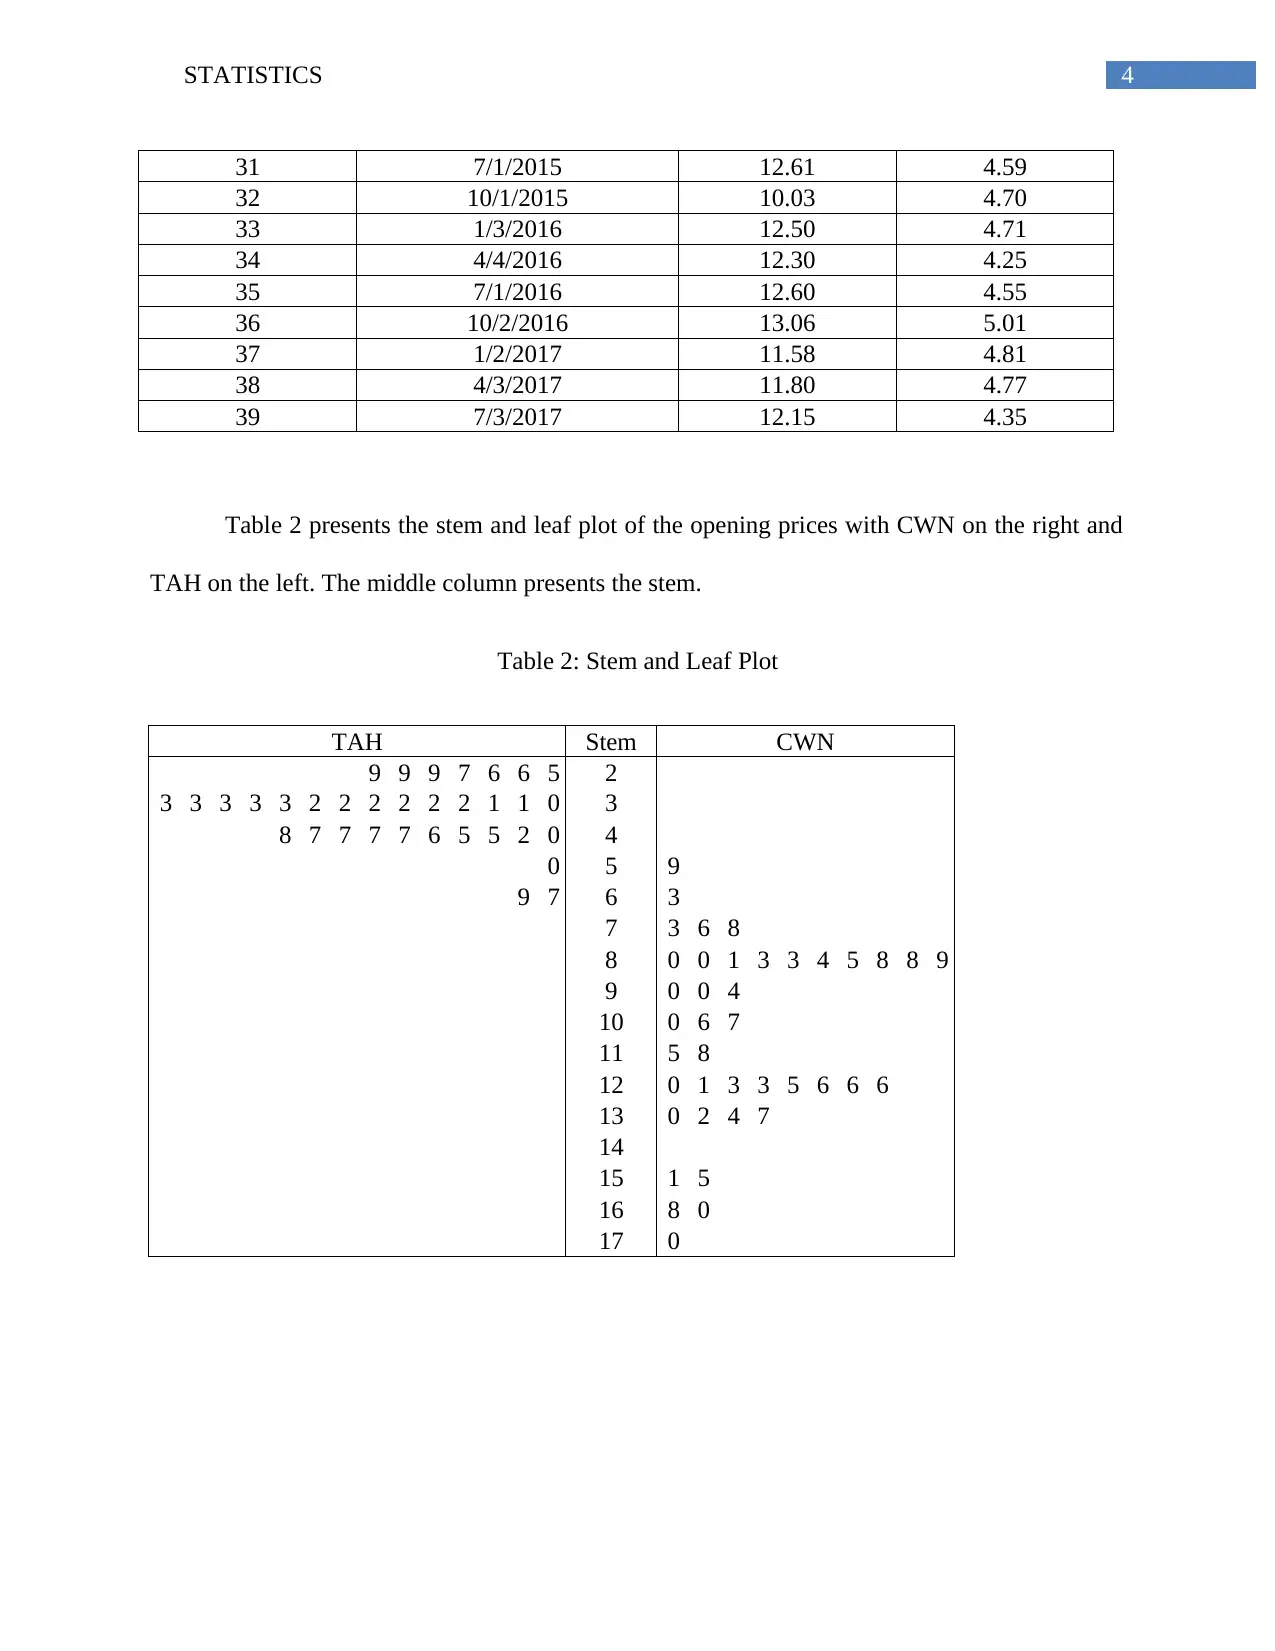
This statistics assignment presents a comprehensive analysis of financial data using various statistical methods. The assignment begins with an analysis of stock prices for Crown Resorts Limited (CWN) and Tabcorp Holdings Limited (TAH), including stem and leaf plots, and a comparison of their market capital. The document proceeds to analyze annual dividends of banks, including CBA, NAB, ANZ, and WBC, using measures like mean, median, standard deviation, and coefficient of variation. Further, the assignment delves into probability calculations related to student enrollment data and rainfall patterns. Finally, it investigates the prediction of bankruptcy using financial ratios, including normal probability plots and hypothesis testing for various ratios like NP/TA, TL/TA, WC/TA, OE/TL, PS/TS, and TC/TS. The document includes tables, figures and references to support the analysis and conclusions drawn. This assignment provides a detailed application of statistical concepts to real-world financial scenarios.

Running head : STATISTICS
Statistics
Name of the student
Name of the university
Author’s note
Statistics
Name of the student
Name of the university
Author’s note
Paraphrase This Document
Need a fresh take? Get an instant paraphrase of this document with our AI Paraphraser

1STATISTICS
Table of Contents
Question 1........................................................................................................................................3
Part a............................................................................................................................................3
Part b............................................................................................................................................6
Part c............................................................................................................................................6
Part d............................................................................................................................................7
Question 2........................................................................................................................................8
Part a............................................................................................................................................8
Part b............................................................................................................................................9
Part c..........................................................................................................................................10
Part d..........................................................................................................................................10
Question 3......................................................................................................................................10
Part a..........................................................................................................................................10
Part b..........................................................................................................................................10
Part c..........................................................................................................................................11
Part d..........................................................................................................................................11
Question 4......................................................................................................................................12
Part a..........................................................................................................................................13
Part i.......................................................................................................................................15

2STATISTICS
Part ii......................................................................................................................................16
Part b..........................................................................................................................................16
Part i.......................................................................................................................................16
Part ii......................................................................................................................................16
Question 5......................................................................................................................................16
Part a..........................................................................................................................................16
Part b..........................................................................................................................................20
Part c..........................................................................................................................................20
Part ii......................................................................................................................................16
Part b..........................................................................................................................................16
Part i.......................................................................................................................................16
Part ii......................................................................................................................................16
Question 5......................................................................................................................................16
Part a..........................................................................................................................................16
Part b..........................................................................................................................................20
Part c..........................................................................................................................................20
⊘ This is a preview!⊘
Do you want full access?
Subscribe today to unlock all pages.

Trusted by 1+ million students worldwide

3STATISTICS
Question 1
Part a
The opening prices of CWN (Crown Resorts Limited) and TAH (Tabcorp Holdings
Limited) from January 2008 to July 2017 is presented in table 1.
Table 1: Opening prices of CWN and TAH
Sl. No. Date CWN TAH
1 1/1/2008 13.45 6.92
2 4/1/2008 10.75 6.76
3 7/1/2008 9.44 4.68
4 10/1/2008 9.00 3.90
5 1/1/2009 5.91 3.27
6 4/1/2009 6.30 3.16
7 7/1/2009 7.30 3.30
8 10/1/2009 8.80 3.35
9 1/3/2010 8.07 3.25
10 4/6/2010 8.19 3.24
11 7/1/2010 7.66 2.95
12 10/1/2010 8.48 3.27
13 1/3/2011 8.37 3.37
14 4/4/2011 8.34 3.55
15 7/1/2011 8.93 3.21
16 10/3/2011 7.80 2.53
17 1/2/2012 8.09 2.68
18 4/2/2012 8.80 2.70
19 7/2/2012 8.57 2.91
20 10/1/2012 9.04 2.68
21 1/1/2013 10.67 3.00
22 4/1/2013 12.30 3.18
23 7/1/2013 12.00 2.95
24 10/1/2013 15.54 3.20
25 1/1/2014 16.85 3.57
26 4/1/2014 17.03 3.36
27 7/1/2014 15.10 3.30
28 10/1/2014 13.75 3.54
29 1/1/2015 12.69 4.08
30 4/1/2015 13.26 4.79
Paraphrase This Document
Need a fresh take? Get an instant paraphrase of this document with our AI Paraphraser

4STATISTICS
31 7/1/2015 12.61 4.59
32 10/1/2015 10.03 4.70
33 1/3/2016 12.50 4.71
34 4/4/2016 12.30 4.25
35 7/1/2016 12.60 4.55
36 10/2/2016 13.06 5.01
37 1/2/2017 11.58 4.81
38 4/3/2017 11.80 4.77
39 7/3/2017 12.15 4.35
Table 2 presents the stem and leaf plot of the opening prices with CWN on the right and
TAH on the left. The middle column presents the stem.
Table 2: Stem and Leaf Plot
TAH Stem CWN
9 9 9 7 6 6 5 2
3 3 3 3 3 2 2 2 2 2 2 1 1 0 3
8 7 7 7 7 6 5 5 2 0 4
0 5 9
9 7 6 3
7 3 6 8
8 0 0 1 3 3 4 5 8 8 9
9 0 0 4
10 0 6 7
11 5 8
12 0 1 3 3 5 6 6 6
13 0 2 4 7
14
15 1 5
16 8 0
17 0

5STATISTICS
Part b
Figure 1 presents the comparison of the prices of CWN and TAH.
$0 to < $2
$2 to < $4
$4 to < $6
$6 to < $8
$8 to < $10
$10 to < $12
$12 to < $14
$ 14 to < $16
$16 to < $18
0
0.1
0.2
0.3
0.4
0.5
0.6
0.7
Comparison of CWN and TAH
CWN
TAH
Class Interval
Relative Frequency
Figure 1: Comparison of share prices of CWN and TAH
Table 3: Relative Frequencies of CWN and TAH
Range
Relative Frequency
CWN TAH
$0 to < $2 0.00
$2 to < $4 0.64
$4 to < $6 0.03 0.31
$6 to < $8 0.10 0.05
$8 to < $10 0.33
$10 to < $12 0.15
$12 to < $14 0.28
$ 14 to < $16 0.05
$16 to < $18 0.05
⊘ This is a preview!⊘
Do you want full access?
Subscribe today to unlock all pages.

Trusted by 1+ million students worldwide

6STATISTICS
Part c
A comparison of the Market Capital of five companies dealing in leisure and
entertainment.
Table 4: Comparison of Market Capital
Name of the organization MKT CAP (M)
Aristocrat Leisure (ALL) 13614
Crown Resorts Limited (CWN) 8087
The star entertainment group (SGR) 4285
Tabcorp (TAH) 3475
Tatts Group (TTS) 5801
ALL CWN SGR TAH TTS
0
2000
4000
6000
8000
10000
12000
14000
16000
Comparison of Market Capital
Organnization Name
Market Cap (M)
Figure 2: Comparison of Market Capital
Part d
The P/E % and Dividend yield of CWN is higher than TAH. Hence it is better to invest in
CWN than TAH InvestSMART (2017).
Paraphrase This Document
Need a fresh take? Get an instant paraphrase of this document with our AI Paraphraser

7STATISTICS
Question 2
Part a
The comparison of the annual dividends of the banks is presented in table 4.
Table 4: Comparison of Annual Dividends
CBA NAB ANZ WBC
Mean 3.10 2.31 2.06 2.04
Median 3.05 2.359 2.048 2.035
First Quartile 2.28 1.861 1.886 1.895
Third Quartile 4.01 2.105 2.183 2.242
Part b
The comparison of standard deviation, range and coefficient of variation of annual
dividends of the banks is presented in table 5.
CBA NAB ANZ WBC
Standard Deviation 0.79 0.23 0.36 0.37
Range 2.230 0.785 1.206 1.304
Coefficient of Variation 25% 10% 17% 18%

8STATISTICS
Part c
CBA NAB ANZ WBC
1
1.5
2
2.5
3
3.5
4
Comparison of Annual dividends of Banks
Bank Name
Figure 3: Comparison of Annual dividends of Banks
Part d
APRA has initiated the process of limiting the flow of interest rate in the lending process.
According to APRA high risk, interest only loans should be restricted to 30% of the new
residential mortgages. According to business reporter banks have accepted the home loan
crackdown since it boosts the profits of the banks (abc.net.au, 2017).
Question 3
Part a
The maximum number of students above 90.05 or more is in the discipline of Society and
Culture. The number of students = 8180.
The total number of students offered in 2016 = 221060.
⊘ This is a preview!⊘
Do you want full access?
Subscribe today to unlock all pages.

Trusted by 1+ million students worldwide

9STATISTICS
Thus the proportion of students offered = 8180
221060 =0.037
Part b
The total number of students studying in “Society and Culture” = 46841
The number of students in “Society and culture” having more than 80.05 = 8180 + 6043
= 14223
Thus the number of students in “Society and Culture” having less than 80.05 =
= 46841 - 14223 = 32681
Thus, the probability that a randomly selected Australian Student studying in “Society and
Culture” and has a score of less than 80.05 = 32681
221060 =0.148
Part c
The proportion of students in the discipline with highest proportion and lowest grades is
Education.
The proportion of students = 0.073
Part d
The maximum number of students with “No ATAR/Non-Yr 12” is in the field of health
education. This is due to the fact that a large number of universities take admission without
ATAR score of the students. The students are also offered alternate pathway programs
(uow.edu.au, 2017)
Paraphrase This Document
Need a fresh take? Get an instant paraphrase of this document with our AI Paraphraser

10STATISTICS
Question 4
Part a
The total number of days of no rainfall = 228
Thus λ= Σx
n =228
52 =4.385
Part i
Hence, the probability of NO rainfall in a given week ¿ P ( X=0 )∨λ=4.385¿= 4.3850 e−4.385
0 !
= 0.0125
Part ii
The probability that there will 2 or more days of rainfall in a week =
1−P ( X =0 )−P ( X =1 )=1−0.0125− 4.3851 e−4.385
1 !
¿ 1−0.0125−0.0546=0.9329
Thus the probability that there would be 2 or more days of rainfall in a week = 0.9329
Part b
The total amount of Rainfall at Adelaide Airport = 649.2 mm
Thus the average rainfall ¿ 649.2
52 =12.48
The standard deviation for the amount of rainfall = 14.59

11STATISTICS
Part i
The probability that the rainfall would be more than 8mm of rainfall in a week
( z >8 ) =8−12.48
14.59 =−4.48
14.59 =−0.3071
P ( z> 8 )=0.3794
The probability that the rainfall would be more than 16mm of rainfall in a week
( z <16 ) =16−12.48
14.59 = 3.52
14.59 =0.2413
P ( z<16 )=0.5953
Thus the probability P(8<x<16) = 0.3794+0.5953 = 0.9747
Part ii
The probability that the rainfall would be more than 12% = 1.1750
Thus 1.1750= x−12.48
14.59
Solving the above equation: X = 29.6231
Thus the amount of rainfall = 29.6231mm
⊘ This is a preview!⊘
Do you want full access?
Subscribe today to unlock all pages.

Trusted by 1+ million students worldwide
1 out of 20
Related Documents

Your All-in-One AI-Powered Toolkit for Academic Success.
+13062052269
info@desklib.com
Available 24*7 on WhatsApp / Email
Unlock your academic potential
© 2024 | Zucol Services PVT LTD | All rights reserved.