Financial Decision Making: A Project Report on DBS Holdings Group
VerifiedAdded on  2020/05/16
|29
|6223
|97
Project
AI Summary
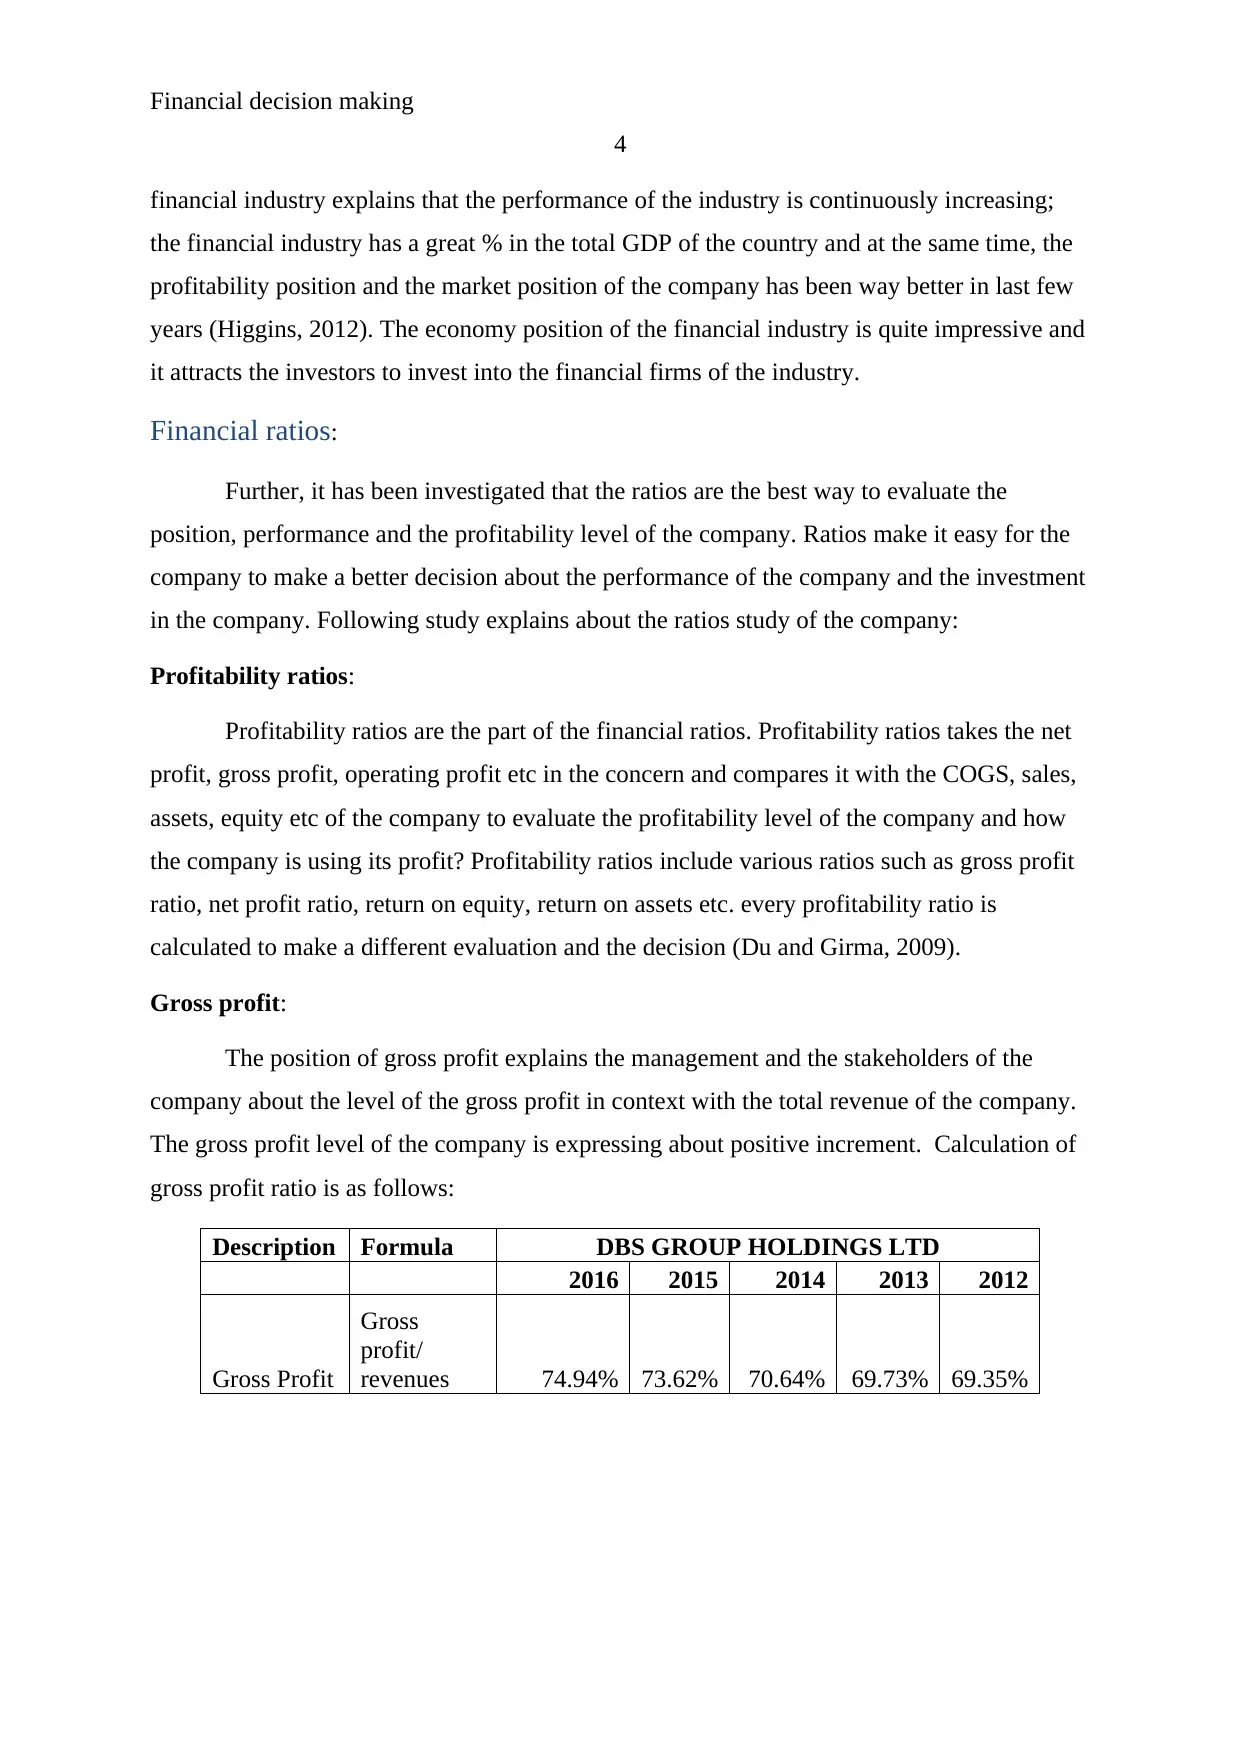
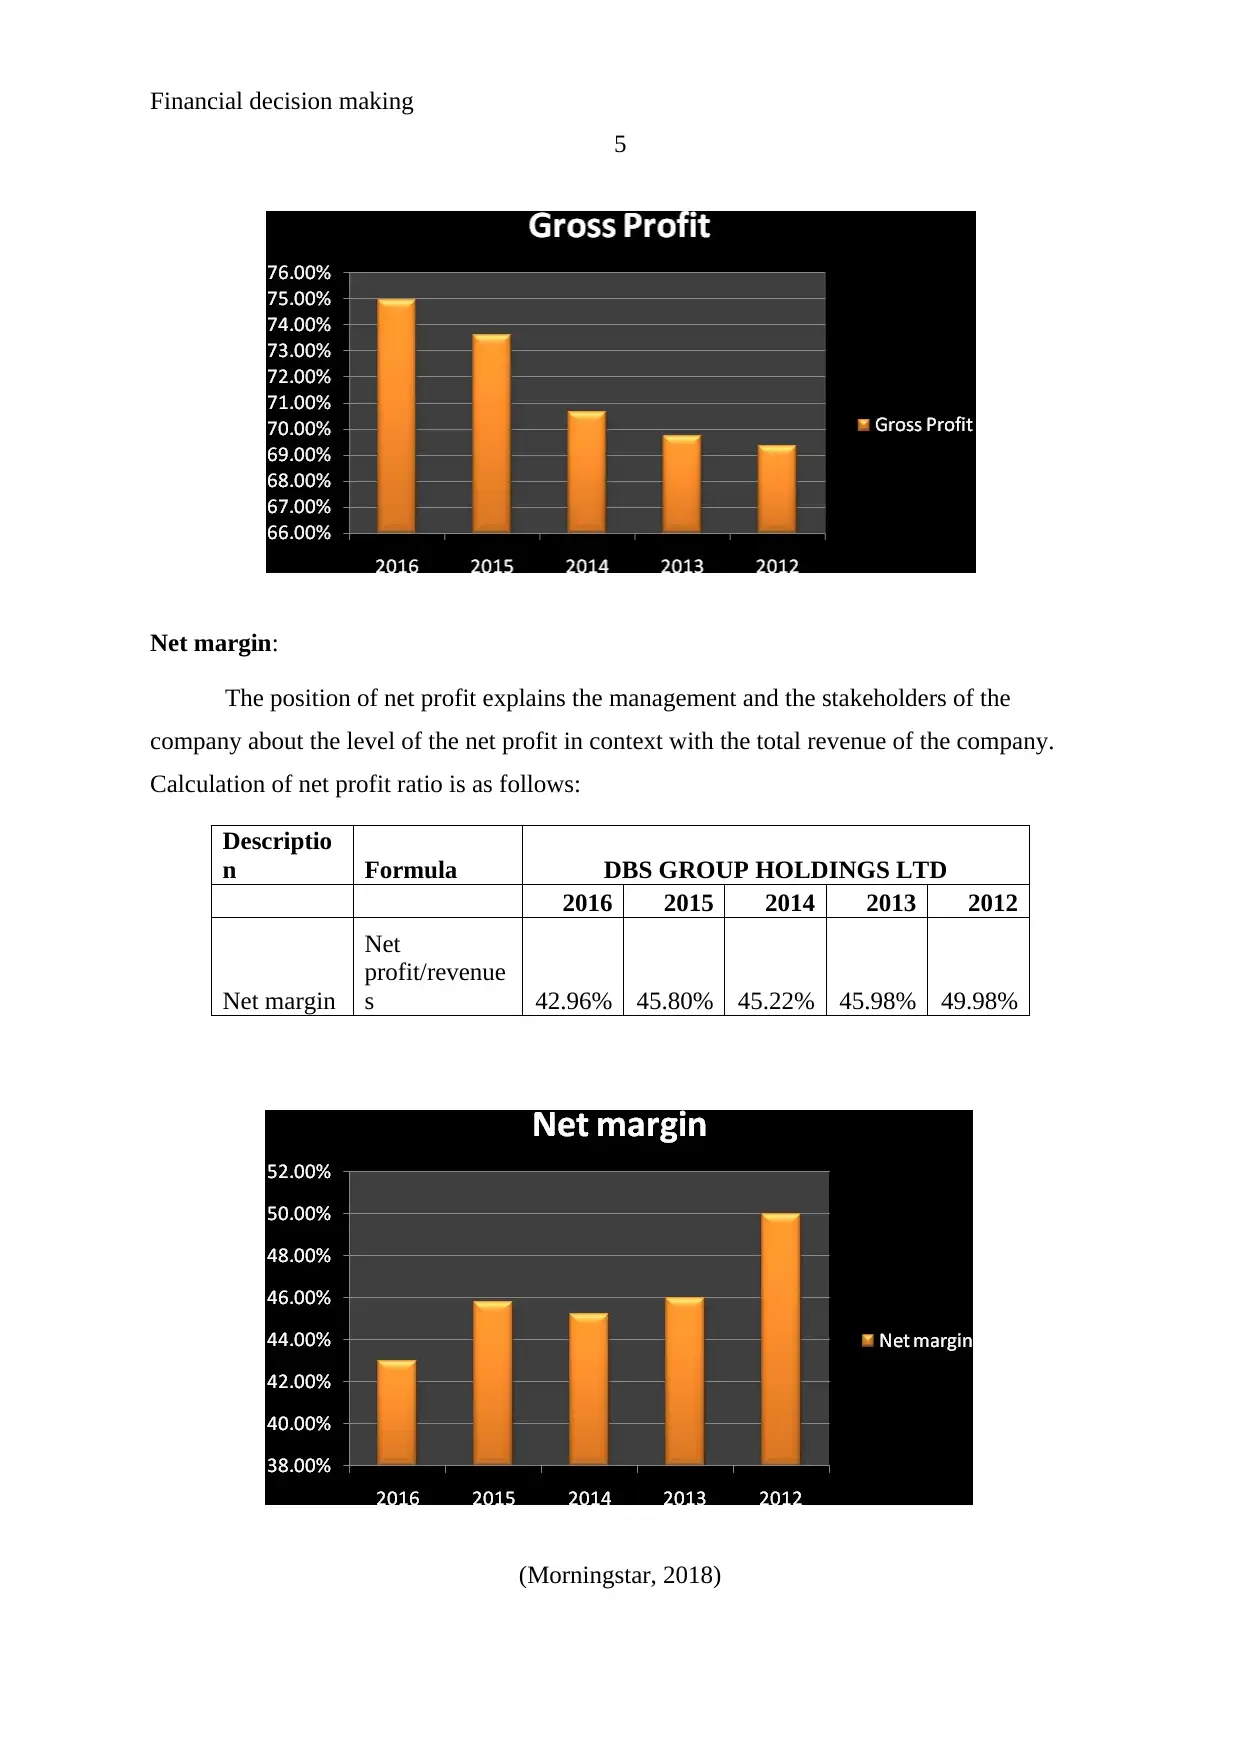
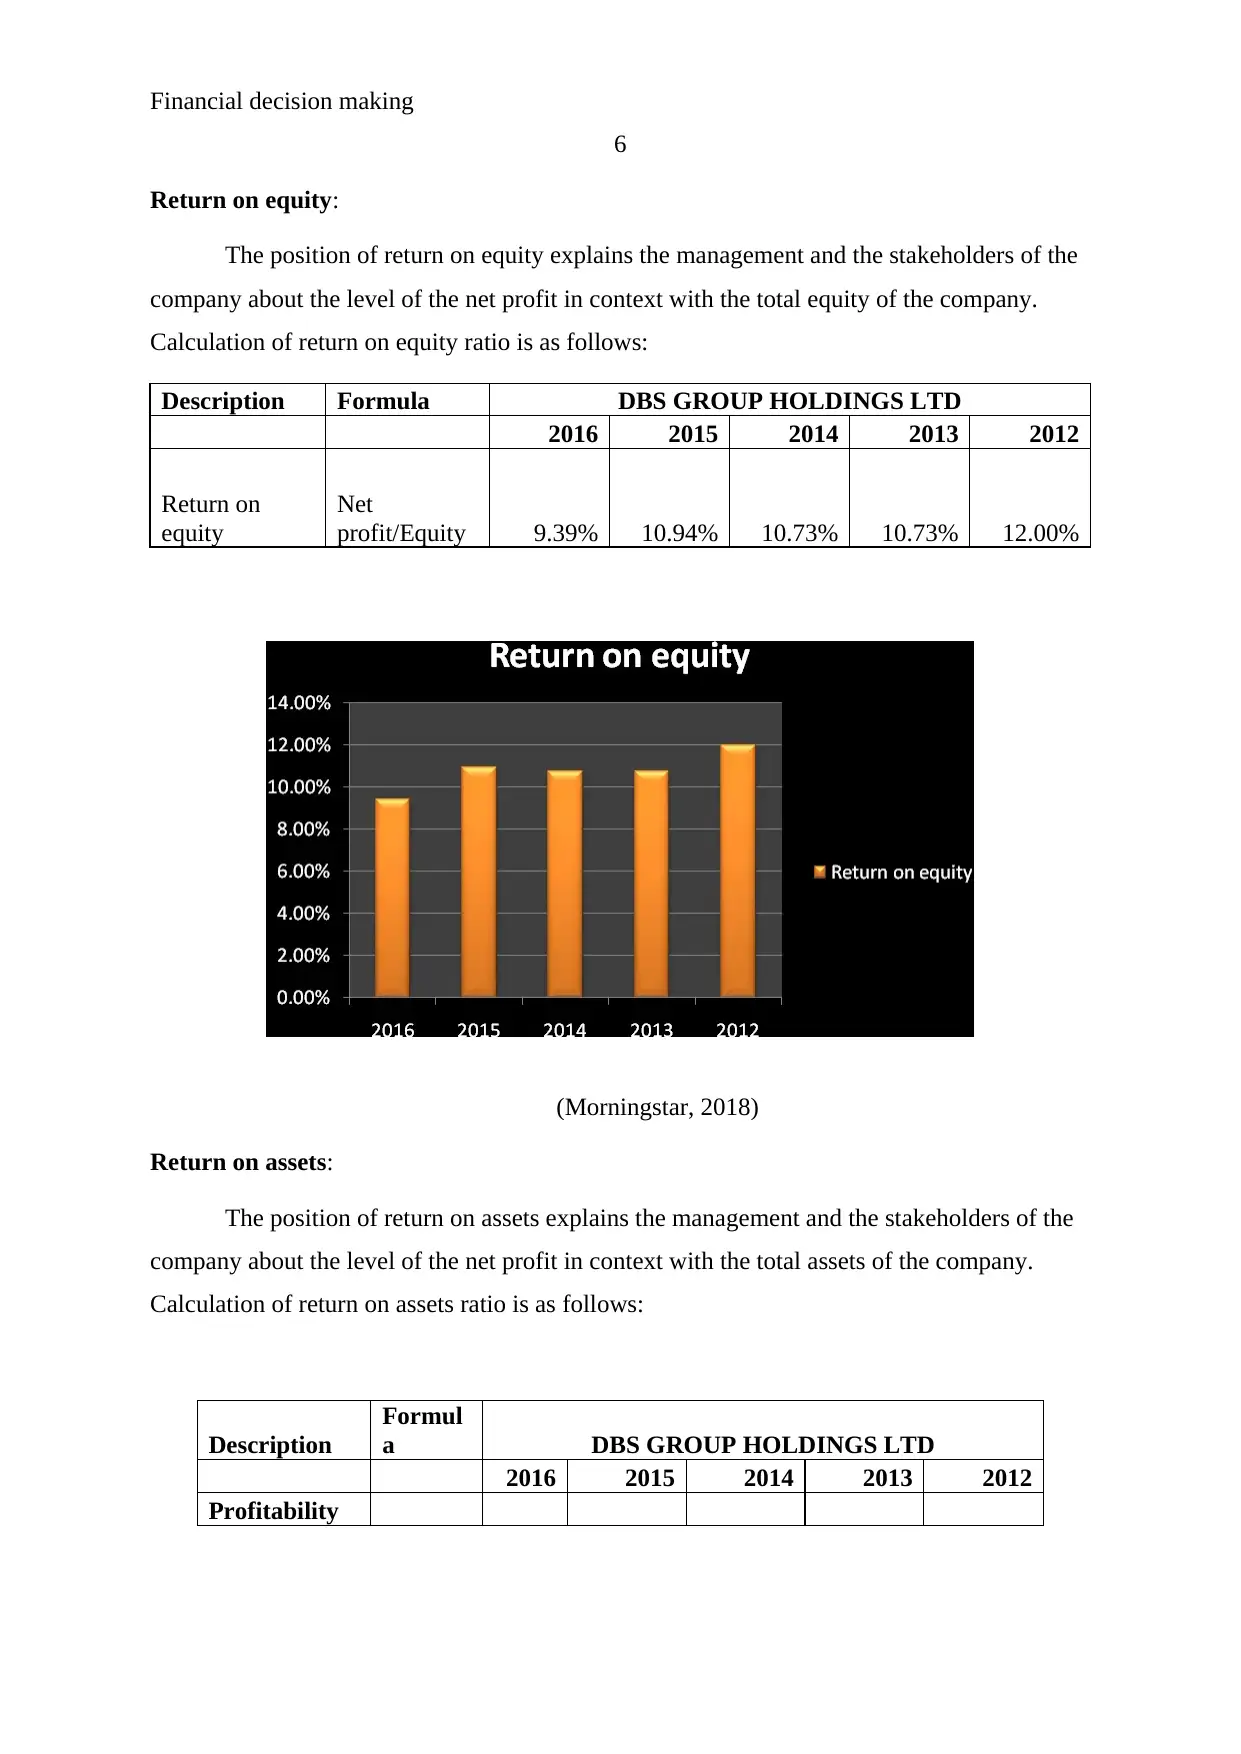
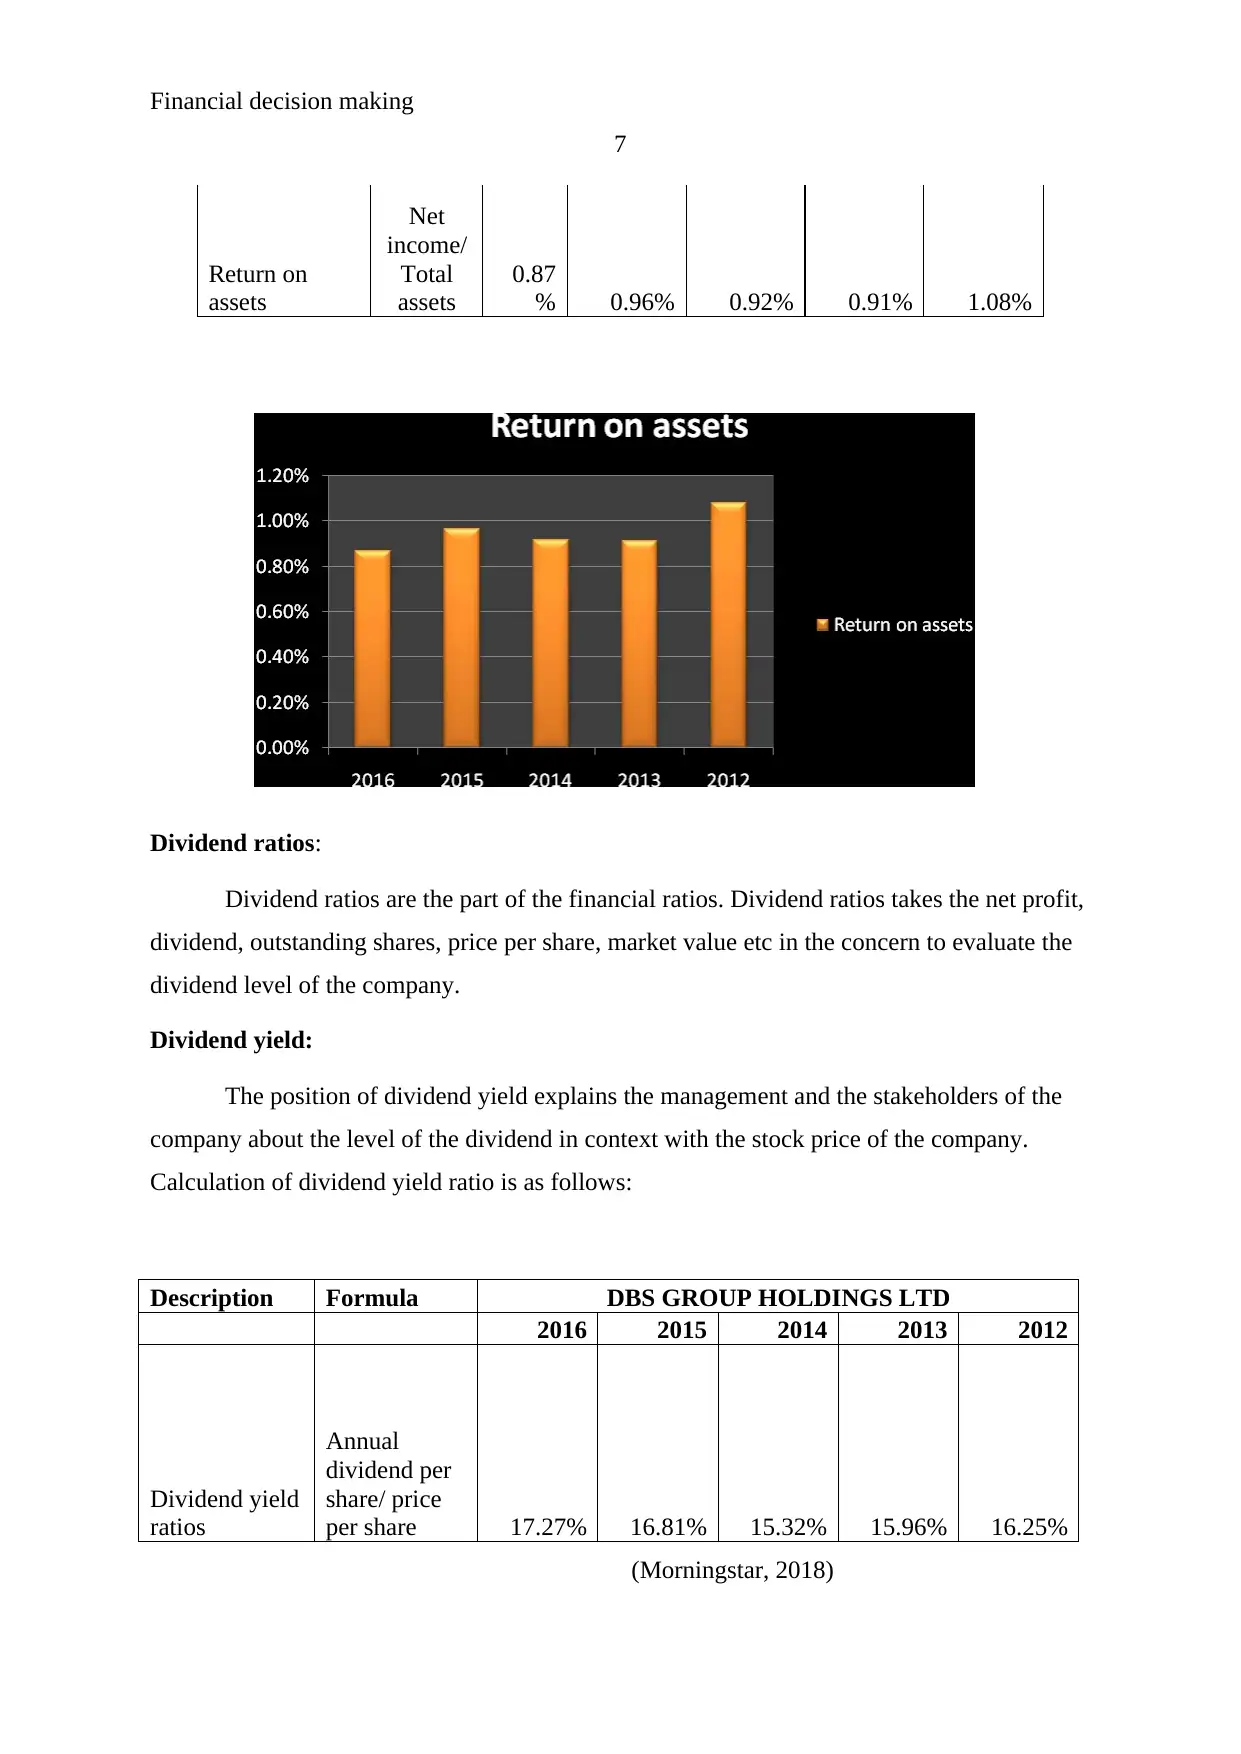
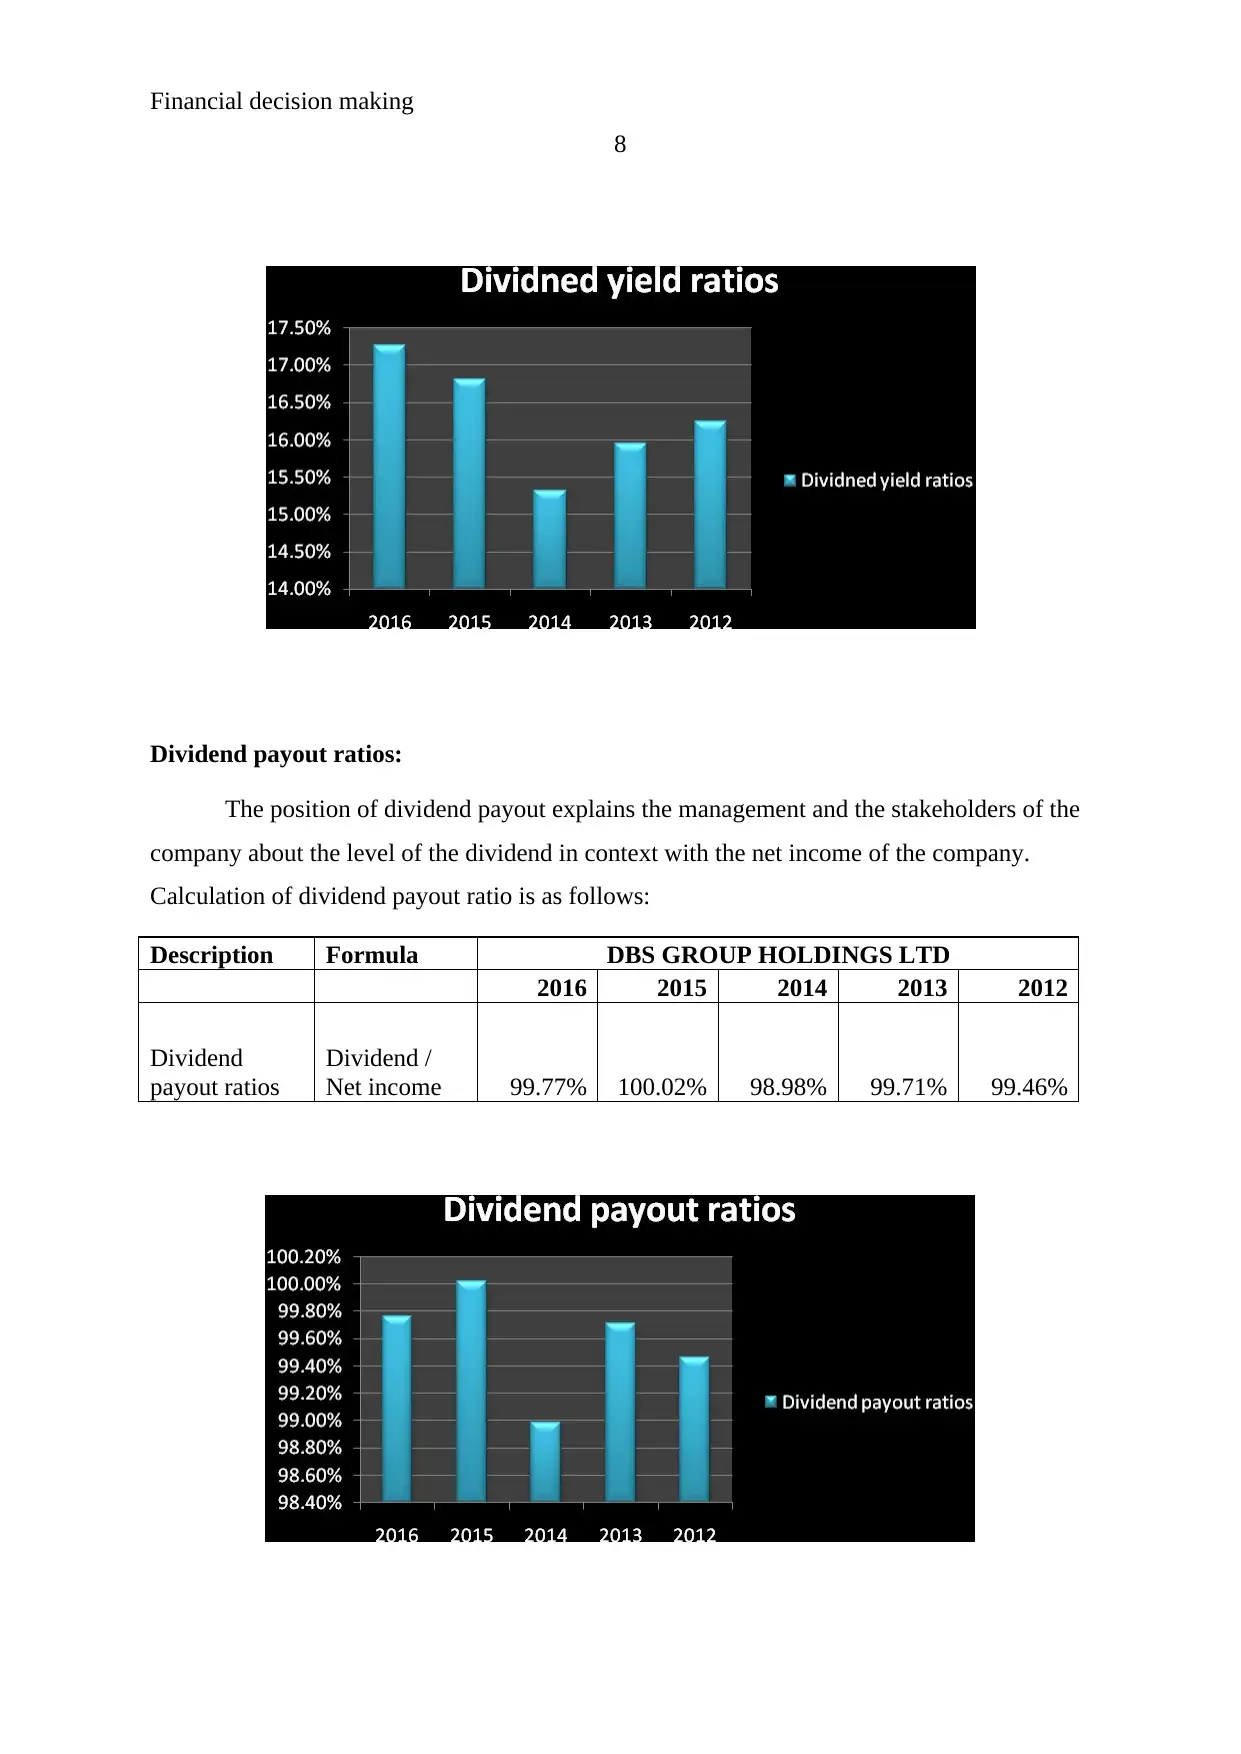
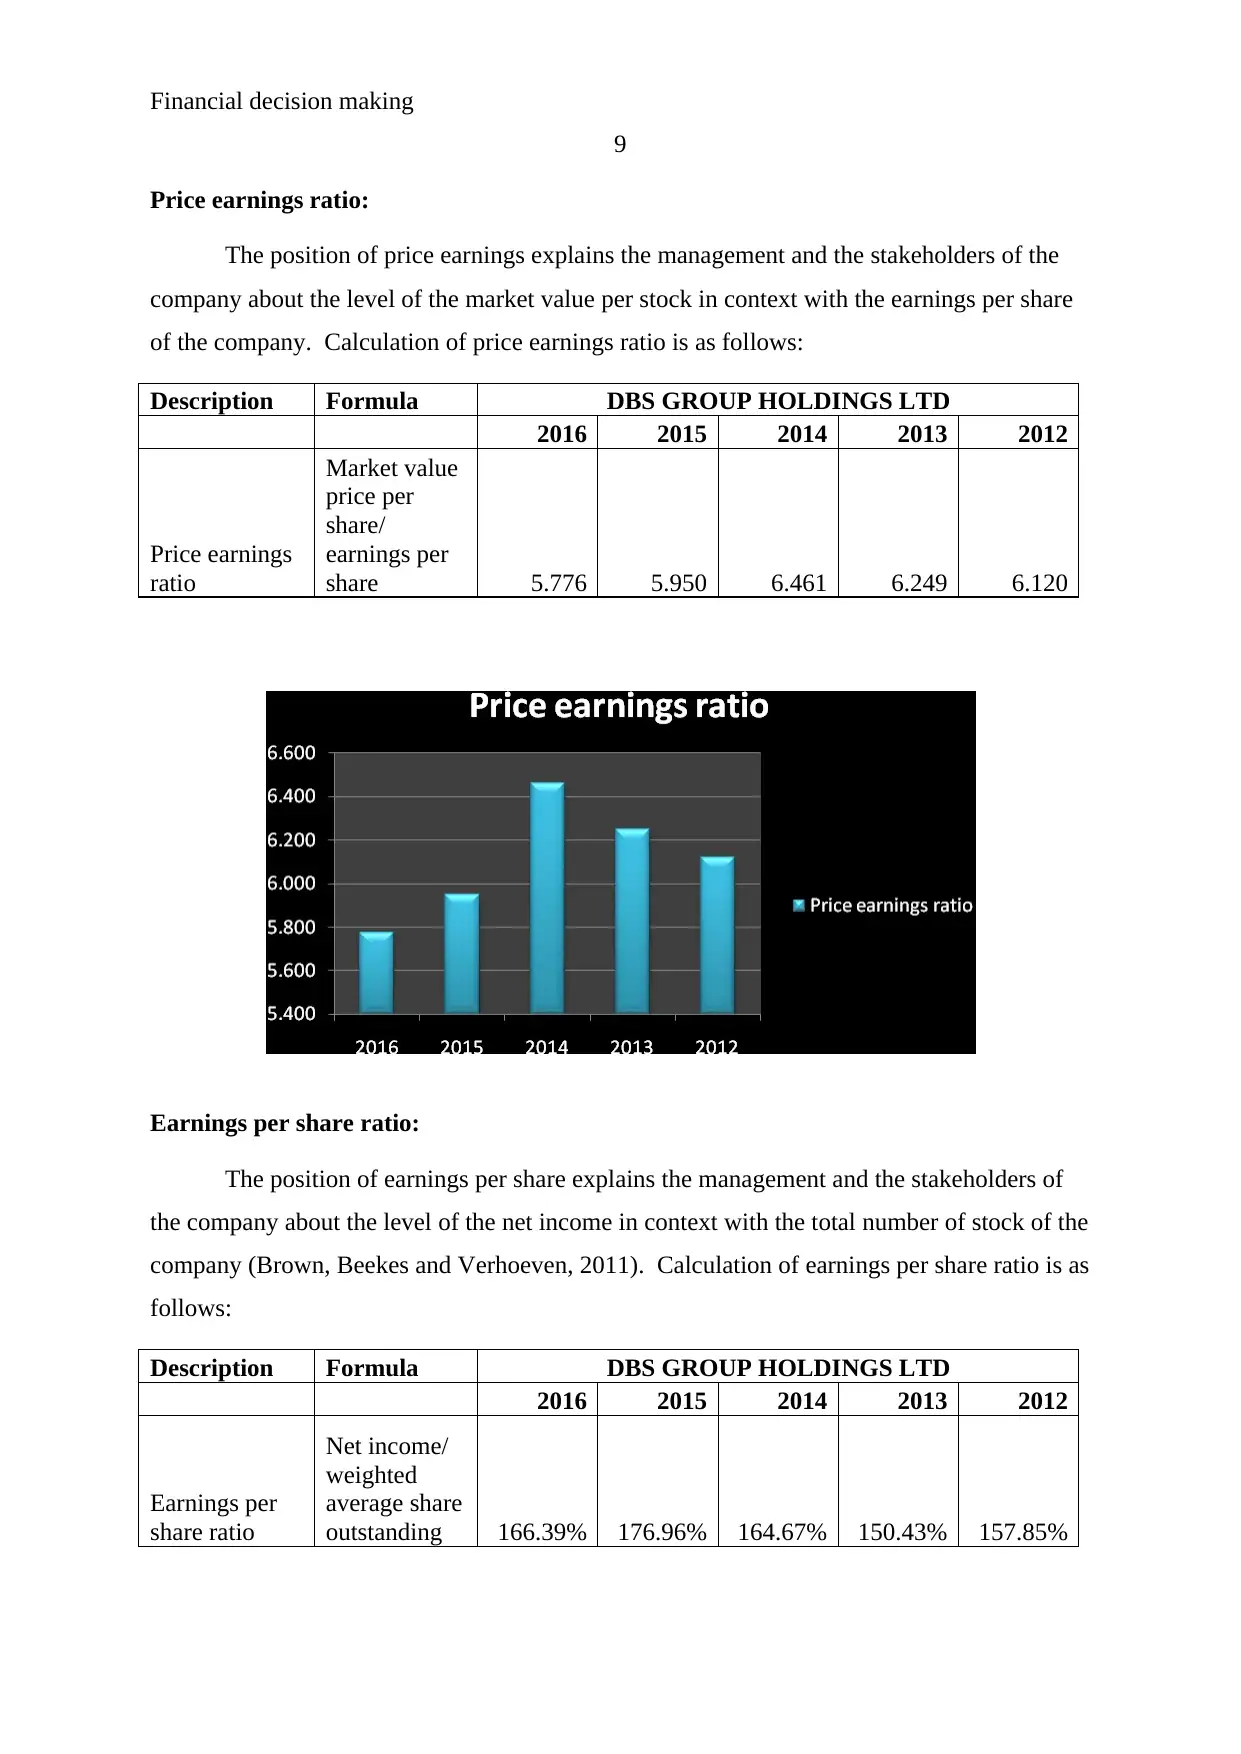
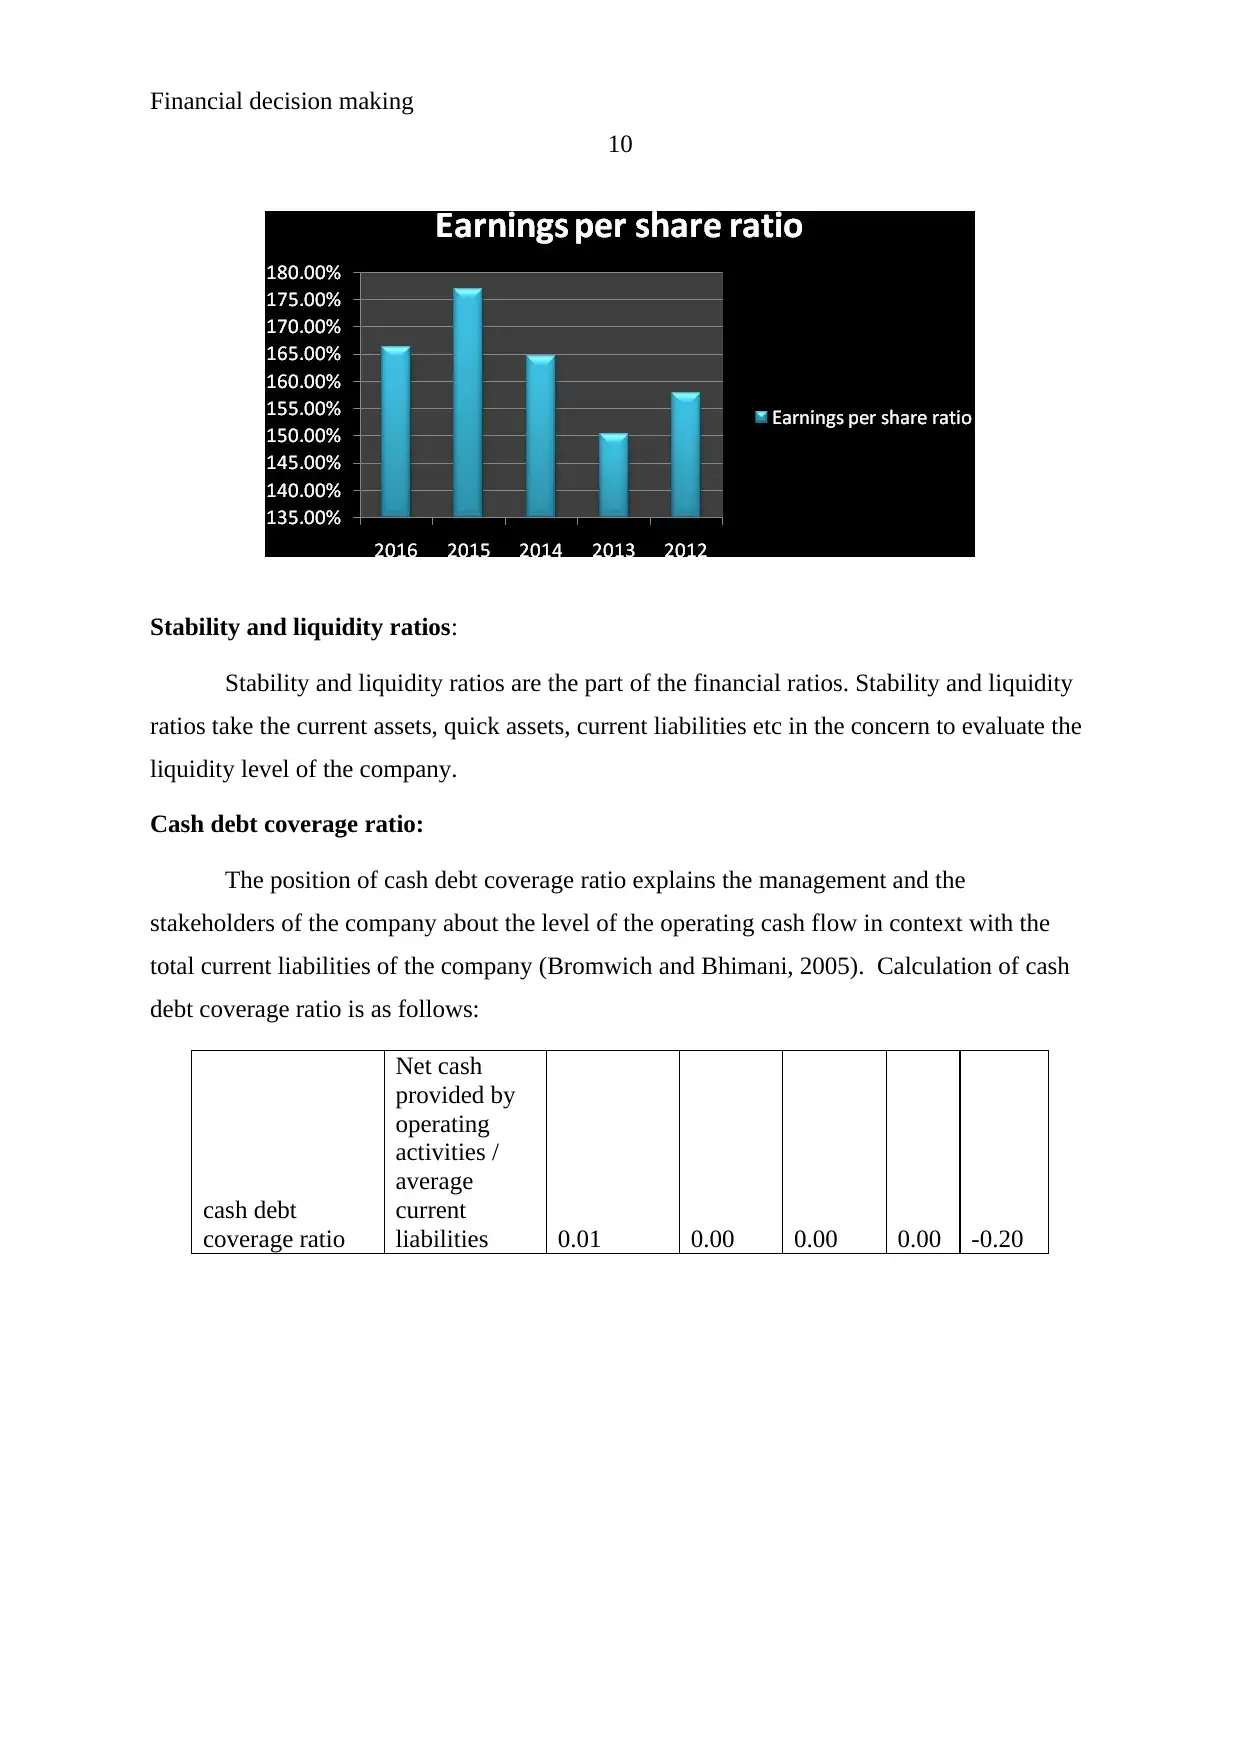
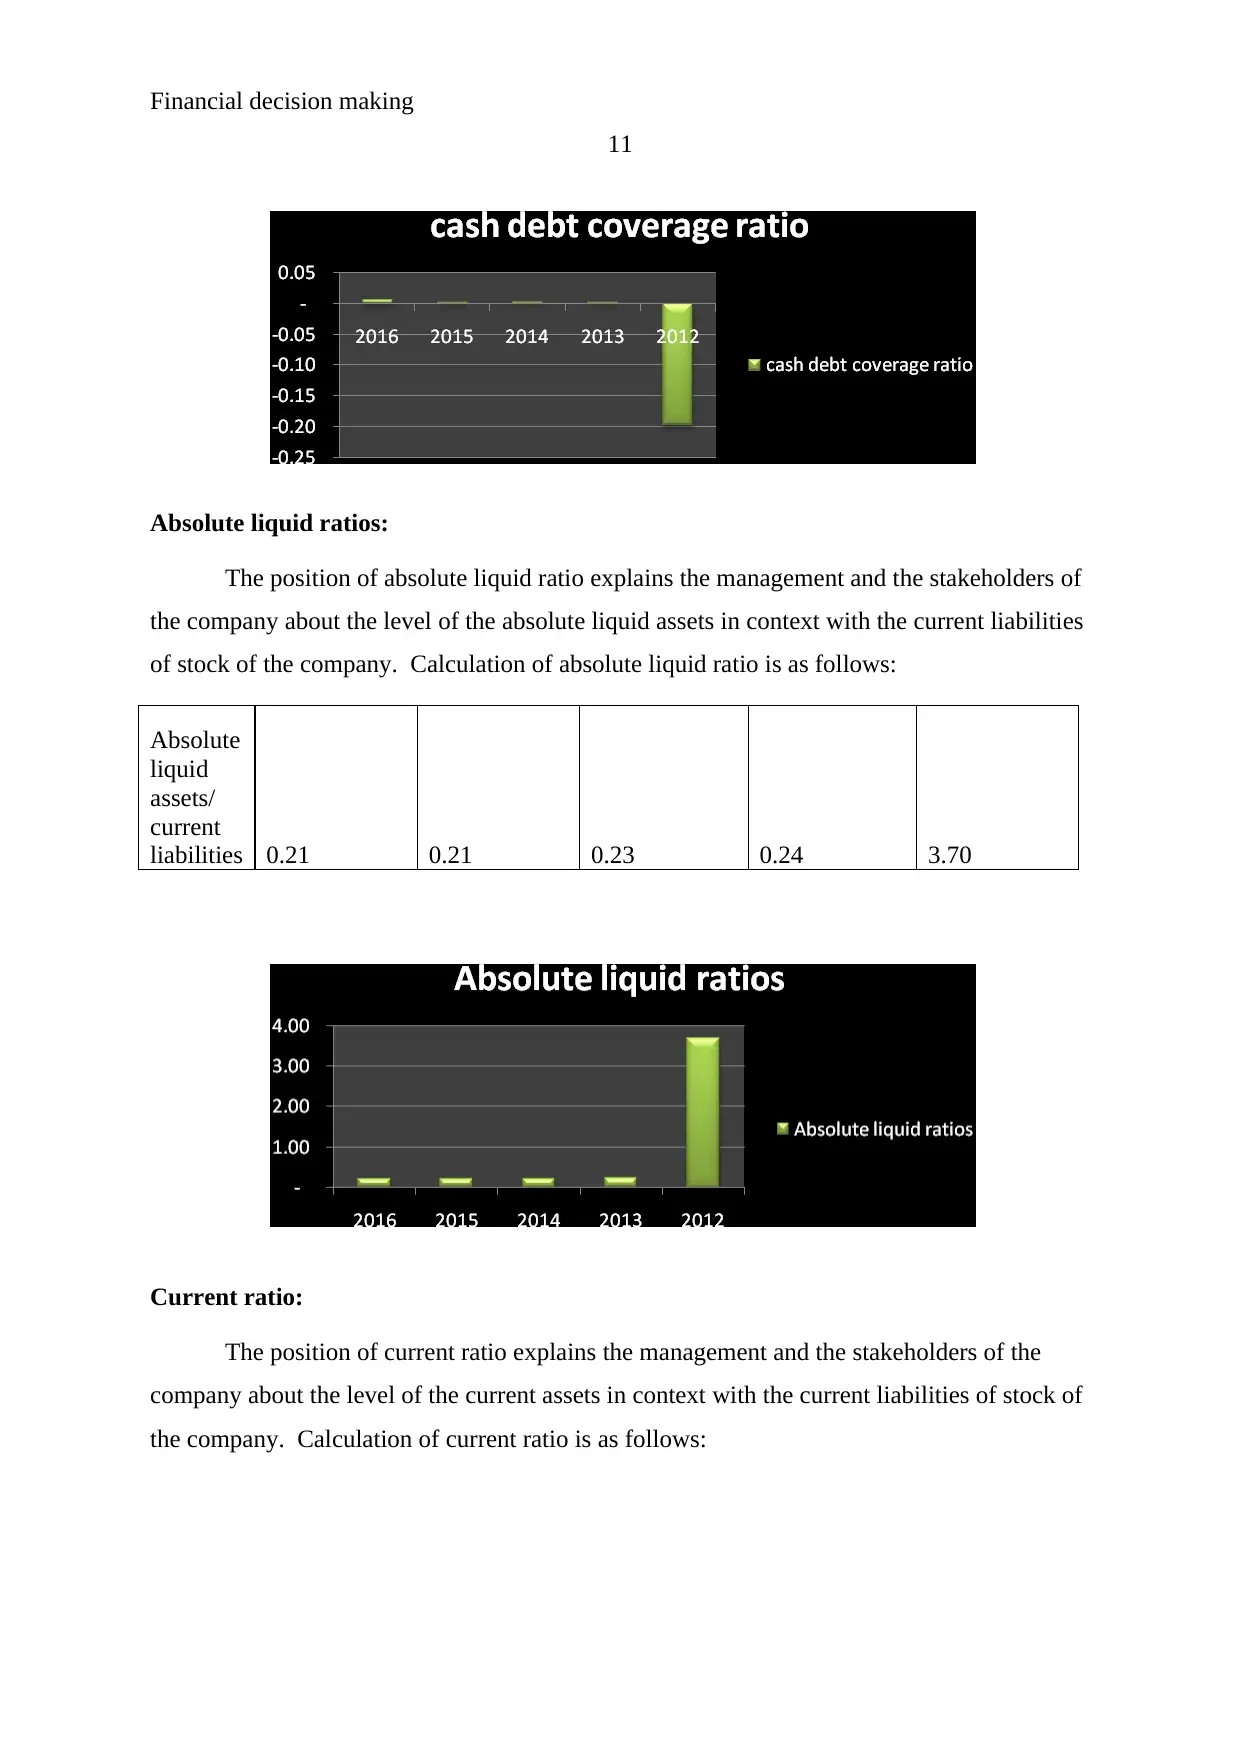
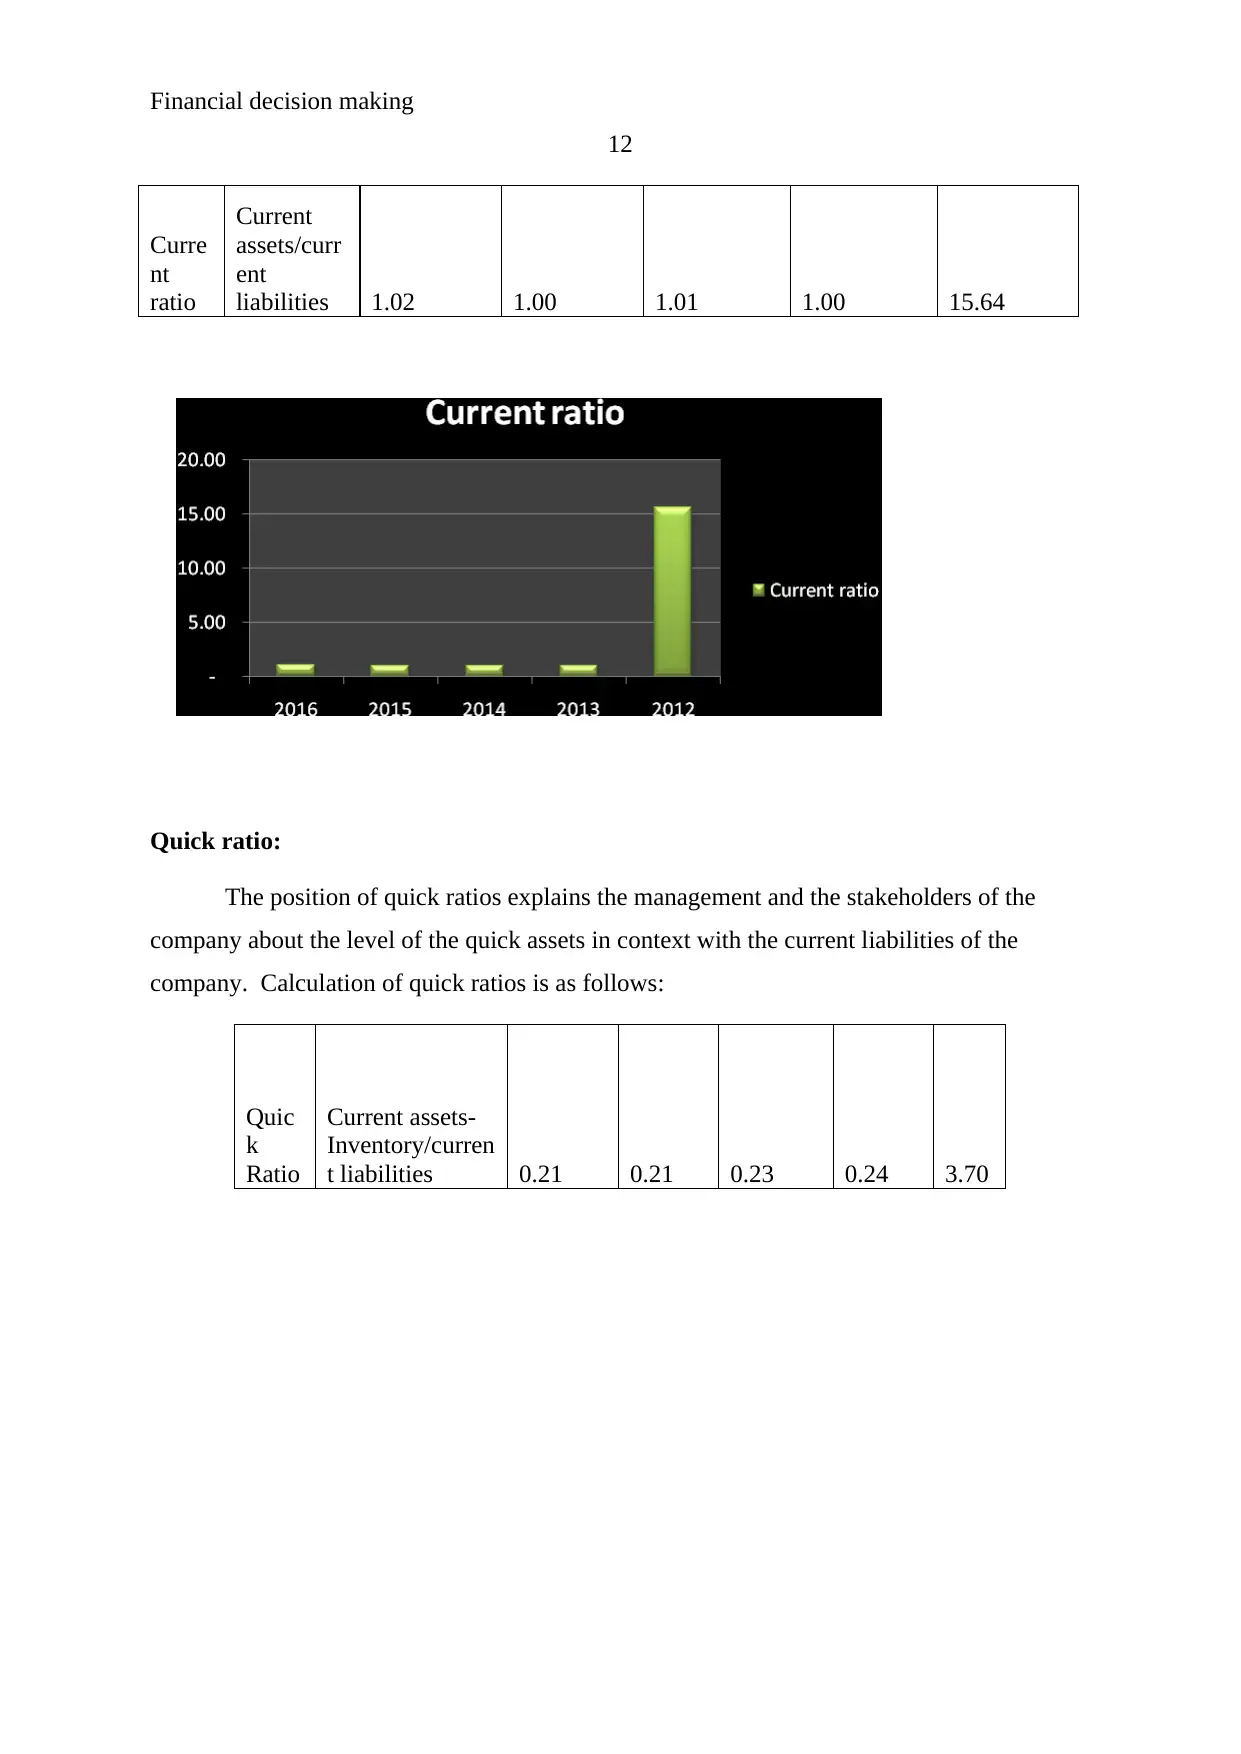
This project report presents a comprehensive financial analysis of DBS Holdings Group, a Singaporean investment and commercial banking company. The report begins with a company overview, followed by horizontal and vertical analysis to assess financial trends. It then delves into profit analysis, evaluating the financial industry's performance and DBS's profitability. A key focus is on financial ratios, including profitability (gross profit, net margin, return on equity, return on assets), dividend (dividend yield, payout ratio, price earnings ratio, earnings per share), stability and liquidity (cash debt coverage, absolute liquid, current, and quick ratios), and efficiency ratios (inventory turnover, current asset turnover). Each ratio is calculated and interpreted to provide insights into DBS's financial health. The report also includes an industry average analysis, stock exchange information, and a comparative analysis. Finally, it explores motives of acquisition, impact on brand and reputation, governance reports, and strategic financial parameters, culminating in a conclusion and references.

Running Head: Financial decision making
1
Project Report: Financial Decision Making
1
Project Report: Financial Decision Making
Paraphrase This Document
Need a fresh take? Get an instant paraphrase of this document with our AI Paraphraser

Financial decision making
2
Contents
Section A:.........................................................................................................................3
Company overview.......................................................................................................3
Horizontal and vertical analysis....................................................................................3
Profit analysis...............................................................................................................3
Financial ratios..............................................................................................................4
Profitability ratios.....................................................................................................4
Dividend ratios..........................................................................................................7
Stability and liquidity ratios....................................................................................10
Efficiency ratios......................................................................................................12
Industry average analysis........................................................................................15
Stock exchange...........................................................................................................17
Comparative analysis..................................................................................................17
Conclusion..................................................................................................................17
Section B.........................................................................................................................19
Motives of acquisition................................................................................................19
Impact on brand and reputation..................................................................................19
Governance report......................................................................................................19
Vision and strategic financial parameters (Conclusion).............................................19
References.......................................................................................................................21
Appendix.........................................................................................................................23

Financial decision making
3
Section A:
Company overview:
DBS holdings group is a Singaporean company which is basically an investment
company and operates its business to offer the services to its clients about the investment.
This company also offers the commercial banking services. There are various subsidiaries of
the company which manages and operates the functions of the company. DBS bank limited
has engaged in various banking and investment services. Mainly the business of the company
is operated in Asia. The main services of the company are institutional banking, treasury,
wealth management, consumer banking etc. the segment of institutional banking offers
financial products and services to its institutional clients which includes non bank financial
institution, corporate, government lined companies, medium companies and small companies.
The total turnover of the company has been estimated and it is $ 10.28 billion
according to the annual report of the company of 2016. This company has been founded in
1968. The company has been registered in Singapore stock exchange by the name of D05.
Currently, around 22,194 people are employed by the company (Reuters, 2018). The major
competitor of the company is OCBC (overseas- Chinese Banking Corporation limited). The
total turnover of the OCBC bank has been estimated and it is $ 8.55 billion according to the
annual report of the company of 2016.
Horizontal and vertical analysis:
Horizontal analysis and the vertical analysis are the part of financial evaluation. It
assists the company to manage and evaluate the financial position of the company on the
basis of financial position of the company. Horizontal analysis compares the financial figures
of the company from last year’s data or a base year data to reach over a conclusion about the
position of the company (Weygandt, Kimmel and Kieso, 2009). On the other hand, vertical
analysis is used to evaluate the comparative study. The trend and the changes into the
financial position of the company have been given in the appendix.
Profit analysis:
Further, for evaluating the financial performance and the profitability position of DBS
group holdings, profit of the company and the industry has been evaluated. The study over
⊘ This is a preview!⊘
Do you want full access?
Subscribe today to unlock all pages.

Trusted by 1+ million students worldwide

Financial decision making
4
financial industry explains that the performance of the industry is continuously increasing;
the financial industry has a great % in the total GDP of the country and at the same time, the
profitability position and the market position of the company has been way better in last few
years (Higgins, 2012). The economy position of the financial industry is quite impressive and
it attracts the investors to invest into the financial firms of the industry.
Financial ratios:
Further, it has been investigated that the ratios are the best way to evaluate the
position, performance and the profitability level of the company. Ratios make it easy for the
company to make a better decision about the performance of the company and the investment
in the company. Following study explains about the ratios study of the company:
Profitability ratios:
Profitability ratios are the part of the financial ratios. Profitability ratios takes the net
profit, gross profit, operating profit etc in the concern and compares it with the COGS, sales,
assets, equity etc of the company to evaluate the profitability level of the company and how
the company is using its profit? Profitability ratios include various ratios such as gross profit
ratio, net profit ratio, return on equity, return on assets etc. every profitability ratio is
calculated to make a different evaluation and the decision (Du and Girma, 2009).
Gross profit:
The position of gross profit explains the management and the stakeholders of the
company about the level of the gross profit in context with the total revenue of the company.
The gross profit level of the company is expressing about positive increment. Calculation of
gross profit ratio is as follows:
Description Formula DBS GROUP HOLDINGS LTD
2016 2015 2014 2013 2012
Gross Profit
Gross
profit/
revenues 74.94% 73.62% 70.64% 69.73% 69.35%
Paraphrase This Document
Need a fresh take? Get an instant paraphrase of this document with our AI Paraphraser

Financial decision making
5
Net margin:
The position of net profit explains the management and the stakeholders of the
company about the level of the net profit in context with the total revenue of the company.
Calculation of net profit ratio is as follows:
Descriptio
n Formula DBS GROUP HOLDINGS LTD
2016 2015 2014 2013 2012
Net margin
Net
profit/revenue
s 42.96% 45.80% 45.22% 45.98% 49.98%
(Morningstar, 2018)

Financial decision making
6
Return on equity:
The position of return on equity explains the management and the stakeholders of the
company about the level of the net profit in context with the total equity of the company.
Calculation of return on equity ratio is as follows:
Description Formula DBS GROUP HOLDINGS LTD
2016 2015 2014 2013 2012
Return on
equity
Net
profit/Equity 9.39% 10.94% 10.73% 10.73% 12.00%
(Morningstar, 2018)
Return on assets:
The position of return on assets explains the management and the stakeholders of the
company about the level of the net profit in context with the total assets of the company.
Calculation of return on assets ratio is as follows:
Description
Formul
a DBS GROUP HOLDINGS LTD
2016 2015 2014 2013 2012
Profitability
⊘ This is a preview!⊘
Do you want full access?
Subscribe today to unlock all pages.

Trusted by 1+ million students worldwide

Financial decision making
7
Return on
assets
Net
income/
Total
assets
0.87
% 0.96% 0.92% 0.91% 1.08%
Dividend ratios:
Dividend ratios are the part of the financial ratios. Dividend ratios takes the net profit,
dividend, outstanding shares, price per share, market value etc in the concern to evaluate the
dividend level of the company.
Dividend yield:
The position of dividend yield explains the management and the stakeholders of the
company about the level of the dividend in context with the stock price of the company.
Calculation of dividend yield ratio is as follows:
Description Formula DBS GROUP HOLDINGS LTD
2016 2015 2014 2013 2012
Dividend yield
ratios
Annual
dividend per
share/ price
per share 17.27% 16.81% 15.32% 15.96% 16.25%
(Morningstar, 2018)
Paraphrase This Document
Need a fresh take? Get an instant paraphrase of this document with our AI Paraphraser

Financial decision making
8
Dividend payout ratios:
The position of dividend payout explains the management and the stakeholders of the
company about the level of the dividend in context with the net income of the company.
Calculation of dividend payout ratio is as follows:
Description Formula DBS GROUP HOLDINGS LTD
2016 2015 2014 2013 2012
Dividend
payout ratios
Dividend /
Net income 99.77% 100.02% 98.98% 99.71% 99.46%

Financial decision making
9
Price earnings ratio:
The position of price earnings explains the management and the stakeholders of the
company about the level of the market value per stock in context with the earnings per share
of the company. Calculation of price earnings ratio is as follows:
Description Formula DBS GROUP HOLDINGS LTD
2016 2015 2014 2013 2012
Price earnings
ratio
Market value
price per
share/
earnings per
share 5.776 5.950 6.461 6.249 6.120
Earnings per share ratio:
The position of earnings per share explains the management and the stakeholders of
the company about the level of the net income in context with the total number of stock of the
company (Brown, Beekes and Verhoeven, 2011). Calculation of earnings per share ratio is as
follows:
Description Formula DBS GROUP HOLDINGS LTD
2016 2015 2014 2013 2012
Earnings per
share ratio
Net income/
weighted
average share
outstanding 166.39% 176.96% 164.67% 150.43% 157.85%
⊘ This is a preview!⊘
Do you want full access?
Subscribe today to unlock all pages.

Trusted by 1+ million students worldwide

Financial decision making
10
Stability and liquidity ratios:
Stability and liquidity ratios are the part of the financial ratios. Stability and liquidity
ratios take the current assets, quick assets, current liabilities etc in the concern to evaluate the
liquidity level of the company.
Cash debt coverage ratio:
The position of cash debt coverage ratio explains the management and the
stakeholders of the company about the level of the operating cash flow in context with the
total current liabilities of the company (Bromwich and Bhimani, 2005). Calculation of cash
debt coverage ratio is as follows:
cash debt
coverage ratio
Net cash
provided by
operating
activities /
average
current
liabilities 0.01 0.00 0.00 0.00 -0.20
Paraphrase This Document
Need a fresh take? Get an instant paraphrase of this document with our AI Paraphraser

Financial decision making
11
Absolute liquid ratios:
The position of absolute liquid ratio explains the management and the stakeholders of
the company about the level of the absolute liquid assets in context with the current liabilities
of stock of the company. Calculation of absolute liquid ratio is as follows:
Absolute
liquid
assets/
current
liabilities 0.21 0.21 0.23 0.24 3.70
Current ratio:
The position of current ratio explains the management and the stakeholders of the
company about the level of the current assets in context with the current liabilities of stock of
the company. Calculation of current ratio is as follows:

Financial decision making
12
Curre
nt
ratio
Current
assets/curr
ent
liabilities 1.02 1.00 1.01 1.00 15.64
Quick ratio:
The position of quick ratios explains the management and the stakeholders of the
company about the level of the quick assets in context with the current liabilities of the
company. Calculation of quick ratios is as follows:
Quic
k
Ratio
Current assets-
Inventory/curren
t liabilities 0.21 0.21 0.23 0.24 3.70
⊘ This is a preview!⊘
Do you want full access?
Subscribe today to unlock all pages.

Trusted by 1+ million students worldwide
1 out of 29
Related Documents

Your All-in-One AI-Powered Toolkit for Academic Success.
 +13062052269
info@desklib.com
Available 24*7 on WhatsApp / Email
Unlock your academic potential
Copyright © 2020–2025 A2Z Services. All Rights Reserved. Developed and managed by ZUCOL.