Financial Decision Making for Starbucks: Roast Ltd Report
VerifiedAdded on 2023/01/18
|15
|4448
|99
Report
AI Summary
This report offers a comprehensive financial analysis of Roast Ltd, a UK-based cafe chain, providing insights for Starbucks regarding a potential acquisition. The report begins with an industry review, examining the cafe and coffee shop sector's market trends, growth drivers, and challenges. It then delves into a detailed analysis of Roast Ltd's financial performance, including the profit and loss account, balance sheet, and cash flow statement, with a focus on key financial ratios such as gross margin, operating profit ratio, net profit margin, current ratio, debt-to-equity ratio, and return on capital employed. The analysis covers the years 2017 and 2018, highlighting trends and changes in financial metrics. Furthermore, the report explores investment appraisal techniques such as accounting rate of return, net present value (NPV), and payback period to evaluate potential investment decisions. It also discusses the sources of finance available to Roast Ltd. The report aims to assist in informed financial decision-making by providing a thorough understanding of Roast Ltd's financial health and investment potential.
FINANCIAL
DECISION MAKING
DECISION MAKING
Paraphrase This Document
Need a fresh take? Get an instant paraphrase of this document with our AI Paraphraser
Table of Contents
EXECUTIVE SUMMARY ............................................................................................................3
MAIN BODY...................................................................................................................................3
Part 1. Industry Review:..................................................................................................................3
Part 2. Business Performance Analysis:..........................................................................................4
2.1 Analysis of profit and loss account statement:......................................................................4
2.2 Statement of financial position:............................................................................................6
2.3 Statement of cash flows:.......................................................................................................8
Part 3. Investment Appraisals:.......................................................................................................12
3.1 a Management forecast:......................................................................................................12
3.1 b Investment appraisal technique:......................................................................................12
3.2 Source of finance:...............................................................................................................13
REFERENCES..............................................................................................................................15
EXECUTIVE SUMMARY
Financial decision-making relates to systematic process which contributes in decisions
concerned with company's liabilities, bonds and equity funds (Dinçer and Yüksel, 2018). This
report summarises review of financial statements and other fiscal information of Roast Ltd, UK's
cafe chain with aim to assist in decision-making to Starbucks regarding acquisition of this cafe
chain. This study also explains different investment appraisal approaches such as return-rate of
accounting, NPV and pay-back period, while considering limitations and benefits of theses
approaches in context of Roast Ltd.
MAIN BODY
Part 1. Industry Review:
Cafes Coffee Shops or business industry involves aggregate specialise unlicenced
enterprise that emphasise on selling of coffee along with cold drinks and other soft
drinks.
The industry's success is guided by both economical and social variables, including
increases in average real household earnings, choices for coffee shops over alternate
social sites, and growing consumer demand in coffee varieties and sources.
Over past few years, the sector has grown significantly, driven by increased demands, as
coffee culture has become more prominent among customers.
Industry sales is projected to increase at a compounded annualized rate of 4.8 percent
over five years from 2019-20, plus 1.9 percent growth during current year, to around £6.6
billion.
The sector also faces several obstacles such as the emergence of more substitute
beverages leading to a decline in the public's attachment to coffee.
The biggest advantage for this sector is to grow their businesses into different markets
like China, India, where there is huge population (Lee and Lee, 2015).
Companies with the maximum market share throughout United Kingdom in this industry
are Caffe Nero Group, Costa Limited, Pret-A-Manger and many other.
Changes in Minimum wage might have a major effect on business operators' profitability
level. Cafes and coffee business usually employ a fairly large range of low-paid
employees, and labour costs constitute a substantial share of operators aggregate sales.
⊘ This is a preview!⊘
Do you want full access?
Subscribe today to unlock all pages.
Trusted by 1+ million students worldwide
Household spending on foods and non-alcoholic drinks includes items purchased from
stores, cafes and shops. While some of such spendings supports sectors that overlap with
the sector of cafes-coffee shops, higher total household spending on such products
usually indicates improved prospects for industry enterprises.
Part 2. Business Performance Analysis:
2.1 Analysis of profit and loss account statement:
The P&L statement analysis includes analysing the numerous line elements in a
statement, and also tracking trends for specific line items across several periods. This method is
used to consider a company's cost structures and its capacity to make profits. It help to determine
company's probability level during a specific period. This analysis help to define corporation's
future performance and frame a budget with more reliable and accurate projections (Muradoglu
and Harvey, 2012).
In this context analysis of income-statement of Roast Ltd shows that company's turnover
has been increased from £2022000 to £2534000 (25.32 percent growth) during 2017 to 2018
while company's cost of sales has been changed from £1505000 to £1990000 (32.23 percent
growth) from 2017 to 2018 respectively. Company's operating income in year 2018 was 60000.
Whereas operating expenses raised to £477000 in year 2018 from £466000 year 2017. Roast Ltd
has reported operating profit of 127000 and 51000 during year 2018 and 2017 respectively
indicating a upward trend. Overall net profit of company was 81000 and 36000 in year 2018 and
2017 respectively which shows that company's overall profitability level has been increased.
For further effective analysis of company's P&L account, application of different ratio
would be helpful. Ratio help to interpret company's performance while analysing key
relationship among different reported items in income statements of one or more period.
Following are some ratios related to analysis of income-statement of Roast Ltd, as follows:
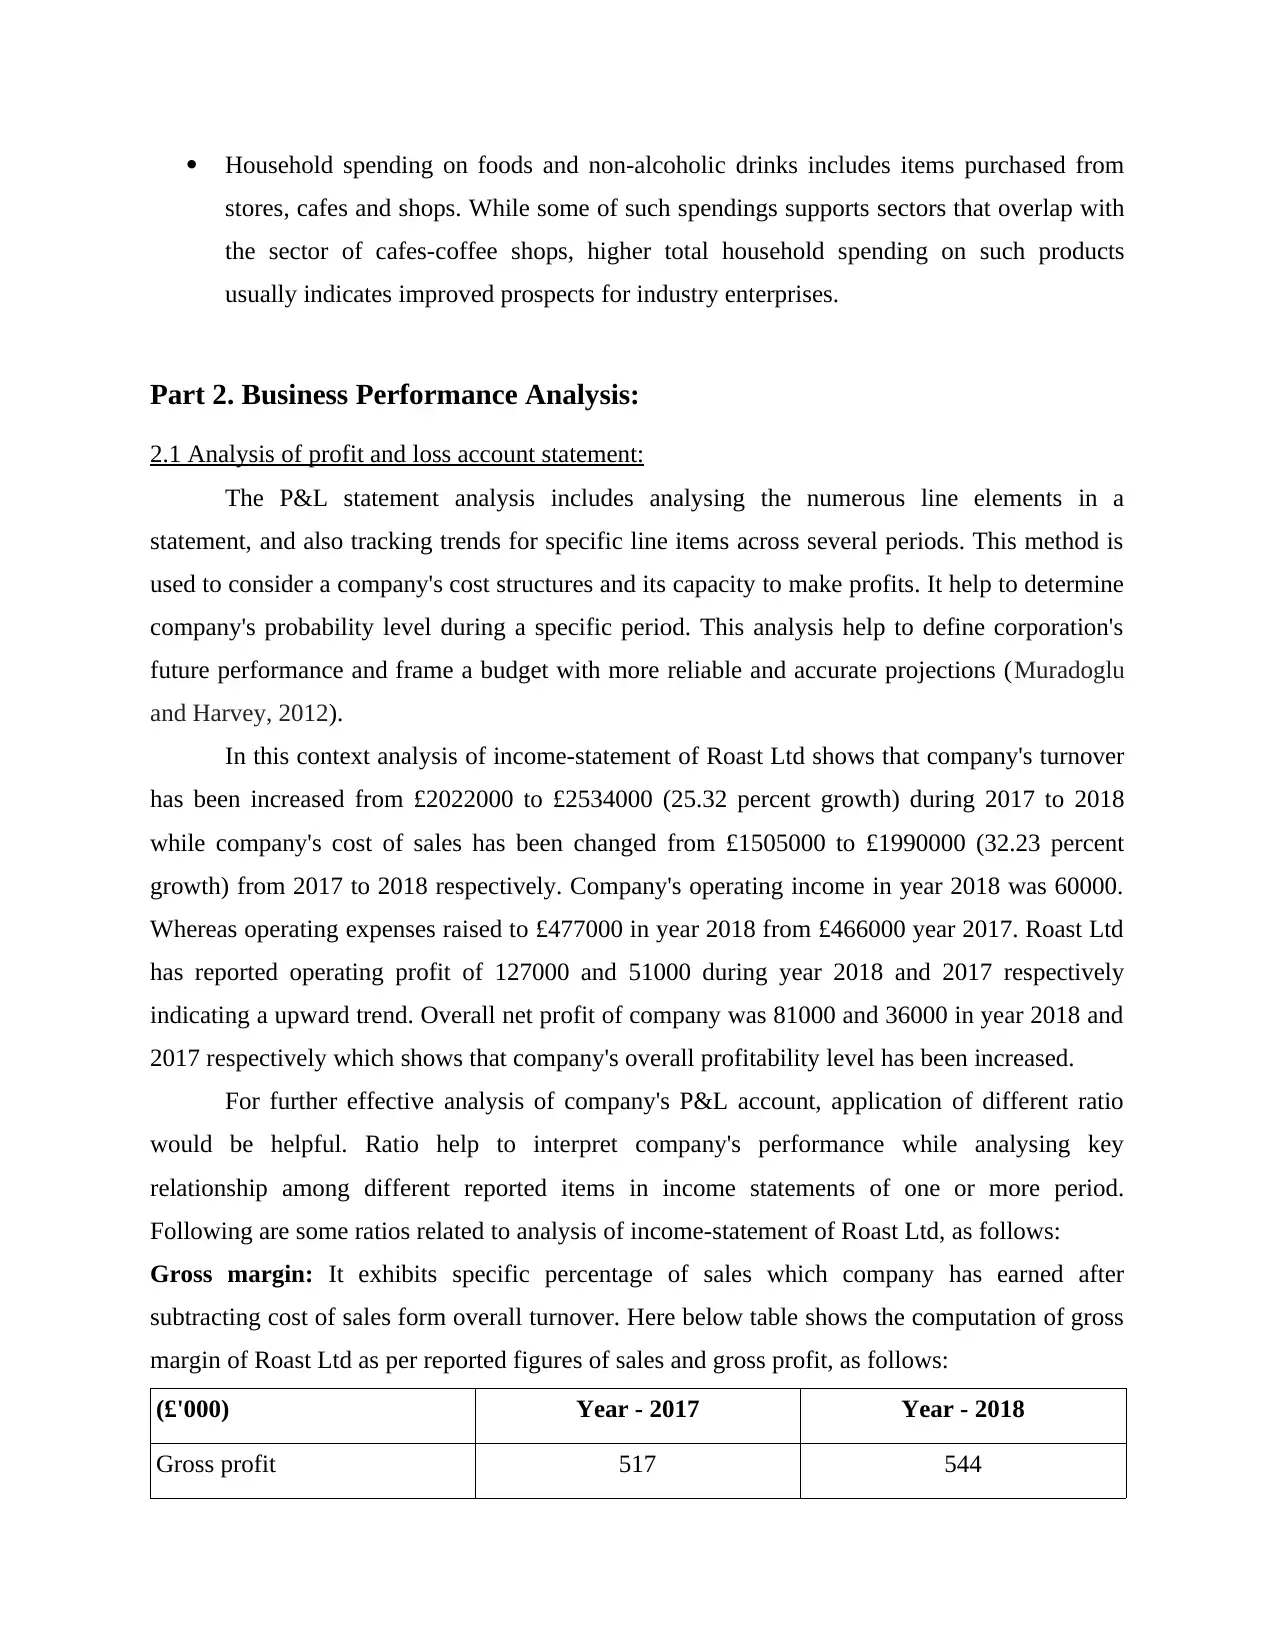
Gross margin: It exhibits specific percentage of sales which company has earned after
subtracting cost of sales form overall turnover. Here below table shows the computation of gross
margin of Roast Ltd as per reported figures of sales and gross profit, as follows:
(£'000) Year - 2017 Year - 2018
Gross profit 517 544
stores, cafes and shops. While some of such spendings supports sectors that overlap with
the sector of cafes-coffee shops, higher total household spending on such products
usually indicates improved prospects for industry enterprises.
Part 2. Business Performance Analysis:
2.1 Analysis of profit and loss account statement:
The P&L statement analysis includes analysing the numerous line elements in a
statement, and also tracking trends for specific line items across several periods. This method is
used to consider a company's cost structures and its capacity to make profits. It help to determine
company's probability level during a specific period. This analysis help to define corporation's
future performance and frame a budget with more reliable and accurate projections (Muradoglu
and Harvey, 2012).
In this context analysis of income-statement of Roast Ltd shows that company's turnover
has been increased from £2022000 to £2534000 (25.32 percent growth) during 2017 to 2018
while company's cost of sales has been changed from £1505000 to £1990000 (32.23 percent
growth) from 2017 to 2018 respectively. Company's operating income in year 2018 was 60000.
Whereas operating expenses raised to £477000 in year 2018 from £466000 year 2017. Roast Ltd
has reported operating profit of 127000 and 51000 during year 2018 and 2017 respectively
indicating a upward trend. Overall net profit of company was 81000 and 36000 in year 2018 and
2017 respectively which shows that company's overall profitability level has been increased.
For further effective analysis of company's P&L account, application of different ratio
would be helpful. Ratio help to interpret company's performance while analysing key
relationship among different reported items in income statements of one or more period.
Following are some ratios related to analysis of income-statement of Roast Ltd, as follows:
Gross margin: It exhibits specific percentage of sales which company has earned after
subtracting cost of sales form overall turnover. Here below table shows the computation of gross
margin of Roast Ltd as per reported figures of sales and gross profit, as follows:
(£'000) Year - 2017 Year - 2018
Gross profit 517 544
Paraphrase This Document
Need a fresh take? Get an instant paraphrase of this document with our AI Paraphraser
Net sales 2022 2534
Gross profit Margin = Gross
profit/ Net sales x 100
25.57% 21.47%
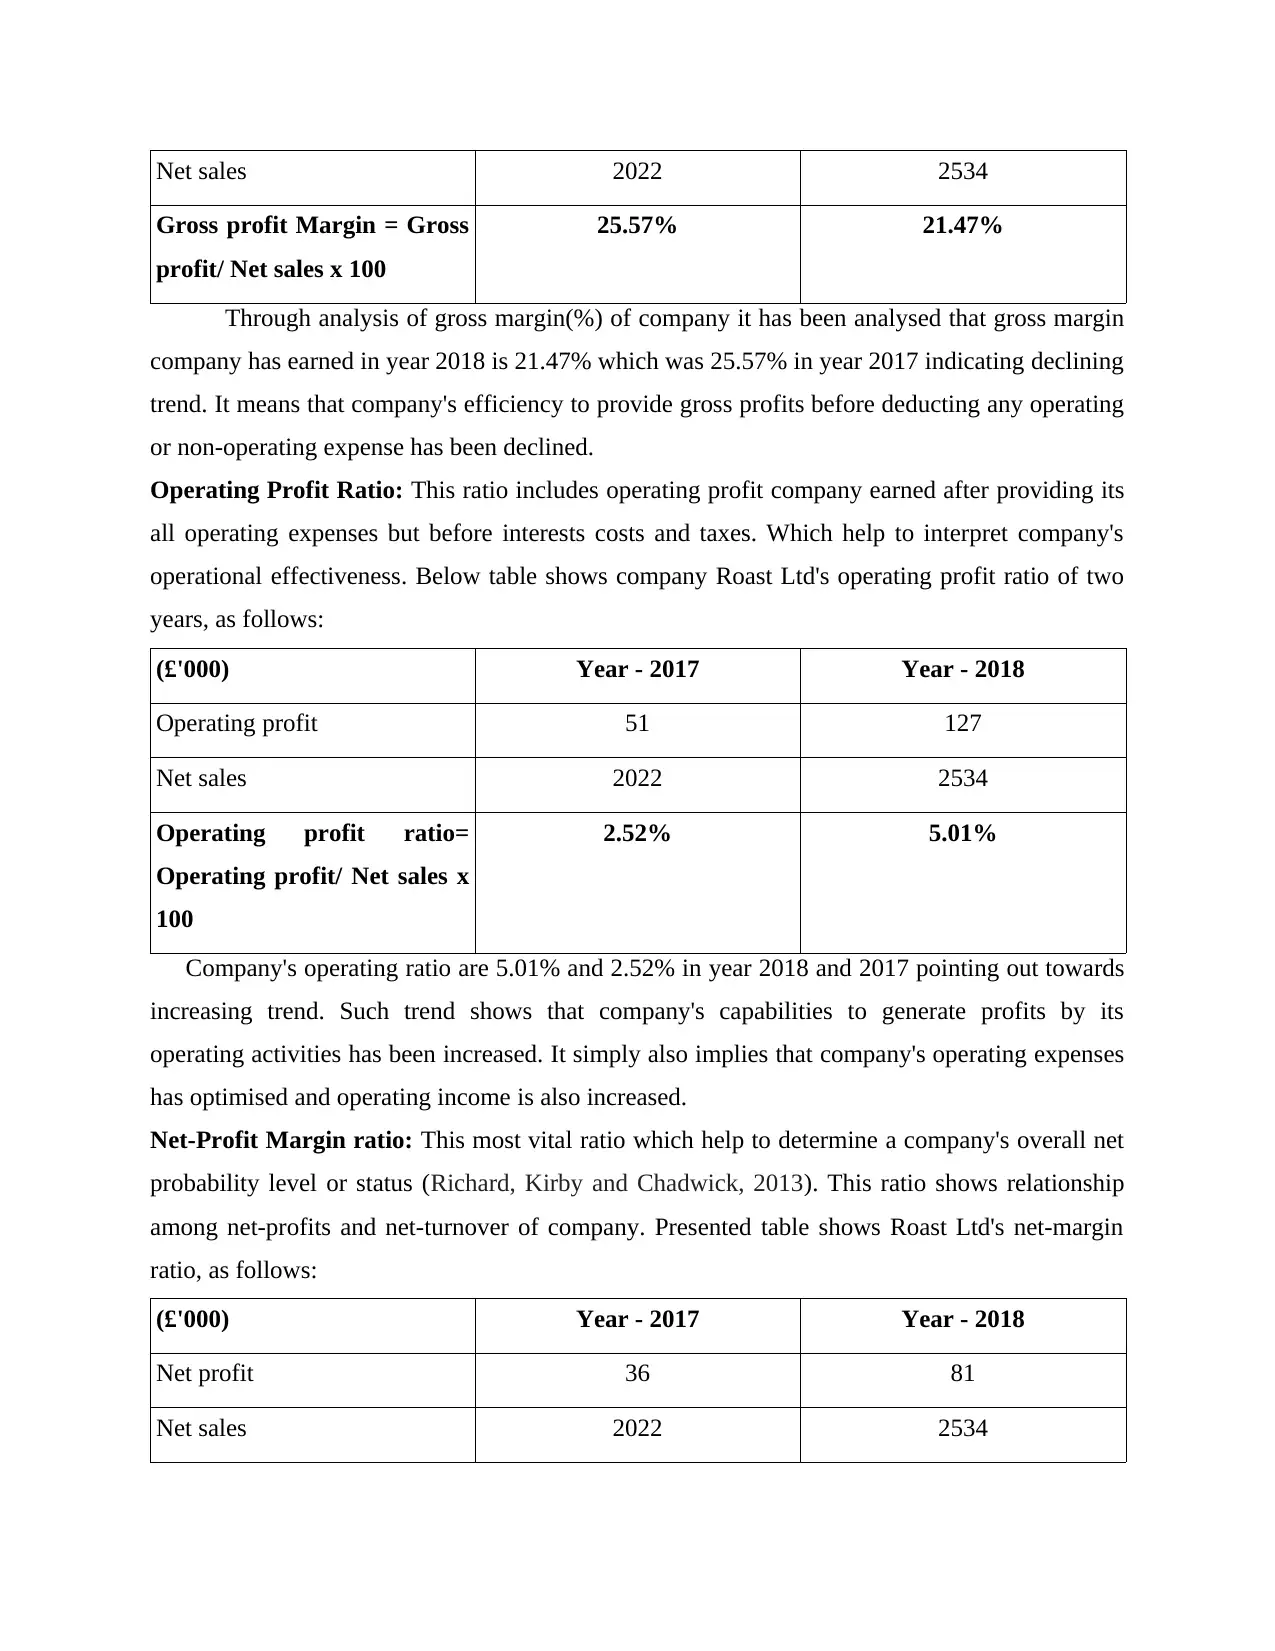
Through analysis of gross margin(%) of company it has been analysed that gross margin
company has earned in year 2018 is 21.47% which was 25.57% in year 2017 indicating declining
trend. It means that company's efficiency to provide gross profits before deducting any operating
or non-operating expense has been declined.
Operating Profit Ratio: This ratio includes operating profit company earned after providing its
all operating expenses but before interests costs and taxes. Which help to interpret company's
operational effectiveness. Below table shows company Roast Ltd's operating profit ratio of two
years, as follows:
(£'000) Year - 2017 Year - 2018
Operating profit 51 127
Net sales 2022 2534
Operating profit ratio=
Operating profit/ Net sales x
100
2.52% 5.01%
Company's operating ratio are 5.01% and 2.52% in year 2018 and 2017 pointing out towards
increasing trend. Such trend shows that company's capabilities to generate profits by its
operating activities has been increased. It simply also implies that company's operating expenses
has optimised and operating income is also increased.
Net-Profit Margin ratio: This most vital ratio which help to determine a company's overall net
probability level or status (Richard, Kirby and Chadwick, 2013). This ratio shows relationship
among net-profits and net-turnover of company. Presented table shows Roast Ltd's net-margin
ratio, as follows:
(£'000) Year - 2017 Year - 2018
Net profit 36 81
Net sales 2022 2534
Gross profit Margin = Gross
profit/ Net sales x 100
25.57% 21.47%
Through analysis of gross margin(%) of company it has been analysed that gross margin
company has earned in year 2018 is 21.47% which was 25.57% in year 2017 indicating declining
trend. It means that company's efficiency to provide gross profits before deducting any operating
or non-operating expense has been declined.
Operating Profit Ratio: This ratio includes operating profit company earned after providing its
all operating expenses but before interests costs and taxes. Which help to interpret company's
operational effectiveness. Below table shows company Roast Ltd's operating profit ratio of two
years, as follows:
(£'000) Year - 2017 Year - 2018
Operating profit 51 127
Net sales 2022 2534
Operating profit ratio=
Operating profit/ Net sales x
100
2.52% 5.01%
Company's operating ratio are 5.01% and 2.52% in year 2018 and 2017 pointing out towards
increasing trend. Such trend shows that company's capabilities to generate profits by its
operating activities has been increased. It simply also implies that company's operating expenses
has optimised and operating income is also increased.
Net-Profit Margin ratio: This most vital ratio which help to determine a company's overall net
probability level or status (Richard, Kirby and Chadwick, 2013). This ratio shows relationship
among net-profits and net-turnover of company. Presented table shows Roast Ltd's net-margin
ratio, as follows:
(£'000) Year - 2017 Year - 2018
Net profit 36 81
Net sales 2022 2534
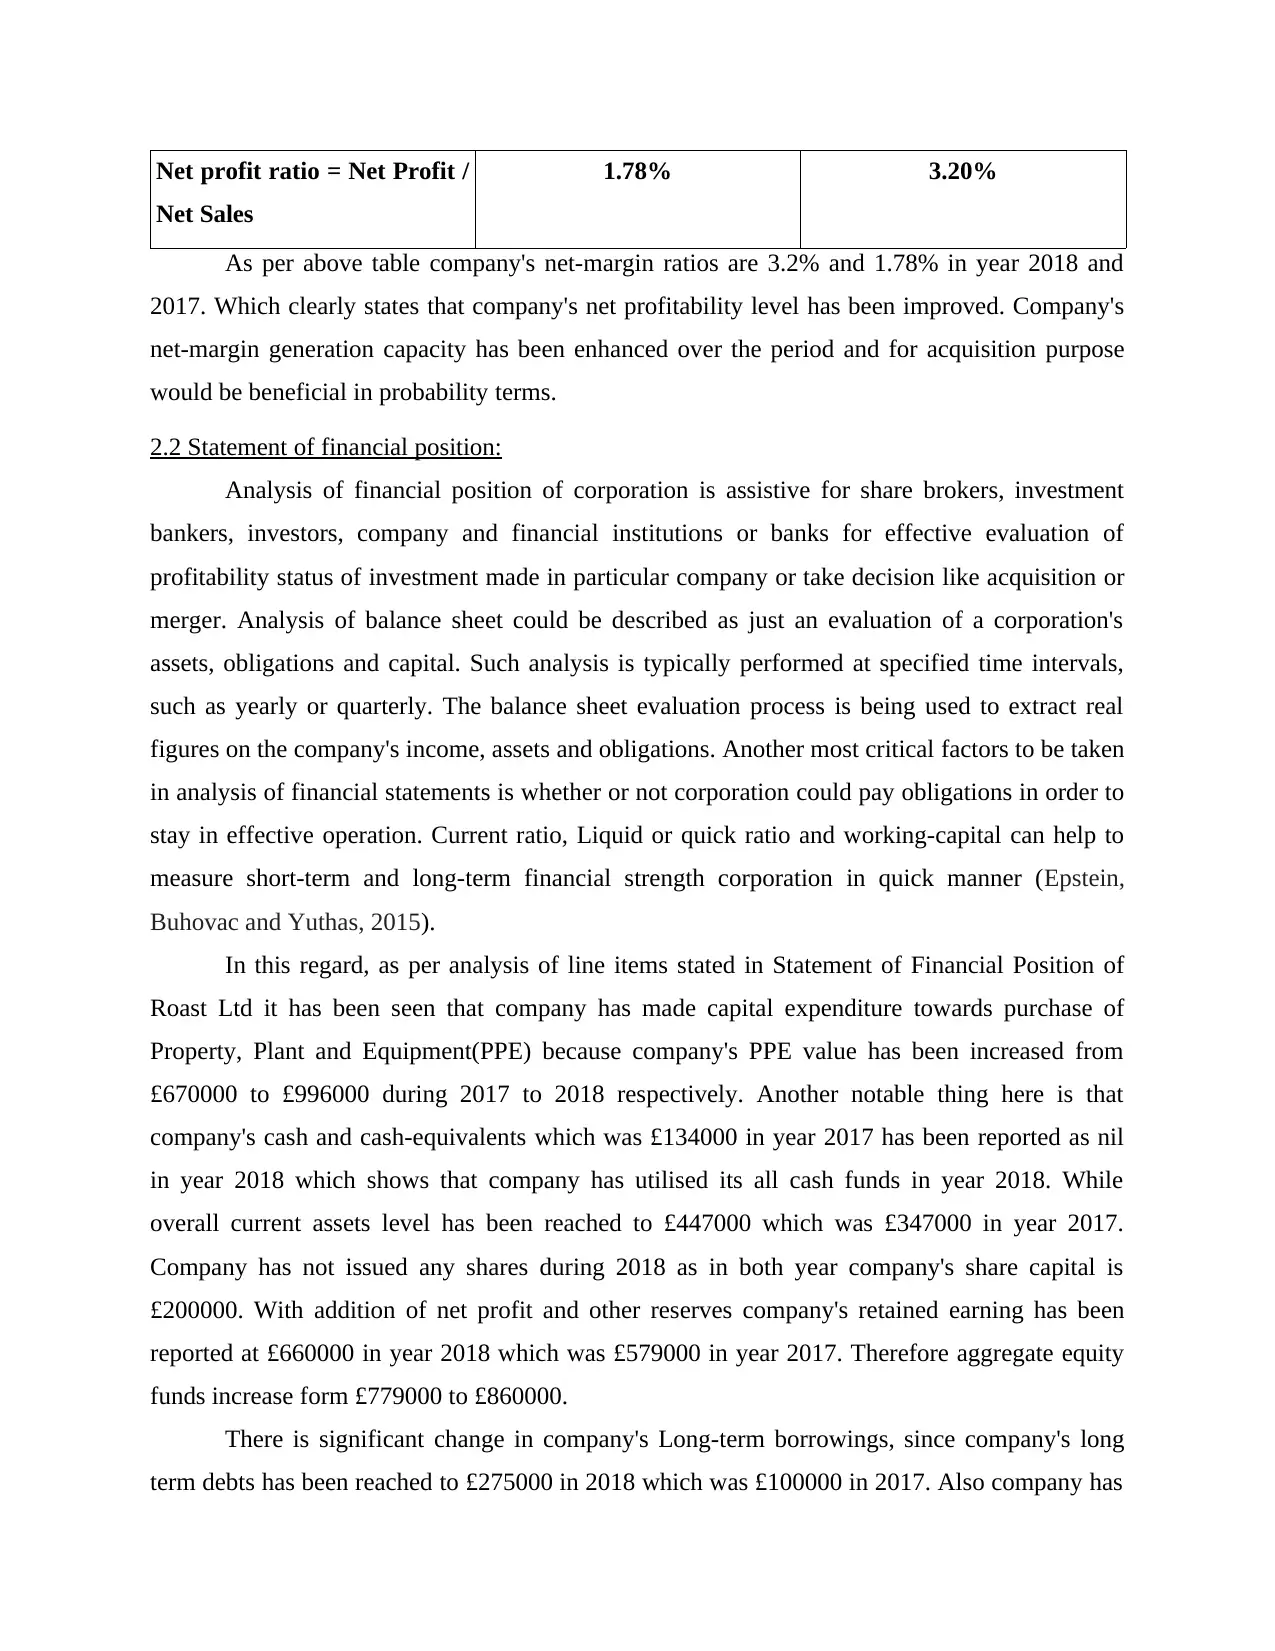
Net profit ratio = Net Profit /
Net Sales
1.78% 3.20%
As per above table company's net-margin ratios are 3.2% and 1.78% in year 2018 and
2017. Which clearly states that company's net profitability level has been improved. Company's
net-margin generation capacity has been enhanced over the period and for acquisition purpose
would be beneficial in probability terms.
2.2 Statement of financial position:
Analysis of financial position of corporation is assistive for share brokers, investment
bankers, investors, company and financial institutions or banks for effective evaluation of
profitability status of investment made in particular company or take decision like acquisition or
merger. Analysis of balance sheet could be described as just an evaluation of a corporation's
assets, obligations and capital. Such analysis is typically performed at specified time intervals,
such as yearly or quarterly. The balance sheet evaluation process is being used to extract real
figures on the company's income, assets and obligations. Another most critical factors to be taken
in analysis of financial statements is whether or not corporation could pay obligations in order to
stay in effective operation. Current ratio, Liquid or quick ratio and working-capital can help to
measure short-term and long-term financial strength corporation in quick manner (Epstein,
Buhovac and Yuthas, 2015).
In this regard, as per analysis of line items stated in Statement of Financial Position of
Roast Ltd it has been seen that company has made capital expenditure towards purchase of
Property, Plant and Equipment(PPE) because company's PPE value has been increased from
£670000 to £996000 during 2017 to 2018 respectively. Another notable thing here is that
company's cash and cash-equivalents which was £134000 in year 2017 has been reported as nil
in year 2018 which shows that company has utilised its all cash funds in year 2018. While
overall current assets level has been reached to £447000 which was £347000 in year 2017.
Company has not issued any shares during 2018 as in both year company's share capital is
£200000. With addition of net profit and other reserves company's retained earning has been
reported at £660000 in year 2018 which was £579000 in year 2017. Therefore aggregate equity
funds increase form £779000 to £860000.
There is significant change in company's Long-term borrowings, since company's long
term debts has been reached to £275000 in 2018 which was £100000 in 2017. Also company has
⊘ This is a preview!⊘
Do you want full access?
Subscribe today to unlock all pages.
Trusted by 1+ million students worldwide
acquired a bank overdraft facility of £73000 in year 2018. While company's trade creditors has
been changed from 138000 to 235000 during period 2017-2018. Aggregate liabilities are
increased by £345000 (From £238000 to £583000) during year 2017 to 2018.
Moreover, for improved analysis of financial position of respective company, several key
ratios are interpreted in study while considering major line items of balance sheet. Analysis
through ratios provides more clear view about company's real time or actual fiscal position. In
this regard following are crucial ratios of company, as follows:
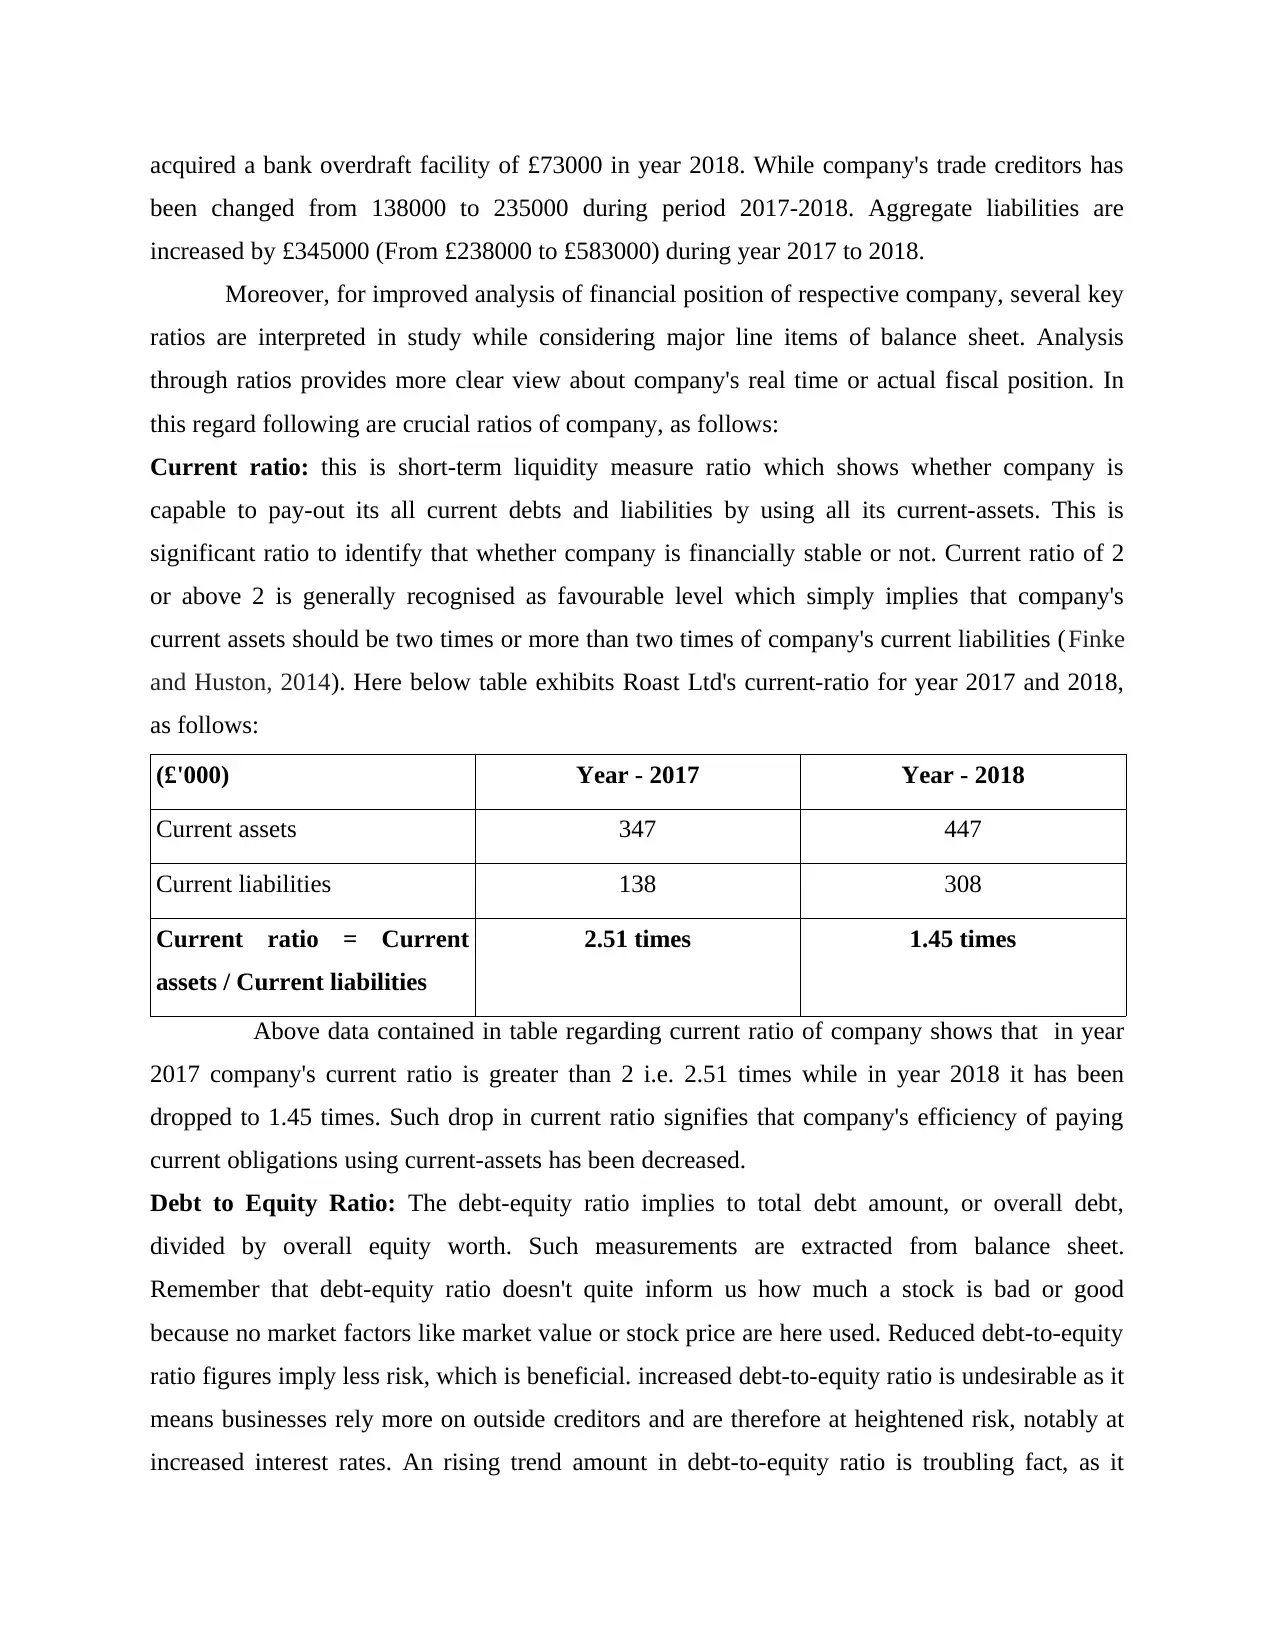
Current ratio: this is short-term liquidity measure ratio which shows whether company is
capable to pay-out its all current debts and liabilities by using all its current-assets. This is
significant ratio to identify that whether company is financially stable or not. Current ratio of 2
or above 2 is generally recognised as favourable level which simply implies that company's
current assets should be two times or more than two times of company's current liabilities (Finke
and Huston, 2014). Here below table exhibits Roast Ltd's current-ratio for year 2017 and 2018,
as follows:
(£'000) Year - 2017 Year - 2018
Current assets 347 447
Current liabilities 138 308
Current ratio = Current
assets / Current liabilities
2.51 times 1.45 times
Above data contained in table regarding current ratio of company shows that in year
2017 company's current ratio is greater than 2 i.e. 2.51 times while in year 2018 it has been
dropped to 1.45 times. Such drop in current ratio signifies that company's efficiency of paying
current obligations using current-assets has been decreased.
Debt to Equity Ratio: The debt-equity ratio implies to total debt amount, or overall debt,
divided by overall equity worth. Such measurements are extracted from balance sheet.
Remember that debt-equity ratio doesn't quite inform us how much a stock is bad or good
because no market factors like market value or stock price are here used. Reduced debt-to-equity
ratio figures imply less risk, which is beneficial. increased debt-to-equity ratio is undesirable as it
means businesses rely more on outside creditors and are therefore at heightened risk, notably at
increased interest rates. An rising trend amount in debt-to-equity ratio is troubling fact, as it
been changed from 138000 to 235000 during period 2017-2018. Aggregate liabilities are
increased by £345000 (From £238000 to £583000) during year 2017 to 2018.
Moreover, for improved analysis of financial position of respective company, several key
ratios are interpreted in study while considering major line items of balance sheet. Analysis
through ratios provides more clear view about company's real time or actual fiscal position. In
this regard following are crucial ratios of company, as follows:
Current ratio: this is short-term liquidity measure ratio which shows whether company is
capable to pay-out its all current debts and liabilities by using all its current-assets. This is
significant ratio to identify that whether company is financially stable or not. Current ratio of 2
or above 2 is generally recognised as favourable level which simply implies that company's
current assets should be two times or more than two times of company's current liabilities (Finke
and Huston, 2014). Here below table exhibits Roast Ltd's current-ratio for year 2017 and 2018,
as follows:
(£'000) Year - 2017 Year - 2018
Current assets 347 447
Current liabilities 138 308
Current ratio = Current
assets / Current liabilities
2.51 times 1.45 times
Above data contained in table regarding current ratio of company shows that in year
2017 company's current ratio is greater than 2 i.e. 2.51 times while in year 2018 it has been
dropped to 1.45 times. Such drop in current ratio signifies that company's efficiency of paying
current obligations using current-assets has been decreased.
Debt to Equity Ratio: The debt-equity ratio implies to total debt amount, or overall debt,
divided by overall equity worth. Such measurements are extracted from balance sheet.
Remember that debt-equity ratio doesn't quite inform us how much a stock is bad or good
because no market factors like market value or stock price are here used. Reduced debt-to-equity
ratio figures imply less risk, which is beneficial. increased debt-to-equity ratio is undesirable as it
means businesses rely more on outside creditors and are therefore at heightened risk, notably at
increased interest rates. An rising trend amount in debt-to-equity ratio is troubling fact, as it
Paraphrase This Document
Need a fresh take? Get an instant paraphrase of this document with our AI Paraphraser
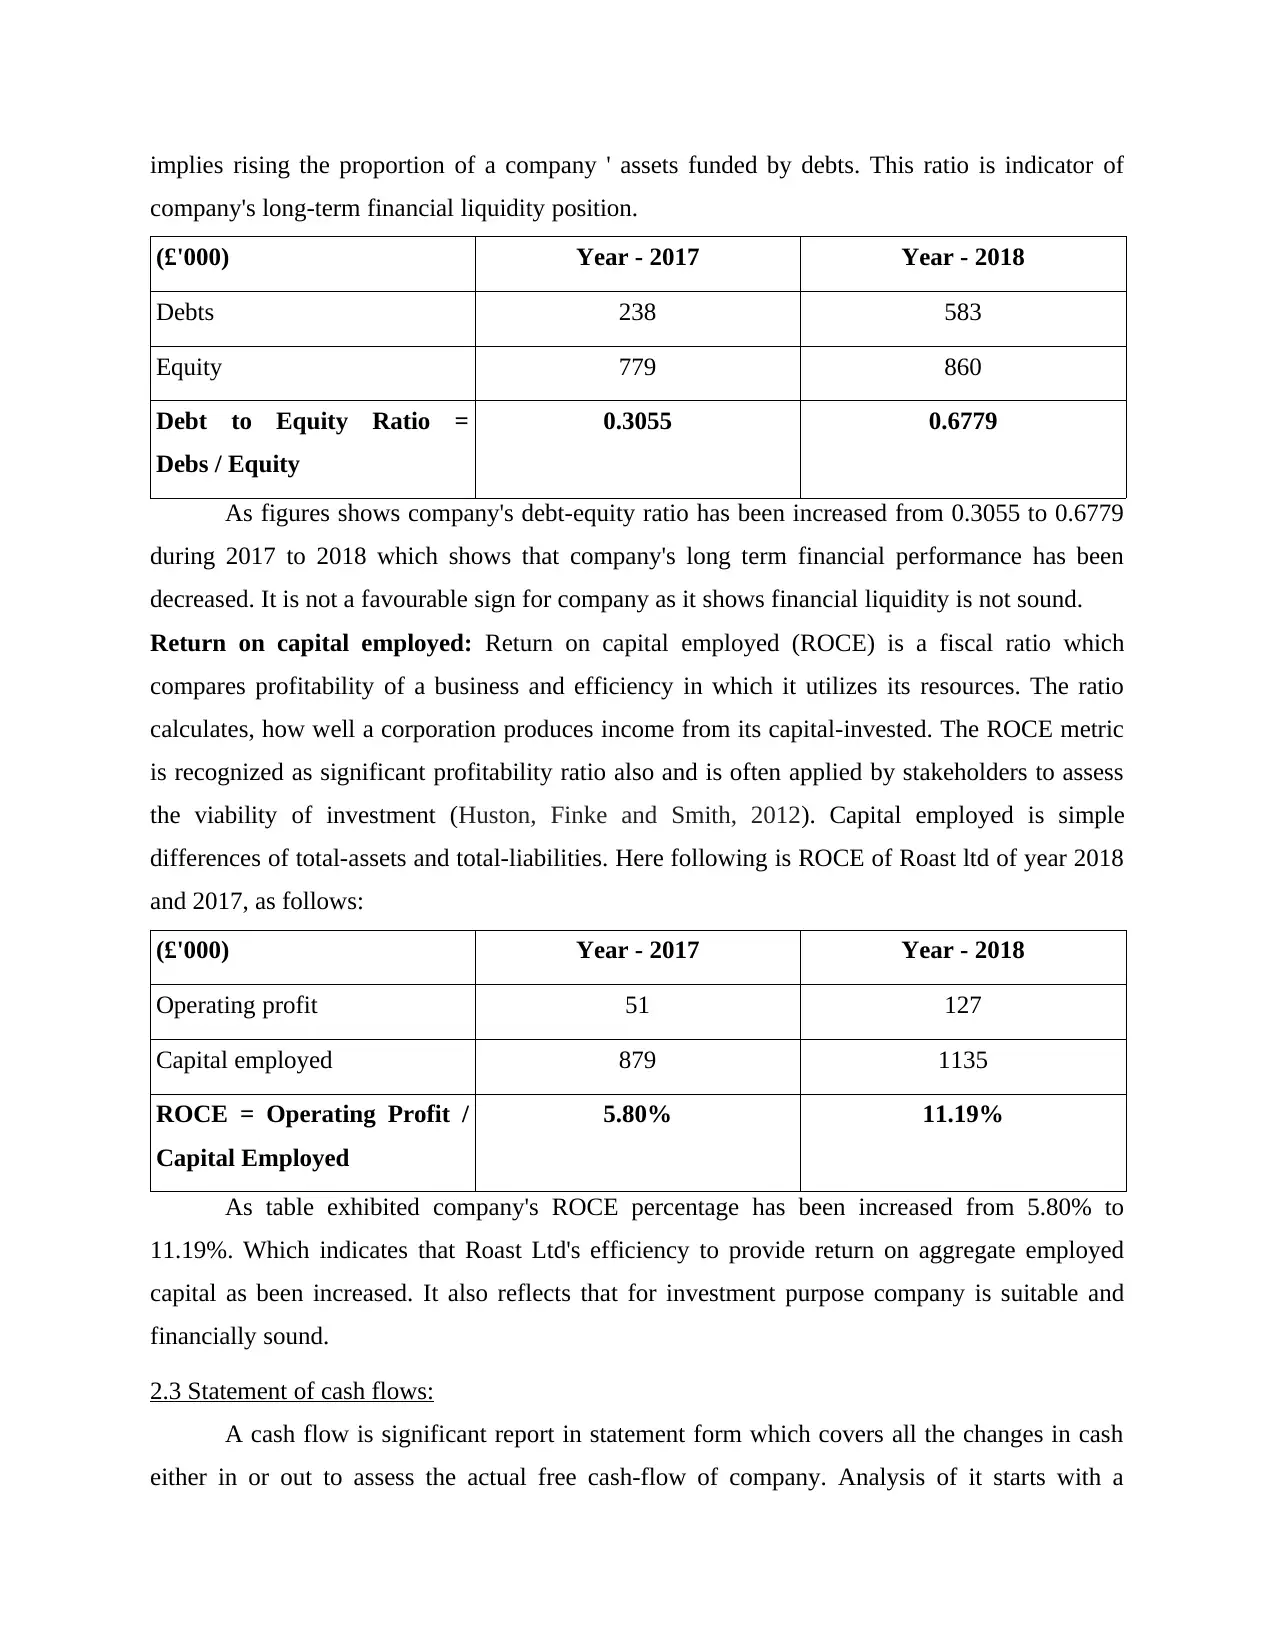
implies rising the proportion of a company ' assets funded by debts. This ratio is indicator of
company's long-term financial liquidity position.
(£'000) Year - 2017 Year - 2018
Debts 238 583
Equity 779 860
Debt to Equity Ratio =
Debs / Equity
0.3055 0.6779
As figures shows company's debt-equity ratio has been increased from 0.3055 to 0.6779
during 2017 to 2018 which shows that company's long term financial performance has been
decreased. It is not a favourable sign for company as it shows financial liquidity is not sound.
Return on capital employed: Return on capital employed (ROCE) is a fiscal ratio which
compares profitability of a business and efficiency in which it utilizes its resources. The ratio
calculates, how well a corporation produces income from its capital-invested. The ROCE metric
is recognized as significant profitability ratio also and is often applied by stakeholders to assess
the viability of investment (Huston, Finke and Smith, 2012). Capital employed is simple
differences of total-assets and total-liabilities. Here following is ROCE of Roast ltd of year 2018
and 2017, as follows:
(£'000) Year - 2017 Year - 2018
Operating profit 51 127
Capital employed 879 1135
ROCE = Operating Profit /
Capital Employed
5.80% 11.19%
As table exhibited company's ROCE percentage has been increased from 5.80% to
11.19%. Which indicates that Roast Ltd's efficiency to provide return on aggregate employed
capital as been increased. It also reflects that for investment purpose company is suitable and
financially sound.
2.3 Statement of cash flows:
A cash flow is significant report in statement form which covers all the changes in cash
either in or out to assess the actual free cash-flow of company. Analysis of it starts with a
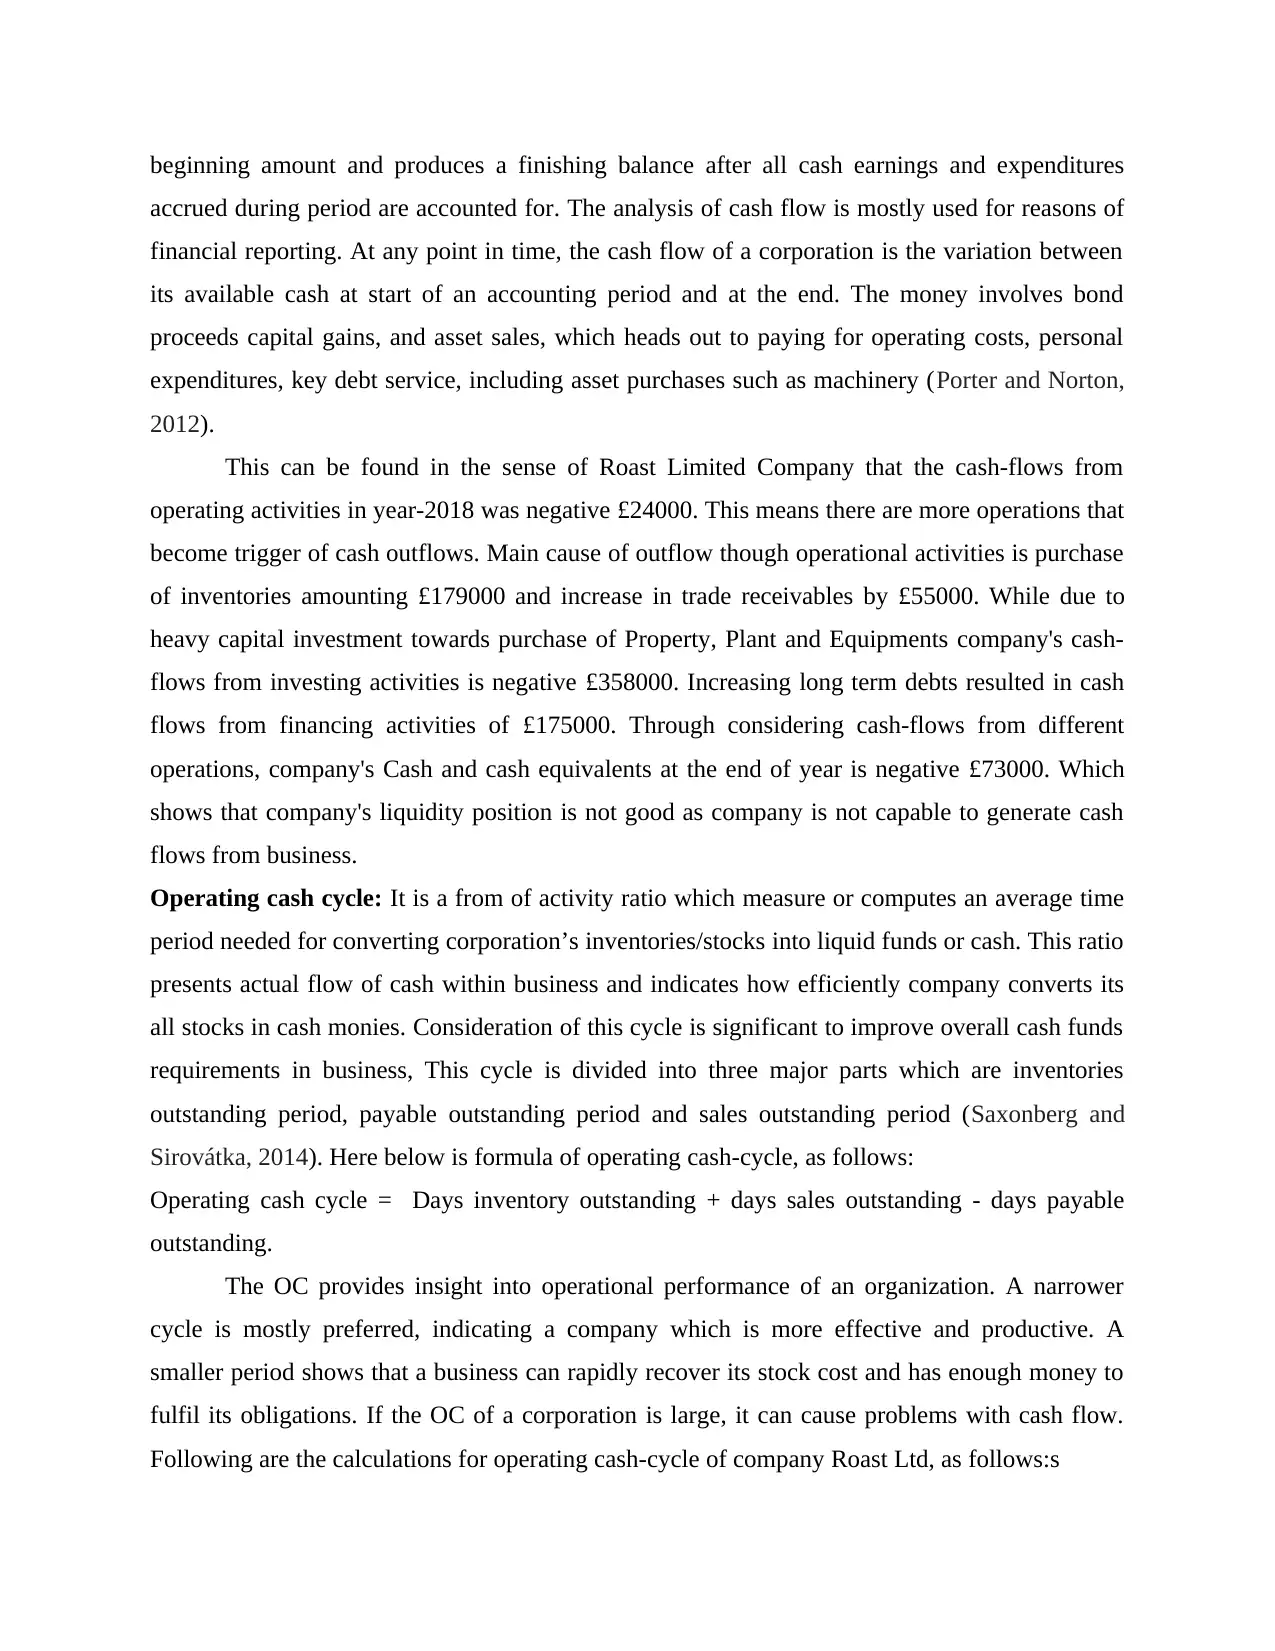
beginning amount and produces a finishing balance after all cash earnings and expenditures
accrued during period are accounted for. The analysis of cash flow is mostly used for reasons of
financial reporting. At any point in time, the cash flow of a corporation is the variation between
its available cash at start of an accounting period and at the end. The money involves bond
proceeds capital gains, and asset sales, which heads out to paying for operating costs, personal
expenditures, key debt service, including asset purchases such as machinery (Porter and Norton,
2012).
This can be found in the sense of Roast Limited Company that the cash-flows from
operating activities in year-2018 was negative £24000. This means there are more operations that
become trigger of cash outflows. Main cause of outflow though operational activities is purchase
of inventories amounting £179000 and increase in trade receivables by £55000. While due to
heavy capital investment towards purchase of Property, Plant and Equipments company's cash-
flows from investing activities is negative £358000. Increasing long term debts resulted in cash
flows from financing activities of £175000. Through considering cash-flows from different
operations, company's Cash and cash equivalents at the end of year is negative £73000. Which
shows that company's liquidity position is not good as company is not capable to generate cash
flows from business.
Operating cash cycle: It is a from of activity ratio which measure or computes an average time
period needed for converting corporation’s inventories/stocks into liquid funds or cash. This ratio
presents actual flow of cash within business and indicates how efficiently company converts its
all stocks in cash monies. Consideration of this cycle is significant to improve overall cash funds
requirements in business, This cycle is divided into three major parts which are inventories
outstanding period, payable outstanding period and sales outstanding period (Saxonberg and
Sirovátka, 2014). Here below is formula of operating cash-cycle, as follows:
Operating cash cycle = Days inventory outstanding + days sales outstanding - days payable
outstanding.
The OC provides insight into operational performance of an organization. A narrower
cycle is mostly preferred, indicating a company which is more effective and productive. A
smaller period shows that a business can rapidly recover its stock cost and has enough money to
fulfil its obligations. If the OC of a corporation is large, it can cause problems with cash flow.
Following are the calculations for operating cash-cycle of company Roast Ltd, as follows:s
⊘ This is a preview!⊘
Do you want full access?
Subscribe today to unlock all pages.
Trusted by 1+ million students worldwide
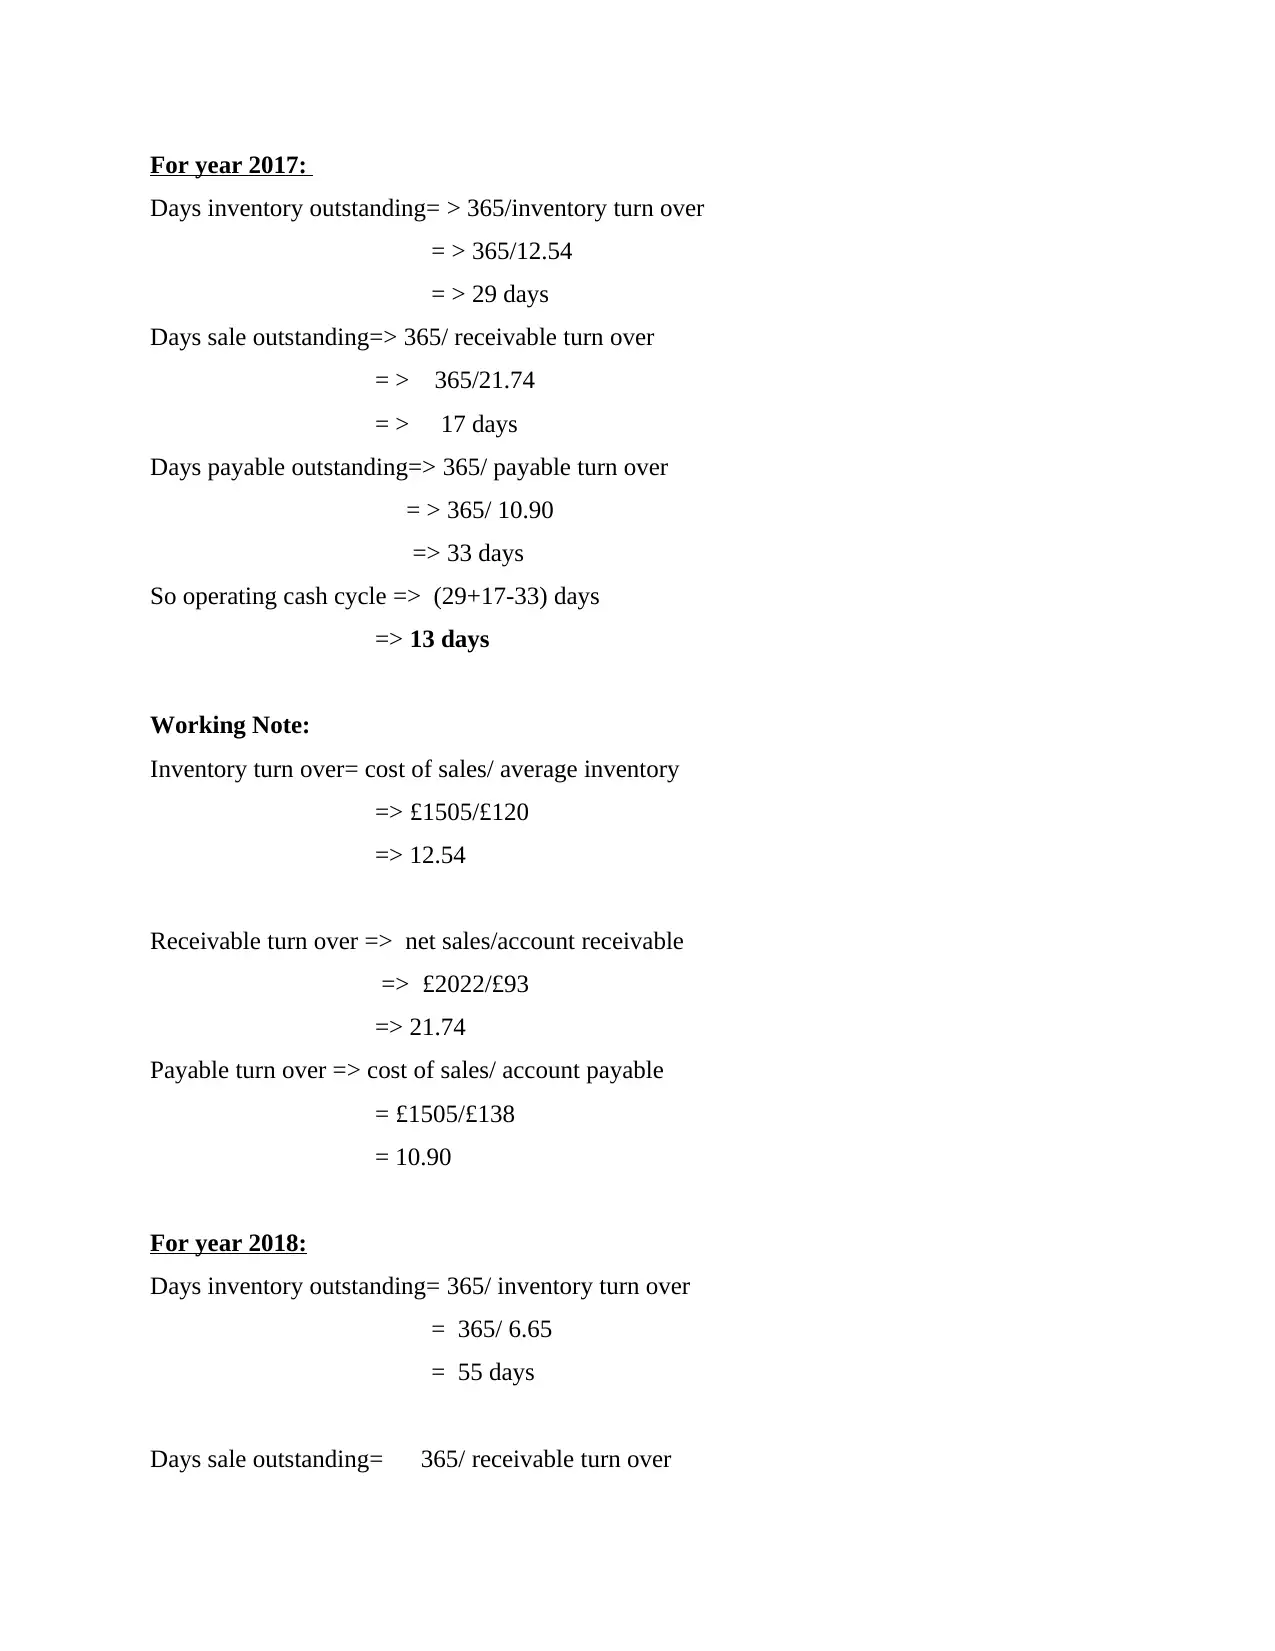
For year 2017:
Days inventory outstanding= > 365/inventory turn over
= > 365/12.54
= > 29 days
Days sale outstanding=> 365/ receivable turn over
= > 365/21.74
= > 17 days
Days payable outstanding=> 365/ payable turn over
= > 365/ 10.90
=> 33 days
So operating cash cycle => (29+17-33) days
=> 13 days
Working Note:
Inventory turn over= cost of sales/ average inventory
=> £1505/£120
=> 12.54
Receivable turn over => net sales/account receivable
=> £2022/£93
=> 21.74
Payable turn over => cost of sales/ account payable
= £1505/£138
= 10.90
For year 2018:
Days inventory outstanding= 365/ inventory turn over
= 365/ 6.65
= 55 days
Days sale outstanding= 365/ receivable turn over
Paraphrase This Document
Need a fresh take? Get an instant paraphrase of this document with our AI Paraphraser
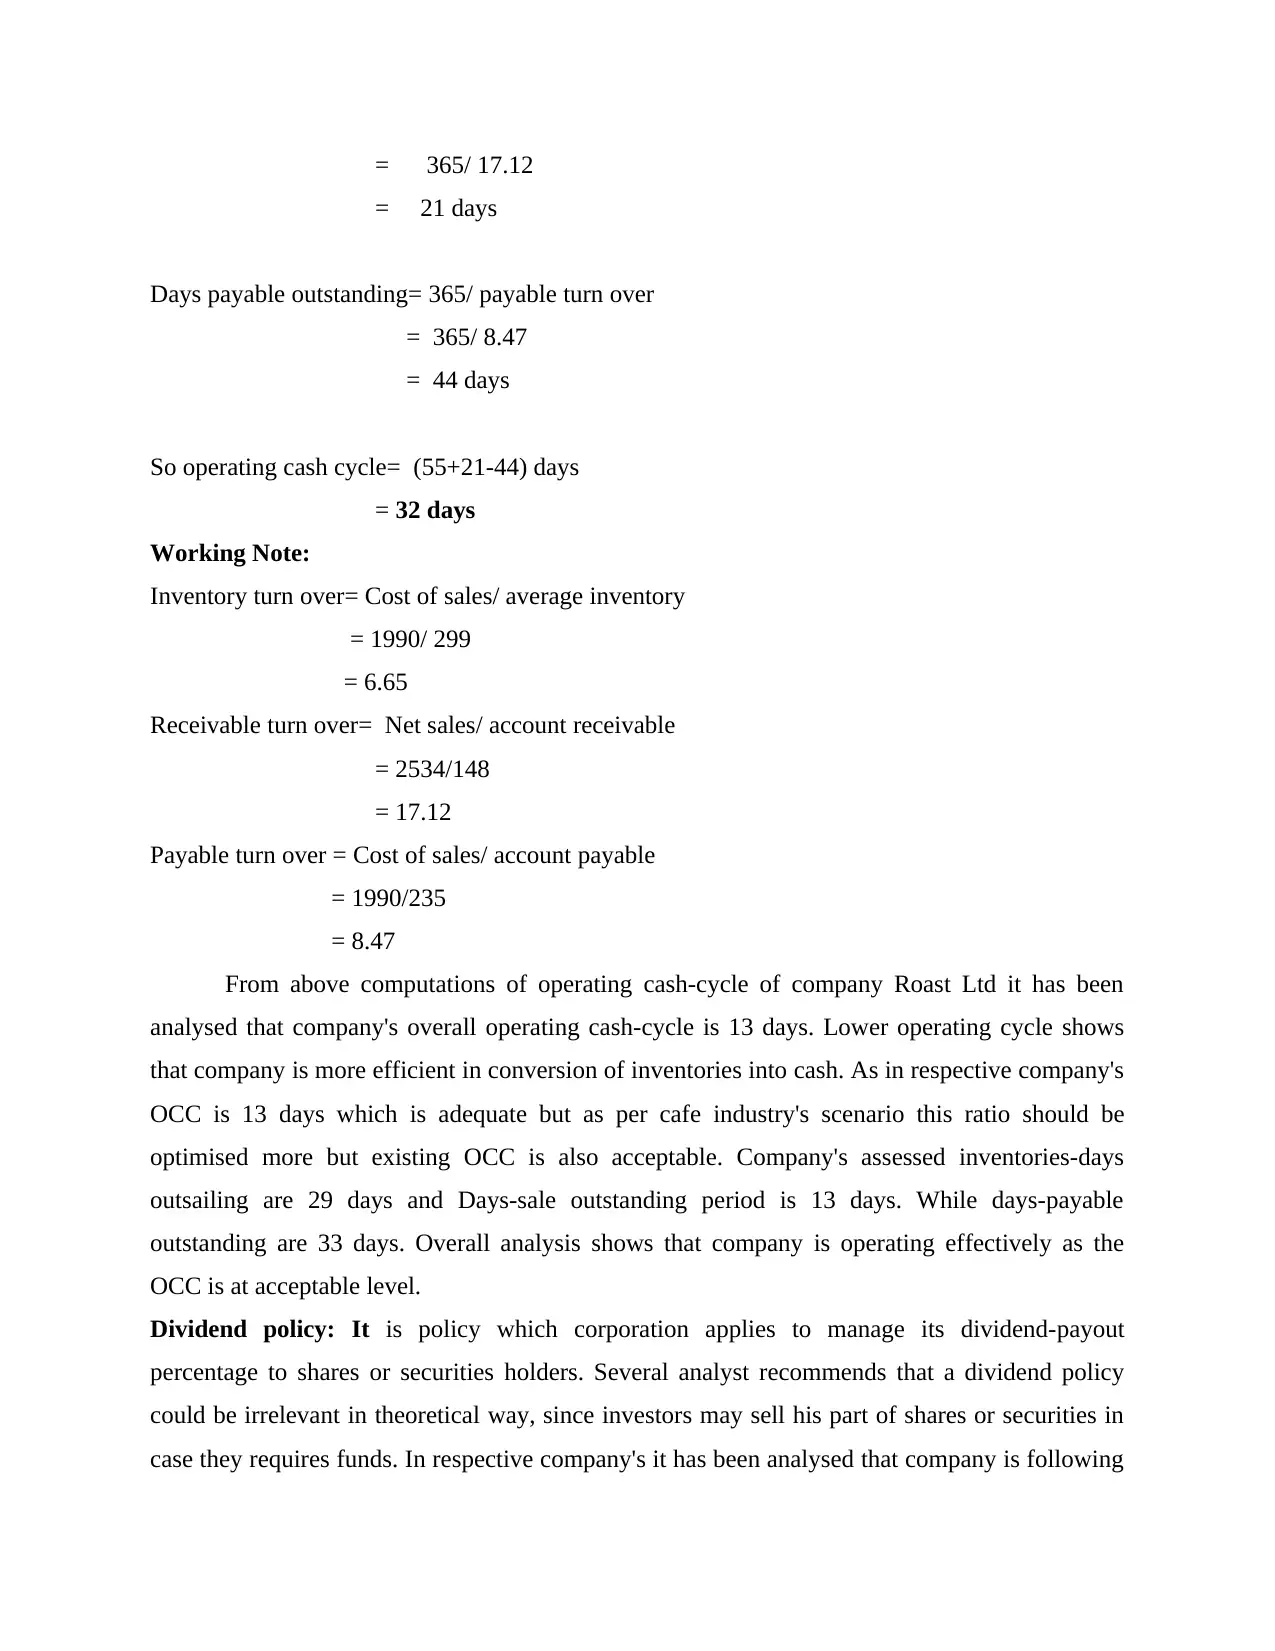
= 365/ 17.12
= 21 days
Days payable outstanding= 365/ payable turn over
= 365/ 8.47
= 44 days
So operating cash cycle= (55+21-44) days
= 32 days
Working Note:
Inventory turn over= Cost of sales/ average inventory
= 1990/ 299
= 6.65
Receivable turn over= Net sales/ account receivable
= 2534/148
= 17.12
Payable turn over = Cost of sales/ account payable
= 1990/235
= 8.47
From above computations of operating cash-cycle of company Roast Ltd it has been
analysed that company's overall operating cash-cycle is 13 days. Lower operating cycle shows
that company is more efficient in conversion of inventories into cash. As in respective company's
OCC is 13 days which is adequate but as per cafe industry's scenario this ratio should be
optimised more but existing OCC is also acceptable. Company's assessed inventories-days
outsailing are 29 days and Days-sale outstanding period is 13 days. While days-payable
outstanding are 33 days. Overall analysis shows that company is operating effectively as the
OCC is at acceptable level.
Dividend policy: It is policy which corporation applies to manage its dividend-payout
percentage to shares or securities holders. Several analyst recommends that a dividend policy
could be irrelevant in theoretical way, since investors may sell his part of shares or securities in
case they requires funds. In respective company's it has been analysed that company is following
no divided policy as company's dividend payout is zero. In year 2018 Roast Ltd has not paid any
dividend amount to its shareholders.
Part 3. Investment Appraisals:
3.1 a Management forecast:
Managing division of company Roast limited is attempting to make capital investment of
around £500 million. With a forecast made about of cash-flows during five years period from
year-2017 to year-2021. As per their forecast company's cash-inflow or contribution during
stated period would be £60, £112, £148, £180 and £224 million respectively. But during 2017
and 2018 this estimation has gone wrong. Further decline in gross margin and negative cash
flow shows that company will not achieve such forecasts of management. So it is advisable to
readjust such forecast as per company's current performance.
3.1 b Investment appraisal technique:
These are considered as specific tools and measures which are used to define viability of
any financial decision and investment made by company. Main investment-appraisal techniques
are profitability index, net-present value, internal rate-of-return, payback period, and accounting
rate-of-return. They are mainly applied to evaluate performance of any new project like
acquisition or merger decision. In this context following is discussion upon different major
investment appraisal-techniques, as follows:
Payback period: it simply indicates the time-period needed to retrieve aggregate initial costs
involved in investment or project. Simply it defines no. of years company can take to reimburse
initial investment in project. As stated in exhibit:3 company's payback period is 4 years. Which
clearly states that company would recover cash outflow of £ 500 million within 4 year which is
so such investment is viable as payback period is less then entire project period i.e. 5 year.
Benefits: This it most simplex and casual approach no complex calculation or assumptions are
required under this method.
Drawback: Inflation and time-value of money concept is totally ignored in this technique which
reduced its significance and relevancy (Montford and Goldsmith, 2016).
Accounting rate of return: This is another crucial method which shows how much percentage
return company will get from any investment. As per figures stated in Exhibit:3 ARR of
⊘ This is a preview!⊘
Do you want full access?
Subscribe today to unlock all pages.
Trusted by 1+ million students worldwide
1 out of 15
Related Documents


Your All-in-One AI-Powered Toolkit for Academic Success.
+13062052269
info@desklib.com
Available 24*7 on WhatsApp / Email
![[object Object]](/_next/static/media/star-bottom.7253800d.svg)
Unlock your academic potential
Copyright © 2020–2026 A2Z Services. All Rights Reserved. Developed and managed by ZUCOL.