Financial Decision Making: Comparative Financial Ratio Analysis

Verified

Added on  2022/10/17

|16
|1980
|13
Report
AI Summary
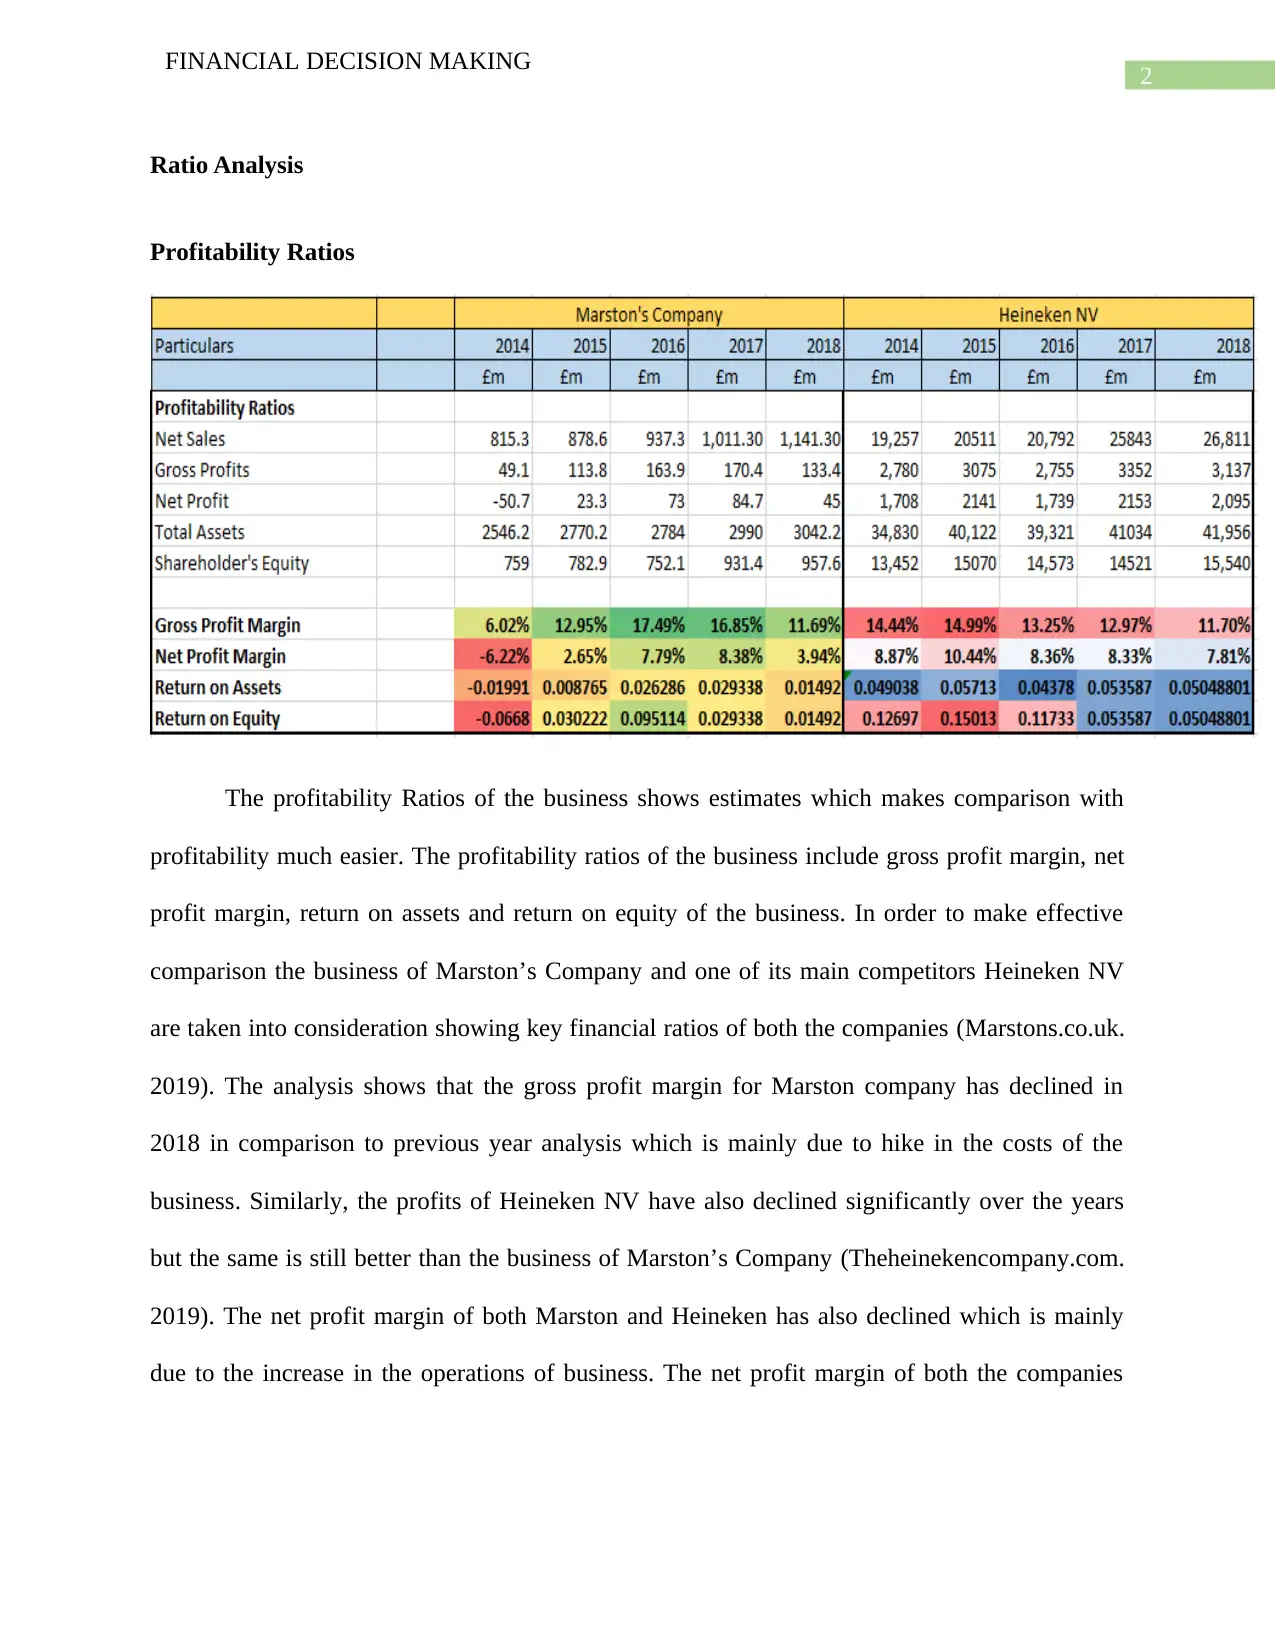
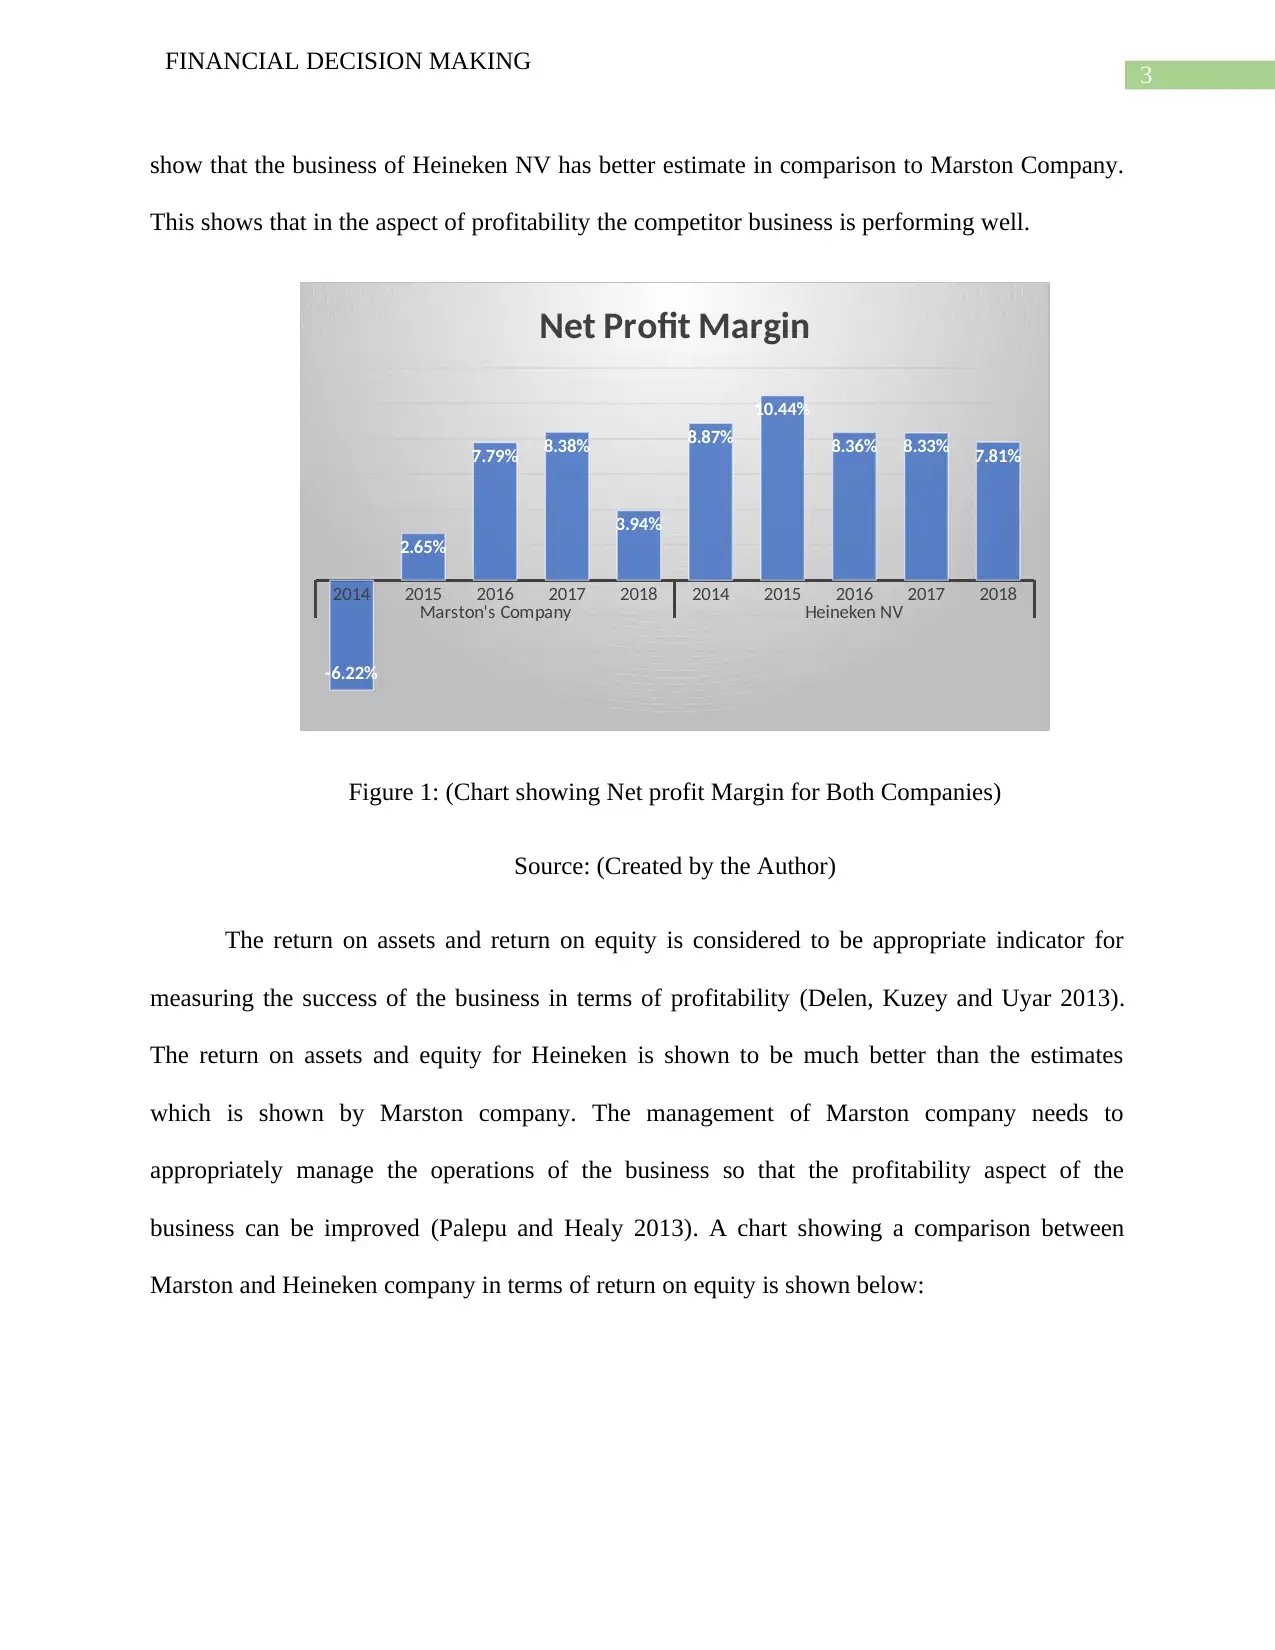
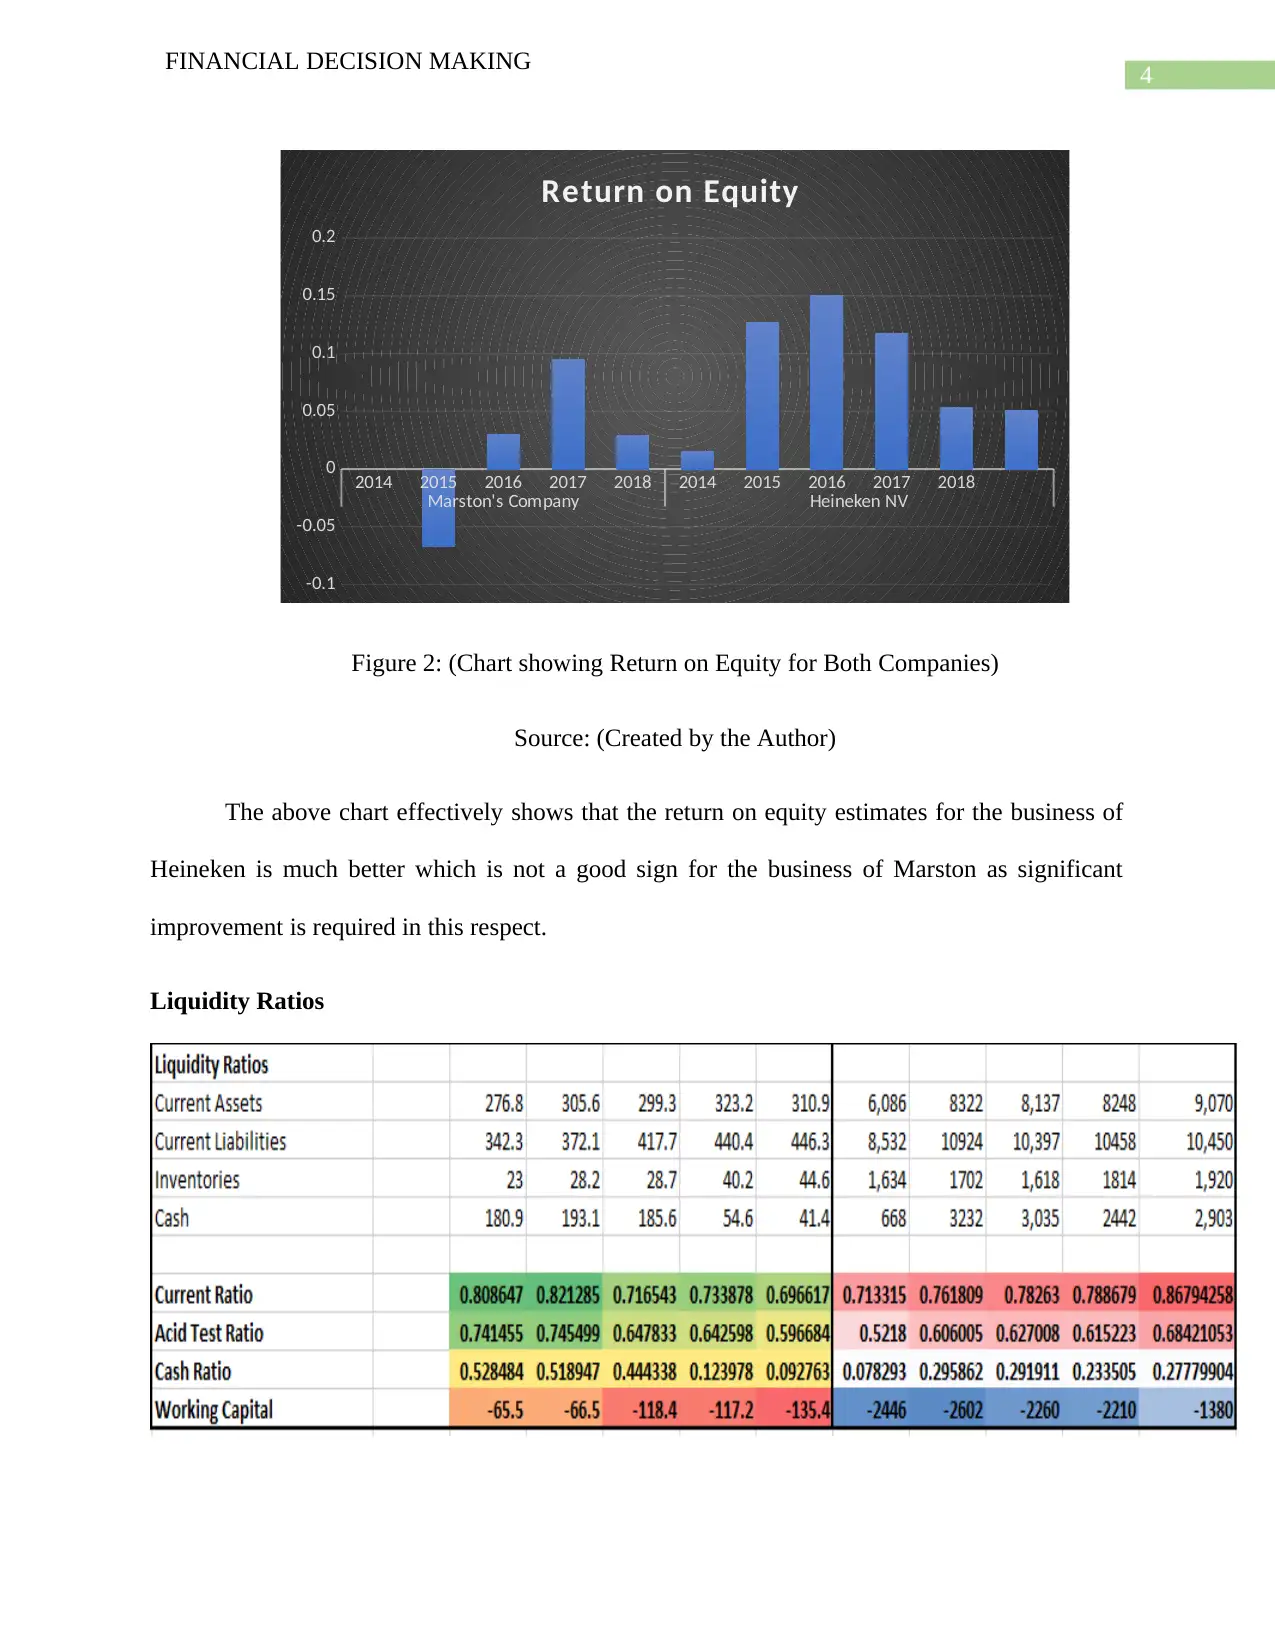
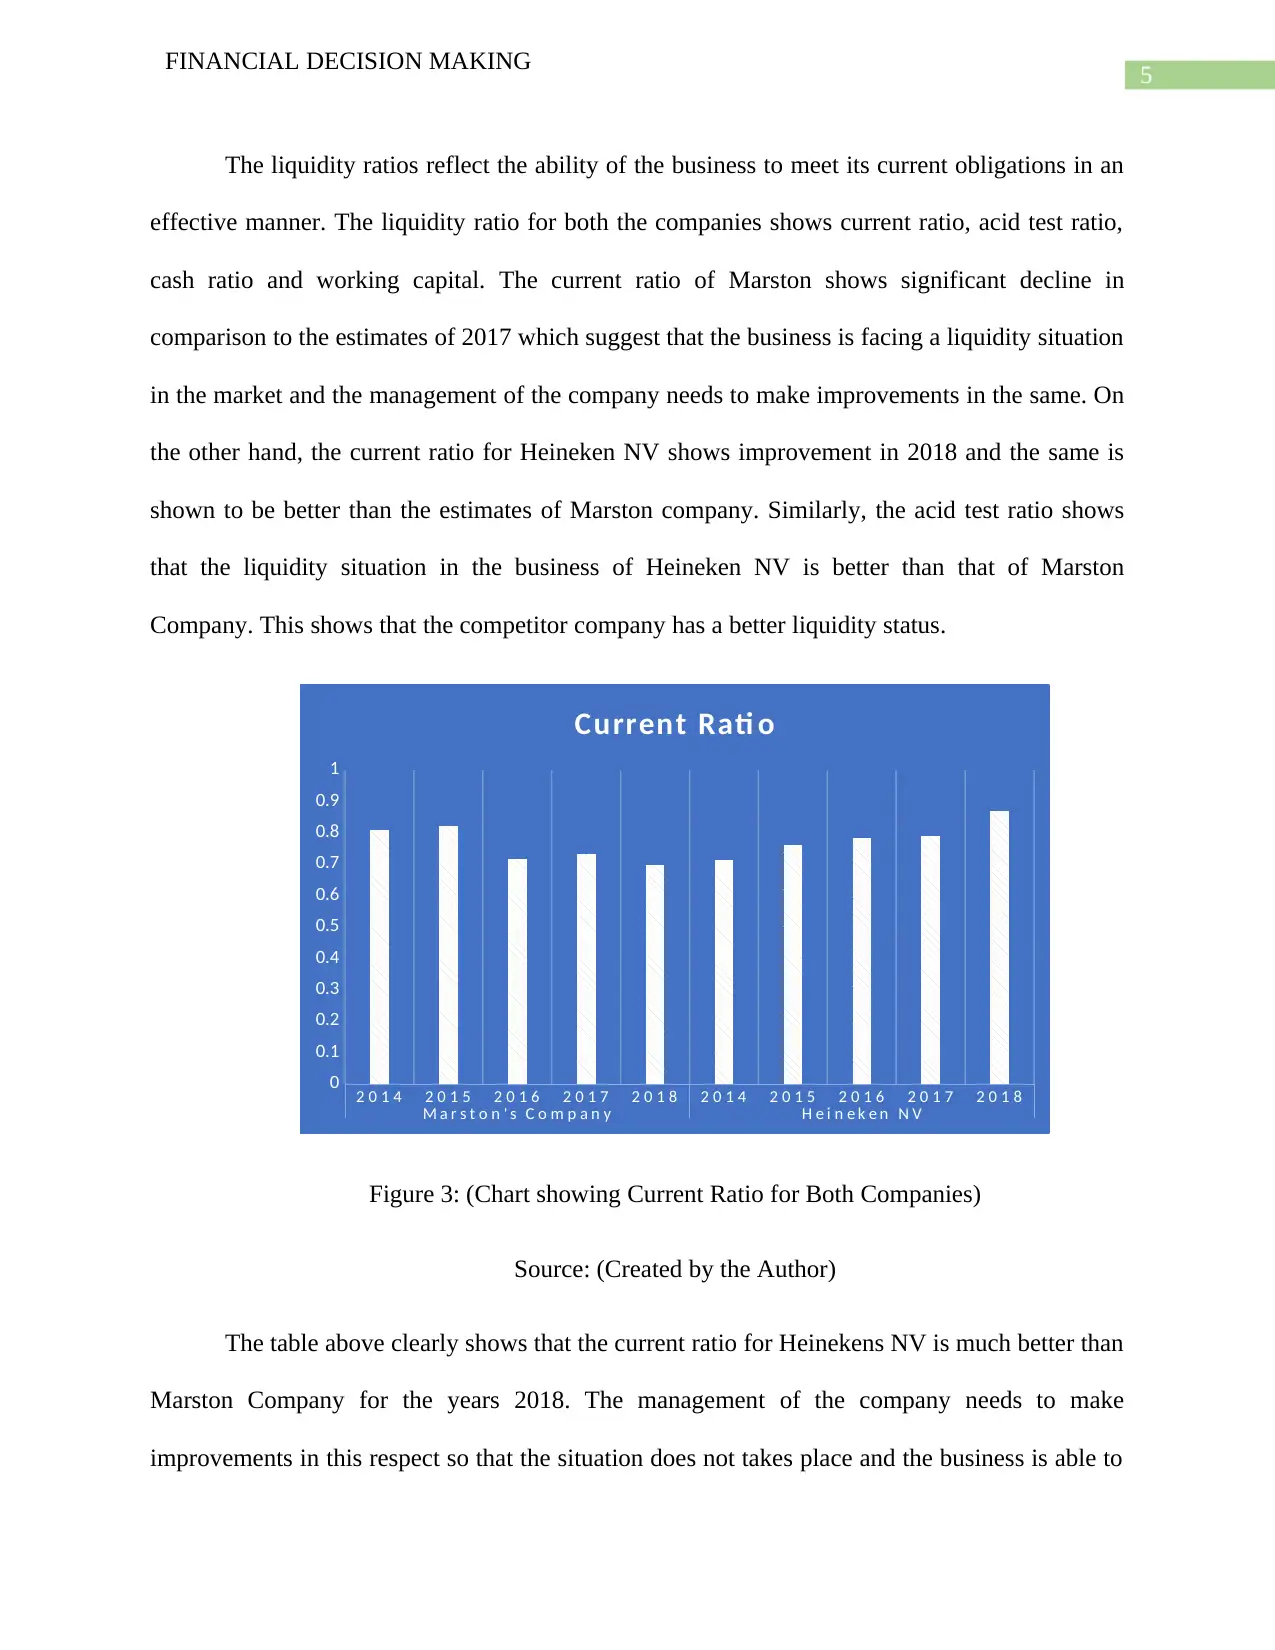
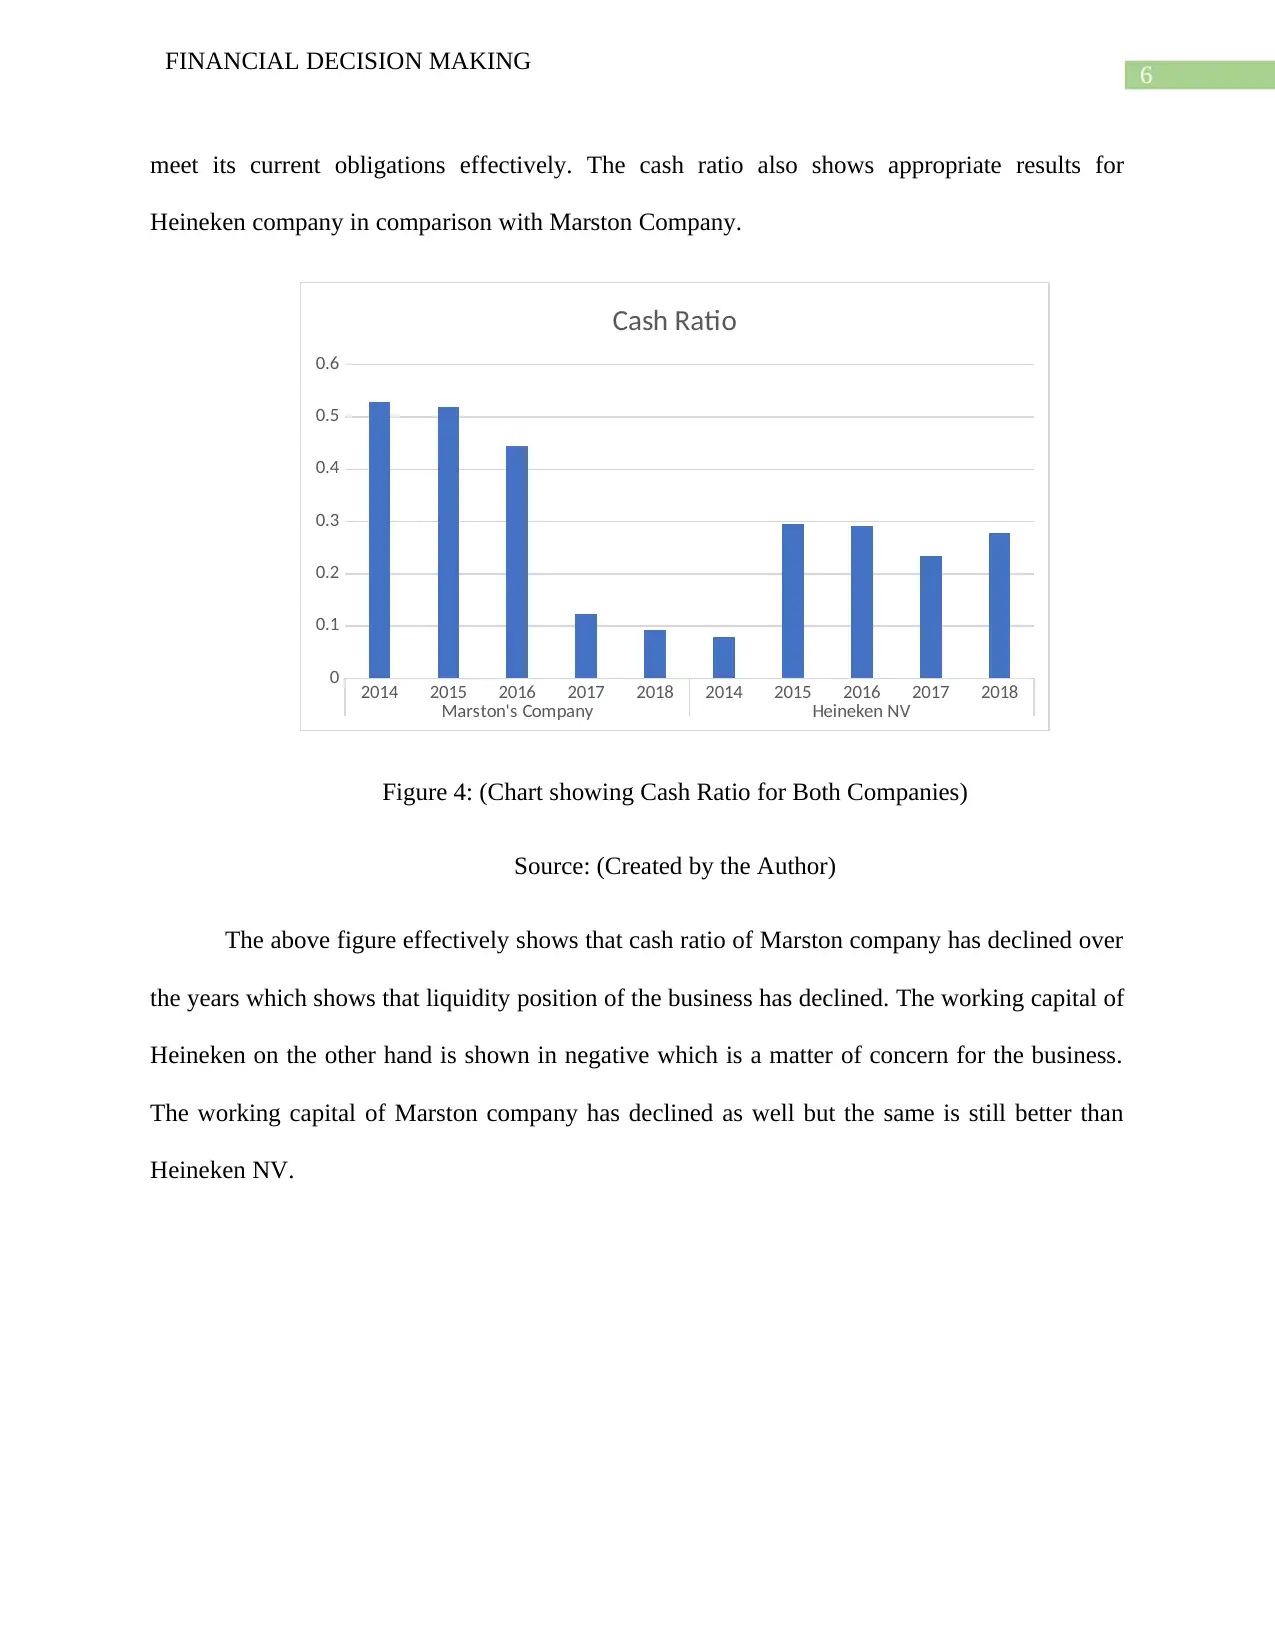
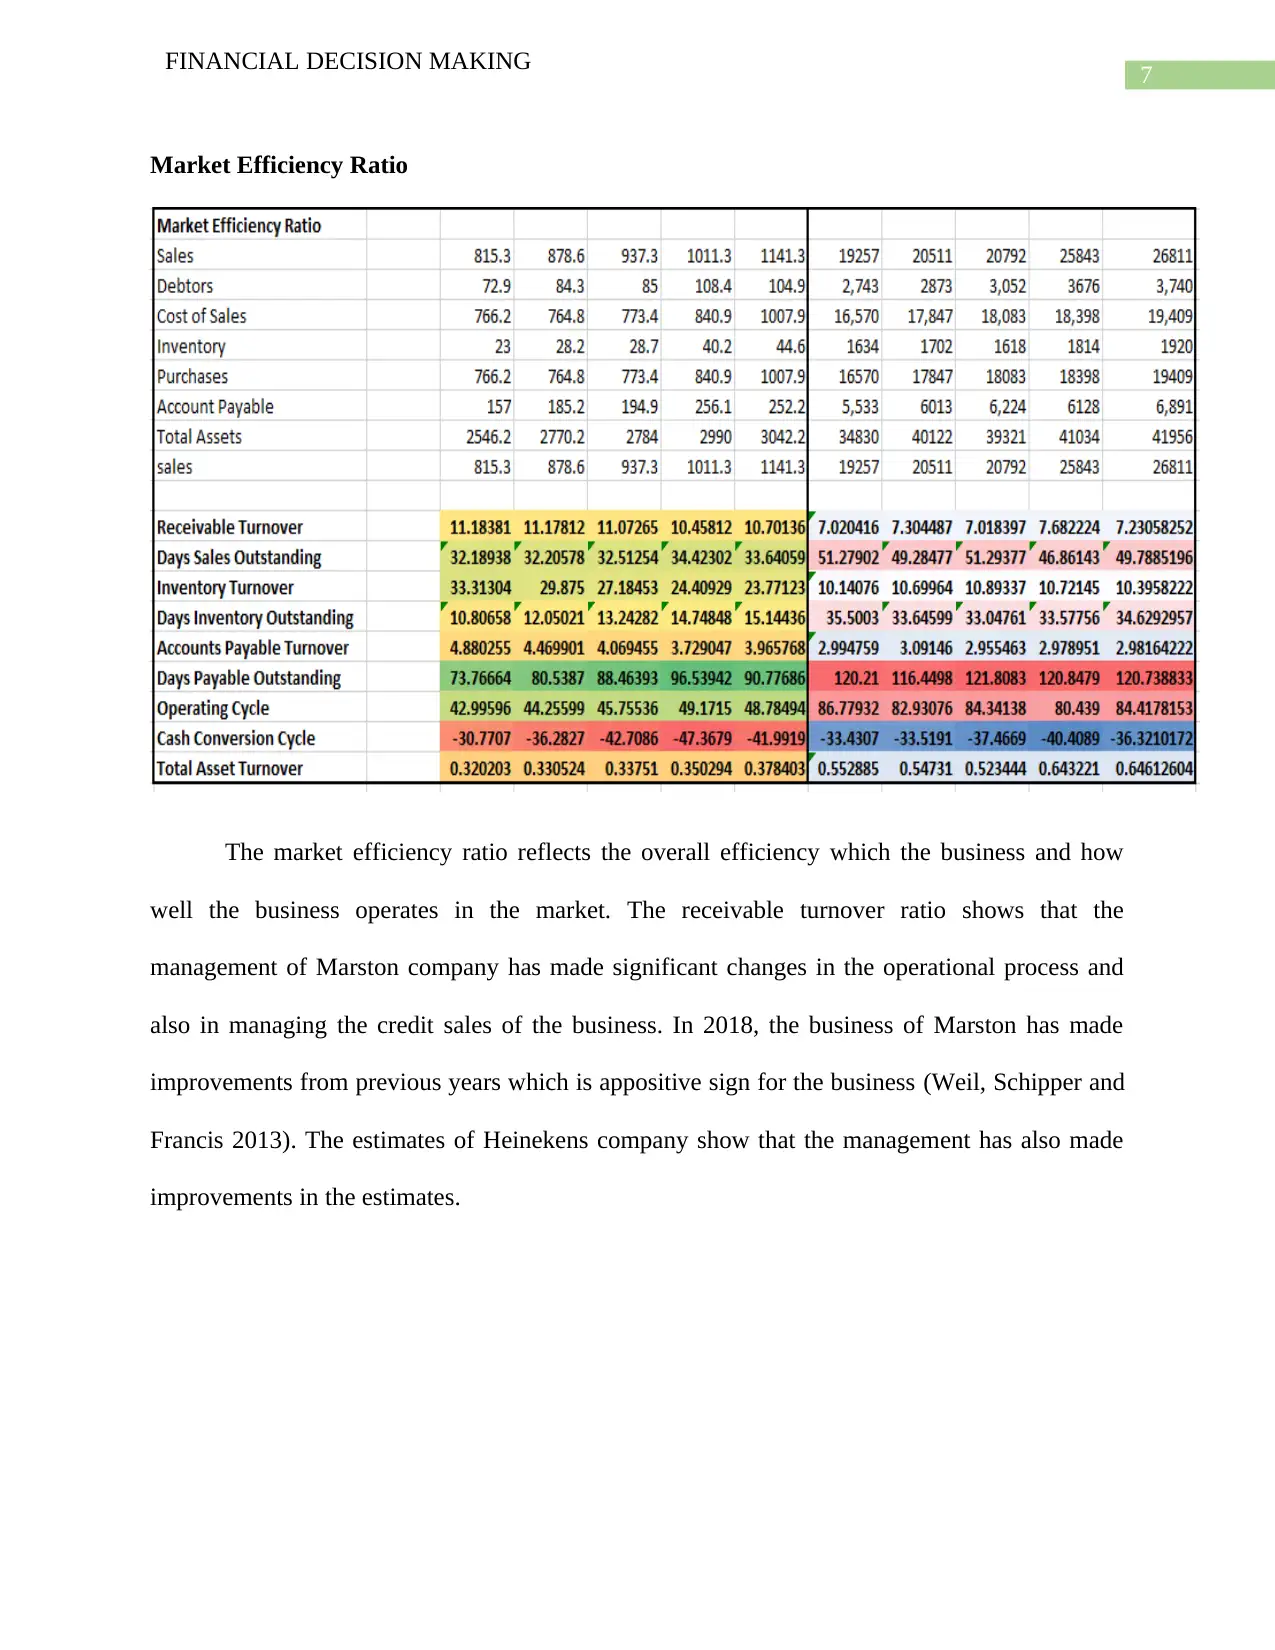
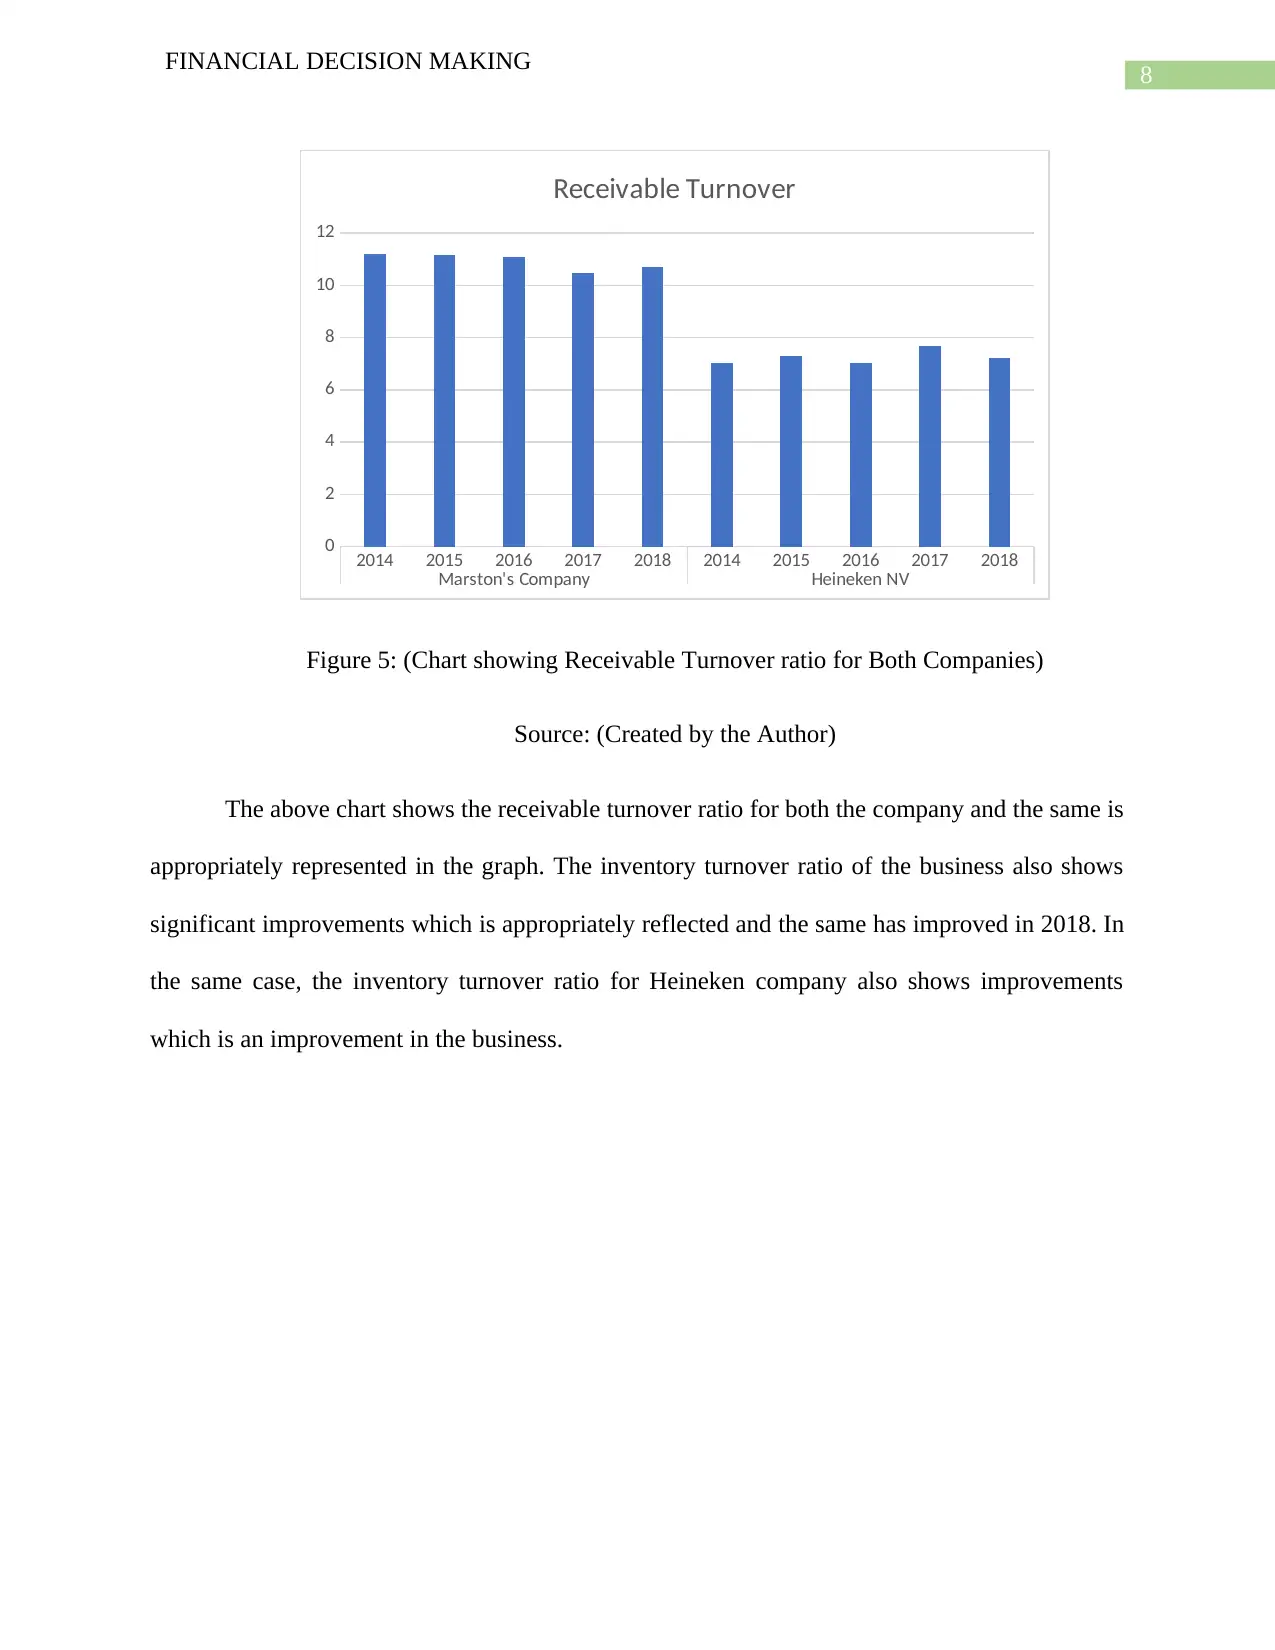
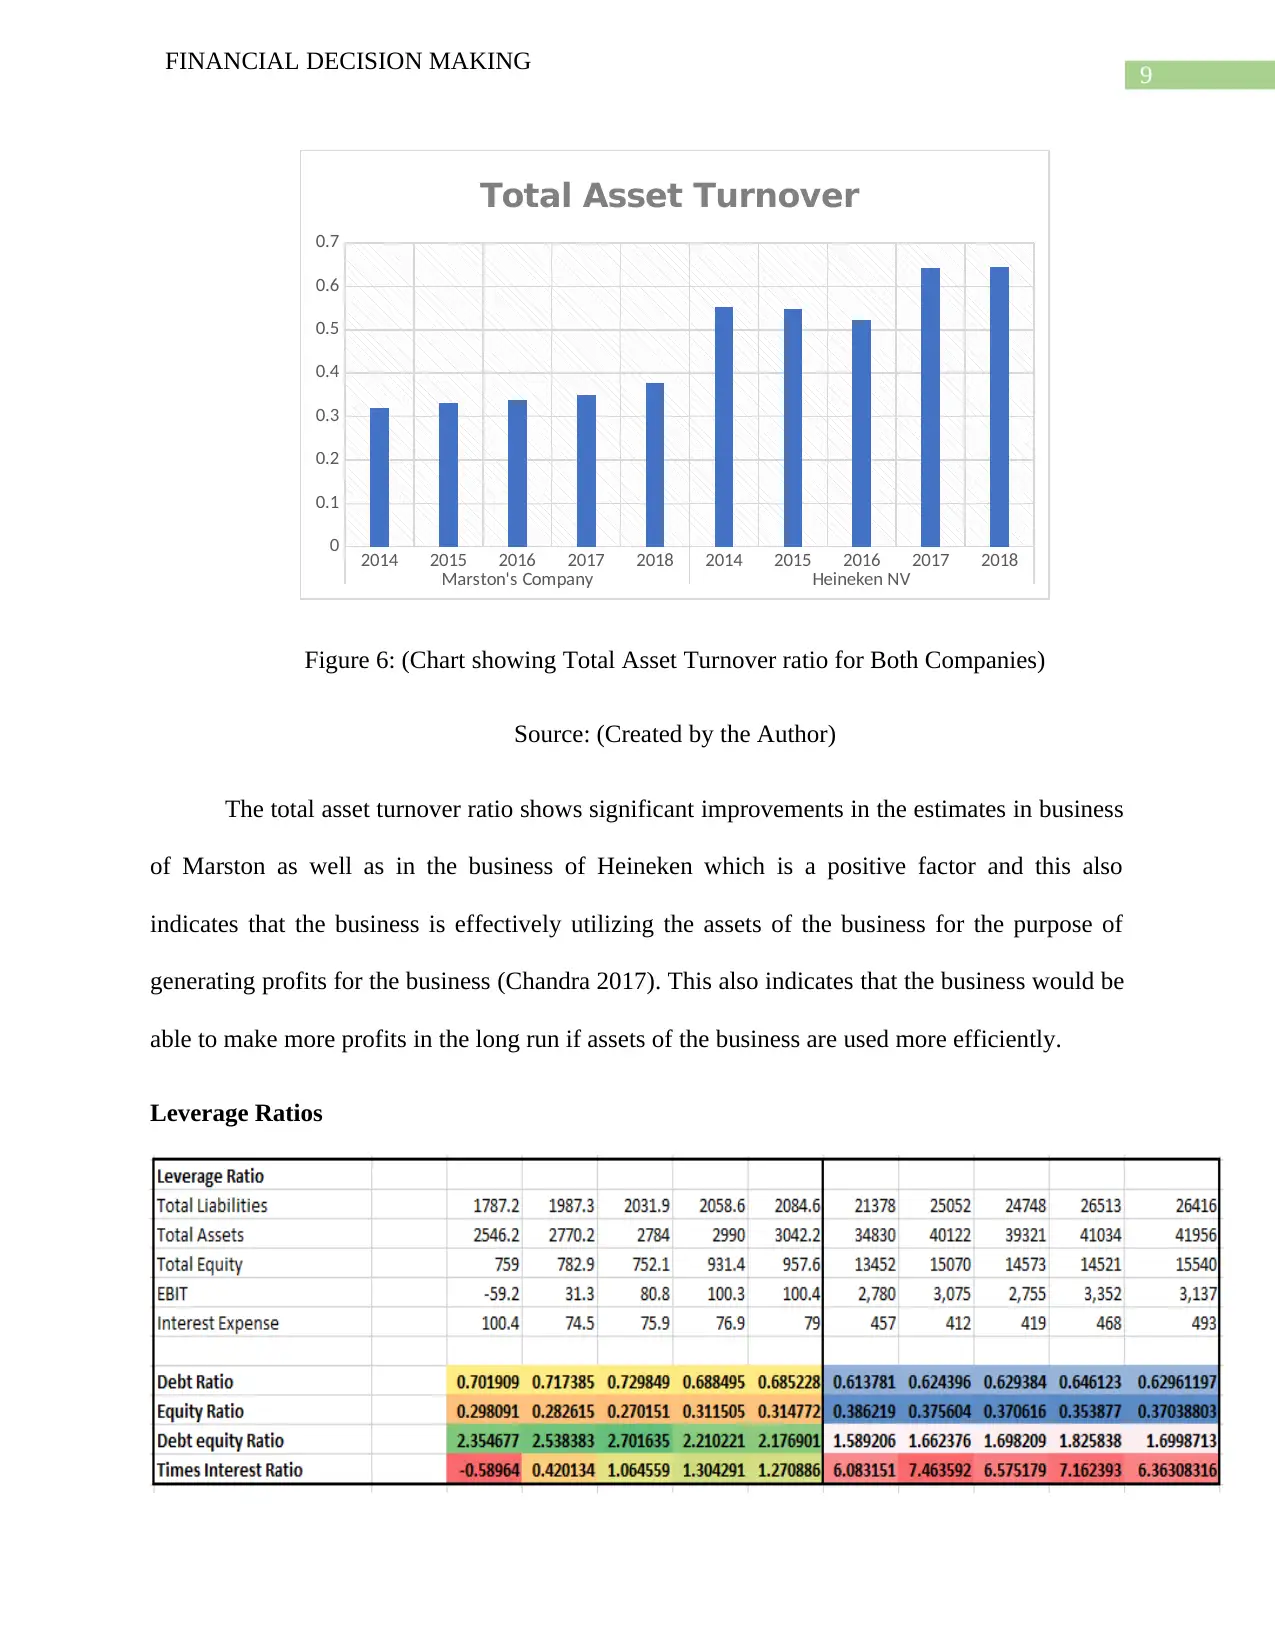
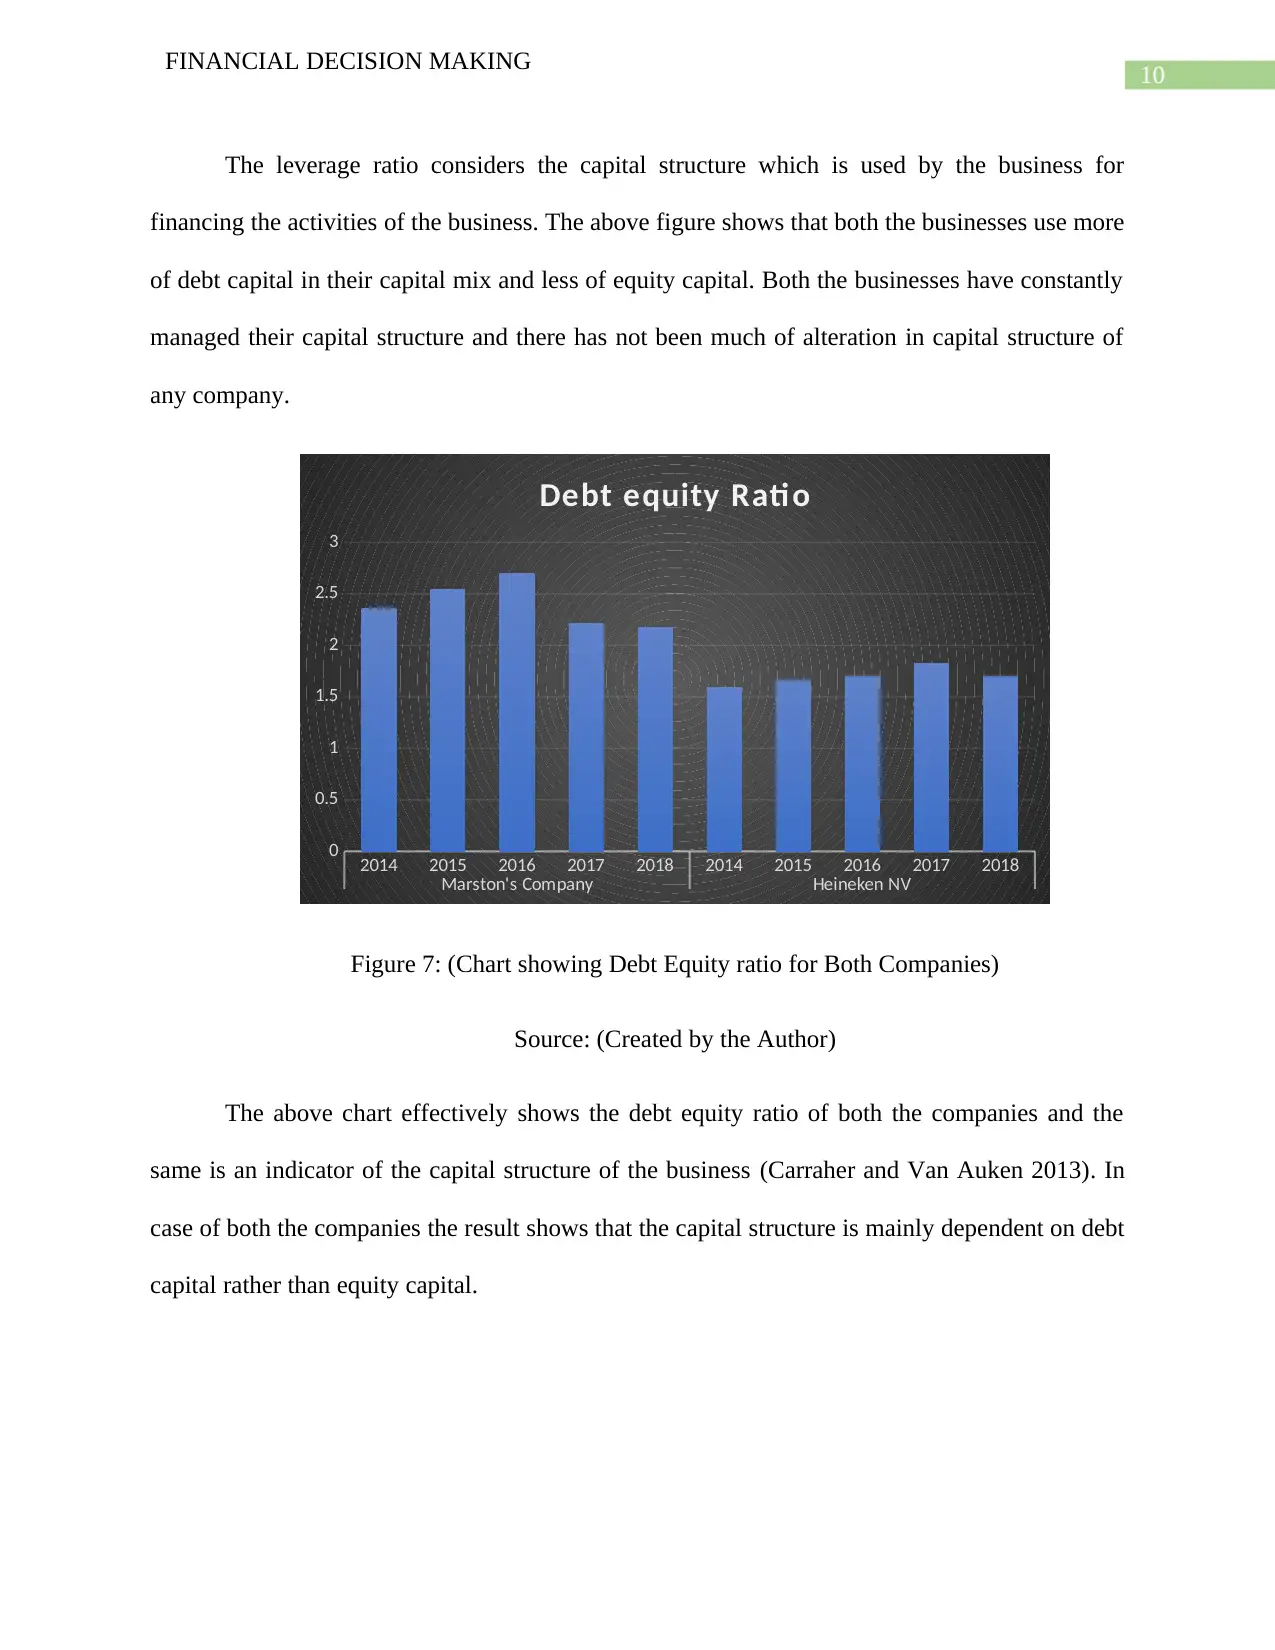
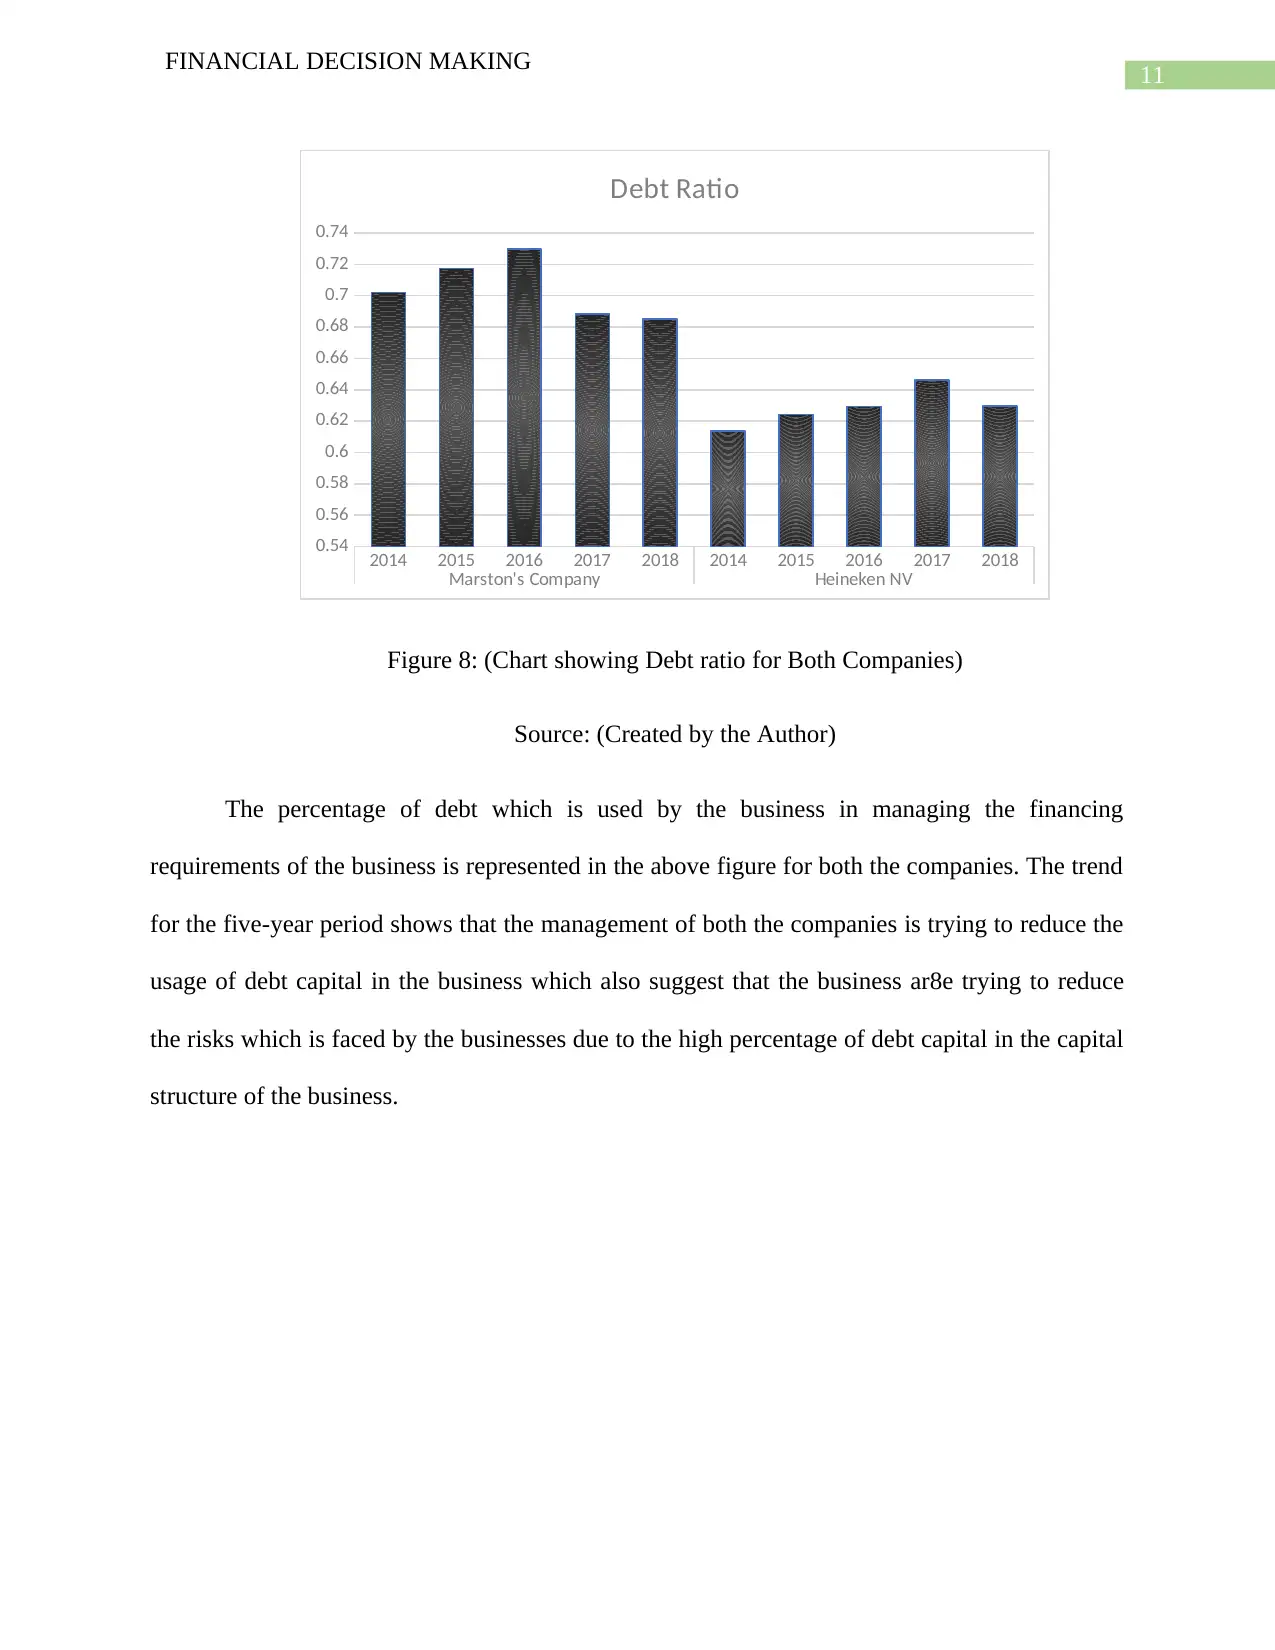
This report presents a comparative financial ratio analysis of Marston's and Heineken, two companies operating in the beverage industry. The analysis covers various financial ratios, including profitability ratios (gross profit margin, net profit margin, return on assets, and return on equity), liquidity ratios (current ratio, acid-test ratio, cash ratio, and working capital), market efficiency ratios (receivable turnover ratio, inventory turnover ratio, and total asset turnover ratio), leverage ratios (debt-equity ratio and debt ratio), and valuation and growth ratios (EPS). The report utilizes charts to visually represent and compare the financial performance of both companies. The analysis reveals that Heineken generally outperforms Marston's in terms of profitability and liquidity. Based on the findings, the report provides recommendations for Marston's management, including enhancing profitability, improving liquidity management, and establishing a robust internal control structure.
Document Page
Running head: FINANCIAL DECISION MAKING
Financial Decision Making
Name of the Student:
Name of the University:
Author’s Note
tabler-icon-diamond-filled.svg

Paraphrase This Document

Need a fresh take? Get an instant paraphrase of this document with our AI Paraphraser
Document Page
1
FINANCIAL DECISION MAKING
Table of Contents
Ratio Analysis..................................................................................................................................2
Profitability Ratios.......................................................................................................................2
Liquidity Ratios...........................................................................................................................4
Market Efficiency Ratio..............................................................................................................7
Leverage Ratios...........................................................................................................................9
Valuation and Growth Ratios....................................................................................................12
Reference.......................................................................................................................................14
Document Page
2
FINANCIAL DECISION MAKING
Ratio Analysis
Profitability Ratios
The profitability Ratios of the business shows estimates which makes comparison with
profitability much easier. The profitability ratios of the business include gross profit margin, net
profit margin, return on assets and return on equity of the business. In order to make effective
comparison the business of Marston’s Company and one of its main competitors Heineken NV
are taken into consideration showing key financial ratios of both the companies (Marstons.co.uk.
2019). The analysis shows that the gross profit margin for Marston company has declined in
2018 in comparison to previous year analysis which is mainly due to hike in the costs of the
business. Similarly, the profits of Heineken NV have also declined significantly over the years
but the same is still better than the business of Marston’s Company (Theheinekencompany.com.
2019). The net profit margin of both Marston and Heineken has also declined which is mainly
due to the increase in the operations of business. The net profit margin of both the companies
Document Page
3
FINANCIAL DECISION MAKING
show that the business of Heineken NV has better estimate in comparison to Marston Company.
This shows that in the aspect of profitability the competitor business is performing well.
2014 2015 2016 2017 2018 2014 2015 2016 2017 2018
Marston's Company Heineken NV
-6.22%
2.65%
7.79% 8.38%
3.94%
8.87%
10.44%
8.36% 8.33% 7.81%
Net Profit Margin
Figure 1: (Chart showing Net profit Margin for Both Companies)
Source: (Created by the Author)
The return on assets and return on equity is considered to be appropriate indicator for
measuring the success of the business in terms of profitability (Delen, Kuzey and Uyar 2013).
The return on assets and equity for Heineken is shown to be much better than the estimates
which is shown by Marston company. The management of Marston company needs to
appropriately manage the operations of the business so that the profitability aspect of the
business can be improved (Palepu and Healy 2013). A chart showing a comparison between
Marston and Heineken company in terms of return on equity is shown below:
tabler-icon-diamond-filled.svg

Paraphrase This Document

Need a fresh take? Get an instant paraphrase of this document with our AI Paraphraser
Document Page
4
FINANCIAL DECISION MAKING
2014 2015 2016 2017 2018 2014 2015 2016 2017 2018
Marston's Company Heineken NV
-0.1
-0.05
0
0.05
0.1
0.15
0.2
Return on Equity
Figure 2: (Chart showing Return on Equity for Both Companies)
Source: (Created by the Author)
The above chart effectively shows that the return on equity estimates for the business of
Heineken is much better which is not a good sign for the business of Marston as significant
improvement is required in this respect.
Liquidity Ratios
Document Page
5
FINANCIAL DECISION MAKING
The liquidity ratios reflect the ability of the business to meet its current obligations in an
effective manner. The liquidity ratio for both the companies shows current ratio, acid test ratio,
cash ratio and working capital. The current ratio of Marston shows significant decline in
comparison to the estimates of 2017 which suggest that the business is facing a liquidity situation
in the market and the management of the company needs to make improvements in the same. On
the other hand, the current ratio for Heineken NV shows improvement in 2018 and the same is
shown to be better than the estimates of Marston company. Similarly, the acid test ratio shows
that the liquidity situation in the business of Heineken NV is better than that of Marston
Company. This shows that the competitor company has a better liquidity status.
2 0 1 4 2 0 1 5 2 0 1 6 2 0 1 7 2 0 1 8 2 0 1 4 2 0 1 5 2 0 1 6 2 0 1 7 2 0 1 8
M a r s t o n ' s C o m p a n y H e i n e k e n N V
0
0.1
0.2
0.3
0.4
0.5
0.6
0.7
0.8
0.9
1
Current Rati o
Figure 3: (Chart showing Current Ratio for Both Companies)
Source: (Created by the Author)
The table above clearly shows that the current ratio for Heinekens NV is much better than
Marston Company for the years 2018. The management of the company needs to make
improvements in this respect so that the situation does not takes place and the business is able to
Document Page
6
FINANCIAL DECISION MAKING
meet its current obligations effectively. The cash ratio also shows appropriate results for
Heineken company in comparison with Marston Company.
2014 2015 2016 2017 2018 2014 2015 2016 2017 2018
Marston's Company Heineken NV
0
0.1
0.2
0.3
0.4
0.5
0.6
Cash Ratio
Figure 4: (Chart showing Cash Ratio for Both Companies)
Source: (Created by the Author)
The above figure effectively shows that cash ratio of Marston company has declined over
the years which shows that liquidity position of the business has declined. The working capital of
Heineken on the other hand is shown in negative which is a matter of concern for the business.
The working capital of Marston company has declined as well but the same is still better than
Heineken NV.
tabler-icon-diamond-filled.svg

Paraphrase This Document

Need a fresh take? Get an instant paraphrase of this document with our AI Paraphraser
Document Page
7
FINANCIAL DECISION MAKING
Market Efficiency Ratio
The market efficiency ratio reflects the overall efficiency which the business and how
well the business operates in the market. The receivable turnover ratio shows that the
management of Marston company has made significant changes in the operational process and
also in managing the credit sales of the business. In 2018, the business of Marston has made
improvements from previous years which is appositive sign for the business (Weil, Schipper and
Francis 2013). The estimates of Heinekens company show that the management has also made
improvements in the estimates.
Document Page
8
FINANCIAL DECISION MAKING
2014 2015 2016 2017 2018 2014 2015 2016 2017 2018
Marston's Company Heineken NV
0
2
4
6
8
10
12
Receivable Turnover
Figure 5: (Chart showing Receivable Turnover ratio for Both Companies)
Source: (Created by the Author)
The above chart shows the receivable turnover ratio for both the company and the same is
appropriately represented in the graph. The inventory turnover ratio of the business also shows
significant improvements which is appropriately reflected and the same has improved in 2018. In
the same case, the inventory turnover ratio for Heineken company also shows improvements
which is an improvement in the business.
Document Page
9
FINANCIAL DECISION MAKING
2014 2015 2016 2017 2018 2014 2015 2016 2017 2018
Marston's Company Heineken NV
0
0.1
0.2
0.3
0.4
0.5
0.6
0.7
Total Asset Turnover
Figure 6: (Chart showing Total Asset Turnover ratio for Both Companies)
Source: (Created by the Author)
The total asset turnover ratio shows significant improvements in the estimates in business
of Marston as well as in the business of Heineken which is a positive factor and this also
indicates that the business is effectively utilizing the assets of the business for the purpose of
generating profits for the business (Chandra 2017). This also indicates that the business would be
able to make more profits in the long run if assets of the business are used more efficiently.
Leverage Ratios
tabler-icon-diamond-filled.svg

Paraphrase This Document

Need a fresh take? Get an instant paraphrase of this document with our AI Paraphraser
Document Page
10
FINANCIAL DECISION MAKING
The leverage ratio considers the capital structure which is used by the business for
financing the activities of the business. The above figure shows that both the businesses use more
of debt capital in their capital mix and less of equity capital. Both the businesses have constantly
managed their capital structure and there has not been much of alteration in capital structure of
any company.
2014 2015 2016 2017 2018 2014 2015 2016 2017 2018
Marston's Company Heineken NV
0
0.5
1
1.5
2
2.5
3
Debt equity Rati o
Figure 7: (Chart showing Debt Equity ratio for Both Companies)
Source: (Created by the Author)
The above chart effectively shows the debt equity ratio of both the companies and the
same is an indicator of the capital structure of the business (Carraher and Van Auken 2013). In
case of both the companies the result shows that the capital structure is mainly dependent on debt
capital rather than equity capital.
Document Page
11
FINANCIAL DECISION MAKING
2014 2015 2016 2017 2018 2014 2015 2016 2017 2018
Marston's Company Heineken NV
0.54
0.56
0.58
0.6
0.62
0.64
0.66
0.68
0.7
0.72
0.74
Debt Ratio
Figure 8: (Chart showing Debt ratio for Both Companies)
Source: (Created by the Author)
The percentage of debt which is used by the business in managing the financing
requirements of the business is represented in the above figure for both the companies. The trend
for the five-year period shows that the management of both the companies is trying to reduce the
usage of debt capital in the business which also suggest that the business ar8e trying to reduce
the risks which is faced by the businesses due to the high percentage of debt capital in the capital
structure of the business.
chevron_up_icon
1 out of 16
circle_padding
hide_on_mobile
zoom_out_icon
[object Object]