Financial Decision Making: Investment Appraisal and Analysis Report
VerifiedAdded on 2020/07/23
|18
|4386
|39
Report
AI Summary
This report provides a comprehensive analysis of financial decision-making within the context of Hi-Tech Plc, a computer hardware and accessories manufacturer. It begins with an executive summary and then delves into business performance analysis, utilizing ratio analysis to evaluate profitability, liquidity, solvency, and efficiency over the years 2016 and 2017. The report highlights trends in key financial metrics, such as gross profit margin, operating profit margin, and return on assets, and assesses the company's ability to meet its obligations. The second part of the report focuses on investment appraisal, including a discussion of capital budgeting techniques and their advantages and disadvantages. The report also considers non-financial factors relevant to Hi-Tech Plc's decision-making processes and explores potential funding sources. Finally, the report concludes with an evaluation of Hi-Tech Plc's cash flow, operating cycle, and product line performance.

Financial Decision Making
Paraphrase This Document
Need a fresh take? Get an instant paraphrase of this document with our AI Paraphraser

Executive Summary
Financial decision making is the essence for business so that it may flourish in the
market.In the context of business unit, the main motive of manager is to attain goals and
objective by making optimal use of financial resources. For the purpose of appropriate
decision making manager is required to make evaluation of all the alternative options
available by taking into account financial tools and techniques.
Table of Contents
INTRODUCTION......................................................................................................................3
Part 1: Business Performance Analysis......................................................................................3
Calculating and using ratios for the purpose of decision making in the context of Hi-Tech
plc...........................................................................................................................................3
PART 2: Investment appraisal.................................................................................................10
2.1 Challenging management forecast and listing advantages and disadvantages of
investment appraisal techniques...........................................................................................10
CONCLUSION........................................................................................................................15
REFERENCES.........................................................................................................................15
⊘ This is a preview!⊘
Do you want full access?
Subscribe today to unlock all pages.
Trusted by 1+ million students worldwide
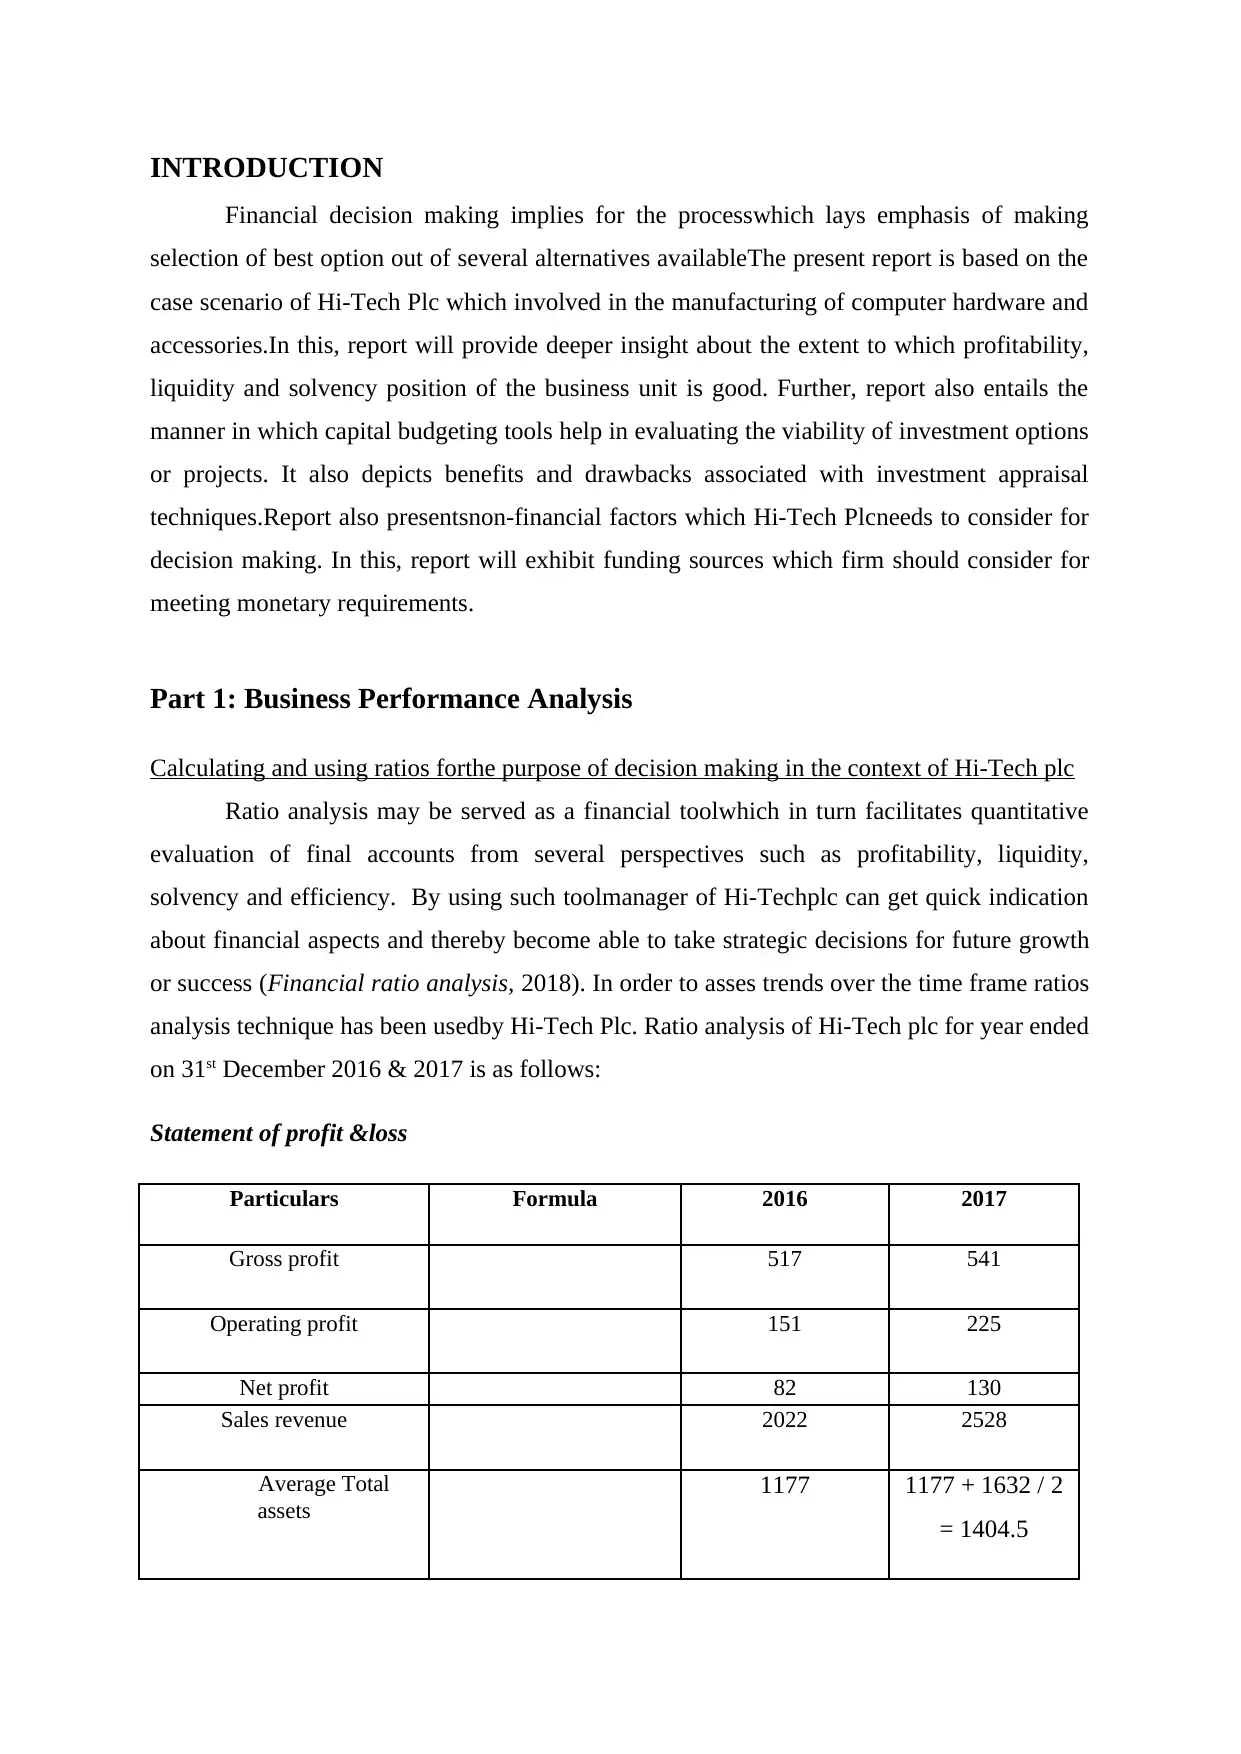
INTRODUCTION
Financial decision making implies for the processwhich lays emphasis of making
selection of best option out of several alternatives availableThe present report is based on the
case scenario of Hi-Tech Plc which involved in the manufacturing of computer hardware and
accessories.In this, report will provide deeper insight about the extent to which profitability,
liquidity and solvency position of the business unit is good. Further, report also entails the
manner in which capital budgeting tools help in evaluating the viability of investment options
or projects. It also depicts benefits and drawbacks associated with investment appraisal
techniques.Report also presentsnon-financial factors which Hi-Tech Plcneeds to consider for
decision making. In this, report will exhibit funding sources which firm should consider for
meeting monetary requirements.
Part 1: Business Performance Analysis
Calculating and using ratios forthe purpose of decision making in the context of Hi-Tech plc
Ratio analysis may be served as a financial toolwhich in turn facilitates quantitative
evaluation of final accounts from several perspectives such as profitability, liquidity,
solvency and efficiency. By using such toolmanager of Hi-Techplc can get quick indication
about financial aspects and thereby become able to take strategic decisions for future growth
or success (Financial ratio analysis, 2018). In order to asses trends over the time frame ratios
analysis technique has been usedby Hi-Tech Plc. Ratio analysis of Hi-Tech plc for year ended
on 31st December 2016 & 2017 is as follows:
Statement of profit &loss
Particulars Formula 2016 2017
Gross profit 517 541
Operating profit 151 225
Net profit 82 130
Sales revenue 2022 2528
Average Total
assets
1177 1177 + 1632 / 2
= 1404.5
Paraphrase This Document
Need a fresh take? Get an instant paraphrase of this document with our AI Paraphraser
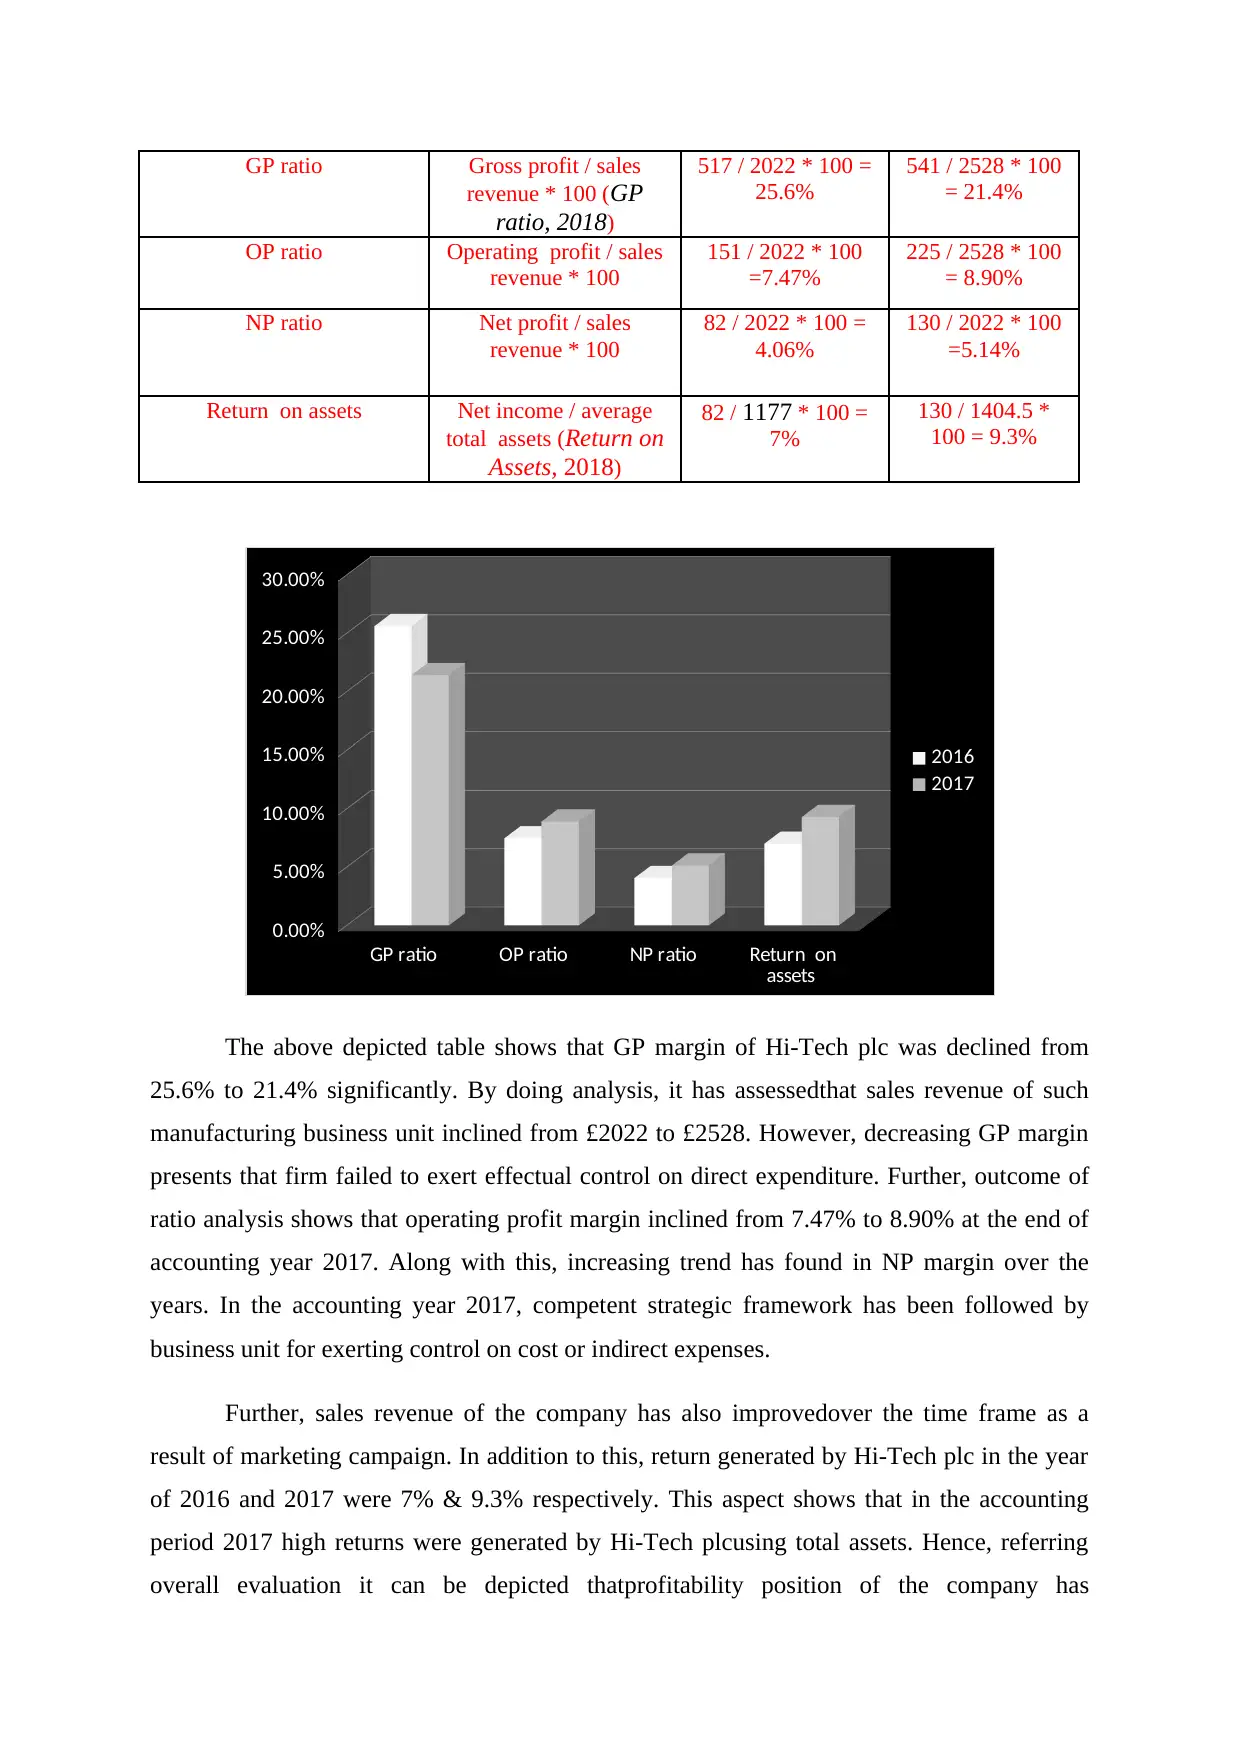
GP ratio Gross profit / sales
revenue * 100 (GP
ratio, 2018)
517 / 2022 * 100 =
25.6%
541 / 2528 * 100
= 21.4%
OP ratio Operating profit / sales
revenue * 100
151 / 2022 * 100
=7.47%
225 / 2528 * 100
= 8.90%
NP ratio Net profit / sales
revenue * 100
82 / 2022 * 100 =
4.06%
130 / 2022 * 100
=5.14%
Return on assets Net income / average
total assets (Return on
Assets, 2018)
82 / 1177 * 100 =
7%
130 / 1404.5 *
100 = 9.3%
GP ratio OP ratio NP ratio Return on
assets
0.00%
5.00%
10.00%
15.00%
20.00%
25.00%
30.00%
2016
2017
The above depicted table shows that GP margin of Hi-Tech plc was declined from
25.6% to 21.4% significantly. By doing analysis, it has assessedthat sales revenue of such
manufacturing business unit inclined from £2022 to £2528. However, decreasing GP margin
presents that firm failed to exert effectual control on direct expenditure. Further, outcome of
ratio analysis shows that operating profit margin inclined from 7.47% to 8.90% at the end of
accounting year 2017. Along with this, increasing trend has found in NP margin over the
years. In the accounting year 2017, competent strategic framework has been followed by
business unit for exerting control on cost or indirect expenses.
Further, sales revenue of the company has also improvedover the time frame as a
result of marketing campaign. In addition to this, return generated by Hi-Tech plc in the year
of 2016 and 2017 were 7% & 9.3% respectively. This aspect shows that in the accounting
period 2017 high returns were generated by Hi-Tech plcusing total assets. Hence, referring
overall evaluation it can be depicted thatprofitability position of the company has
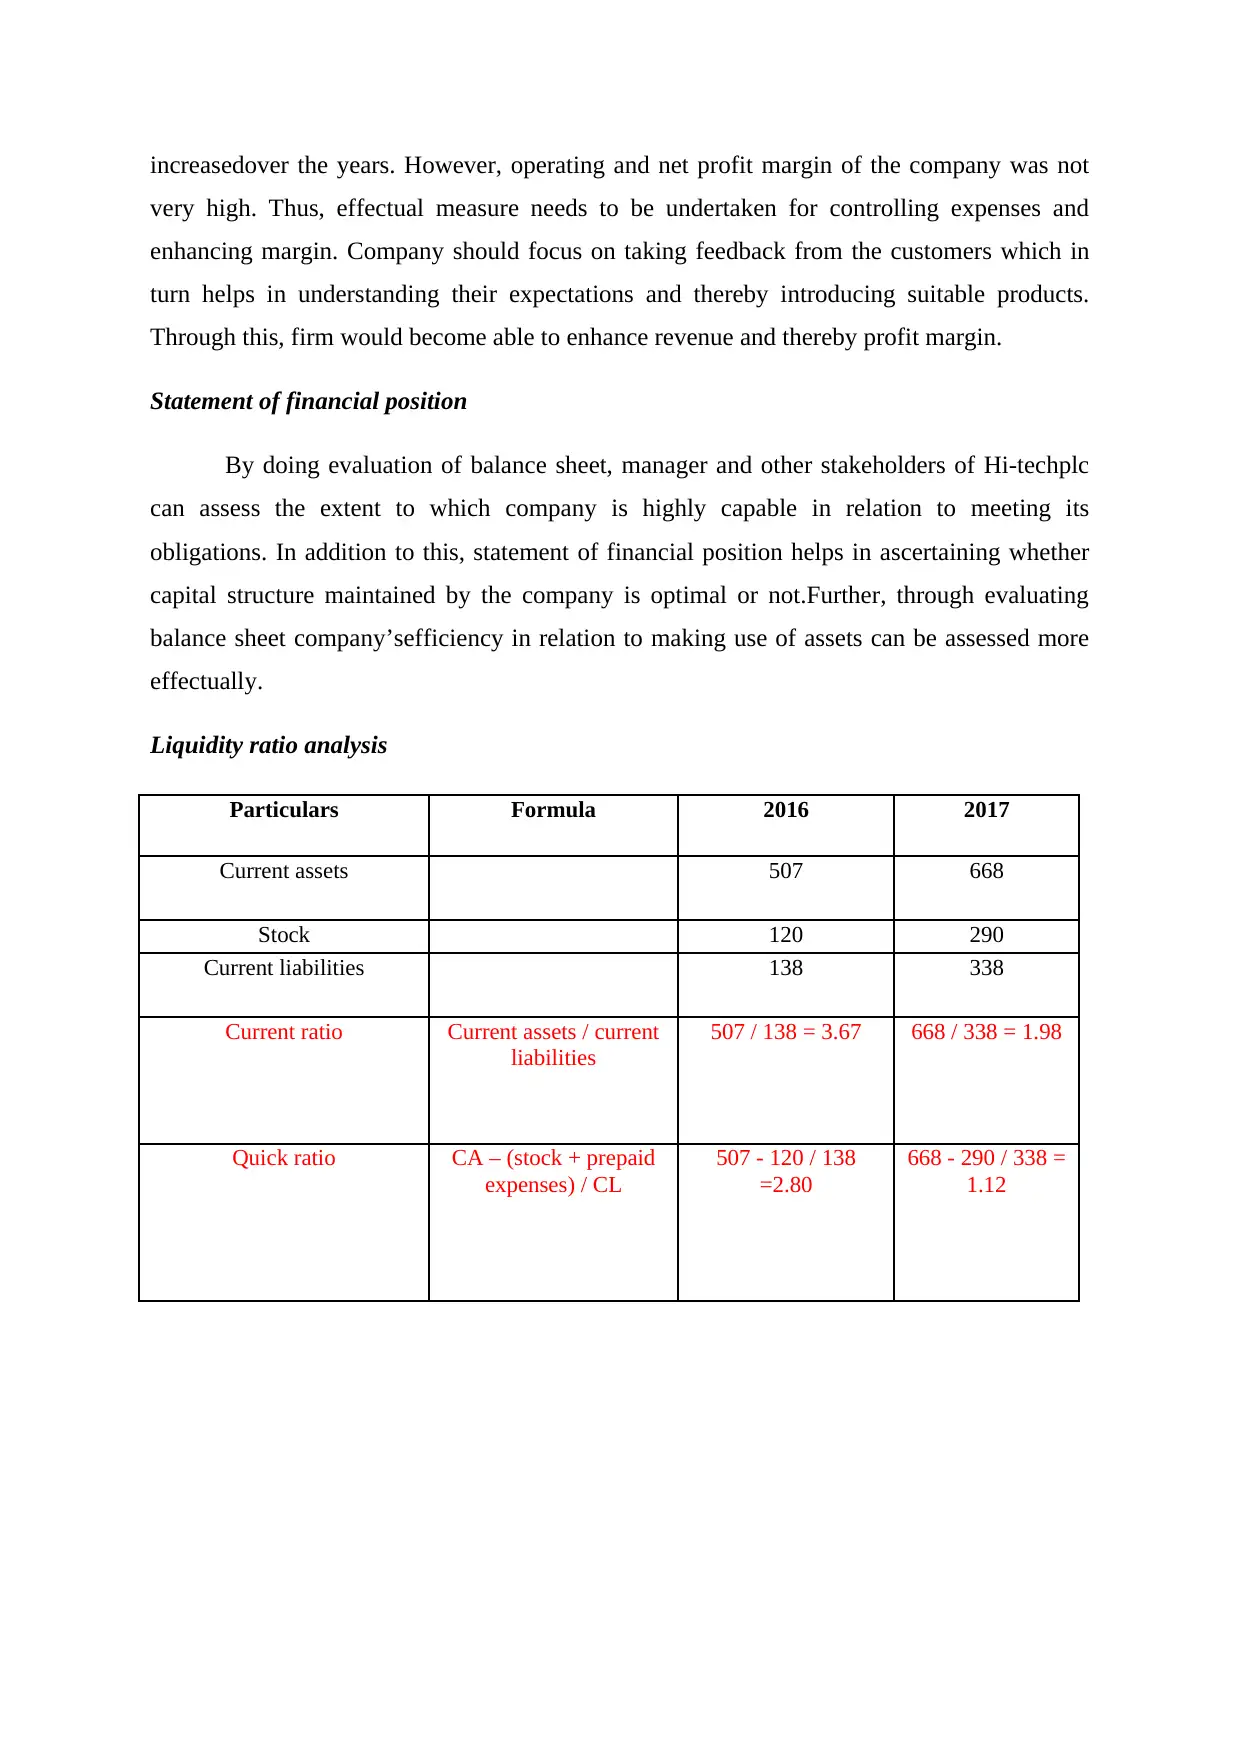
increasedover the years. However, operating and net profit margin of the company was not
very high. Thus, effectual measure needs to be undertaken for controlling expenses and
enhancing margin. Company should focus on taking feedback from the customers which in
turn helps in understanding their expectations and thereby introducing suitable products.
Through this, firm would become able to enhance revenue and thereby profit margin.
Statement of financial position
By doing evaluation of balance sheet, manager and other stakeholders of Hi-techplc
can assess the extent to which company is highly capable in relation to meeting its
obligations. In addition to this, statement of financial position helps in ascertaining whether
capital structure maintained by the company is optimal or not.Further, through evaluating
balance sheet company’sefficiency in relation to making use of assets can be assessed more
effectually.
Liquidity ratio analysis
Particulars Formula 2016 2017
Current assets 507 668
Stock 120 290
Current liabilities 138 338
Current ratio Current assets / current
liabilities
507 / 138 = 3.67 668 / 338 = 1.98
Quick ratio CA – (stock + prepaid
expenses) / CL
507 - 120 / 138
=2.80
668 - 290 / 338 =
1.12
⊘ This is a preview!⊘
Do you want full access?
Subscribe today to unlock all pages.
Trusted by 1+ million students worldwide
2016 2017
3.67
1.98
2.8
1.12
Liquidity Ratios
Current ratio Quick ratio
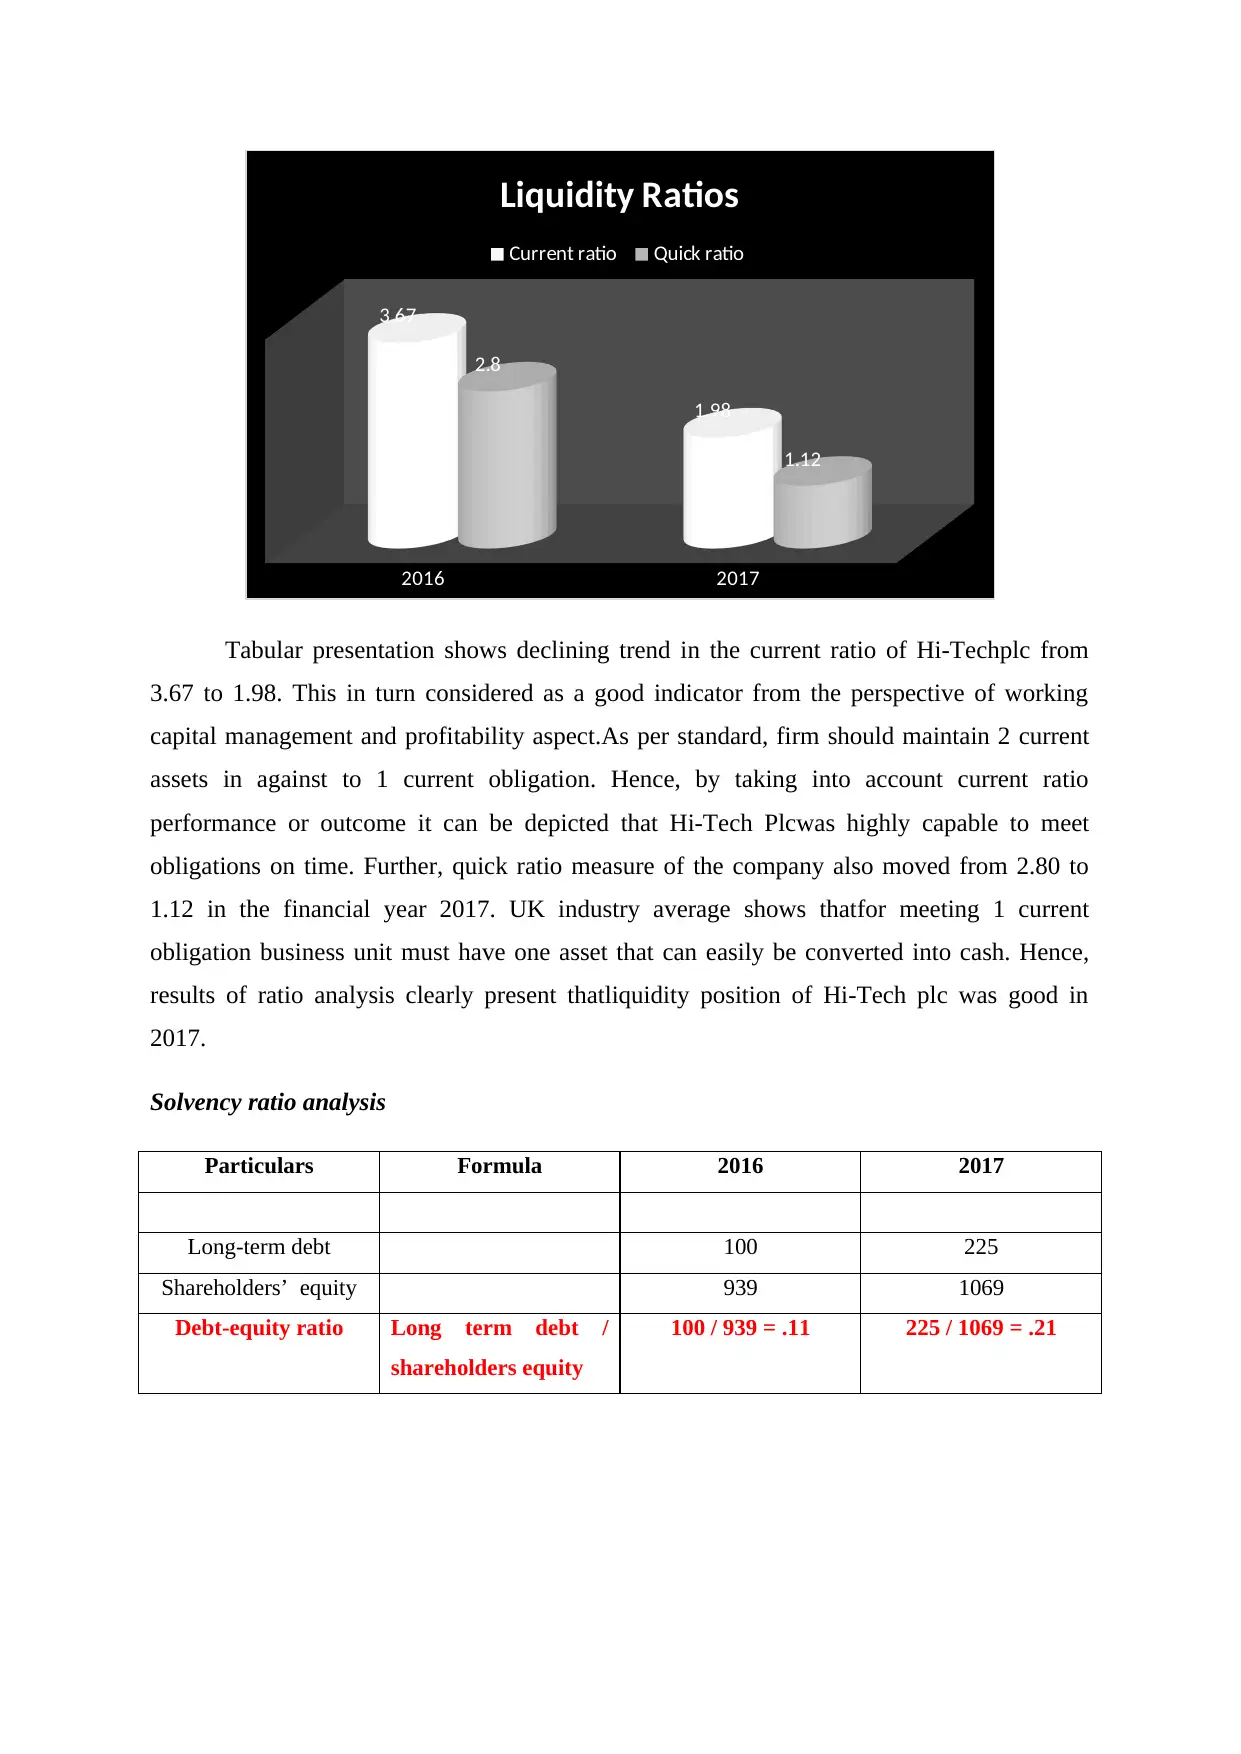
Tabular presentation shows declining trend in the current ratio of Hi-Techplc from
3.67 to 1.98. This in turn considered as a good indicator from the perspective of working
capital management and profitability aspect.As per standard, firm should maintain 2 current
assets in against to 1 current obligation. Hence, by taking into account current ratio
performance or outcome it can be depicted that Hi-Tech Plcwas highly capable to meet
obligations on time. Further, quick ratio measure of the company also moved from 2.80 to
1.12 in the financial year 2017. UK industry average shows thatfor meeting 1 current
obligation business unit must have one asset that can easily be converted into cash. Hence,
results of ratio analysis clearly present thatliquidity position of Hi-Tech plc was good in
2017.
Solvency ratio analysis
Particulars Formula 2016 2017
Long-term debt 100 225
Shareholders’ equity 939 1069
Debt-equity ratio Long term debt /
shareholders equity
100 / 939 = .11 225 / 1069 = .21
3.67
1.98
2.8
1.12
Liquidity Ratios
Current ratio Quick ratio
Tabular presentation shows declining trend in the current ratio of Hi-Techplc from
3.67 to 1.98. This in turn considered as a good indicator from the perspective of working
capital management and profitability aspect.As per standard, firm should maintain 2 current
assets in against to 1 current obligation. Hence, by taking into account current ratio
performance or outcome it can be depicted that Hi-Tech Plcwas highly capable to meet
obligations on time. Further, quick ratio measure of the company also moved from 2.80 to
1.12 in the financial year 2017. UK industry average shows thatfor meeting 1 current
obligation business unit must have one asset that can easily be converted into cash. Hence,
results of ratio analysis clearly present thatliquidity position of Hi-Tech plc was good in
2017.
Solvency ratio analysis
Particulars Formula 2016 2017
Long-term debt 100 225
Shareholders’ equity 939 1069
Debt-equity ratio Long term debt /
shareholders equity
100 / 939 = .11 225 / 1069 = .21
Paraphrase This Document
Need a fresh take? Get an instant paraphrase of this document with our AI Paraphraser
2016 2017
0
0.05
0.1
0.15
0.2
0.25
Debt-equity ratio
Debt-equity ratio
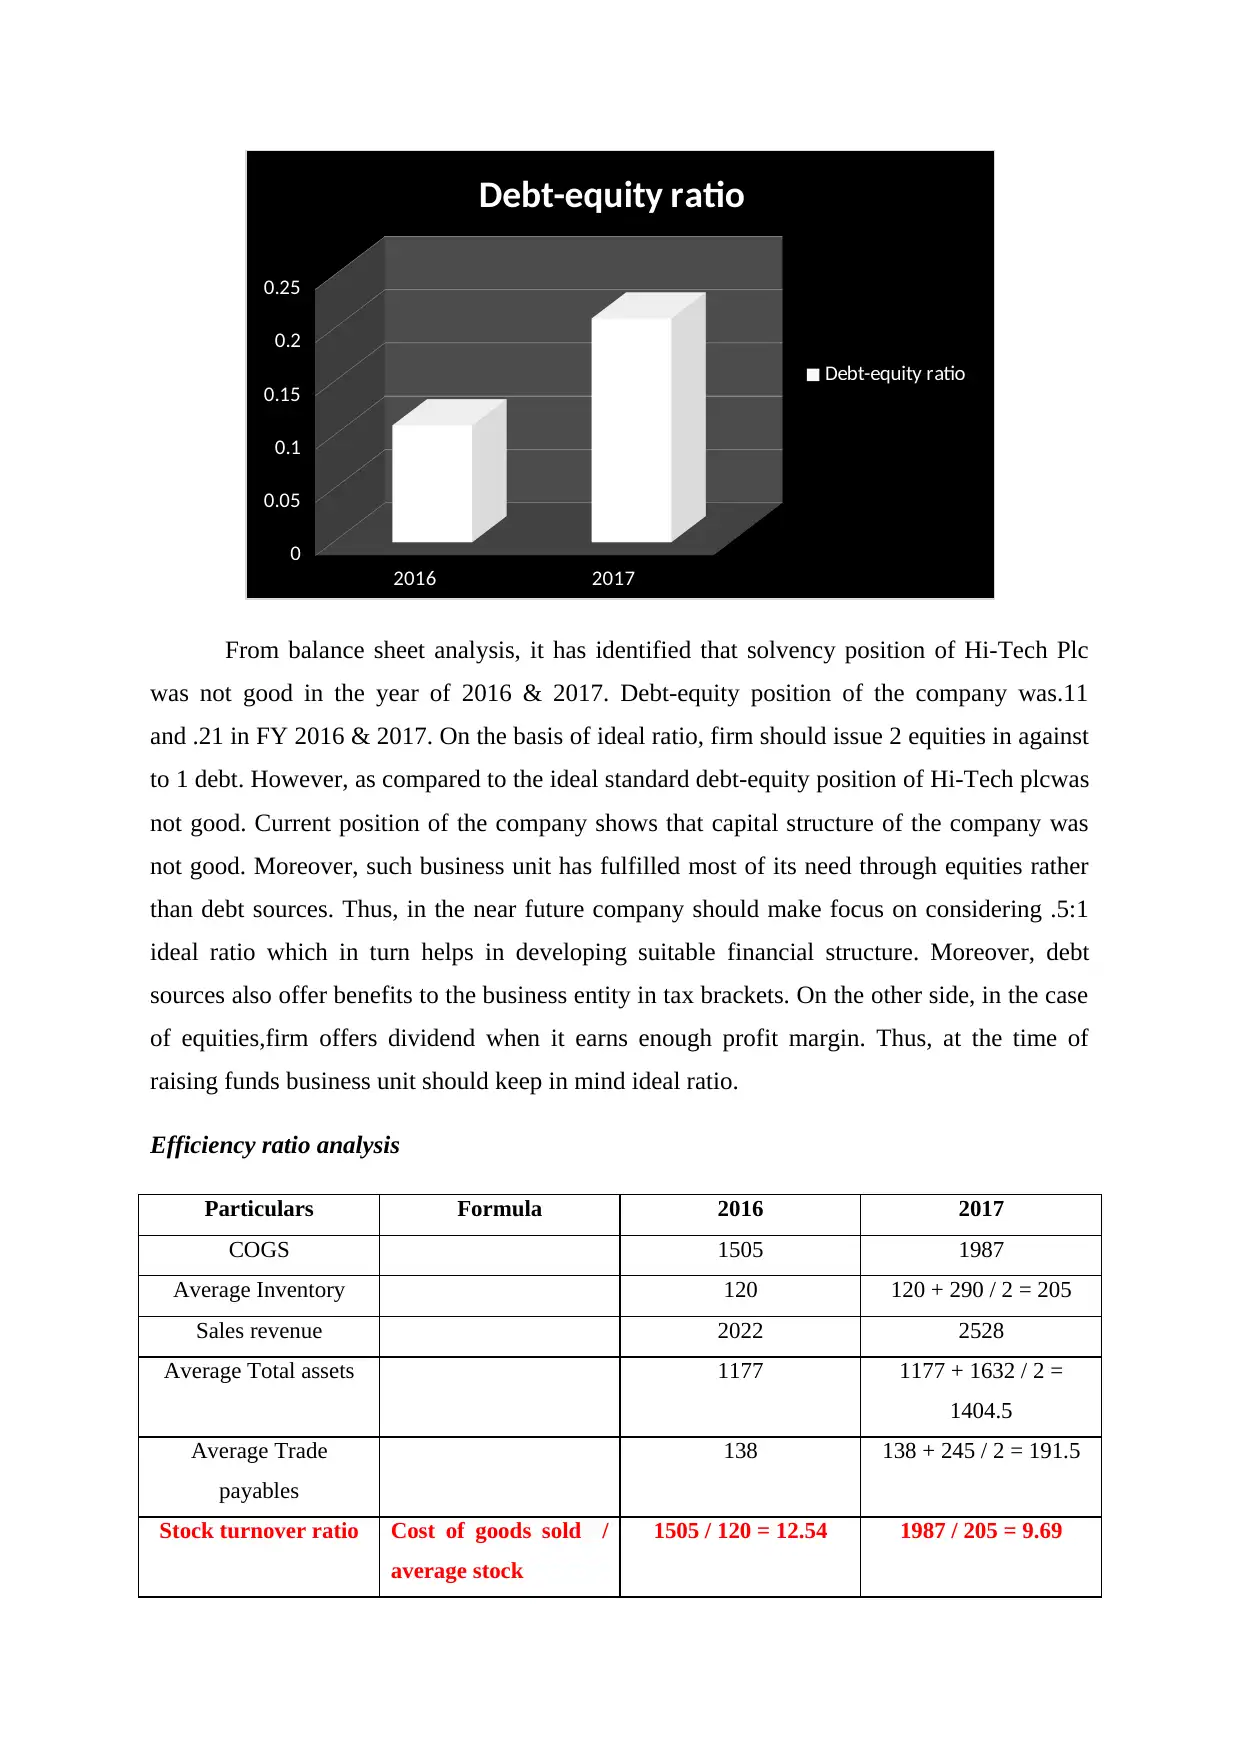
From balance sheet analysis, it has identified that solvency position of Hi-Tech Plc
was not good in the year of 2016 & 2017. Debt-equity position of the company was.11
and .21 in FY 2016 & 2017. On the basis of ideal ratio, firm should issue 2 equities in against
to 1 debt. However, as compared to the ideal standard debt-equity position of Hi-Tech plcwas
not good. Current position of the company shows that capital structure of the company was
not good. Moreover, such business unit has fulfilled most of its need through equities rather
than debt sources. Thus, in the near future company should make focus on considering .5:1
ideal ratio which in turn helps in developing suitable financial structure. Moreover, debt
sources also offer benefits to the business entity in tax brackets. On the other side, in the case
of equities,firm offers dividend when it earns enough profit margin. Thus, at the time of
raising funds business unit should keep in mind ideal ratio.
Efficiency ratio analysis
Particulars Formula 2016 2017
COGS 1505 1987
Average Inventory 120 120 + 290 / 2 = 205
Sales revenue 2022 2528
Average Total assets 1177 1177 + 1632 / 2 =
1404.5
Average Trade
payables
138 138 + 245 / 2 = 191.5
Stock turnover ratio Cost of goods sold /
average stock
1505 / 120 = 12.54 1987 / 205 = 9.69
0
0.05
0.1
0.15
0.2
0.25
Debt-equity ratio
Debt-equity ratio
From balance sheet analysis, it has identified that solvency position of Hi-Tech Plc
was not good in the year of 2016 & 2017. Debt-equity position of the company was.11
and .21 in FY 2016 & 2017. On the basis of ideal ratio, firm should issue 2 equities in against
to 1 debt. However, as compared to the ideal standard debt-equity position of Hi-Tech plcwas
not good. Current position of the company shows that capital structure of the company was
not good. Moreover, such business unit has fulfilled most of its need through equities rather
than debt sources. Thus, in the near future company should make focus on considering .5:1
ideal ratio which in turn helps in developing suitable financial structure. Moreover, debt
sources also offer benefits to the business entity in tax brackets. On the other side, in the case
of equities,firm offers dividend when it earns enough profit margin. Thus, at the time of
raising funds business unit should keep in mind ideal ratio.
Efficiency ratio analysis
Particulars Formula 2016 2017
COGS 1505 1987
Average Inventory 120 120 + 290 / 2 = 205
Sales revenue 2022 2528
Average Total assets 1177 1177 + 1632 / 2 =
1404.5
Average Trade
payables
138 138 + 245 / 2 = 191.5
Stock turnover ratio Cost of goods sold /
average stock
1505 / 120 = 12.54 1987 / 205 = 9.69
Total assets turnover
ratio
Sales revenue /
average total assets
2022 / 1177 = 1.72 2528 / 1404.5 = 1.80
Payable period Creditors * 365 / net
credit purchase
138 * 365 / 1505 =
33.47
245 * 365 / 191.5 =
35.18
Stock turnover ratio Total assets turnover
ratio Payable period
12.54
1.72
33.47
9.69
1.8
35.18
Efficiency ratio analysis
2016 2017
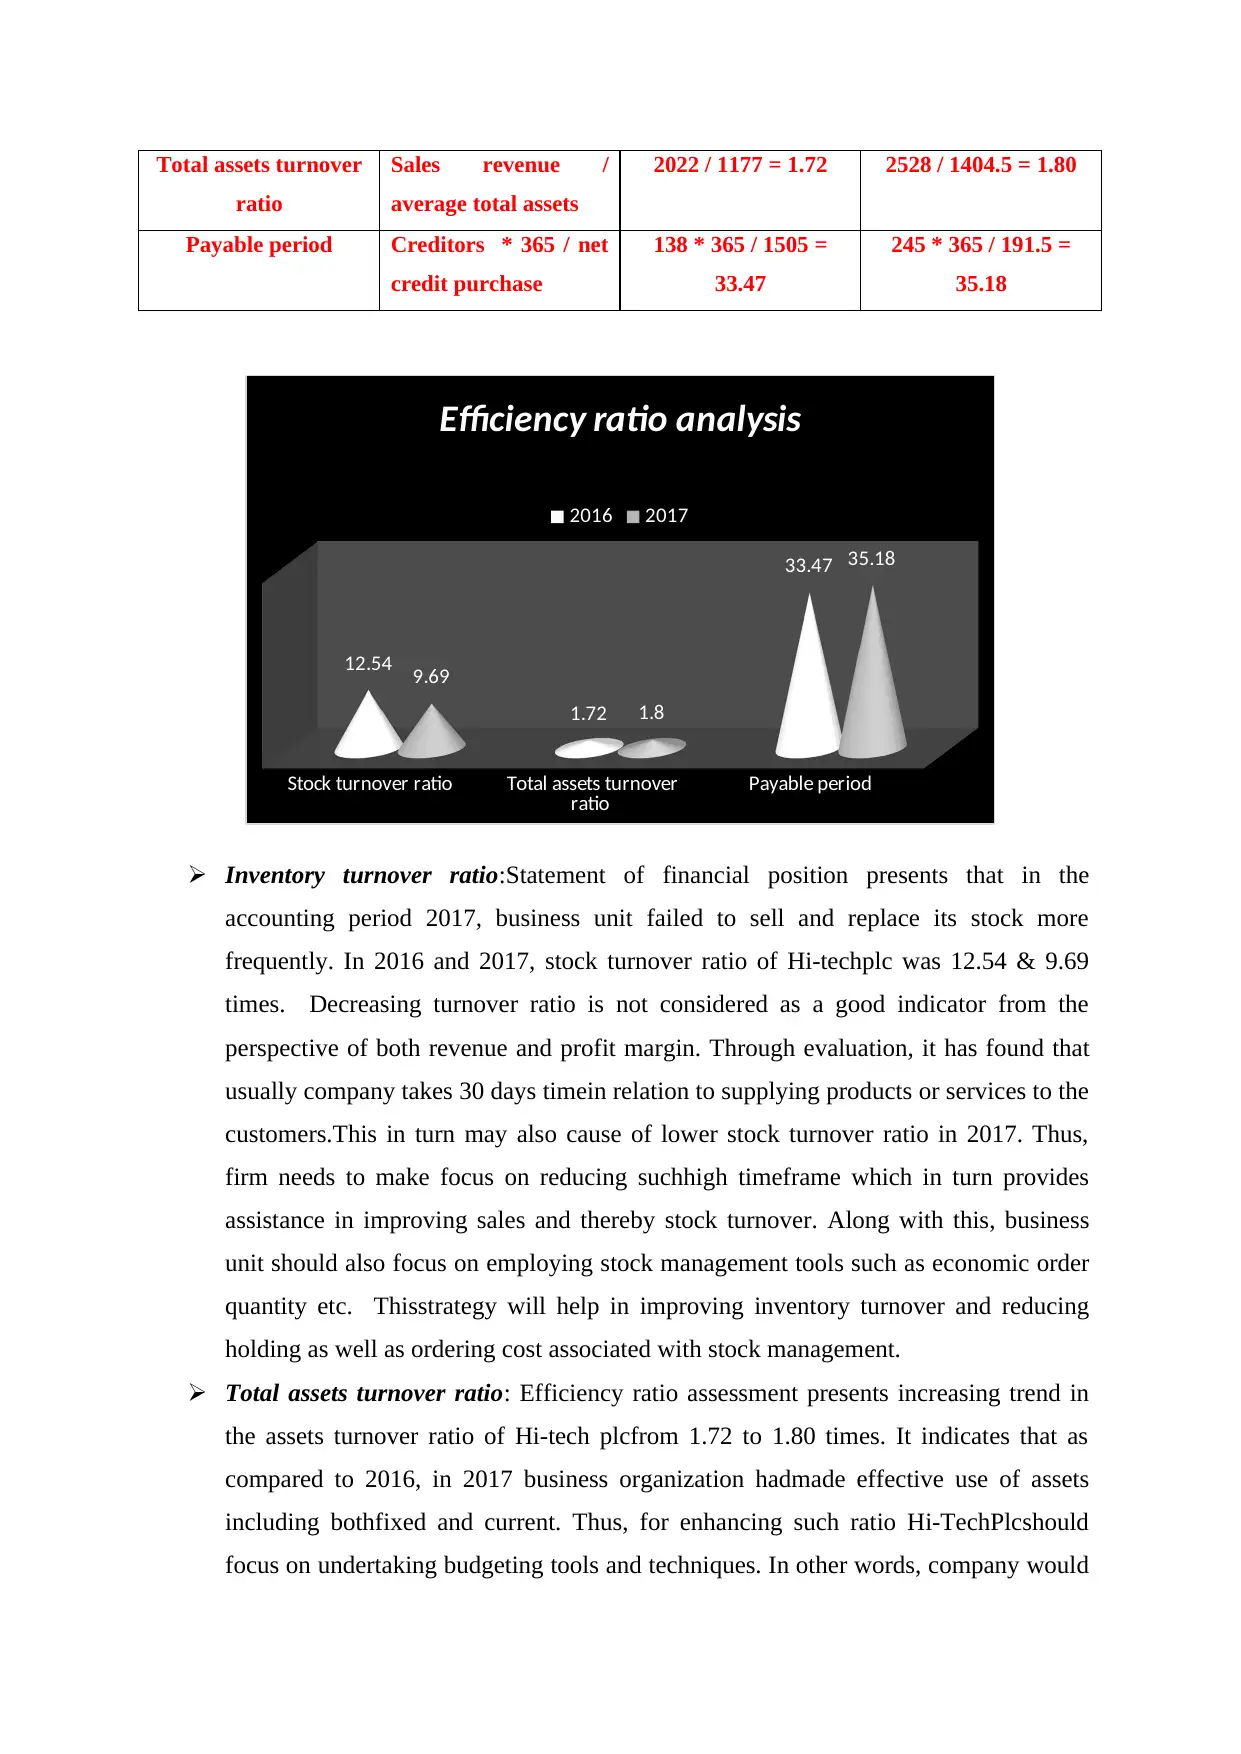
Inventory turnover ratio:Statement of financial position presents that in the
accounting period 2017, business unit failed to sell and replace its stock more
frequently. In 2016 and 2017, stock turnover ratio of Hi-techplc was 12.54 & 9.69
times. Decreasing turnover ratio is not considered as a good indicator from the
perspective of both revenue and profit margin. Through evaluation, it has found that
usually company takes 30 days timein relation to supplying products or services to the
customers.This in turn may also cause of lower stock turnover ratio in 2017. Thus,
firm needs to make focus on reducing suchhigh timeframe which in turn provides
assistance in improving sales and thereby stock turnover. Along with this, business
unit should also focus on employing stock management tools such as economic order
quantity etc. Thisstrategy will help in improving inventory turnover and reducing
holding as well as ordering cost associated with stock management.
Total assets turnover ratio: Efficiency ratio assessment presents increasing trend in
the assets turnover ratio of Hi-tech plcfrom 1.72 to 1.80 times. It indicates that as
compared to 2016, in 2017 business organization hadmade effective use of assets
including bothfixed and current. Thus, for enhancing such ratio Hi-TechPlcshould
focus on undertaking budgeting tools and techniques. In other words, company would
ratio
Sales revenue /
average total assets
2022 / 1177 = 1.72 2528 / 1404.5 = 1.80
Payable period Creditors * 365 / net
credit purchase
138 * 365 / 1505 =
33.47
245 * 365 / 191.5 =
35.18
Stock turnover ratio Total assets turnover
ratio Payable period
12.54
1.72
33.47
9.69
1.8
35.18
Efficiency ratio analysis
2016 2017
Inventory turnover ratio:Statement of financial position presents that in the
accounting period 2017, business unit failed to sell and replace its stock more
frequently. In 2016 and 2017, stock turnover ratio of Hi-techplc was 12.54 & 9.69
times. Decreasing turnover ratio is not considered as a good indicator from the
perspective of both revenue and profit margin. Through evaluation, it has found that
usually company takes 30 days timein relation to supplying products or services to the
customers.This in turn may also cause of lower stock turnover ratio in 2017. Thus,
firm needs to make focus on reducing suchhigh timeframe which in turn provides
assistance in improving sales and thereby stock turnover. Along with this, business
unit should also focus on employing stock management tools such as economic order
quantity etc. Thisstrategy will help in improving inventory turnover and reducing
holding as well as ordering cost associated with stock management.
Total assets turnover ratio: Efficiency ratio assessment presents increasing trend in
the assets turnover ratio of Hi-tech plcfrom 1.72 to 1.80 times. It indicates that as
compared to 2016, in 2017 business organization hadmade effective use of assets
including bothfixed and current. Thus, for enhancing such ratio Hi-TechPlcshould
focus on undertaking budgeting tools and techniques. In other words, company would
⊘ This is a preview!⊘
Do you want full access?
Subscribe today to unlock all pages.
Trusted by 1+ million students worldwide
becomeable to make effectual use offinancial resources through undertaking modern
budgeting tools such as activity basedbudgeting which in turn highly suits to the
modern era. Further, emphasis needs to be placed on the maintenance of fixed assets
and training of personnel. Hence, by undertaking all the above depicted measures Hi-
Techplc would become able toimprove efficiency aspects.
Payables period:Through analysis, it has identified that payable period of Hi-Tech plc
was increased from 33.47 to 35 days in 2017. It has identified from the evaluation that
usually company grants credit to its customers for the period of 30 day. However,
some of its customers are making payment within 30 to 90 days due to cash related
issues. Considering thepresent situation it can be saidthat payable period of the
company is good which in turn paces positive impact on working capital
management.
Statement of cash flows
On the basis of cited case situation, in 2017, cash related issues or problems were
experienced by Hi-Tech plc. Hence, due to cash shortage firm was unable to offer dividend to
the shareholders in 2017. Cash flow statement of the firm present that due to high inventory,
trade receivable, interest and income tax expenses it failed to generate positive inflow from
operating activities. In addition to this, in 2017, significant investment was made by the
company in intangible assets as well as property, plant & equipment. Further, in 2017,
decreasing trend has assessed in the cash and its equivalents. Hence, all such aspects
collectively caused of negative results. Thus, firm needs to frame and undertake cash control
as well as monitoring strategies for making improvement in the current position.
Operating cash cycle
Particulars Formula 2016 2017
Days sales of inventory 365 / purchase * average
inventories
365 / 1505 * 120 =
29.1
365 / 1987 * 205 =
37.66
Days sales outstanding 365 / credit sales *
average accounts
receivable (Receivable
turnover ratio, 2018)
365 / 2022 * 138 =
24.91
365 / 2528 * 191.5 =
27.65
Payable period Creditors * 365 / net
credit purchase
33.47 35.18
Paraphrase This Document
Need a fresh take? Get an instant paraphrase of this document with our AI Paraphraser
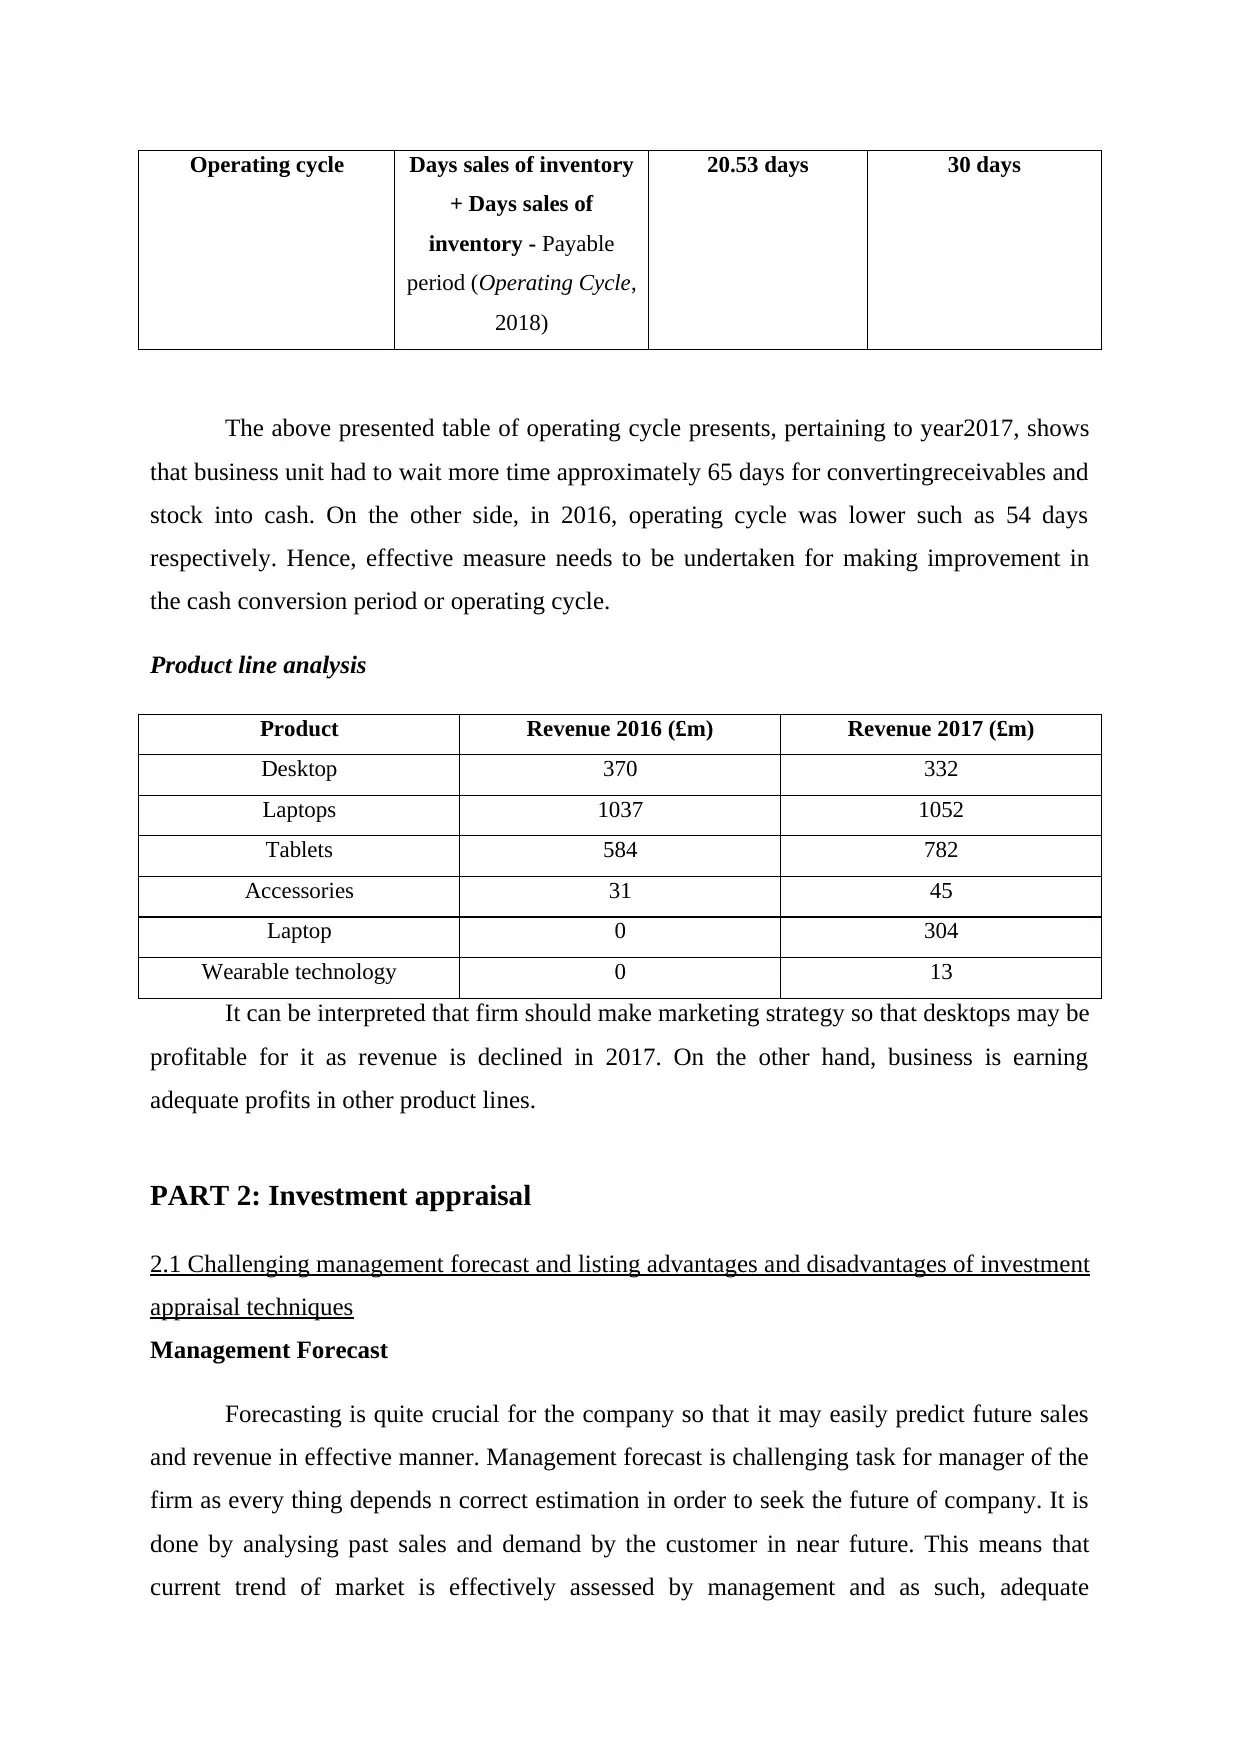
Operating cycle Days sales of inventory
+ Days sales of
inventory - Payable
period (Operating Cycle,
2018)
20.53 days 30 days
The above presented table of operating cycle presents, pertaining to year2017, shows
that business unit had to wait more time approximately 65 days for convertingreceivables and
stock into cash. On the other side, in 2016, operating cycle was lower such as 54 days
respectively. Hence, effective measure needs to be undertaken for making improvement in
the cash conversion period or operating cycle.
Product line analysis
Product Revenue 2016 (£m) Revenue 2017 (£m)
Desktop 370 332
Laptops 1037 1052
Tablets 584 782
Accessories 31 45
Laptop 0 304
Wearable technology 0 13
It can be interpreted that firm should make marketing strategy so that desktops may be
profitable for it as revenue is declined in 2017. On the other hand, business is earning
adequate profits in other product lines.
PART 2: Investment appraisal
2.1 Challenging management forecast and listing advantages and disadvantages of investment
appraisal techniques
Management Forecast
Forecasting is quite crucial for the company so that it may easily predict future sales
and revenue in effective manner. Management forecast is challenging task for manager of the
firm as every thing depends n correct estimation in order to seek the future of company. It is
done by analysing past sales and demand by the customer in near future. This means that
current trend of market is effectively assessed by management and as such, adequate
decisions may be taken which would inject operations in the best possible manner. It can be
analysed that Hi-Tech Plc has earned good profits in the past and as such, management of the
company has forecasted sales for the next years. It is planning to expand its operations in
Asian Markets in order to gain more revenue (Christ and Burritt, 2017).
Management forecast provides that initial investment of 500 m will be made in
expansion plan in Asian Markets. The revenue forecasted in the year 2019 is 300, while in
next year; it will be 560 and 740 in 2020. Moreover, 900 m in 2021 and in next financial
year, forecast is to cross beyond 1120 m. This means that revenue would consistently
increase in future period. Furthermore, there will be positive cash flows as well in the span of
five years. It can be assessed that though management has forecasted sales and cash flows for
these periods, it is not easy to attain the target in new market. This implies that management
of Hi-Tech Plc has to implement well-structured strategies and provide better quality
electronic goods to customers which will help company to garner desired profits in effectual
manner. Thus, organization will be able to gain profits by expanding to Asian Markets.
Investment appraisal technique
Payback period
The payback period is useful capital investment technique that provides clarity when
investment would return its initial outlay cost (Locatelli, Pecoraro, Meroni and Mancini,
2017). Business recognizes when initial investment will be recovered in near future. Payback
period is quite effective tool for analysing how much time project will take in order to garner
additional income by successfully investing in the project. It is recommended by the market
experts that shorter the payback period, more beneficial for the company to invest money. Hi-
Tech Plc has attained period of 4 years which clearly implies that investment in expansion to
Asian Markets will get this much stated time to recover investment and as such, it is
beneficial for company as investment would garner profits with much ease.
Advantages
It is simple to calculate and interpret the results therefrom. Furthermore, this method
of capital investment is quite economical in terms of cost, time etc.
This method is useful for company which has fewer amounts of cash and as such, low
liquidity position.
It emphasizes on recovery of investment amount and as such, it is suitable for Hi-
Tech Plc for investing in the project (Laird and Venables, 2017).
⊘ This is a preview!⊘
Do you want full access?
Subscribe today to unlock all pages.
Trusted by 1+ million students worldwide
1 out of 18
Related Documents


Your All-in-One AI-Powered Toolkit for Academic Success.
+13062052269
info@desklib.com
Available 24*7 on WhatsApp / Email
![[object Object]](/_next/static/media/star-bottom.7253800d.svg)
Unlock your academic potential
Copyright © 2020–2026 A2Z Services. All Rights Reserved. Developed and managed by ZUCOL.