Financial Decision Making Report: Starbucks' Investment Analysis
VerifiedAdded on 2023/01/12
|18
|4632
|67
Report
AI Summary
This report provides a comprehensive analysis of financial decision-making, focusing on Starbucks' potential acquisition of Roasted Ltd. It begins with an industry review of the UK coffee house market, followed by an in-depth examination of Roasted Ltd.'s financial performance. The analysis includes a detailed review of the profit and loss account, statement of financial position, and statement of cash flow for 2017 and 2018. Key financial ratios are calculated and interpreted to assess the company's profitability, liquidity, and efficiency. Furthermore, the report delves into investment appraisal techniques, including payback period, accounting rate of return, and net present value, to evaluate the viability of the proposed acquisition. The findings suggest that the acquisition of Roasted Ltd. could be a beneficial move for Starbucks, given the positive financial outcomes observed. The report concludes with a summary of the key findings and recommendations based on the financial analysis.
FINANCIAL DECISION
MAKING
MAKING
Paraphrase This Document
Need a fresh take? Get an instant paraphrase of this document with our AI Paraphraser

Contents
EXECUTIVE SUMMARY.................................................................................................................................3
PART 1: Industry Review..............................................................................................................................3
Top line review of current UK coffee house industry..............................................................................3
PART 2: Business performance analysis:......................................................................................................3
2.1 Analysis of profit and loss account....................................................................................................3
2.2 Statement of financial position..........................................................................................................5
2.3 Statement of cash flow......................................................................................................................7
PART 3: Investment Appraisal...................................................................................................................10
3.1 (a) Management Forecast................................................................................................................10
3.1 (b) Investment Appraisal.................................................................................................................10
REFERENCES..............................................................................................................................................14
⊘ This is a preview!⊘
Do you want full access?
Subscribe today to unlock all pages.
Trusted by 1+ million students worldwide
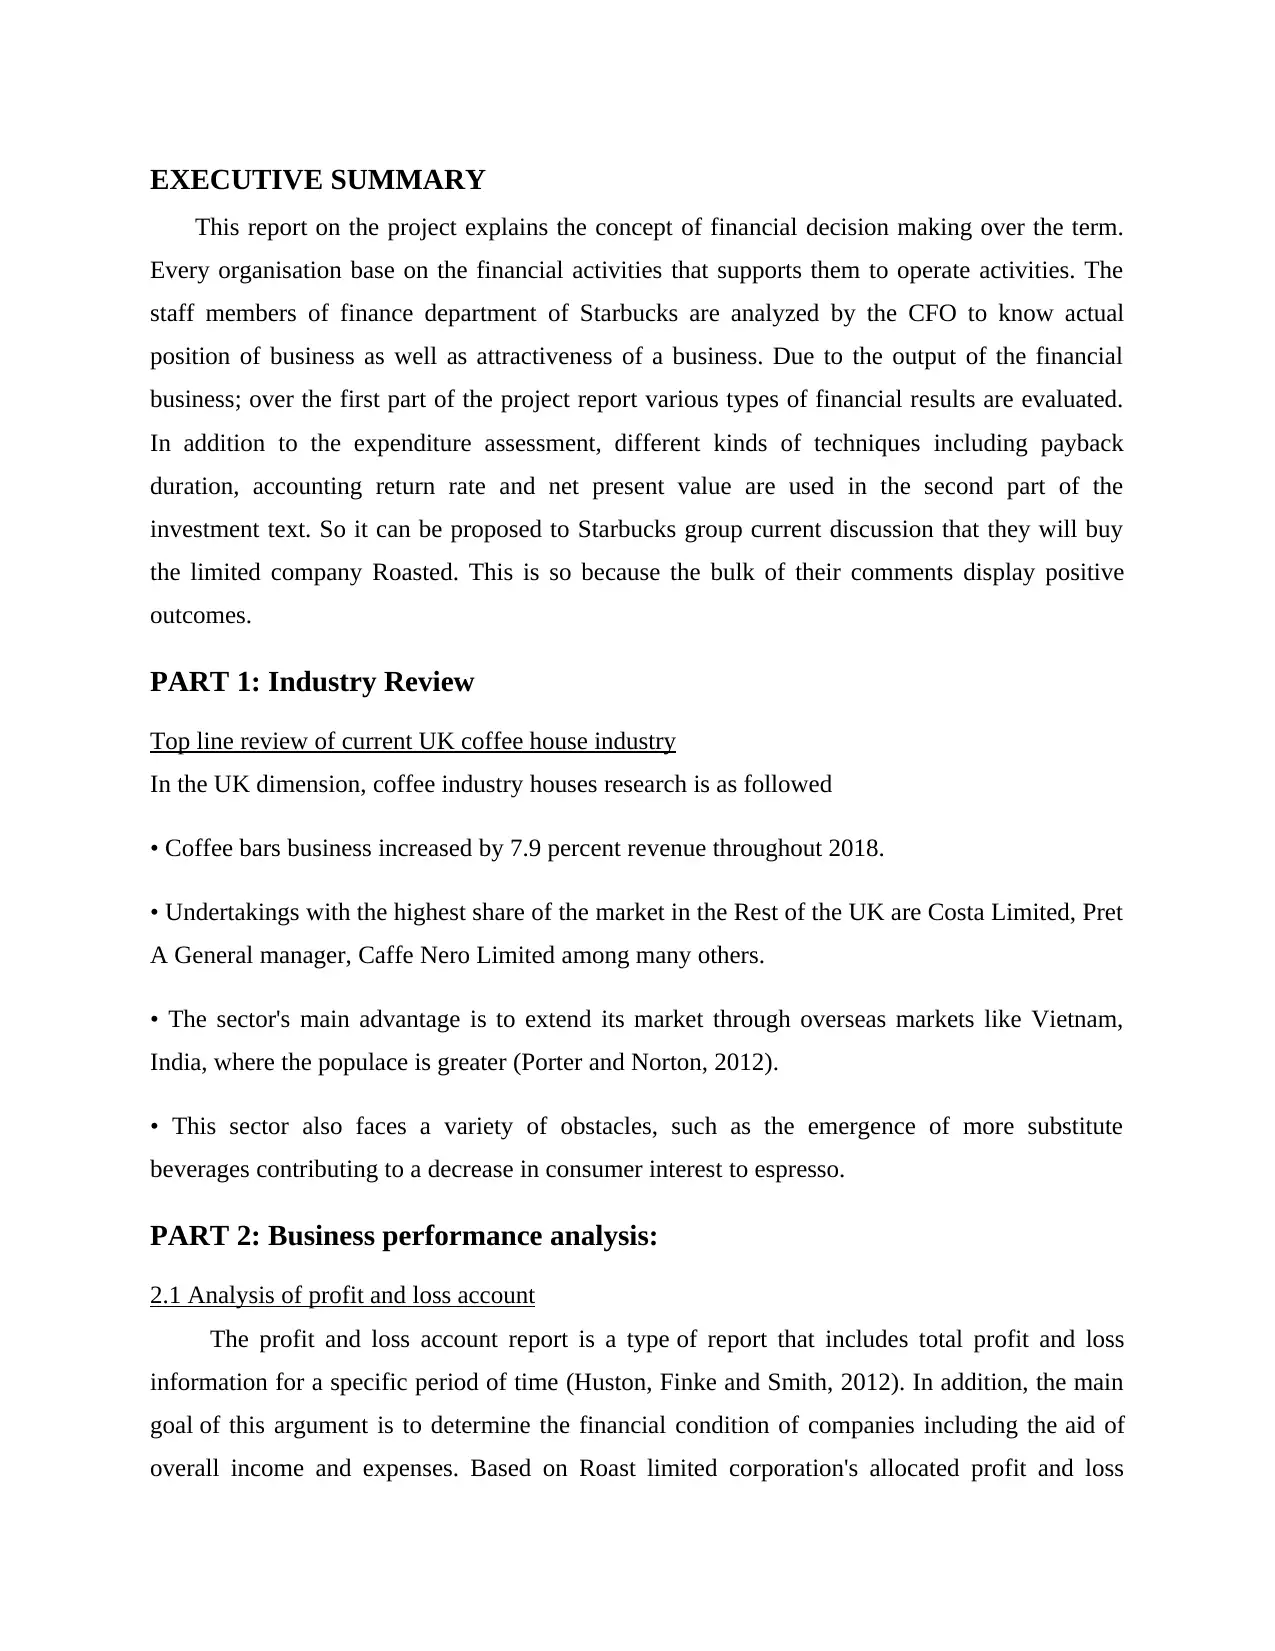
EXECUTIVE SUMMARY
This report on the project explains the concept of financial decision making over the term.
Every organisation base on the financial activities that supports them to operate activities. The
staff members of finance department of Starbucks are analyzed by the CFO to know actual
position of business as well as attractiveness of a business. Due to the output of the financial
business; over the first part of the project report various types of financial results are evaluated.
In addition to the expenditure assessment, different kinds of techniques including payback
duration, accounting return rate and net present value are used in the second part of the
investment text. So it can be proposed to Starbucks group current discussion that they will buy
the limited company Roasted. This is so because the bulk of their comments display positive
outcomes.
PART 1: Industry Review
Top line review of current UK coffee house industry
In the UK dimension, coffee industry houses research is as followed
• Coffee bars business increased by 7.9 percent revenue throughout 2018.
• Undertakings with the highest share of the market in the Rest of the UK are Costa Limited, Pret
A General manager, Caffe Nero Limited among many others.
• The sector's main advantage is to extend its market through overseas markets like Vietnam,
India, where the populace is greater (Porter and Norton, 2012).
• This sector also faces a variety of obstacles, such as the emergence of more substitute
beverages contributing to a decrease in consumer interest to espresso.
PART 2: Business performance analysis:
2.1 Analysis of profit and loss account
The profit and loss account report is a type of report that includes total profit and loss
information for a specific period of time (Huston, Finke and Smith, 2012). In addition, the main
goal of this argument is to determine the financial condition of companies including the aid of
overall income and expenses. Based on Roast limited corporation's allocated profit and loss
Paraphrase This Document
Need a fresh take? Get an instant paraphrase of this document with our AI Paraphraser
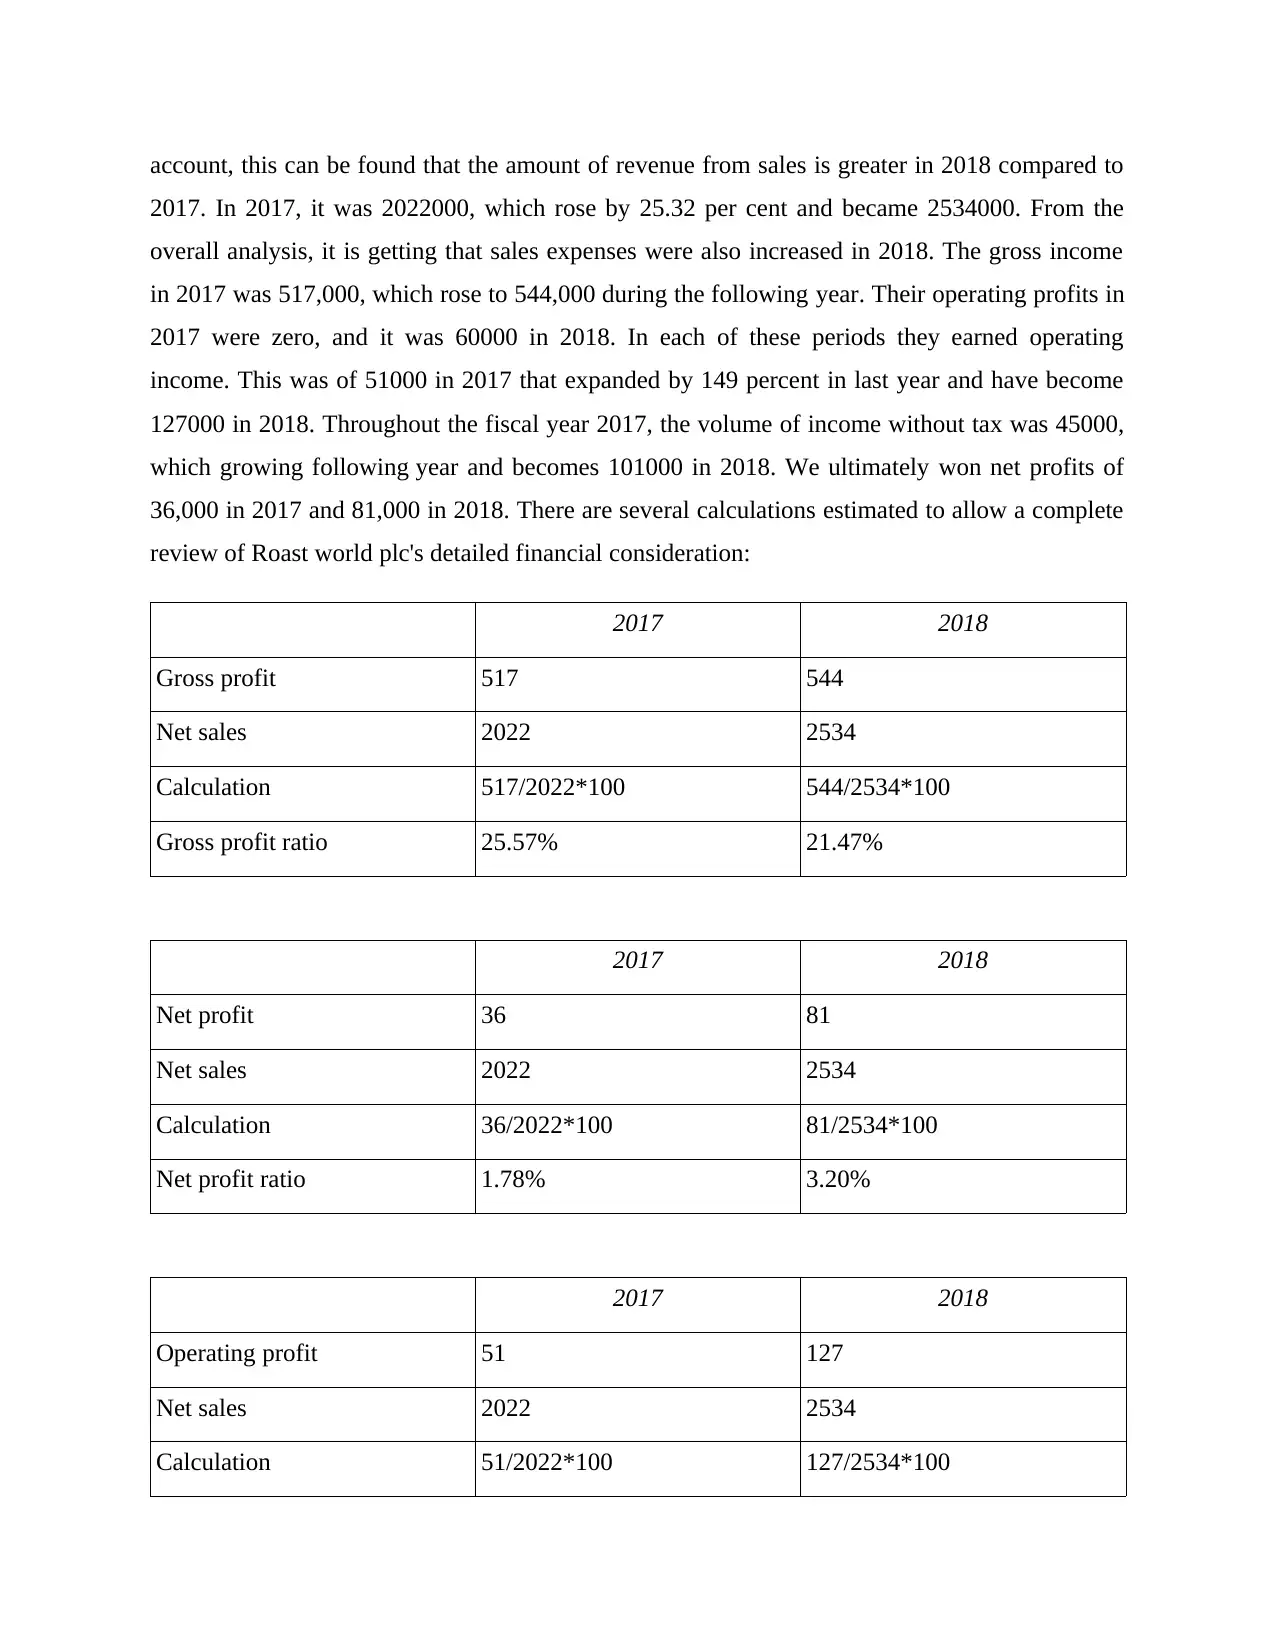
account, this can be found that the amount of revenue from sales is greater in 2018 compared to
2017. In 2017, it was 2022000, which rose by 25.32 per cent and became 2534000. From the
overall analysis, it is getting that sales expenses were also increased in 2018. The gross income
in 2017 was 517,000, which rose to 544,000 during the following year. Their operating profits in
2017 were zero, and it was 60000 in 2018. In each of these periods they earned operating
income. This was of 51000 in 2017 that expanded by 149 percent in last year and have become
127000 in 2018. Throughout the fiscal year 2017, the volume of income without tax was 45000,
which growing following year and becomes 101000 in 2018. We ultimately won net profits of
36,000 in 2017 and 81,000 in 2018. There are several calculations estimated to allow a complete
review of Roast world plc's detailed financial consideration:
2017 2018
Gross profit 517 544
Net sales 2022 2534
Calculation 517/2022*100 544/2534*100
Gross profit ratio 25.57% 21.47%
2017 2018
Net profit 36 81
Net sales 2022 2534
Calculation 36/2022*100 81/2534*100
Net profit ratio 1.78% 3.20%
2017 2018
Operating profit 51 127
Net sales 2022 2534
Calculation 51/2022*100 127/2534*100
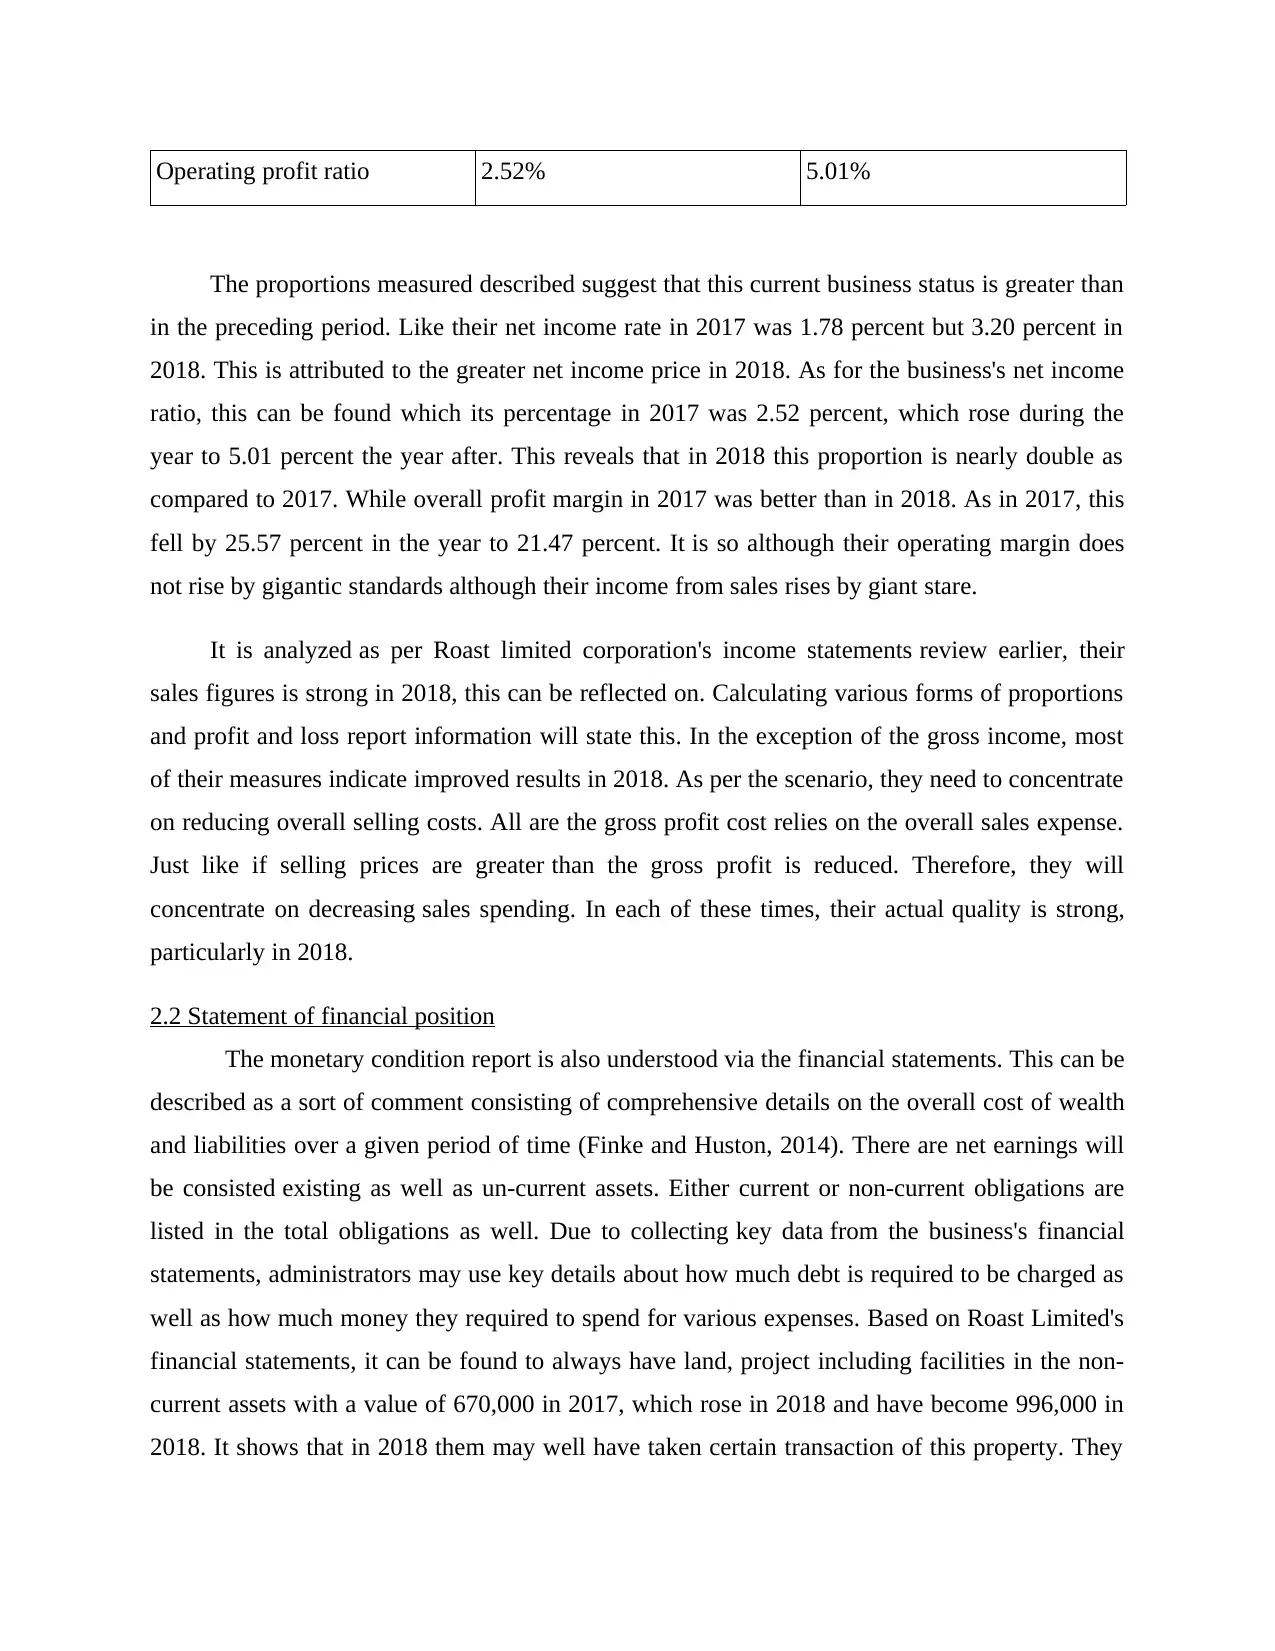
Operating profit ratio 2.52% 5.01%
The proportions measured described suggest that this current business status is greater than
in the preceding period. Like their net income rate in 2017 was 1.78 percent but 3.20 percent in
2018. This is attributed to the greater net income price in 2018. As for the business's net income
ratio, this can be found which its percentage in 2017 was 2.52 percent, which rose during the
year to 5.01 percent the year after. This reveals that in 2018 this proportion is nearly double as
compared to 2017. While overall profit margin in 2017 was better than in 2018. As in 2017, this
fell by 25.57 percent in the year to 21.47 percent. It is so although their operating margin does
not rise by gigantic standards although their income from sales rises by giant stare.
It is analyzed as per Roast limited corporation's income statements review earlier, their
sales figures is strong in 2018, this can be reflected on. Calculating various forms of proportions
and profit and loss report information will state this. In the exception of the gross income, most
of their measures indicate improved results in 2018. As per the scenario, they need to concentrate
on reducing overall selling costs. All are the gross profit cost relies on the overall sales expense.
Just like if selling prices are greater than the gross profit is reduced. Therefore, they will
concentrate on decreasing sales spending. In each of these times, their actual quality is strong,
particularly in 2018.
2.2 Statement of financial position
The monetary condition report is also understood via the financial statements. This can be
described as a sort of comment consisting of comprehensive details on the overall cost of wealth
and liabilities over a given period of time (Finke and Huston, 2014). There are net earnings will
be consisted existing as well as un-current assets. Either current or non-current obligations are
listed in the total obligations as well. Due to collecting key data from the business's financial
statements, administrators may use key details about how much debt is required to be charged as
well as how much money they required to spend for various expenses. Based on Roast Limited's
financial statements, it can be found to always have land, project including facilities in the non-
current assets with a value of 670,000 in 2017, which rose in 2018 and have become 996,000 in
2018. It shows that in 2018 them may well have taken certain transaction of this property. They
⊘ This is a preview!⊘
Do you want full access?
Subscribe today to unlock all pages.
Trusted by 1+ million students worldwide
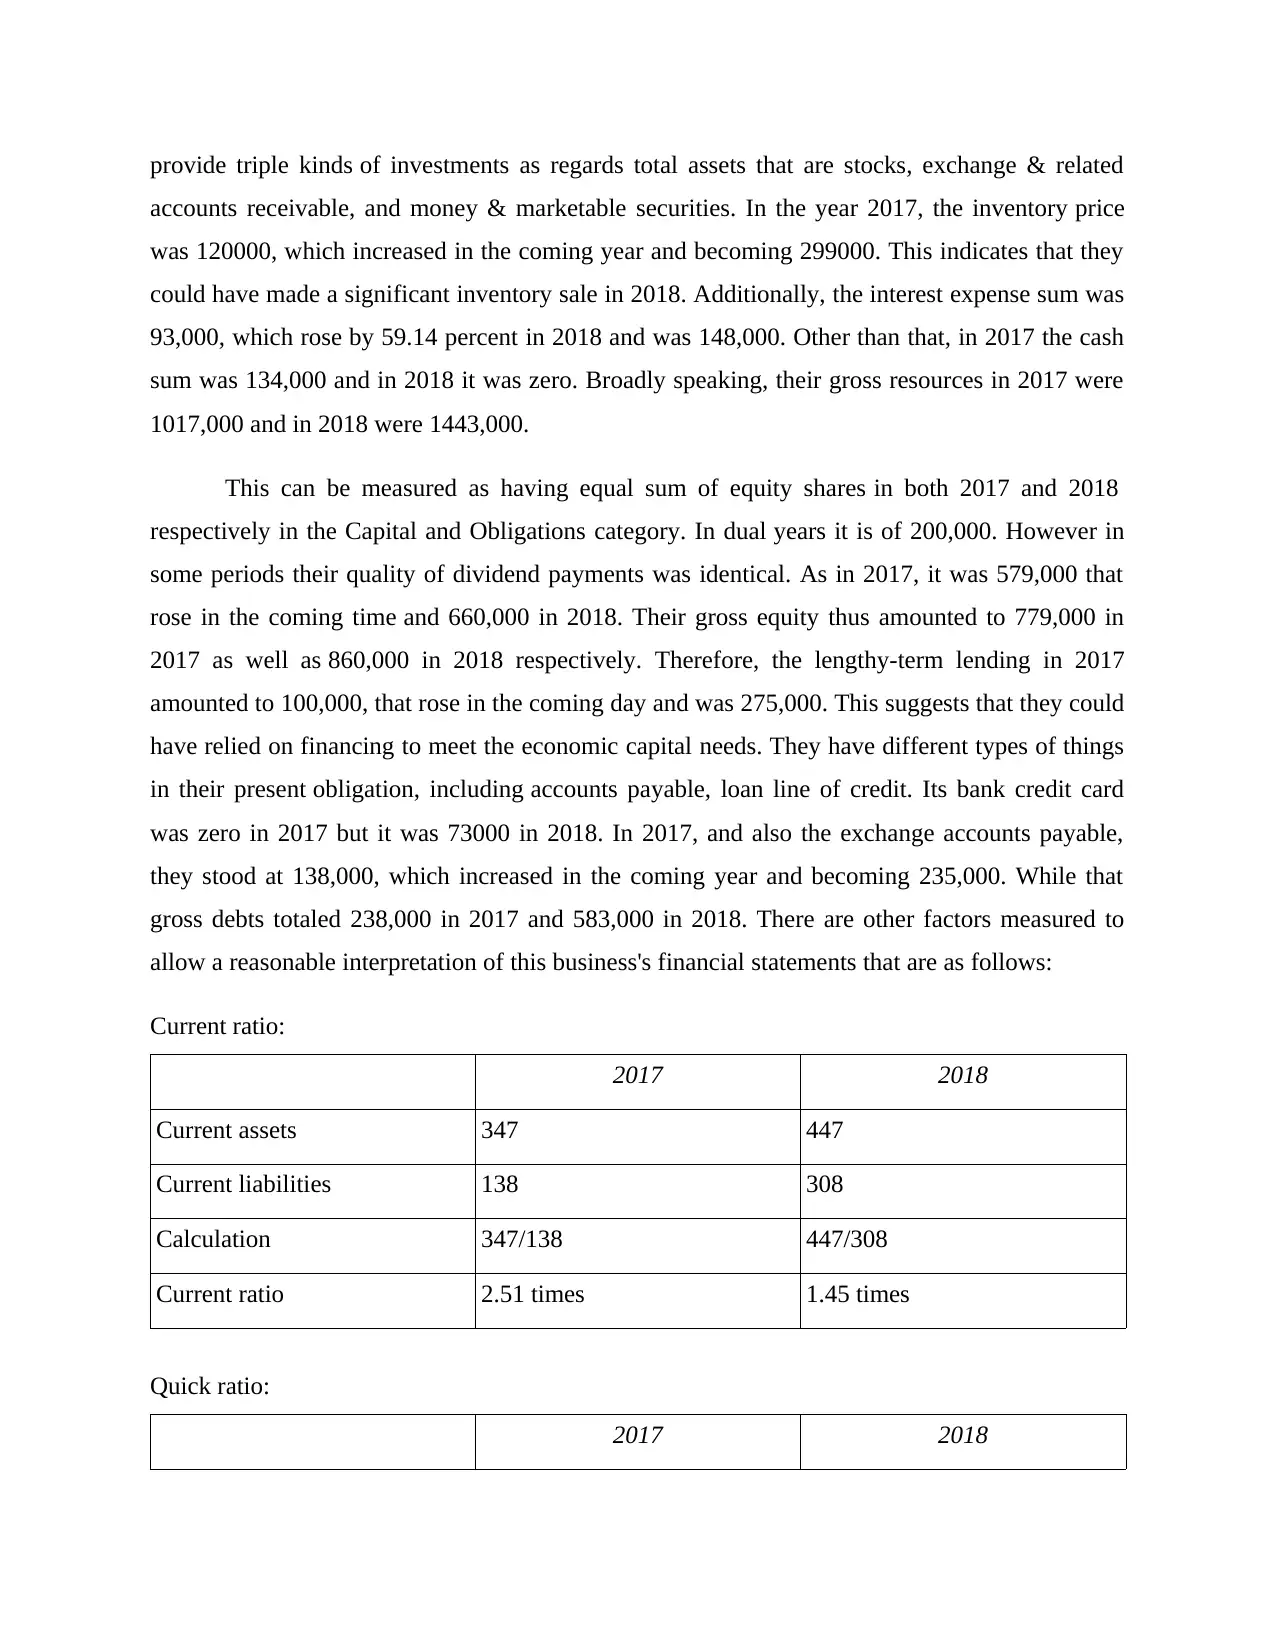
provide triple kinds of investments as regards total assets that are stocks, exchange & related
accounts receivable, and money & marketable securities. In the year 2017, the inventory price
was 120000, which increased in the coming year and becoming 299000. This indicates that they
could have made a significant inventory sale in 2018. Additionally, the interest expense sum was
93,000, which rose by 59.14 percent in 2018 and was 148,000. Other than that, in 2017 the cash
sum was 134,000 and in 2018 it was zero. Broadly speaking, their gross resources in 2017 were
1017,000 and in 2018 were 1443,000.
This can be measured as having equal sum of equity shares in both 2017 and 2018
respectively in the Capital and Obligations category. In dual years it is of 200,000. However in
some periods their quality of dividend payments was identical. As in 2017, it was 579,000 that
rose in the coming time and 660,000 in 2018. Their gross equity thus amounted to 779,000 in
2017 as well as 860,000 in 2018 respectively. Therefore, the lengthy-term lending in 2017
amounted to 100,000, that rose in the coming day and was 275,000. This suggests that they could
have relied on financing to meet the economic capital needs. They have different types of things
in their present obligation, including accounts payable, loan line of credit. Its bank credit card
was zero in 2017 but it was 73000 in 2018. In 2017, and also the exchange accounts payable,
they stood at 138,000, which increased in the coming year and becoming 235,000. While that
gross debts totaled 238,000 in 2017 and 583,000 in 2018. There are other factors measured to
allow a reasonable interpretation of this business's financial statements that are as follows:
Current ratio:
2017 2018
Current assets 347 447
Current liabilities 138 308
Calculation 347/138 447/308
Current ratio 2.51 times 1.45 times
Quick ratio:
2017 2018
Paraphrase This Document
Need a fresh take? Get an instant paraphrase of this document with our AI Paraphraser
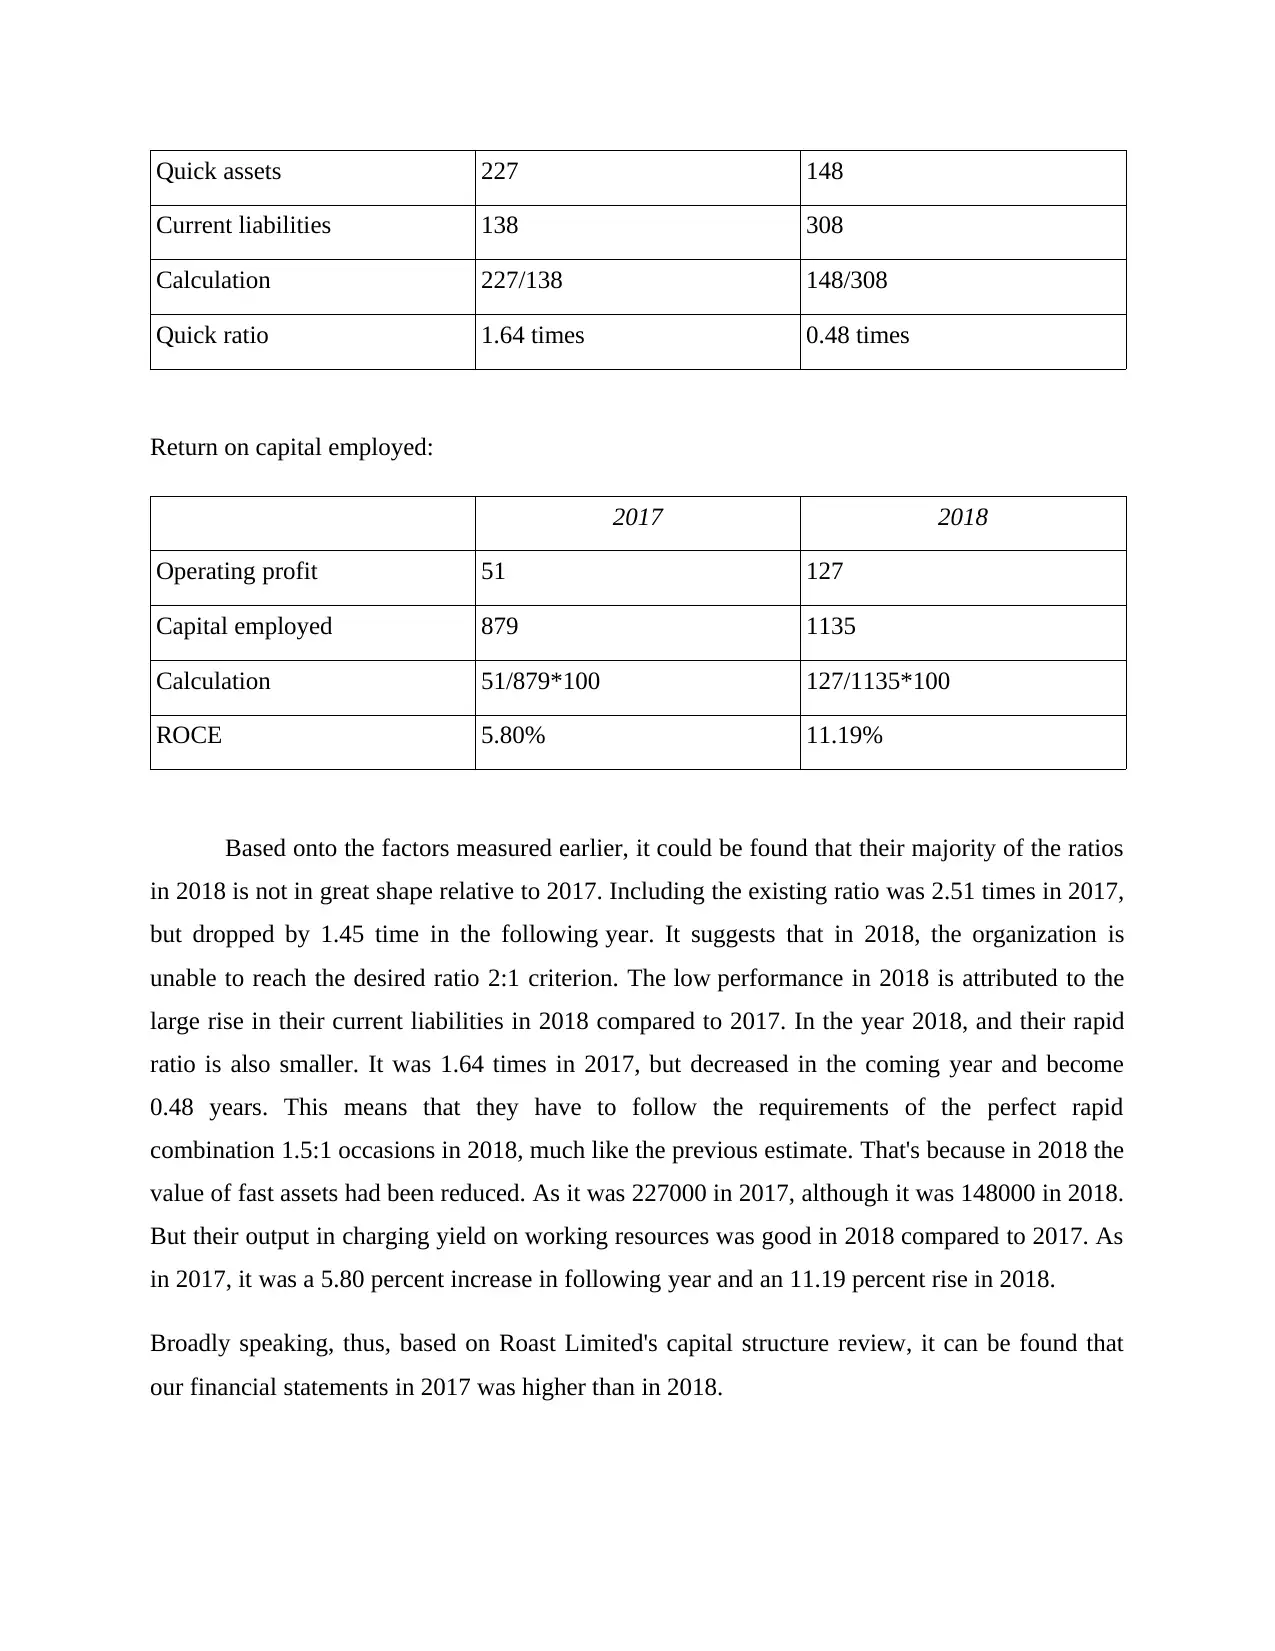
Quick assets 227 148
Current liabilities 138 308
Calculation 227/138 148/308
Quick ratio 1.64 times 0.48 times
Return on capital employed:
2017 2018
Operating profit 51 127
Capital employed 879 1135
Calculation 51/879*100 127/1135*100
ROCE 5.80% 11.19%
Based onto the factors measured earlier, it could be found that their majority of the ratios
in 2018 is not in great shape relative to 2017. Including the existing ratio was 2.51 times in 2017,
but dropped by 1.45 time in the following year. It suggests that in 2018, the organization is
unable to reach the desired ratio 2:1 criterion. The low performance in 2018 is attributed to the
large rise in their current liabilities in 2018 compared to 2017. In the year 2018, and their rapid
ratio is also smaller. It was 1.64 times in 2017, but decreased in the coming year and become
0.48 years. This means that they have to follow the requirements of the perfect rapid
combination 1.5:1 occasions in 2018, much like the previous estimate. That's because in 2018 the
value of fast assets had been reduced. As it was 227000 in 2017, although it was 148000 in 2018.
But their output in charging yield on working resources was good in 2018 compared to 2017. As
in 2017, it was a 5.80 percent increase in following year and an 11.19 percent rise in 2018.
Broadly speaking, thus, based on Roast Limited's capital structure review, it can be found that
our financial statements in 2017 was higher than in 2018.
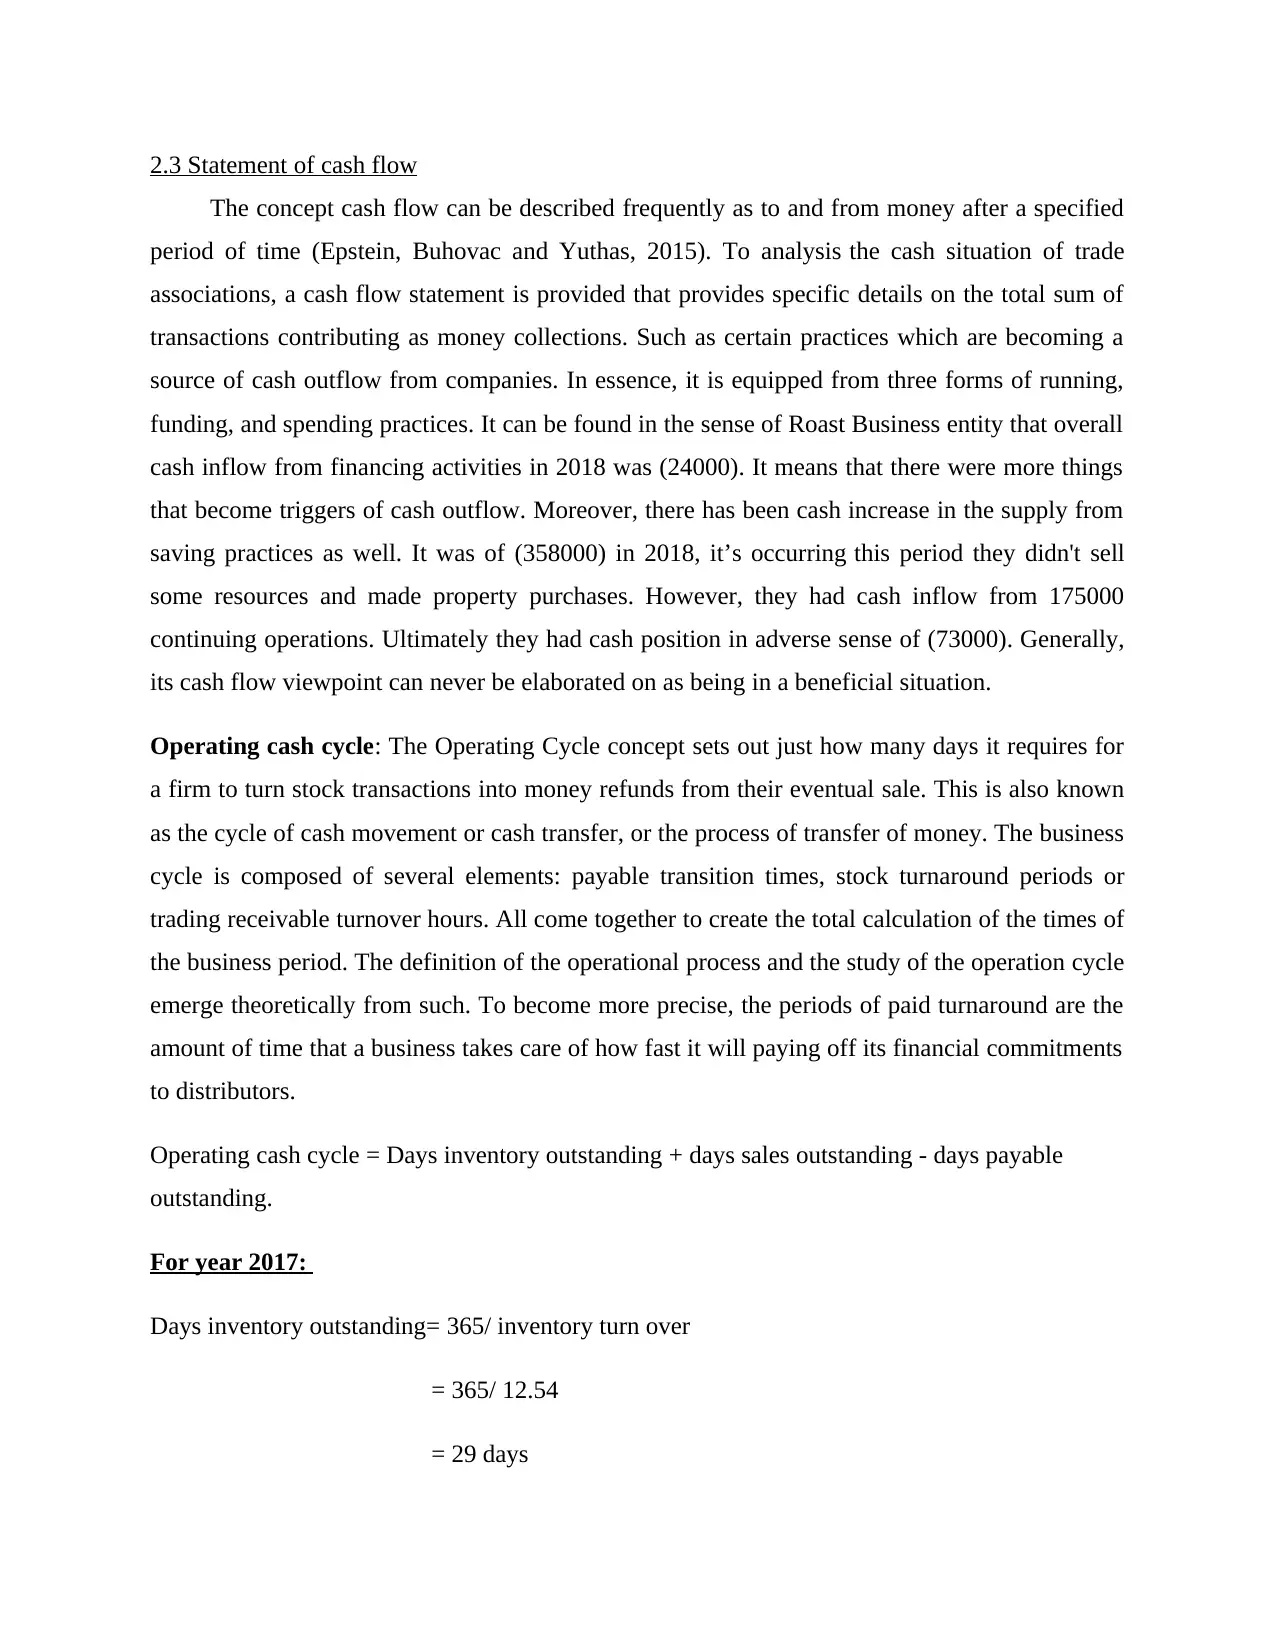
2.3 Statement of cash flow
The concept cash flow can be described frequently as to and from money after a specified
period of time (Epstein, Buhovac and Yuthas, 2015). To analysis the cash situation of trade
associations, a cash flow statement is provided that provides specific details on the total sum of
transactions contributing as money collections. Such as certain practices which are becoming a
source of cash outflow from companies. In essence, it is equipped from three forms of running,
funding, and spending practices. It can be found in the sense of Roast Business entity that overall
cash inflow from financing activities in 2018 was (24000). It means that there were more things
that become triggers of cash outflow. Moreover, there has been cash increase in the supply from
saving practices as well. It was of (358000) in 2018, it’s occurring this period they didn't sell
some resources and made property purchases. However, they had cash inflow from 175000
continuing operations. Ultimately they had cash position in adverse sense of (73000). Generally,
its cash flow viewpoint can never be elaborated on as being in a beneficial situation.
Operating cash cycle: The Operating Cycle concept sets out just how many days it requires for
a firm to turn stock transactions into money refunds from their eventual sale. This is also known
as the cycle of cash movement or cash transfer, or the process of transfer of money. The business
cycle is composed of several elements: payable transition times, stock turnaround periods or
trading receivable turnover hours. All come together to create the total calculation of the times of
the business period. The definition of the operational process and the study of the operation cycle
emerge theoretically from such. To become more precise, the periods of paid turnaround are the
amount of time that a business takes care of how fast it will paying off its financial commitments
to distributors.
Operating cash cycle = Days inventory outstanding + days sales outstanding - days payable
outstanding.
For year 2017:
Days inventory outstanding= 365/ inventory turn over
= 365/ 12.54
= 29 days
⊘ This is a preview!⊘
Do you want full access?
Subscribe today to unlock all pages.
Trusted by 1+ million students worldwide
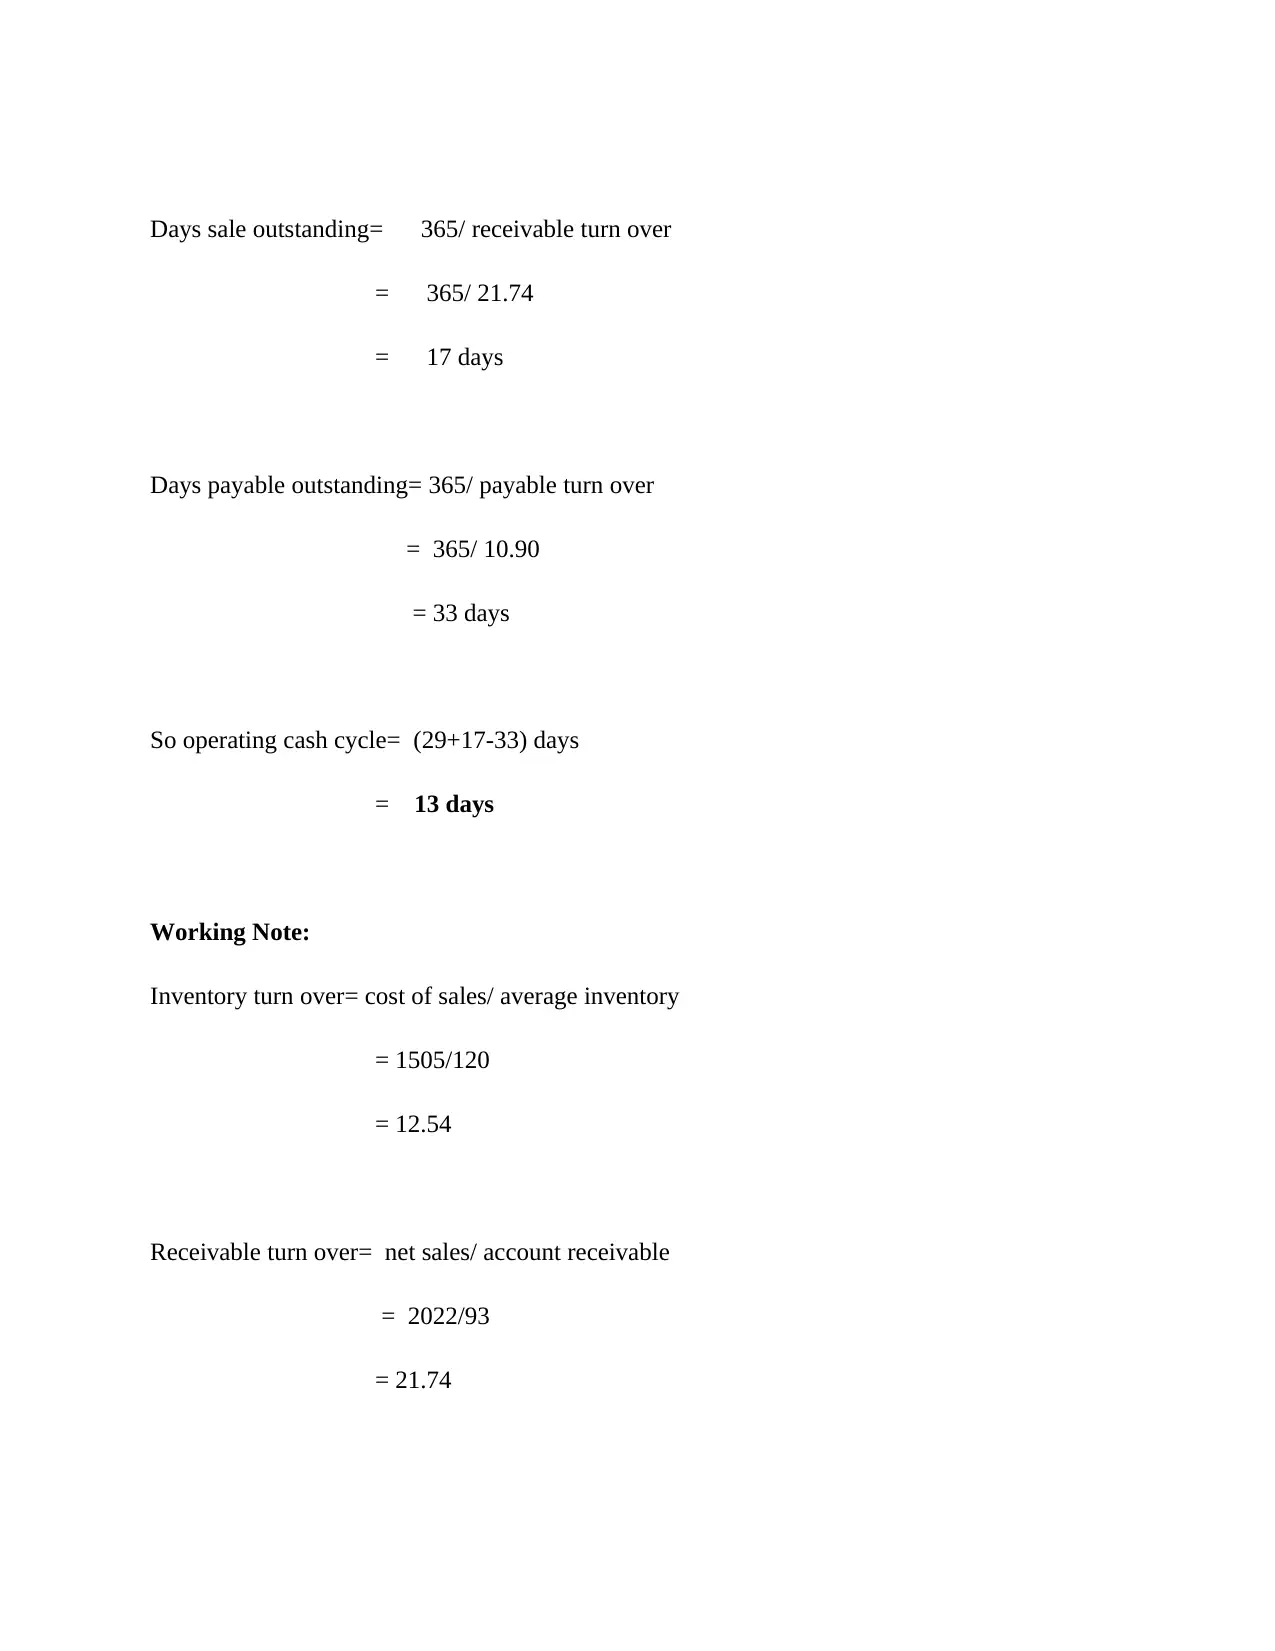
Days sale outstanding= 365/ receivable turn over
= 365/ 21.74
= 17 days
Days payable outstanding= 365/ payable turn over
= 365/ 10.90
= 33 days
So operating cash cycle= (29+17-33) days
= 13 days
Working Note:
Inventory turn over= cost of sales/ average inventory
= 1505/120
= 12.54
Receivable turn over= net sales/ account receivable
= 2022/93
= 21.74
Paraphrase This Document
Need a fresh take? Get an instant paraphrase of this document with our AI Paraphraser
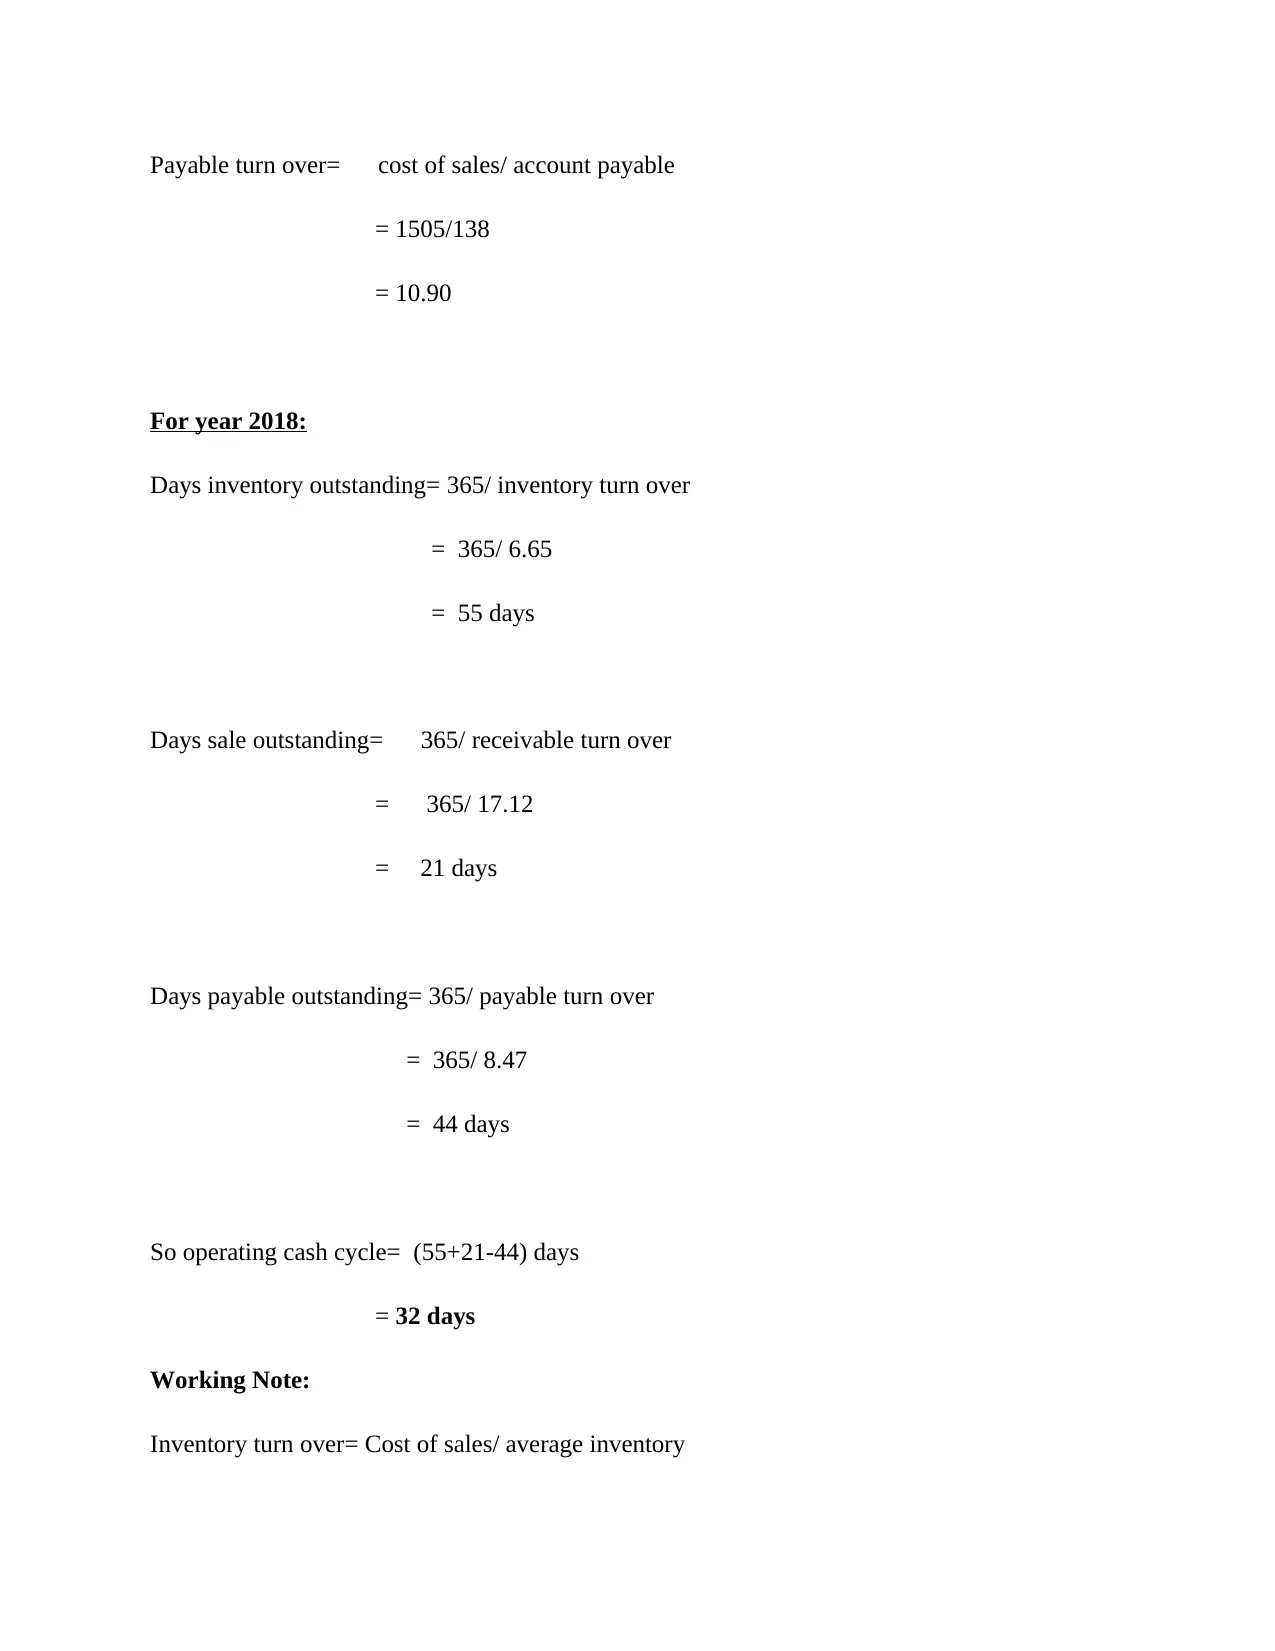
Payable turn over= cost of sales/ account payable
= 1505/138
= 10.90
For year 2018:
Days inventory outstanding= 365/ inventory turn over
= 365/ 6.65
= 55 days
Days sale outstanding= 365/ receivable turn over
= 365/ 17.12
= 21 days
Days payable outstanding= 365/ payable turn over
= 365/ 8.47
= 44 days
So operating cash cycle= (55+21-44) days
= 32 days
Working Note:
Inventory turn over= Cost of sales/ average inventory
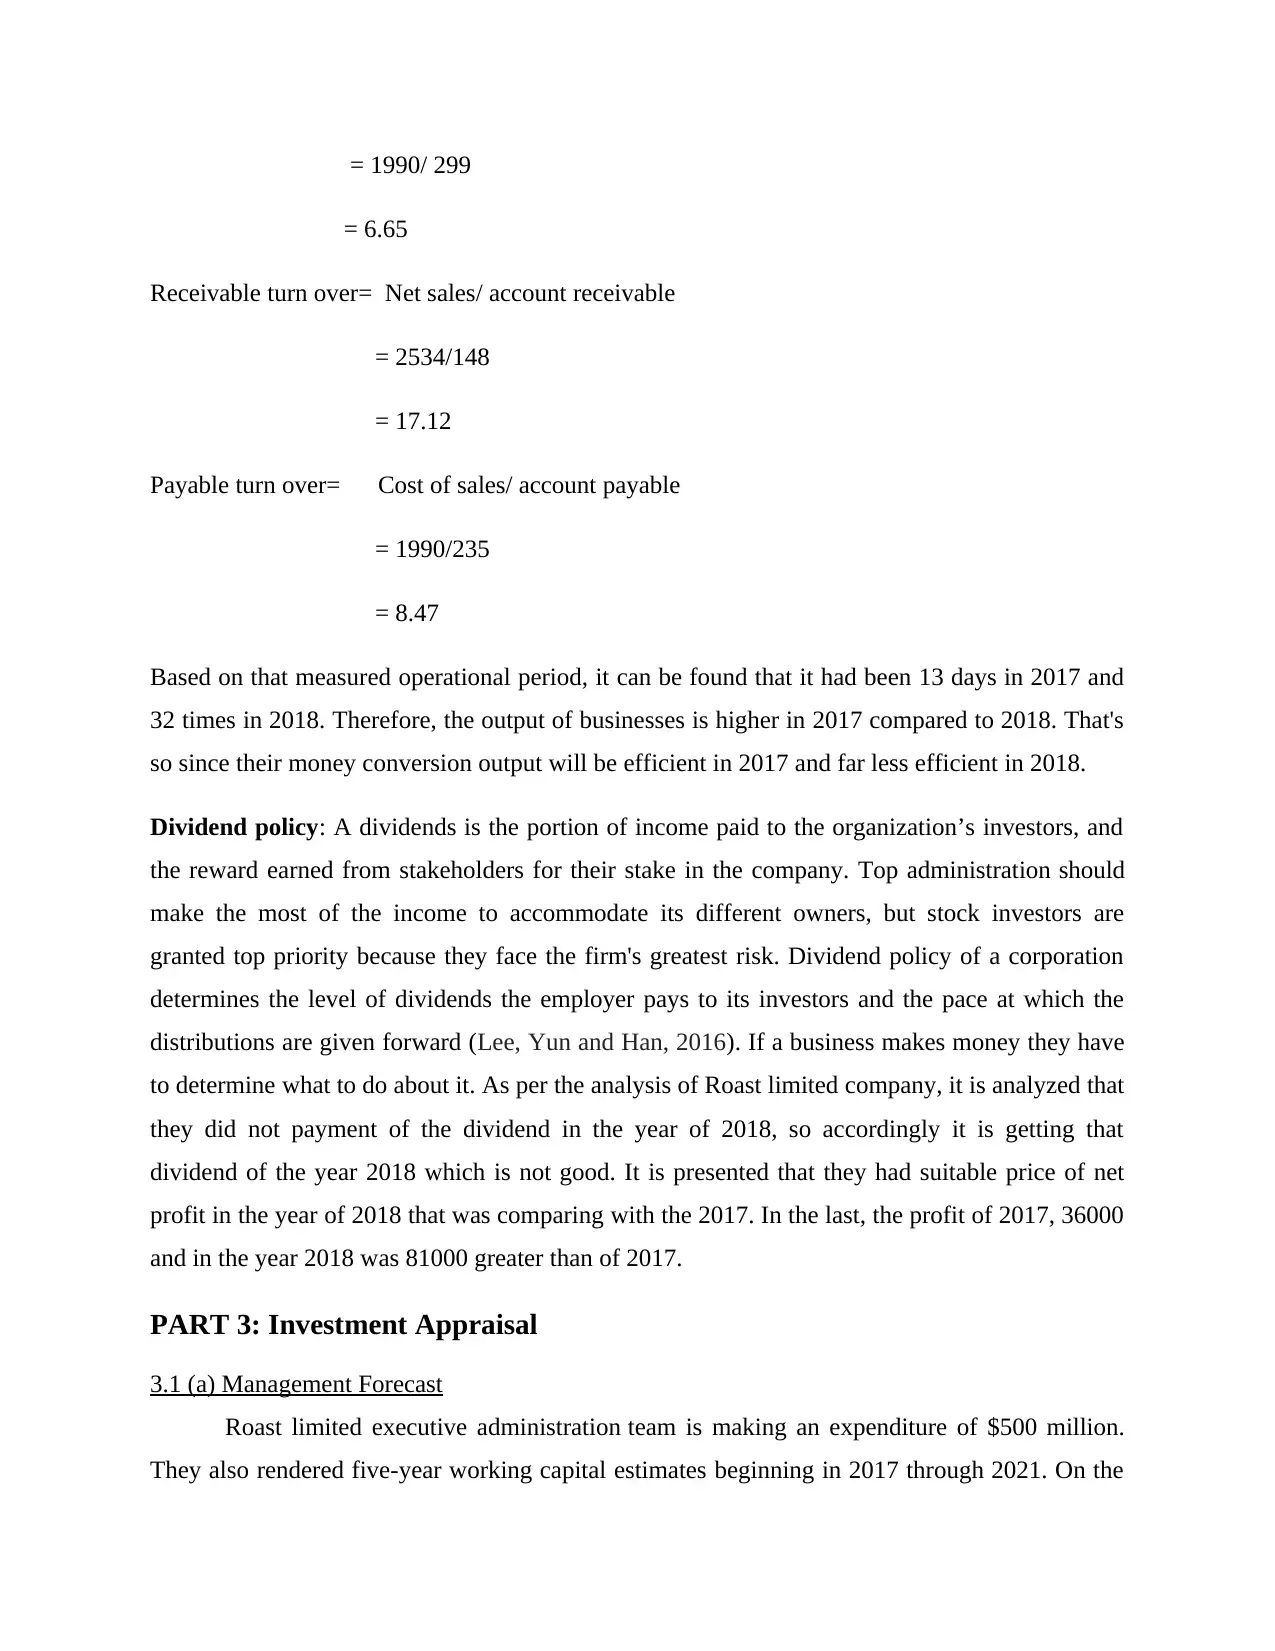
= 1990/ 299
= 6.65
Receivable turn over= Net sales/ account receivable
= 2534/148
= 17.12
Payable turn over= Cost of sales/ account payable
= 1990/235
= 8.47
Based on that measured operational period, it can be found that it had been 13 days in 2017 and
32 times in 2018. Therefore, the output of businesses is higher in 2017 compared to 2018. That's
so since their money conversion output will be efficient in 2017 and far less efficient in 2018.
Dividend policy: A dividends is the portion of income paid to the organization’s investors, and
the reward earned from stakeholders for their stake in the company. Top administration should
make the most of the income to accommodate its different owners, but stock investors are
granted top priority because they face the firm's greatest risk. Dividend policy of a corporation
determines the level of dividends the employer pays to its investors and the pace at which the
distributions are given forward (Lee, Yun and Han, 2016). If a business makes money they have
to determine what to do about it. As per the analysis of Roast limited company, it is analyzed that
they did not payment of the dividend in the year of 2018, so accordingly it is getting that
dividend of the year 2018 which is not good. It is presented that they had suitable price of net
profit in the year of 2018 that was comparing with the 2017. In the last, the profit of 2017, 36000
and in the year 2018 was 81000 greater than of 2017.
PART 3: Investment Appraisal
3.1 (a) Management Forecast
Roast limited executive administration team is making an expenditure of $500 million.
They also rendered five-year working capital estimates beginning in 2017 through 2021. On the
⊘ This is a preview!⊘
Do you want full access?
Subscribe today to unlock all pages.
Trusted by 1+ million students worldwide
1 out of 18
Related Documents


Your All-in-One AI-Powered Toolkit for Academic Success.
+13062052269
info@desklib.com
Available 24*7 on WhatsApp / Email
![[object Object]](/_next/static/media/star-bottom.7253800d.svg)
Unlock your academic potential
Copyright © 2020–2026 A2Z Services. All Rights Reserved. Developed and managed by ZUCOL.