Financial Performance Analysis Report for Cordon Bleu PLC (FIN 7040)
VerifiedAdded on 2022/11/13
|21
|5038
|412
Report
AI Summary
This report presents a financial analysis of Cordon Bleu PLC, a company operating in the restaurant industry. The analysis examines the company's performance using financial statements and ratio analysis, including profitability, liquidity, and solvency ratios. The report assesses the impact of recent acquisitions on the company's financial health and provides insights into its performance in 2017 and 2018. Furthermore, the report discusses the company's plans for growth through food delivery services, suggesting potential sources of finance and considering non-financial factors. The analysis covers key aspects like gross profit ratio, net profit ratio, return on equity, current ratio, quick ratio, debt ratio, debt to equity ratio, and equity ratio to evaluate the company's financial position and suggest areas for improvement. Investment appraisal techniques and sources of finance are also discussed to support future developments.
Running head: FINANCIAL DECISION MAKING
Financial decision making
5/26/2019
Financial decision making
5/26/2019
Paraphrase This Document
Need a fresh take? Get an instant paraphrase of this document with our AI Paraphraser
FINANCIAL DECISION MAKING 1
Executive summary
The intent of this report is to present the financial analysis of Cordon Bleu Plc., which offers
tasty and quality food through restaurants. The report is analyzing the performance of the
business in order to suggest future developments to the managers of the company. The report
has calculated the ratio analysis to evaluate the company’s performance as per different
perspective that is solvency, profitability, efficiency, and liquidity. From the analysis, it has
been identified that the company has recently acquired two chains of a restaurant to increase
its share in the market. However, in the initial phase, the business is not able to make must
effect on the customer, which could be seen from its financial statement. The company is also
planning to grow through food delivery service market for which the report has suggested
some finance sources and significant non-financial factors.
FINANCIAL DECISION MAKING 2
Table of Contents
Executive summary....................................................................................................................1
Part 1: Business Performance Analysis......................................................................................3
1.1 Statement of profit and loss of.........................................................................................3
Profitability Ratio...............................................................................................................3
1.2 Statement of Financial Position.......................................................................................5
Liquidity ratio.....................................................................................................................5
Solvency ratio.....................................................................................................................6
1.3 Statement Cash Flows......................................................................................................8
Operating Cash Cycle........................................................................................................8
Dividend.............................................................................................................................8
1.4 Market Segment Analysis................................................................................................9
Strategies for Value Segment...........................................................................................10
Strategies for Premium Segment......................................................................................10
Strategy for Classic Segment...........................................................................................11
Part 2 Investment Appraisal.....................................................................................................11
2.1.........................................................................................................................................11
a. Management Forecast...................................................................................................11
b. Investment Appraisal Techniques................................................................................11
2.2 Sources of Finance.........................................................................................................13
2.3 Non-Financial Factors 5 250..........................................................................................14
References................................................................................................................................16
⊘ This is a preview!⊘
Do you want full access?
Subscribe today to unlock all pages.
Trusted by 1+ million students worldwide
FINANCIAL DECISION MAKING 3
Part 1: Business Performance Analysis
1.1 Statement of profit and loss
A profit and loss statement is the document that evaluates and lists the expenses and revenue
of the business for the particular time period. It highlights the financial progress and status of
the company during the surveyed time. It is very important for every business organization to
prepare an income statement because it provides in details the capability of the company in
generating profit by driving revenue and cutting cost (Knight, 2012). This statement provides
detail categories of expenses and revenue which comprise the cost of goods sold, gross
margin, net profit, net sales, administrative expenses, and selling. With the help of the details
of profit and loss statement, the business can calculate some of the key ratios in order to
analyze its performance (Brief and Peasnell, 2013).
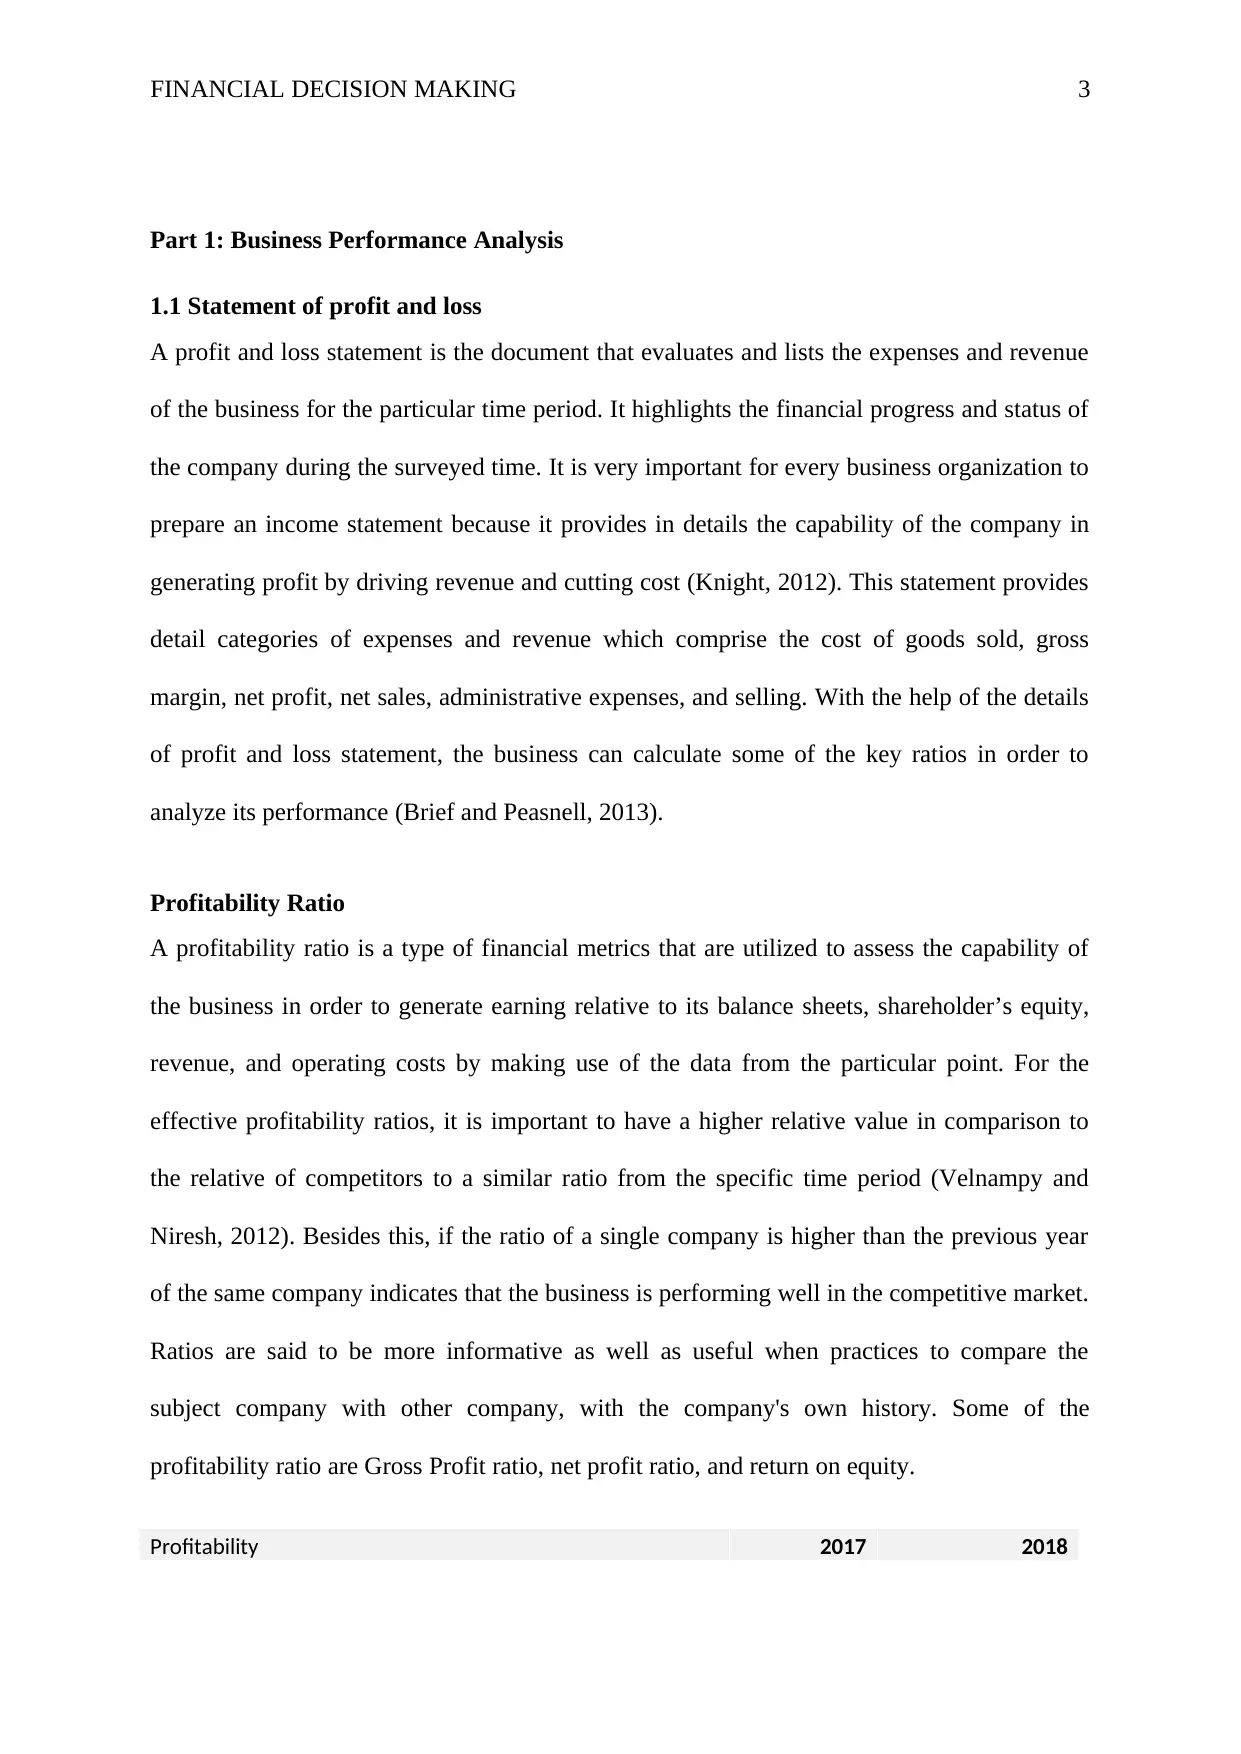
Profitability Ratio
A profitability ratio is a type of financial metrics that are utilized to assess the capability of
the business in order to generate earning relative to its balance sheets, shareholder’s equity,
revenue, and operating costs by making use of the data from the particular point. For the
effective profitability ratios, it is important to have a higher relative value in comparison to
the relative of competitors to a similar ratio from the specific time period (Velnampy and
Niresh, 2012). Besides this, if the ratio of a single company is higher than the previous year
of the same company indicates that the business is performing well in the competitive market.
Ratios are said to be more informative as well as useful when practices to compare the
subject company with other company, with the company's own history. Some of the
profitability ratio are Gross Profit ratio, net profit ratio, and return on equity.
Profitability 2017 2018
Part 1: Business Performance Analysis
1.1 Statement of profit and loss
A profit and loss statement is the document that evaluates and lists the expenses and revenue
of the business for the particular time period. It highlights the financial progress and status of
the company during the surveyed time. It is very important for every business organization to
prepare an income statement because it provides in details the capability of the company in
generating profit by driving revenue and cutting cost (Knight, 2012). This statement provides
detail categories of expenses and revenue which comprise the cost of goods sold, gross
margin, net profit, net sales, administrative expenses, and selling. With the help of the details
of profit and loss statement, the business can calculate some of the key ratios in order to
analyze its performance (Brief and Peasnell, 2013).
Profitability Ratio
A profitability ratio is a type of financial metrics that are utilized to assess the capability of
the business in order to generate earning relative to its balance sheets, shareholder’s equity,
revenue, and operating costs by making use of the data from the particular point. For the
effective profitability ratios, it is important to have a higher relative value in comparison to
the relative of competitors to a similar ratio from the specific time period (Velnampy and
Niresh, 2012). Besides this, if the ratio of a single company is higher than the previous year
of the same company indicates that the business is performing well in the competitive market.
Ratios are said to be more informative as well as useful when practices to compare the
subject company with other company, with the company's own history. Some of the
profitability ratio are Gross Profit ratio, net profit ratio, and return on equity.
Profitability 2017 2018
Paraphrase This Document
Need a fresh take? Get an instant paraphrase of this document with our AI Paraphraser
FINANCIAL DECISION MAKING 4
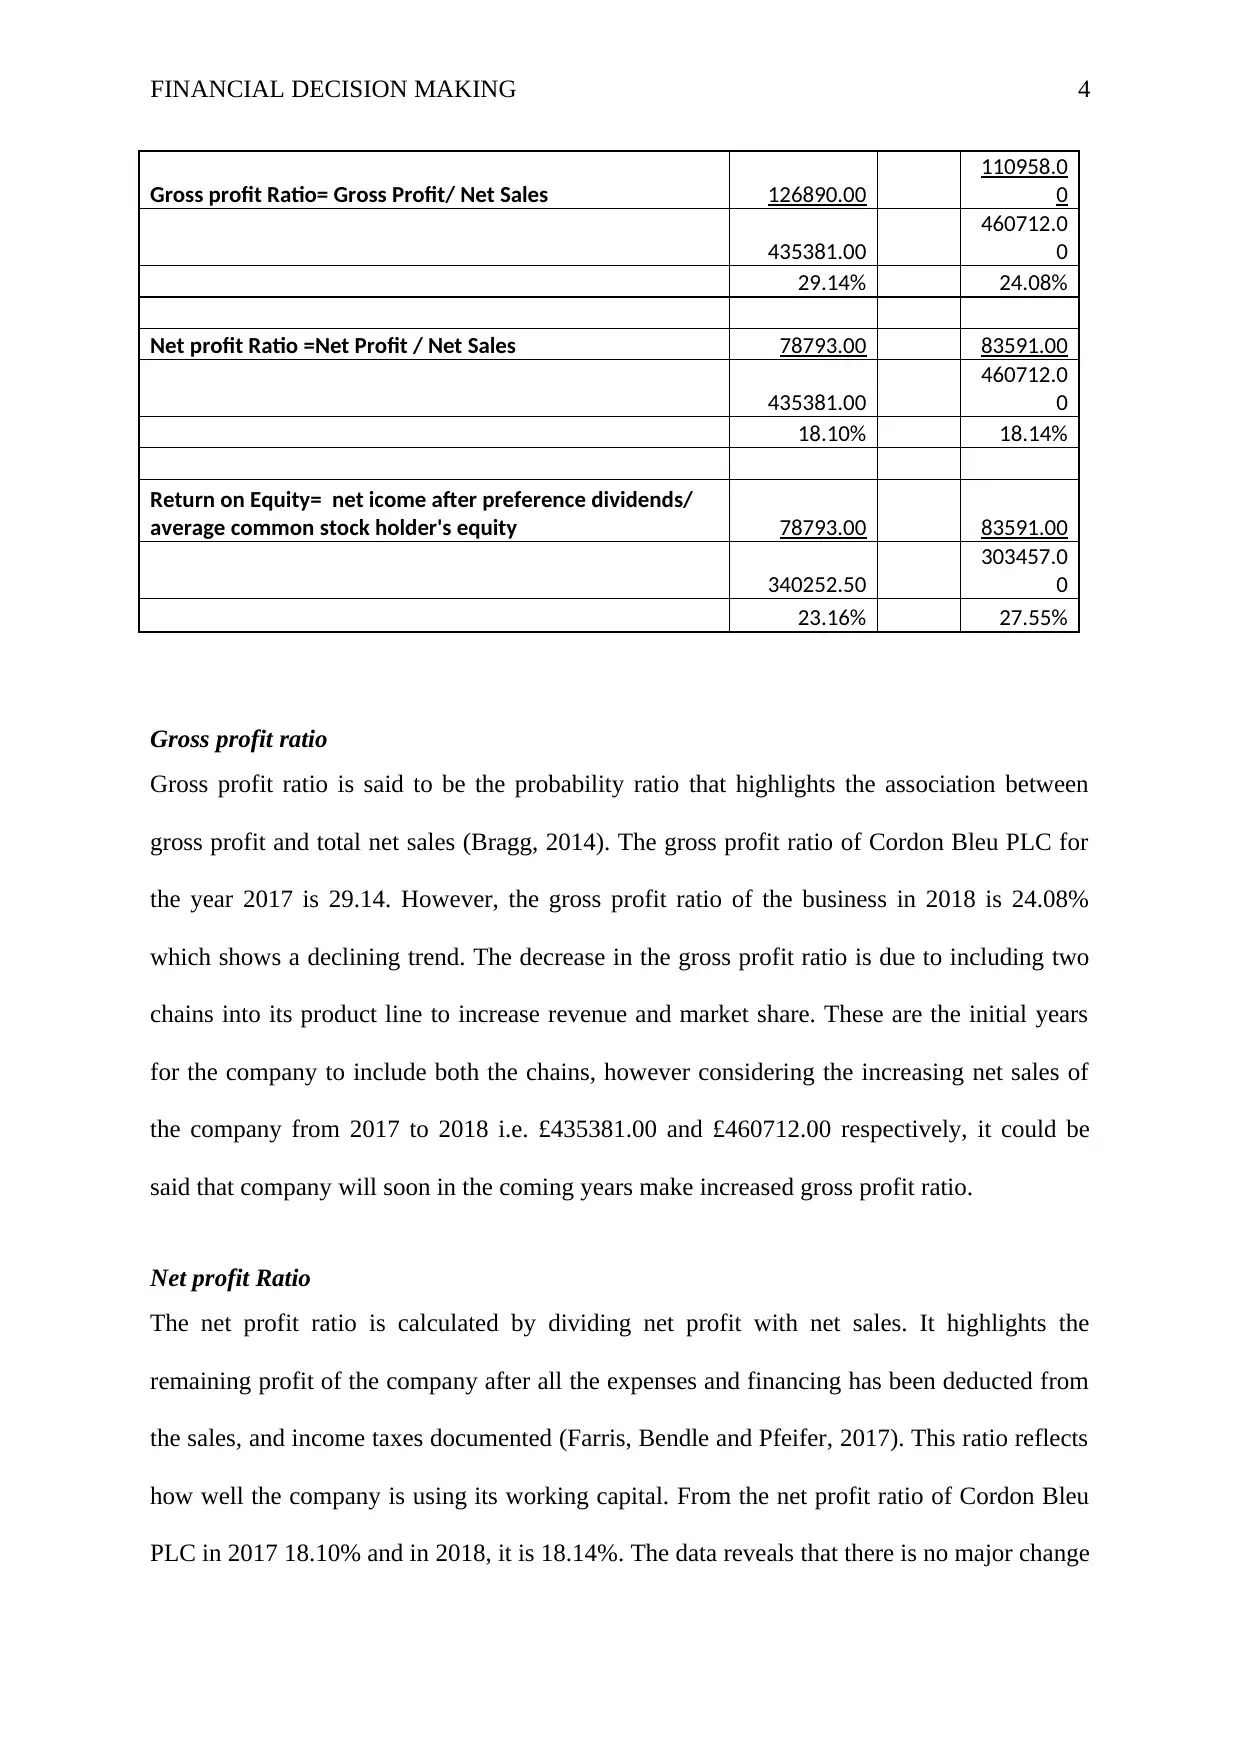
Gross profit Ratio= Gross Profit/ Net Sales 126890.00
110958.0
0
435381.00
460712.0
0
29.14% 24.08%
Net profit Ratio =Net Profit / Net Sales 78793.00 83591.00
435381.00
460712.0
0
18.10% 18.14%
Return on Equity= net icome after preference dividends/
average common stock holder's equity 78793.00 83591.00
340252.50
303457.0
0
23.16% 27.55%
Gross profit ratio
Gross profit ratio is said to be the probability ratio that highlights the association between
gross profit and total net sales (Bragg, 2014). The gross profit ratio of Cordon Bleu PLC for
the year 2017 is 29.14. However, the gross profit ratio of the business in 2018 is 24.08%
which shows a declining trend. The decrease in the gross profit ratio is due to including two
chains into its product line to increase revenue and market share. These are the initial years
for the company to include both the chains, however considering the increasing net sales of
the company from 2017 to 2018 i.e. £435381.00 and £460712.00 respectively, it could be
said that company will soon in the coming years make increased gross profit ratio.
Net profit Ratio
The net profit ratio is calculated by dividing net profit with net sales. It highlights the
remaining profit of the company after all the expenses and financing has been deducted from
the sales, and income taxes documented (Farris, Bendle and Pfeifer, 2017). This ratio reflects
how well the company is using its working capital. From the net profit ratio of Cordon Bleu
PLC in 2017 18.10% and in 2018, it is 18.14%. The data reveals that there is no major change
FINANCIAL DECISION MAKING 5
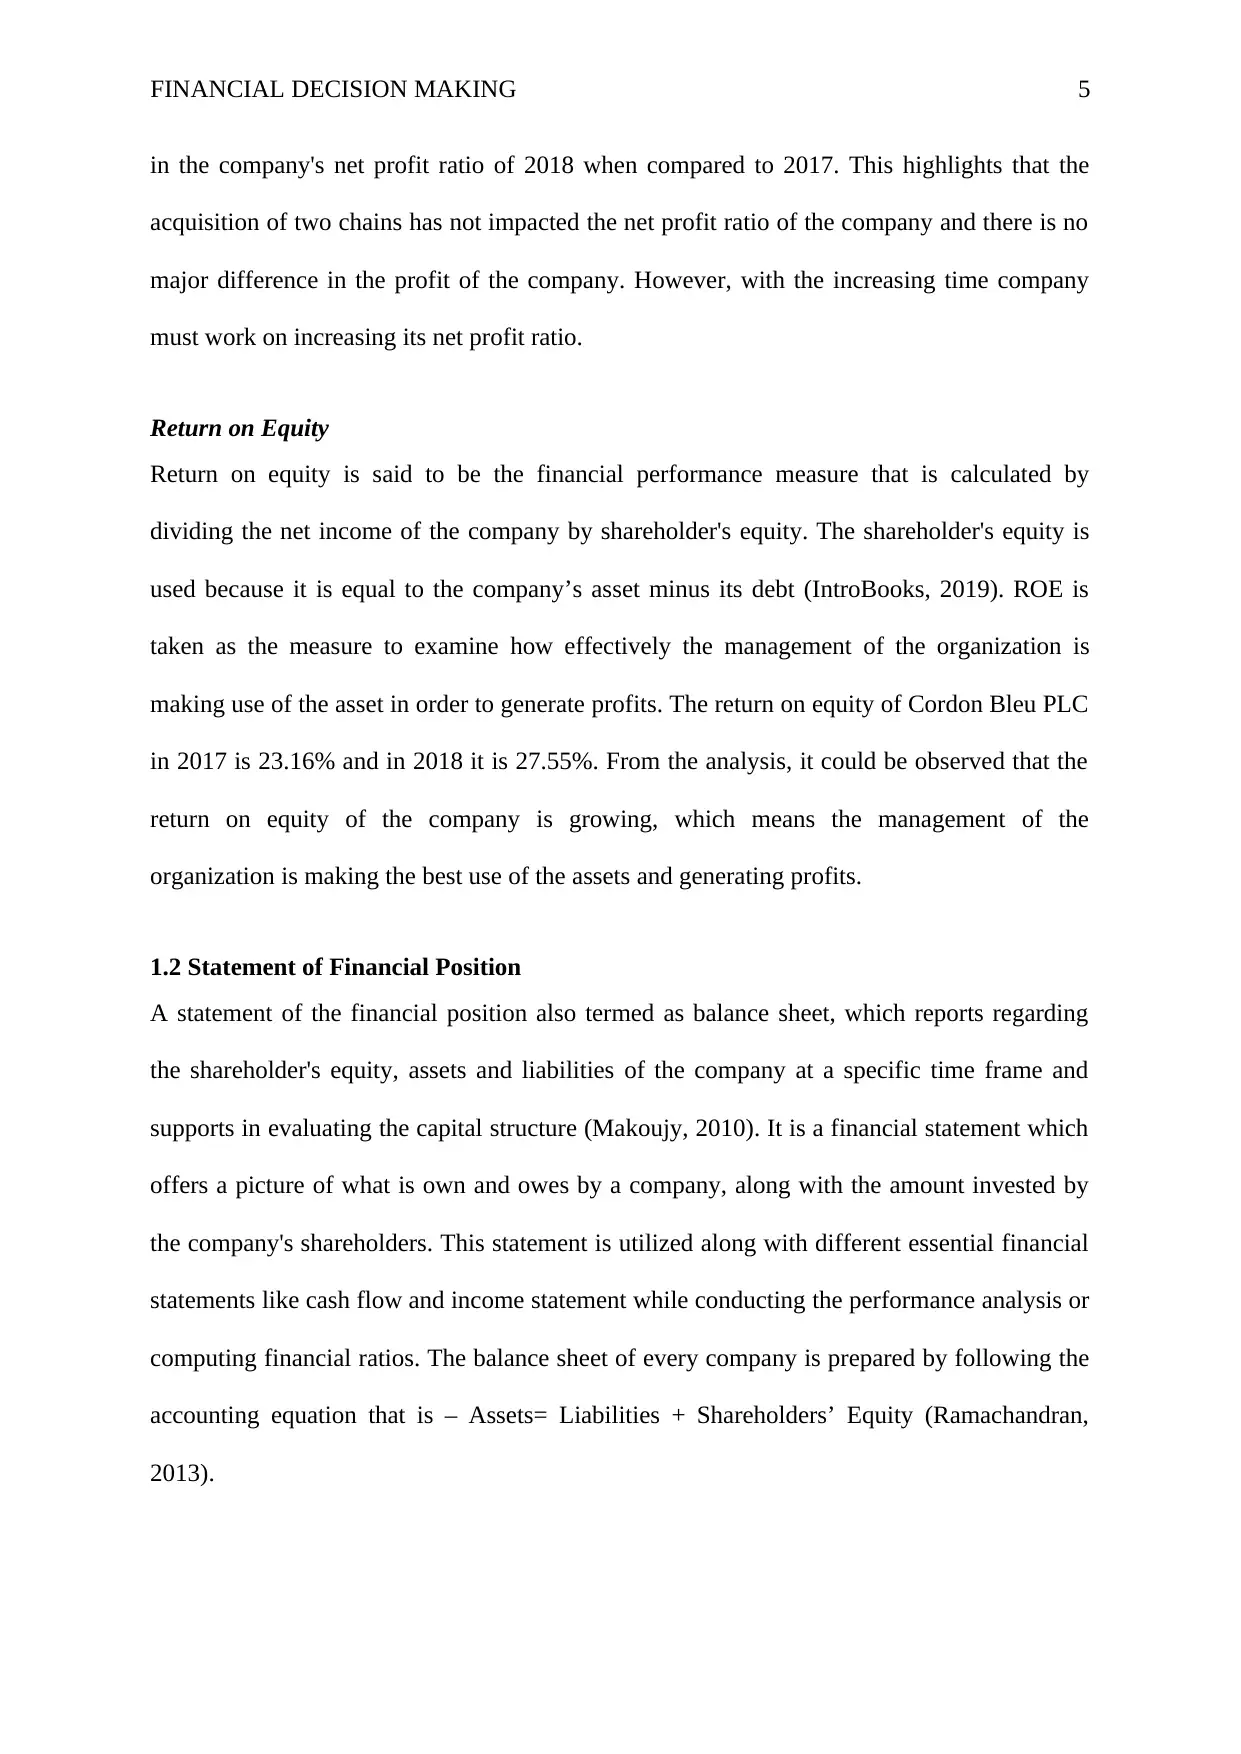
in the company's net profit ratio of 2018 when compared to 2017. This highlights that the
acquisition of two chains has not impacted the net profit ratio of the company and there is no
major difference in the profit of the company. However, with the increasing time company
must work on increasing its net profit ratio.
Return on Equity
Return on equity is said to be the financial performance measure that is calculated by
dividing the net income of the company by shareholder's equity. The shareholder's equity is
used because it is equal to the company’s asset minus its debt (IntroBooks, 2019). ROE is
taken as the measure to examine how effectively the management of the organization is
making use of the asset in order to generate profits. The return on equity of Cordon Bleu PLC
in 2017 is 23.16% and in 2018 it is 27.55%. From the analysis, it could be observed that the
return on equity of the company is growing, which means the management of the
organization is making the best use of the assets and generating profits.
1.2 Statement of Financial Position
A statement of the financial position also termed as balance sheet, which reports regarding
the shareholder's equity, assets and liabilities of the company at a specific time frame and
supports in evaluating the capital structure (Makoujy, 2010). It is a financial statement which
offers a picture of what is own and owes by a company, along with the amount invested by
the company's shareholders. This statement is utilized along with different essential financial
statements like cash flow and income statement while conducting the performance analysis or
computing financial ratios. The balance sheet of every company is prepared by following the
accounting equation that is – Assets= Liabilities + Shareholders’ Equity (Ramachandran,
2013).
⊘ This is a preview!⊘
Do you want full access?
Subscribe today to unlock all pages.
Trusted by 1+ million students worldwide
FINANCIAL DECISION MAKING 6
With the help of balance sheet, this report has calculated some of the key ratios such as
solvency ratio, liquidity ratio, and efficiency ratio.
Liquidity ratio
Liquidity ratios are an essential portion of the financial metrics utilized to define the ability of
the debtor to pay its current debt deprived of any external capital investment. Liquidity ratios
assess the aptitude of the company to pay its debt duties and its margin of safety by the
calculation of metrics comprising current ratio and quick ratio (Were and Wambua, 2014).
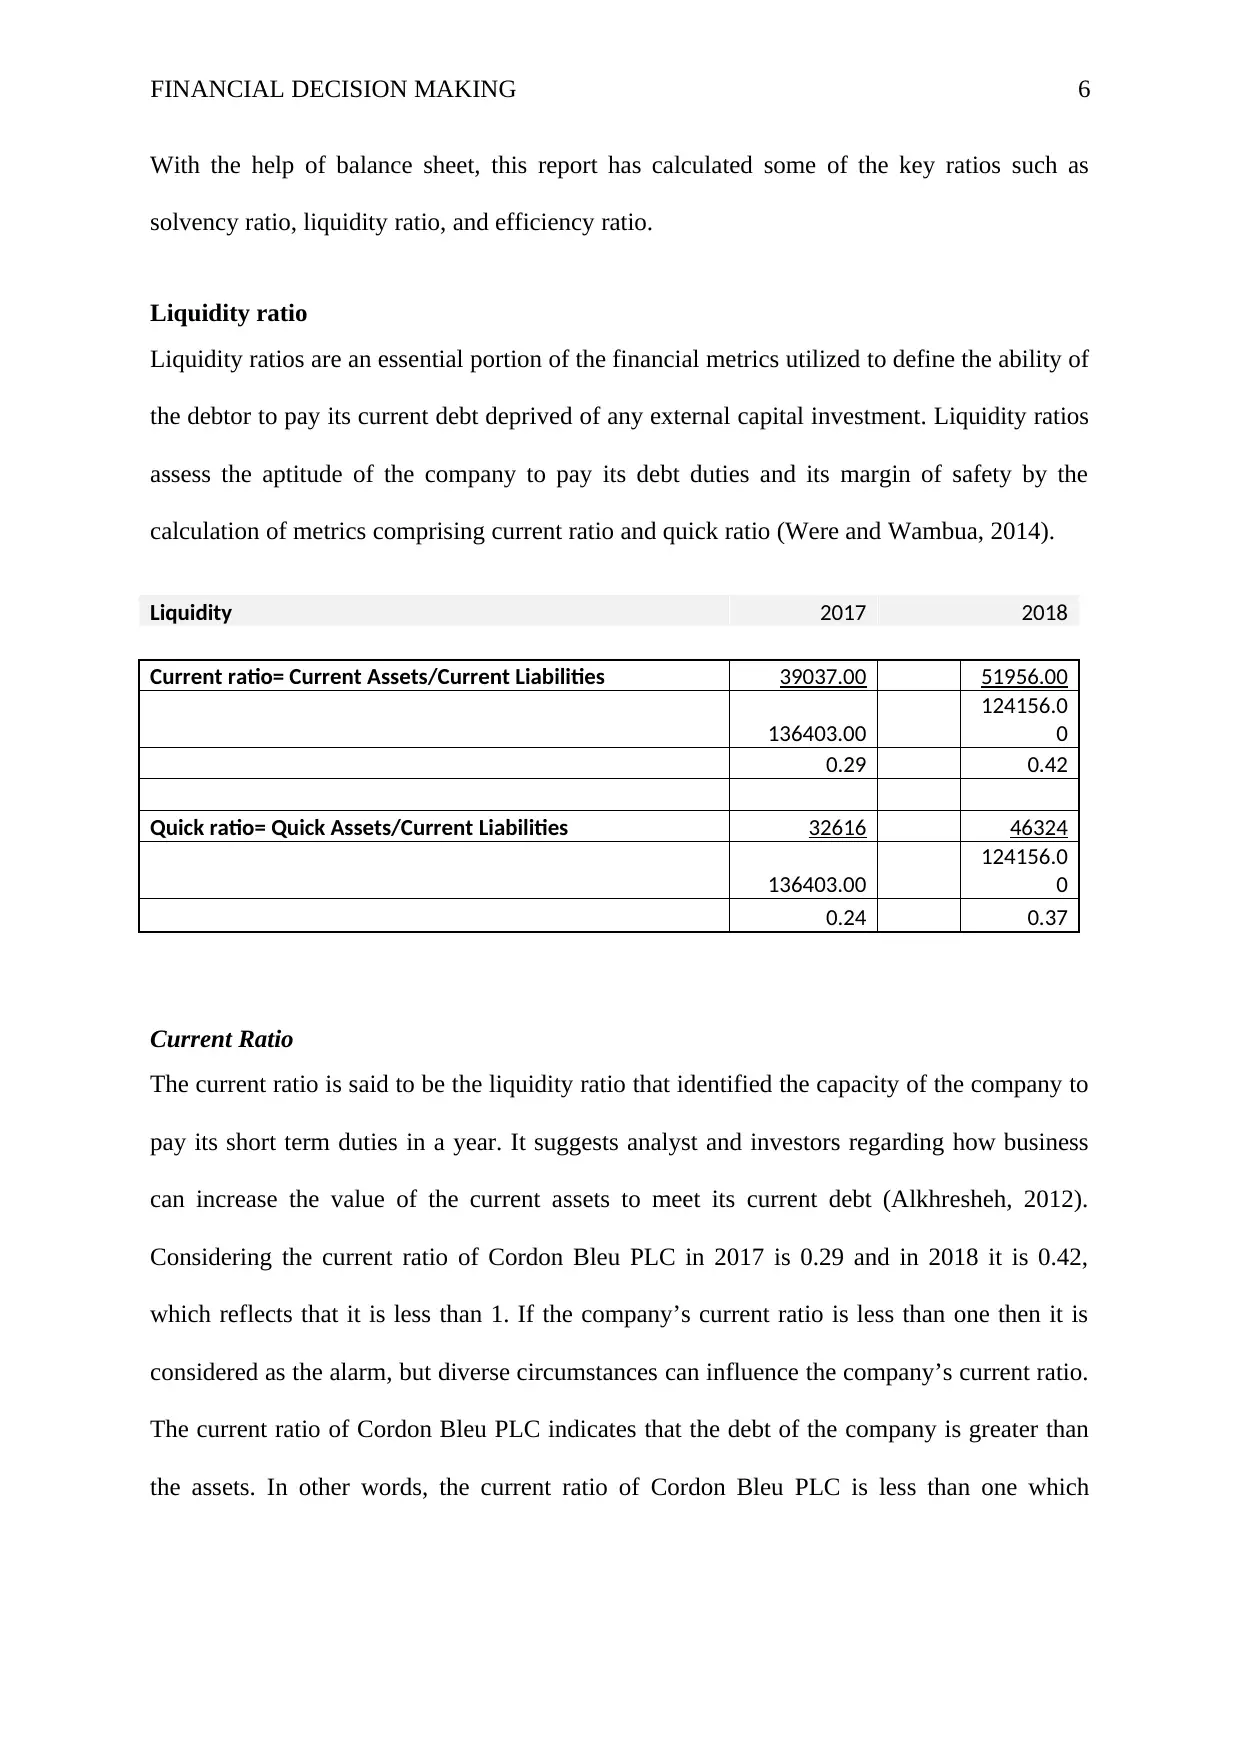
Liquidity 2017 2018
Current ratio= Current Assets/Current Liabilities 39037.00 51956.00
136403.00
124156.0
0
0.29 0.42
Quick ratio= Quick Assets/Current Liabilities 32616 46324
136403.00
124156.0
0
0.24 0.37
Current Ratio
The current ratio is said to be the liquidity ratio that identified the capacity of the company to
pay its short term duties in a year. It suggests analyst and investors regarding how business
can increase the value of the current assets to meet its current debt (Alkhresheh, 2012).
Considering the current ratio of Cordon Bleu PLC in 2017 is 0.29 and in 2018 it is 0.42,
which reflects that it is less than 1. If the company’s current ratio is less than one then it is
considered as the alarm, but diverse circumstances can influence the company’s current ratio.
The current ratio of Cordon Bleu PLC indicates that the debt of the company is greater than
the assets. In other words, the current ratio of Cordon Bleu PLC is less than one which
With the help of balance sheet, this report has calculated some of the key ratios such as
solvency ratio, liquidity ratio, and efficiency ratio.
Liquidity ratio
Liquidity ratios are an essential portion of the financial metrics utilized to define the ability of
the debtor to pay its current debt deprived of any external capital investment. Liquidity ratios
assess the aptitude of the company to pay its debt duties and its margin of safety by the
calculation of metrics comprising current ratio and quick ratio (Were and Wambua, 2014).
Liquidity 2017 2018
Current ratio= Current Assets/Current Liabilities 39037.00 51956.00
136403.00
124156.0
0
0.29 0.42
Quick ratio= Quick Assets/Current Liabilities 32616 46324
136403.00
124156.0
0
0.24 0.37
Current Ratio
The current ratio is said to be the liquidity ratio that identified the capacity of the company to
pay its short term duties in a year. It suggests analyst and investors regarding how business
can increase the value of the current assets to meet its current debt (Alkhresheh, 2012).
Considering the current ratio of Cordon Bleu PLC in 2017 is 0.29 and in 2018 it is 0.42,
which reflects that it is less than 1. If the company’s current ratio is less than one then it is
considered as the alarm, but diverse circumstances can influence the company’s current ratio.
The current ratio of Cordon Bleu PLC indicates that the debt of the company is greater than
the assets. In other words, the current ratio of Cordon Bleu PLC is less than one which
Paraphrase This Document
Need a fresh take? Get an instant paraphrase of this document with our AI Paraphraser
FINANCIAL DECISION MAKING 7
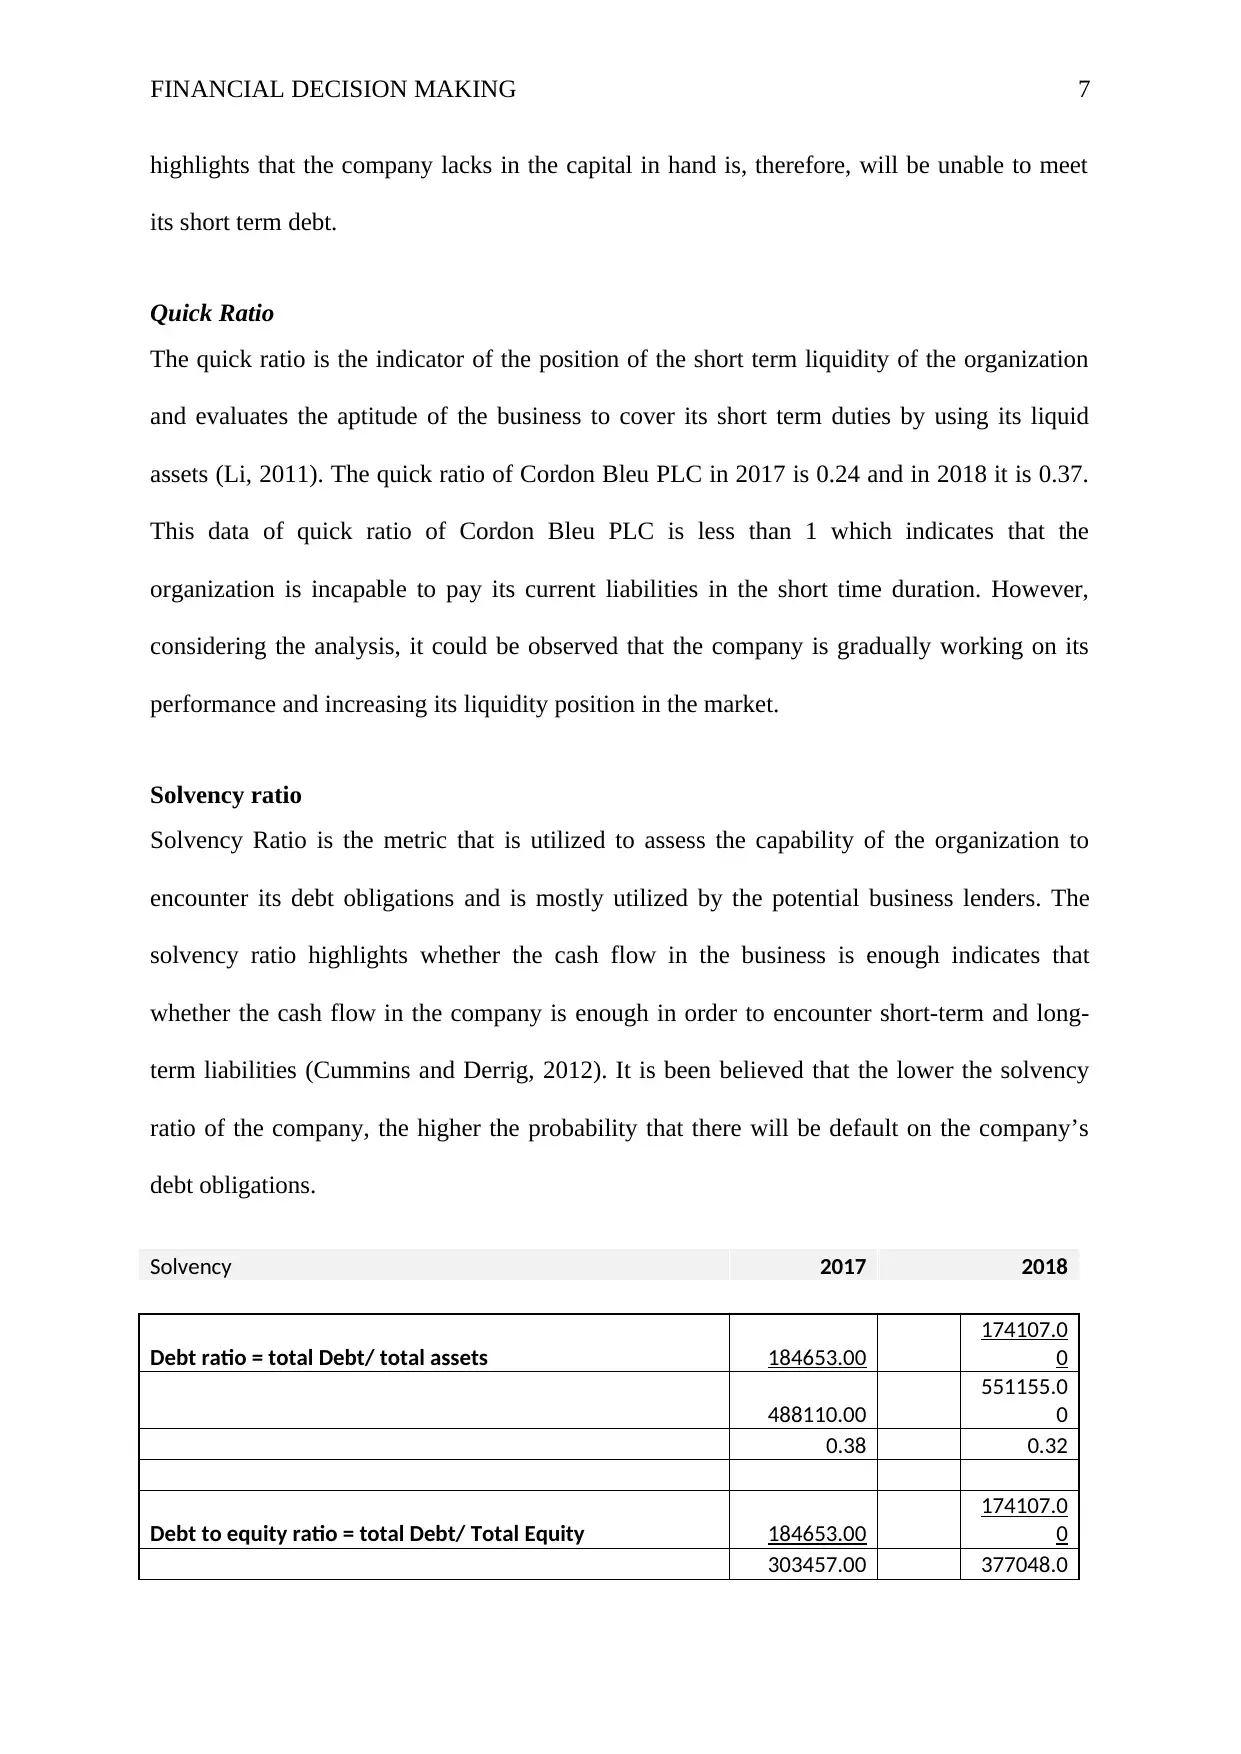
highlights that the company lacks in the capital in hand is, therefore, will be unable to meet
its short term debt.
Quick Ratio
The quick ratio is the indicator of the position of the short term liquidity of the organization
and evaluates the aptitude of the business to cover its short term duties by using its liquid
assets (Li, 2011). The quick ratio of Cordon Bleu PLC in 2017 is 0.24 and in 2018 it is 0.37.
This data of quick ratio of Cordon Bleu PLC is less than 1 which indicates that the
organization is incapable to pay its current liabilities in the short time duration. However,
considering the analysis, it could be observed that the company is gradually working on its
performance and increasing its liquidity position in the market.
Solvency ratio
Solvency Ratio is the metric that is utilized to assess the capability of the organization to
encounter its debt obligations and is mostly utilized by the potential business lenders. The
solvency ratio highlights whether the cash flow in the business is enough indicates that
whether the cash flow in the company is enough in order to encounter short-term and long-
term liabilities (Cummins and Derrig, 2012). It is been believed that the lower the solvency
ratio of the company, the higher the probability that there will be default on the company’s
debt obligations.
Solvency 2017 2018
Debt ratio = total Debt/ total assets 184653.00
174107.0
0
488110.00
551155.0
0
0.38 0.32
Debt to equity ratio = total Debt/ Total Equity 184653.00
174107.0
0
303457.00 377048.0
FINANCIAL DECISION MAKING 8
0
0.61 0.46
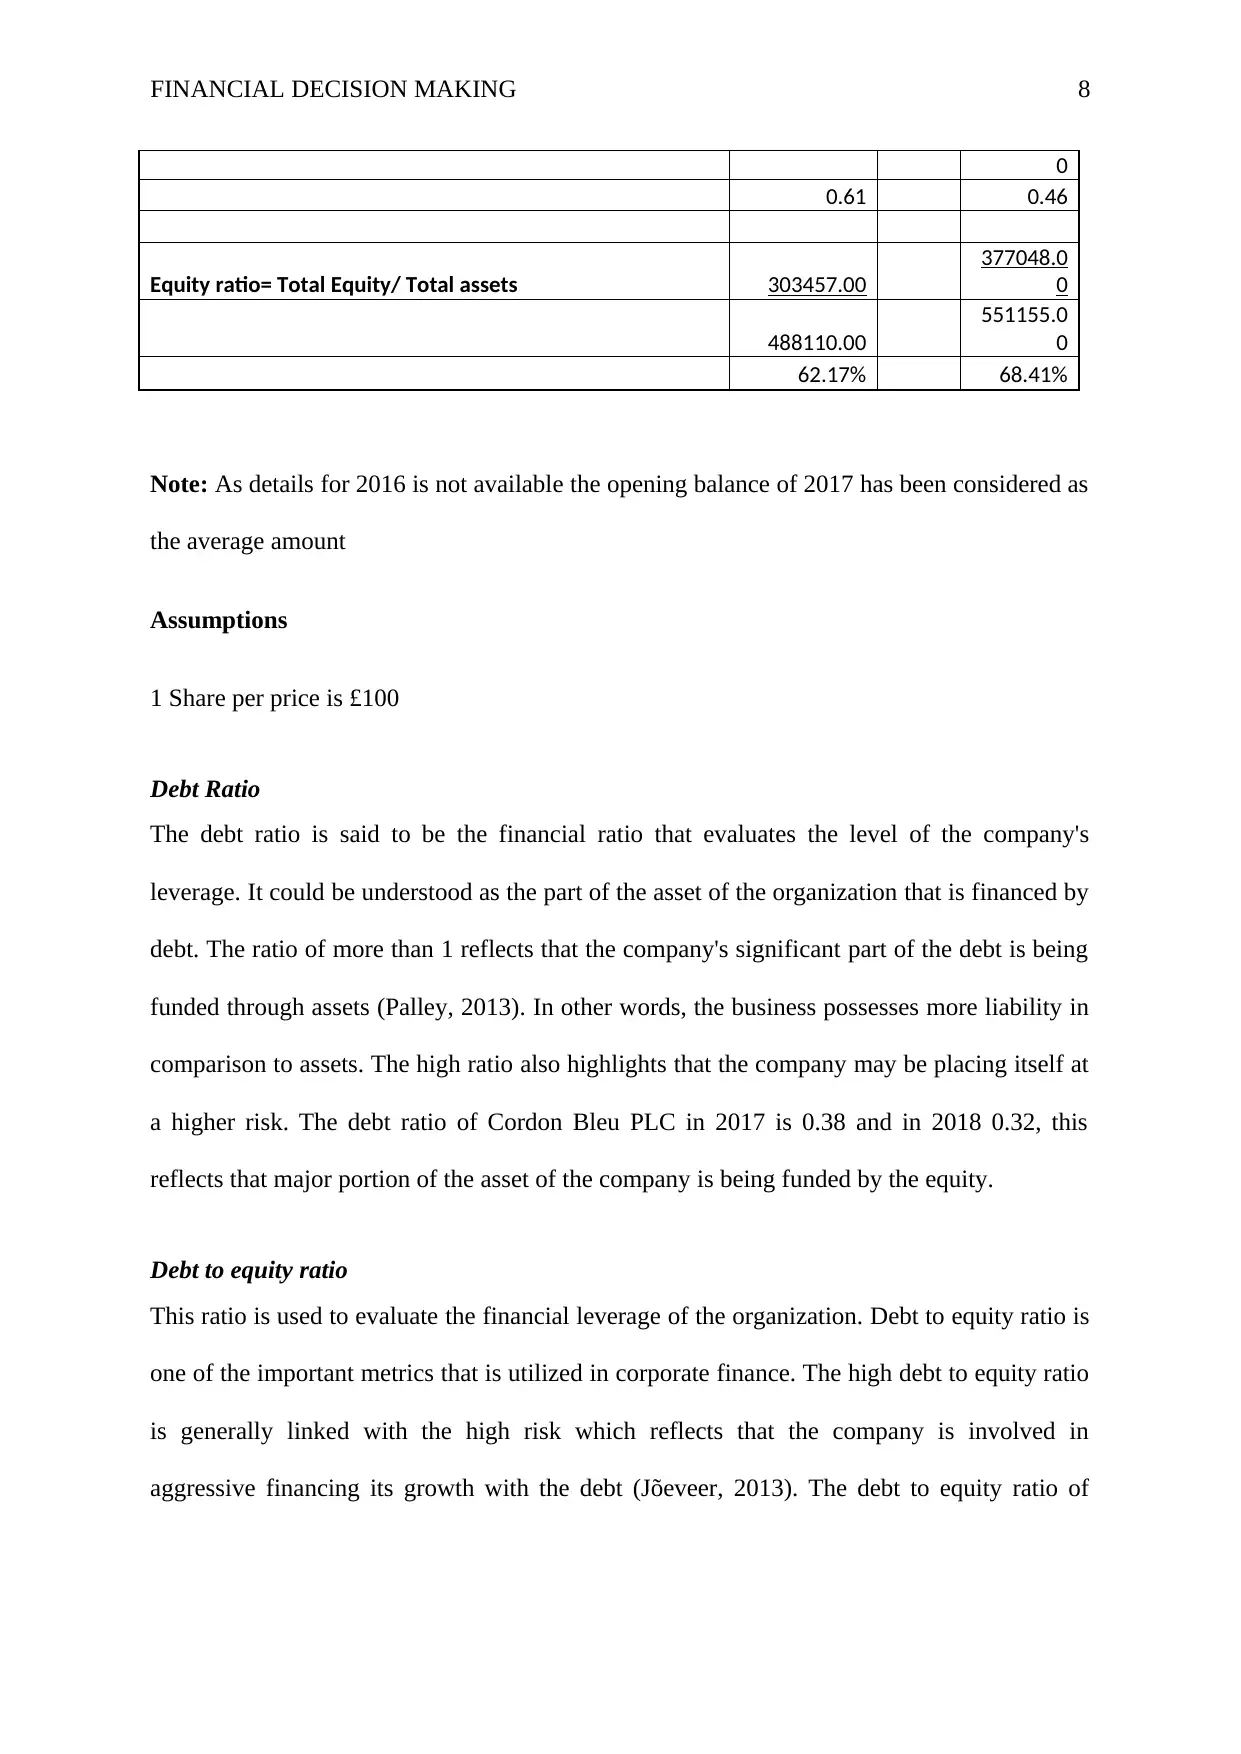
Equity ratio= Total Equity/ Total assets 303457.00
377048.0
0
488110.00
551155.0
0
62.17% 68.41%
Note: As details for 2016 is not available the opening balance of 2017 has been considered as
the average amount
Assumptions
1 Share per price is £100
Debt Ratio
The debt ratio is said to be the financial ratio that evaluates the level of the company's
leverage. It could be understood as the part of the asset of the organization that is financed by
debt. The ratio of more than 1 reflects that the company's significant part of the debt is being
funded through assets (Palley, 2013). In other words, the business possesses more liability in
comparison to assets. The high ratio also highlights that the company may be placing itself at
a higher risk. The debt ratio of Cordon Bleu PLC in 2017 is 0.38 and in 2018 0.32, this
reflects that major portion of the asset of the company is being funded by the equity.
Debt to equity ratio
This ratio is used to evaluate the financial leverage of the organization. Debt to equity ratio is
one of the important metrics that is utilized in corporate finance. The high debt to equity ratio
is generally linked with the high risk which reflects that the company is involved in
aggressive financing its growth with the debt (Jõeveer, 2013). The debt to equity ratio of
0
0.61 0.46
Equity ratio= Total Equity/ Total assets 303457.00
377048.0
0
488110.00
551155.0
0
62.17% 68.41%
Note: As details for 2016 is not available the opening balance of 2017 has been considered as
the average amount
Assumptions
1 Share per price is £100
Debt Ratio
The debt ratio is said to be the financial ratio that evaluates the level of the company's
leverage. It could be understood as the part of the asset of the organization that is financed by
debt. The ratio of more than 1 reflects that the company's significant part of the debt is being
funded through assets (Palley, 2013). In other words, the business possesses more liability in
comparison to assets. The high ratio also highlights that the company may be placing itself at
a higher risk. The debt ratio of Cordon Bleu PLC in 2017 is 0.38 and in 2018 0.32, this
reflects that major portion of the asset of the company is being funded by the equity.
Debt to equity ratio
This ratio is used to evaluate the financial leverage of the organization. Debt to equity ratio is
one of the important metrics that is utilized in corporate finance. The high debt to equity ratio
is generally linked with the high risk which reflects that the company is involved in
aggressive financing its growth with the debt (Jõeveer, 2013). The debt to equity ratio of
⊘ This is a preview!⊘
Do you want full access?
Subscribe today to unlock all pages.
Trusted by 1+ million students worldwide
FINANCIAL DECISION MAKING 9
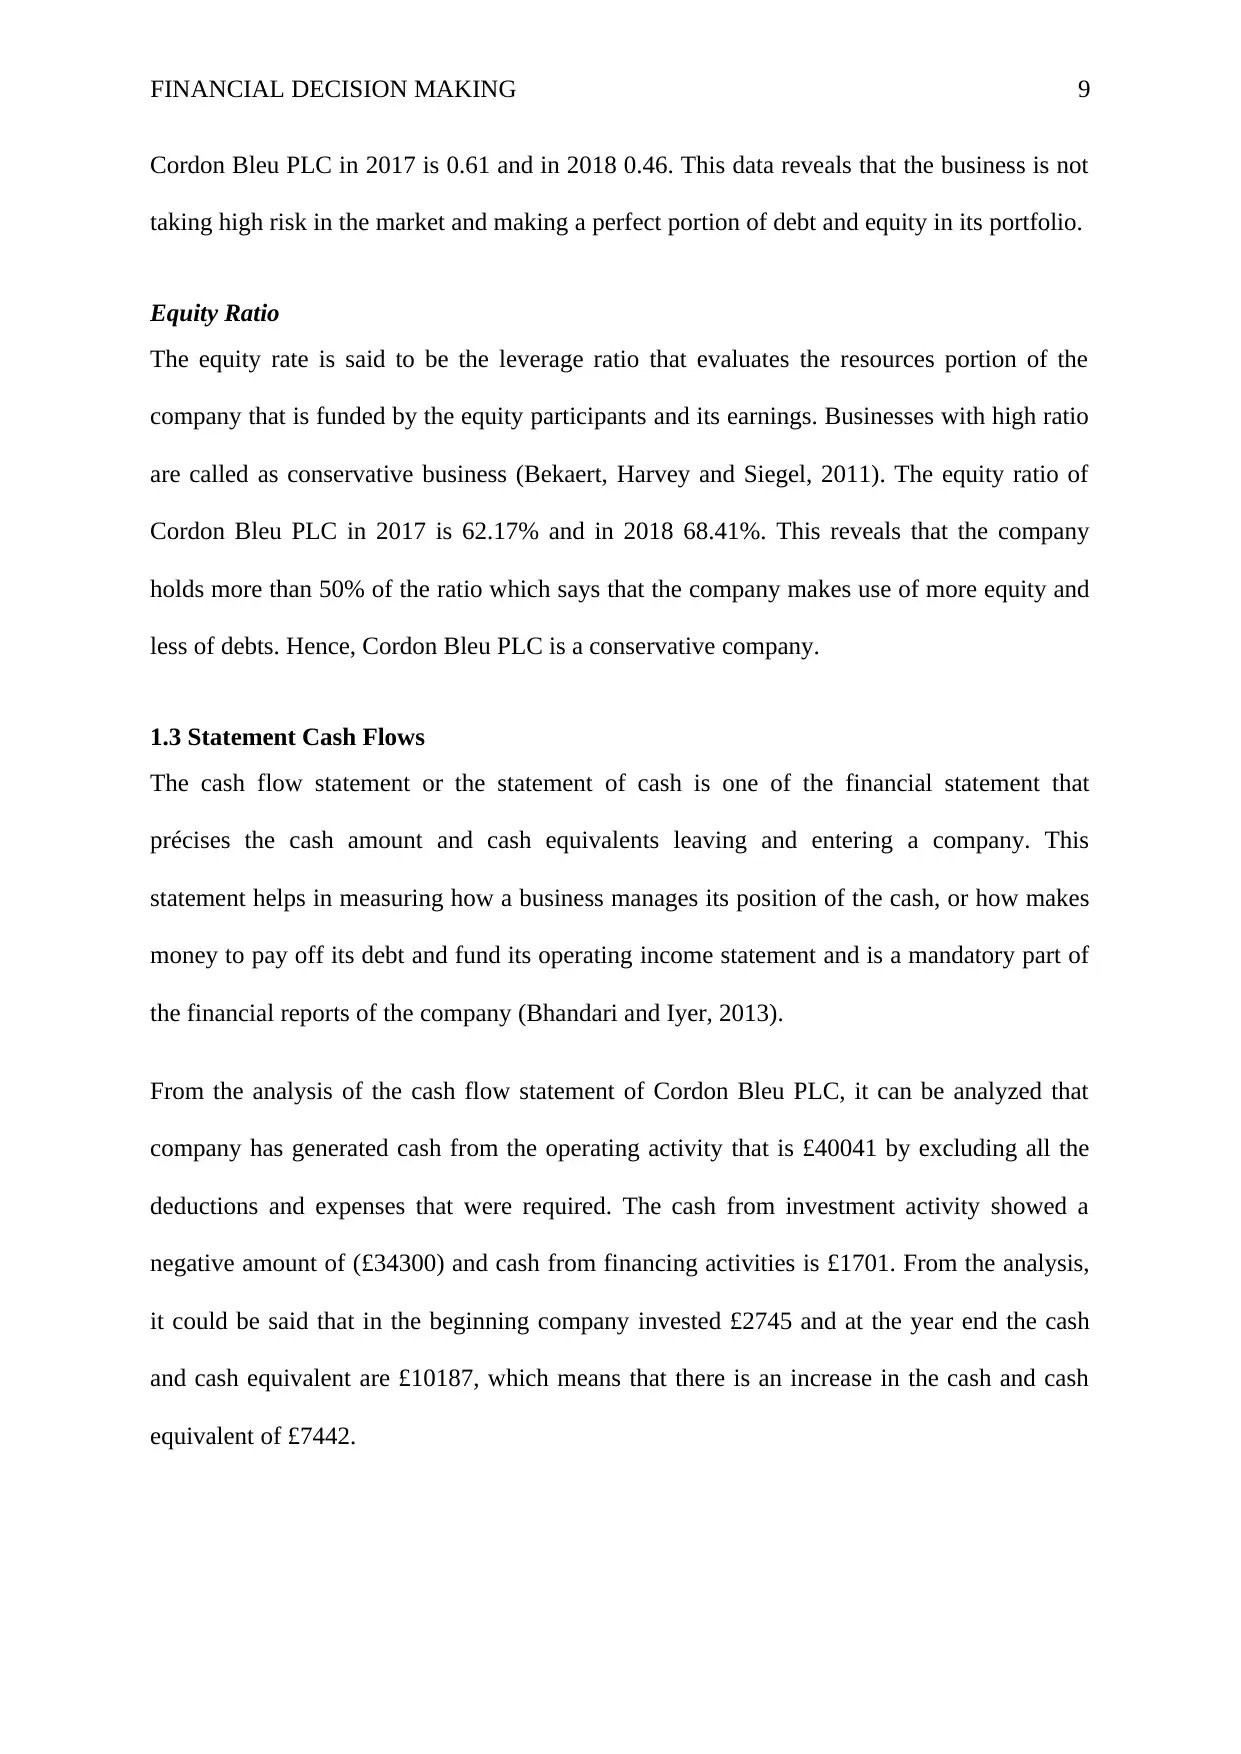
Cordon Bleu PLC in 2017 is 0.61 and in 2018 0.46. This data reveals that the business is not
taking high risk in the market and making a perfect portion of debt and equity in its portfolio.
Equity Ratio
The equity rate is said to be the leverage ratio that evaluates the resources portion of the
company that is funded by the equity participants and its earnings. Businesses with high ratio
are called as conservative business (Bekaert, Harvey and Siegel, 2011). The equity ratio of
Cordon Bleu PLC in 2017 is 62.17% and in 2018 68.41%. This reveals that the company
holds more than 50% of the ratio which says that the company makes use of more equity and
less of debts. Hence, Cordon Bleu PLC is a conservative company.
1.3 Statement Cash Flows
The cash flow statement or the statement of cash is one of the financial statement that
précises the cash amount and cash equivalents leaving and entering a company. This
statement helps in measuring how a business manages its position of the cash, or how makes
money to pay off its debt and fund its operating income statement and is a mandatory part of
the financial reports of the company (Bhandari and Iyer, 2013).
From the analysis of the cash flow statement of Cordon Bleu PLC, it can be analyzed that
company has generated cash from the operating activity that is £40041 by excluding all the
deductions and expenses that were required. The cash from investment activity showed a
negative amount of (£34300) and cash from financing activities is £1701. From the analysis,
it could be said that in the beginning company invested £2745 and at the year end the cash
and cash equivalent are £10187, which means that there is an increase in the cash and cash
equivalent of £7442.
Paraphrase This Document
Need a fresh take? Get an instant paraphrase of this document with our AI Paraphraser
FINANCIAL DECISION MAKING 10
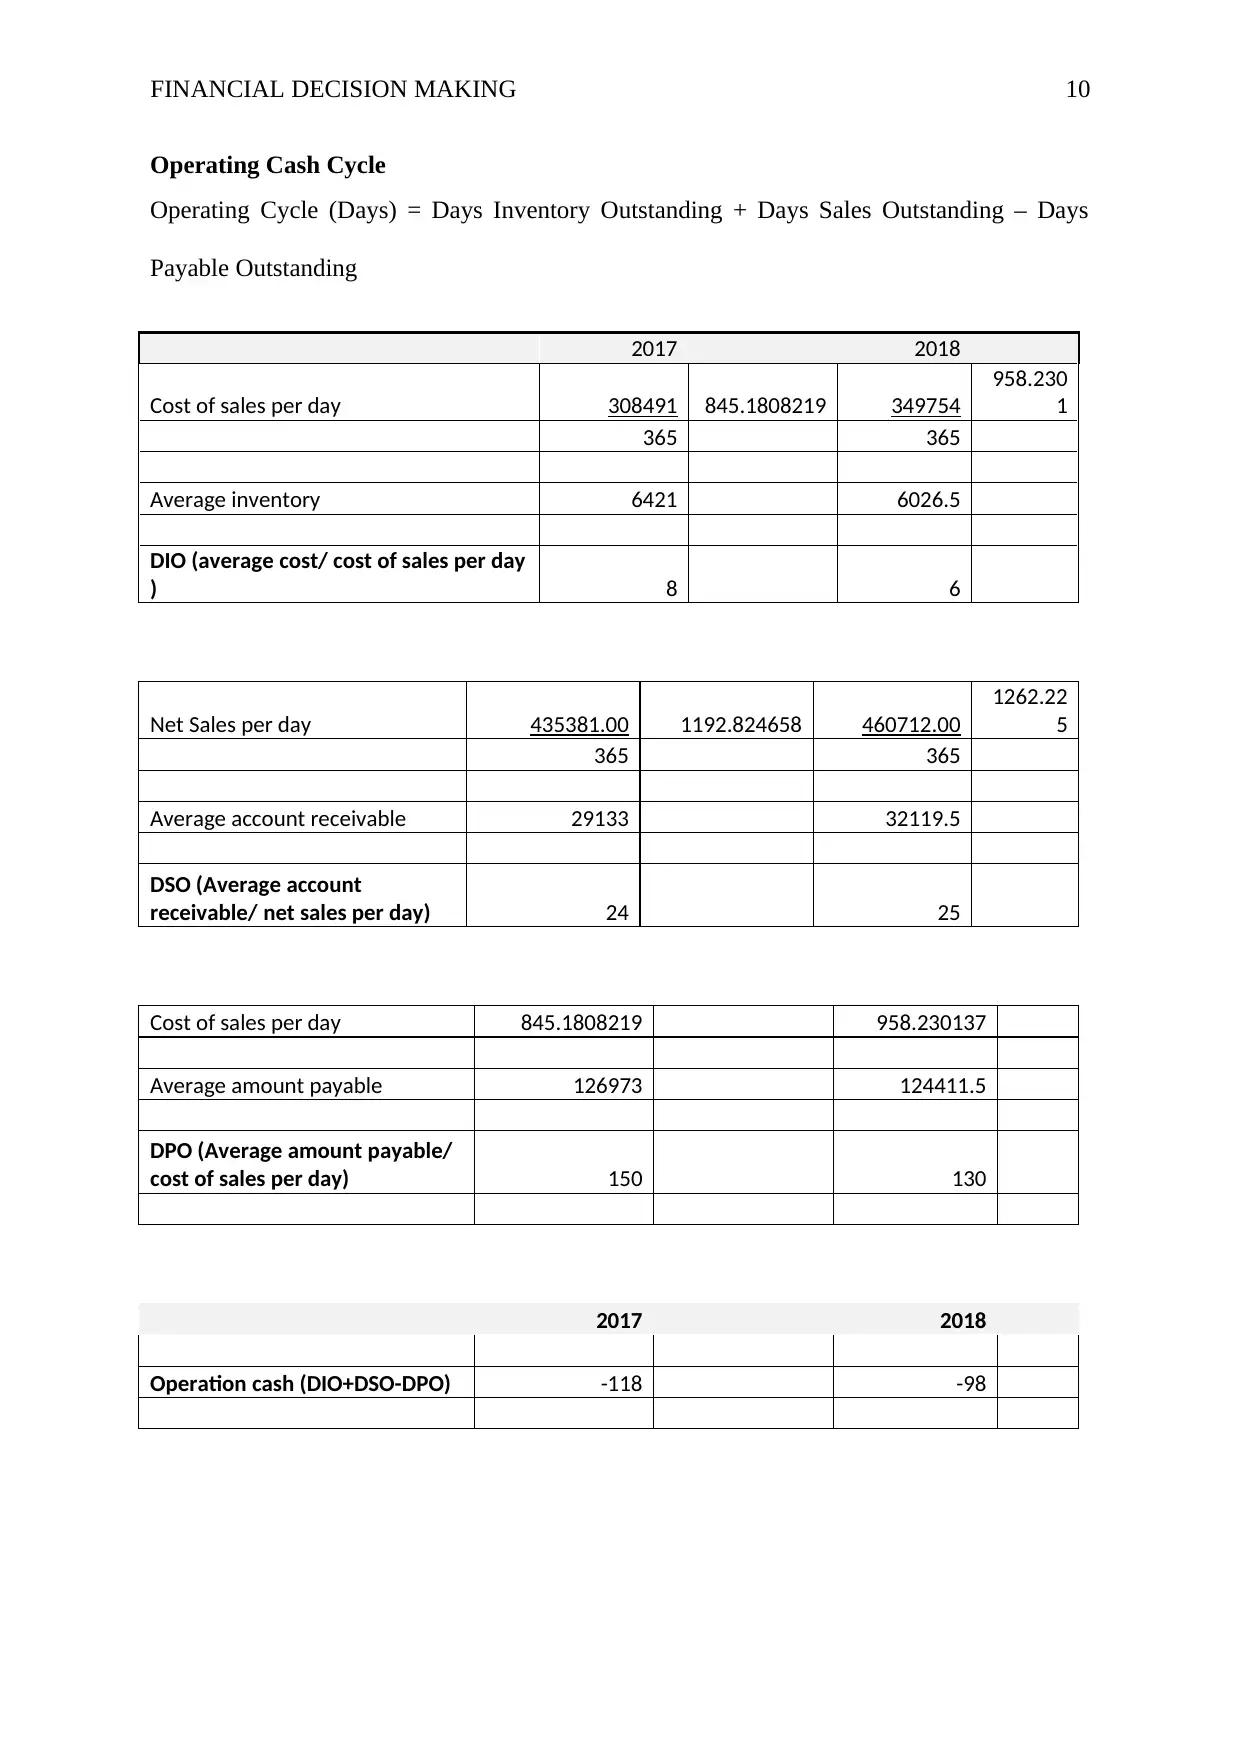
Operating Cash Cycle
Operating Cycle (Days) = Days Inventory Outstanding + Days Sales Outstanding – Days
Payable Outstanding
2017 2018
Cost of sales per day 308491 845.1808219 349754
958.230
1
365 365
Average inventory 6421 6026.5
DIO (average cost/ cost of sales per day
) 8 6
Net Sales per day 435381.00 1192.824658 460712.00
1262.22
5
365 365
Average account receivable 29133 32119.5
DSO (Average account
receivable/ net sales per day) 24 25
Cost of sales per day 845.1808219 958.230137
Average amount payable 126973 124411.5
DPO (Average amount payable/
cost of sales per day) 150 130
2017 2018
Operation cash (DIO+DSO-DPO) -118 -98
FINANCIAL DECISION MAKING 11
The negative operating cash cycle highlights that company is borrowing money from the
creditors but not paying back. Besides this, this money is being used for different small
expenses and for maintaining the cash in hand.
Dividend
From the report of the Chairman of the company, it has been analyzed that company was
involved in the acquisition of two premium restaurants during 2017 and 2018 and for this, the
company has announced major investment for the redesigning the restaurants. Besides this,
the company also invested in providing training to the 1800 employees in the new value
chain. The strategy of the company is to invest more in their kitchens for productivity. The
company has declared that it will pay 17.7 per share as the dividend despite the challenges it
is dealing with. According to the analysis, it could be said that announcing dividend on
increased amount can result in increasing challenges for the company because presently it is
not even able to pay off its short term debts which can impact the business if the situations of
the business did not improve. In addition to this, the decision of acquiring two premium
restaurants has not reflected the complete positive results for the company, hence without
performing proper financial analysis of the company it will be irrelevant to offer a dividend.
1.4 Market Segment Analysis
Value segment – From the segmental analysis of Cordon Bleu Plc., it could be noticed that
the value segment of the company is growing with time. The revenue of this segment 2017
was £46520 and it increased to £53190, which is said to be a major change in this segment. In
addition to this, the cost of sales for the same segment has been increased. There is increase
in the gross profit of the business from 2017 to 2018. The positive reflection is that the
operating profit of the company in 2017 was in negative that is (£2669) but it increased and
converted into a positive amount in 2018 to £2554. This highlights that value segment of the
⊘ This is a preview!⊘
Do you want full access?
Subscribe today to unlock all pages.
Trusted by 1+ million students worldwide
1 out of 21
Related Documents


Your All-in-One AI-Powered Toolkit for Academic Success.
+13062052269
info@desklib.com
Available 24*7 on WhatsApp / Email
![[object Object]](/_next/static/media/star-bottom.7253800d.svg)
Unlock your academic potential
Copyright © 2020–2026 A2Z Services. All Rights Reserved. Developed and managed by ZUCOL.