Financial Decision Making Report: Starbucks & Roast Ltd Analysis
VerifiedAdded on 2022/08/19
|20
|5377
|20
Report
AI Summary
This report, prepared for a Financial Decision Making assignment, provides a comprehensive analysis of Roast Ltd. The report begins with an industry review of the UK coffee house market, highlighting its growth and key players. A detailed business performance analysis follows, evaluating Roast Ltd's profitability, liquidity, solvency, and efficiency through various financial ratios. The analysis reveals insights into the company's financial health and operational efficiency. The report then delves into investment appraisal, examining management forecasts and recommending suitable investment appraisal techniques like NPV. Finally, it explores potential financing sources, such as issuing bonds. The analysis suggests that Starbucks should consider acquiring Roast Ltd based on the company's potential for growth and financial improvement.
Running Head: FINANCIAL DECISION MAKING
FINANCIAL DECISION MAKING
Name of the Student
Name of the University
Author Note
FINANCIAL DECISION MAKING
Name of the Student
Name of the University
Author Note
Paraphrase This Document
Need a fresh take? Get an instant paraphrase of this document with our AI Paraphraser
1FINANCIAL DECISION MAKING
Table of Contents
Executive Summary...................................................................................................................2
Part 1: Industry Review..............................................................................................................2
Part 2: Business Performance Analysis......................................................................................4
Statement of Profit or Loss....................................................................................................4
Statement of Financial Position.............................................................................................6
Statement of Cash Flows........................................................................................................9
Part 3: Investment Appraisal....................................................................................................11
3.1.a Management Forecast..................................................................................................11
3.1.b Investment Appraisal Techniques...............................................................................12
3.2 Finance Sources.............................................................................................................14
Reference..................................................................................................................................16
2FINANCIAL DECISION MAKING
Executive Summary
Financial decision is the process, which is responsible for decisions that is related
with company’s shareholders’ equity and liabilities and issuance of bonds. Good decisions of
financial planning extend well-beyond how and where to invest. The ability of spending more
than one could otherwise indicates that assets are generating higher return that results in good
decision-making that makes high spending possible.
This report finds that the coffee house industry of UK indicates better growth of
industry in next five years. Secondly, the business performance of Roast Ltd. indicates that it
is at its expansion stage, but still company is doing well. The profitability condition of
company indicates that it has been improved in comparison to last year, the liquidity position
indicates that it is having the ability for paying short-term liabilities, solvency position
indicates that it is using more debt in comparison to equity, efficiency position indicates that
it is utilizing its assets efficiently and lastly, operating cash cycle indicates that operating
efficiency of company has been reduced in generating cash. Lastly, it has been found that
management forecast proves to be wrong, NPV method proves to be good investment
appraisal technique for the company and issuing of bond can be good sources of financing
option for company. Therefore, it can be said that Starbucks should acquire Roast Ltd
because there are great chances that company will do better, after its expansion in different
market.
Part 1: Industry Review
The industry of Coffee house is consisting all the specialist unlicensed institutions,
which is focused on the selling coffee with the cold and hot drinks or light snacks. The
industry’s performance is determined by the both social and economic factors, consisting of
growth in the real disposable income of household, greater interest of the consumer in the
⊘ This is a preview!⊘
Do you want full access?
Subscribe today to unlock all pages.
Trusted by 1+ million students worldwide
3FINANCIAL DECISION MAKING
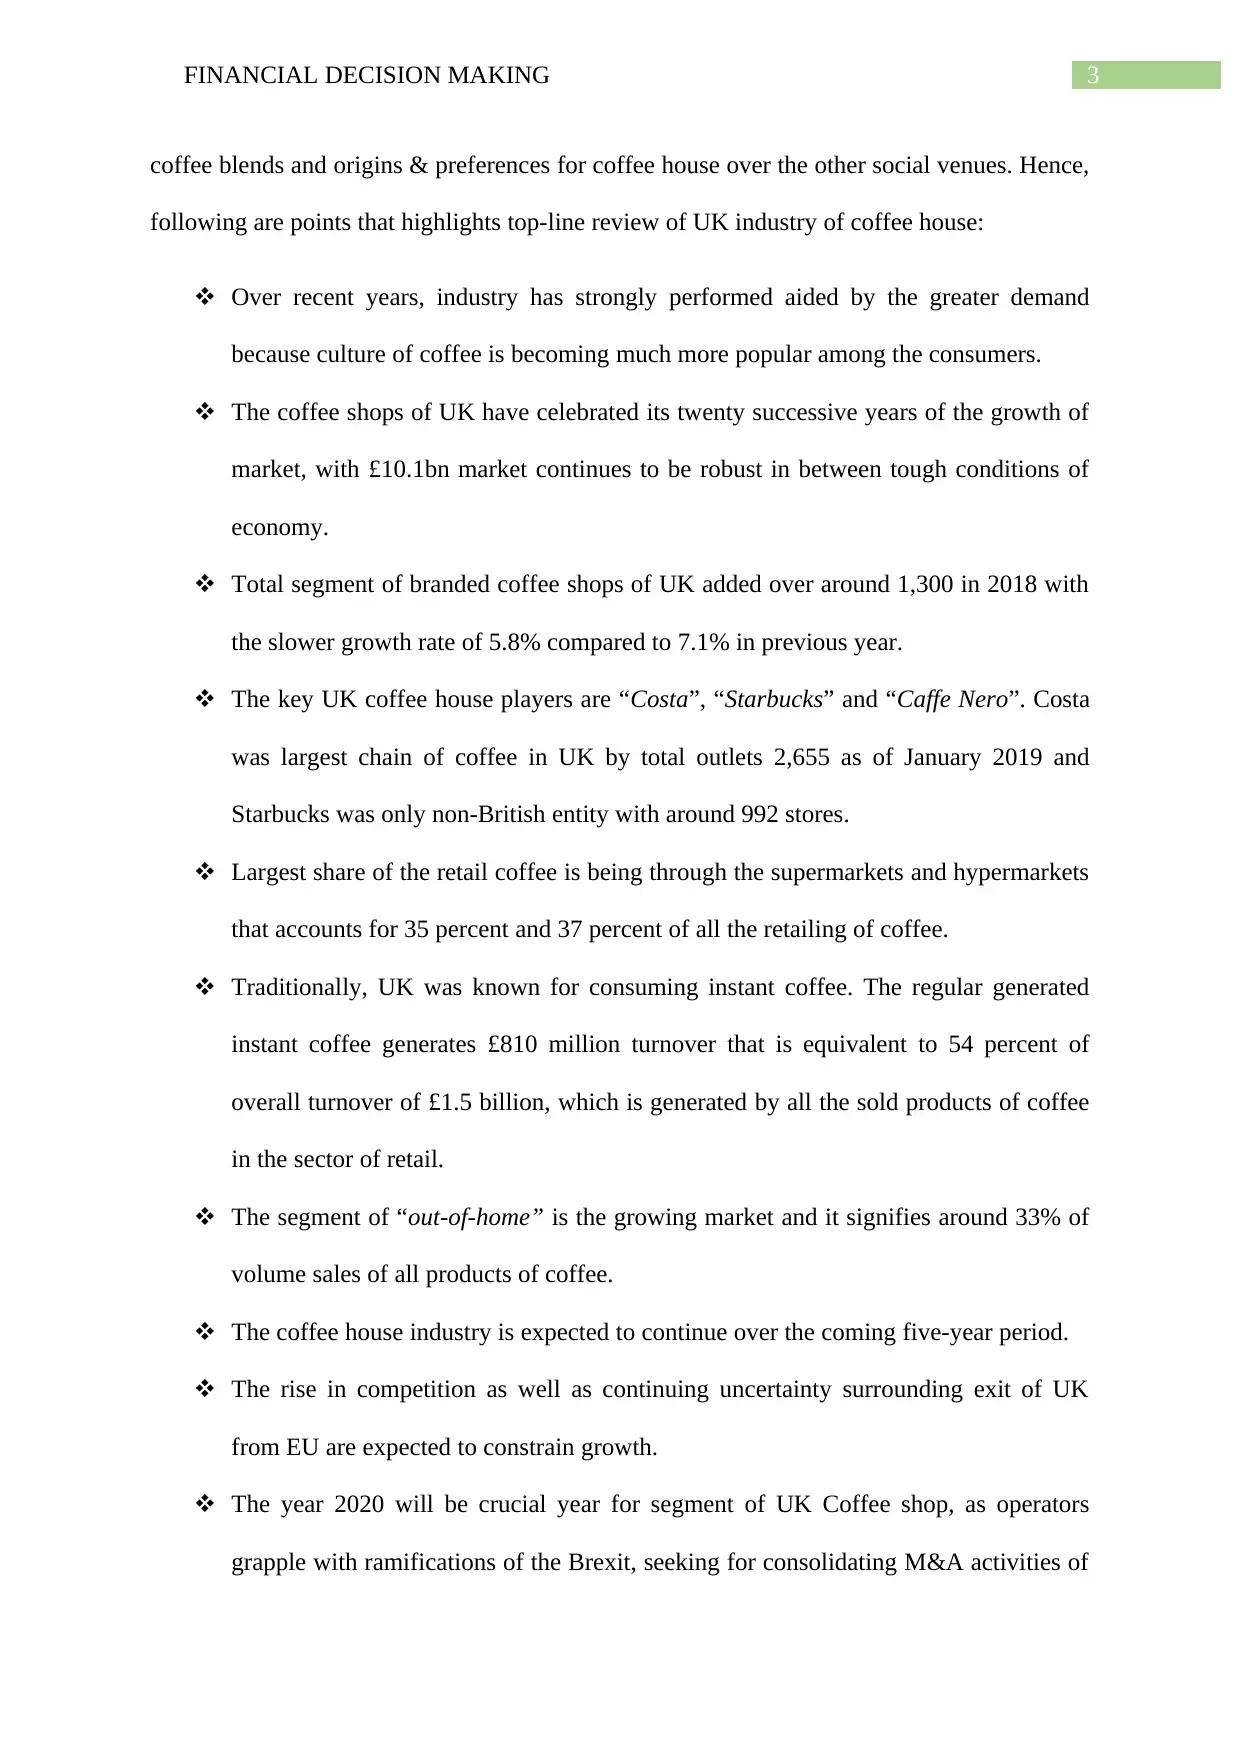
coffee blends and origins & preferences for coffee house over the other social venues. Hence,
following are points that highlights top-line review of UK industry of coffee house:
Over recent years, industry has strongly performed aided by the greater demand
because culture of coffee is becoming much more popular among the consumers.
The coffee shops of UK have celebrated its twenty successive years of the growth of
market, with £10.1bn market continues to be robust in between tough conditions of
economy.
Total segment of branded coffee shops of UK added over around 1,300 in 2018 with
the slower growth rate of 5.8% compared to 7.1% in previous year.
The key UK coffee house players are “Costa”, “Starbucks” and “Caffe Nero”. Costa
was largest chain of coffee in UK by total outlets 2,655 as of January 2019 and
Starbucks was only non-British entity with around 992 stores.
Largest share of the retail coffee is being through the supermarkets and hypermarkets
that accounts for 35 percent and 37 percent of all the retailing of coffee.
Traditionally, UK was known for consuming instant coffee. The regular generated
instant coffee generates £810 million turnover that is equivalent to 54 percent of
overall turnover of £1.5 billion, which is generated by all the sold products of coffee
in the sector of retail.
The segment of “out-of-home” is the growing market and it signifies around 33% of
volume sales of all products of coffee.
The coffee house industry is expected to continue over the coming five-year period.
The rise in competition as well as continuing uncertainty surrounding exit of UK
from EU are expected to constrain growth.
The year 2020 will be crucial year for segment of UK Coffee shop, as operators
grapple with ramifications of the Brexit, seeking for consolidating M&A activities of
Paraphrase This Document
Need a fresh take? Get an instant paraphrase of this document with our AI Paraphraser
4FINANCIAL DECISION MAKING
2019 and maintaining loyalty of customer in fiercely competitive market
(Worldcoffeeportal.com. 2020).
Part 2: Business Performance Analysis
Statement of Profit or Loss
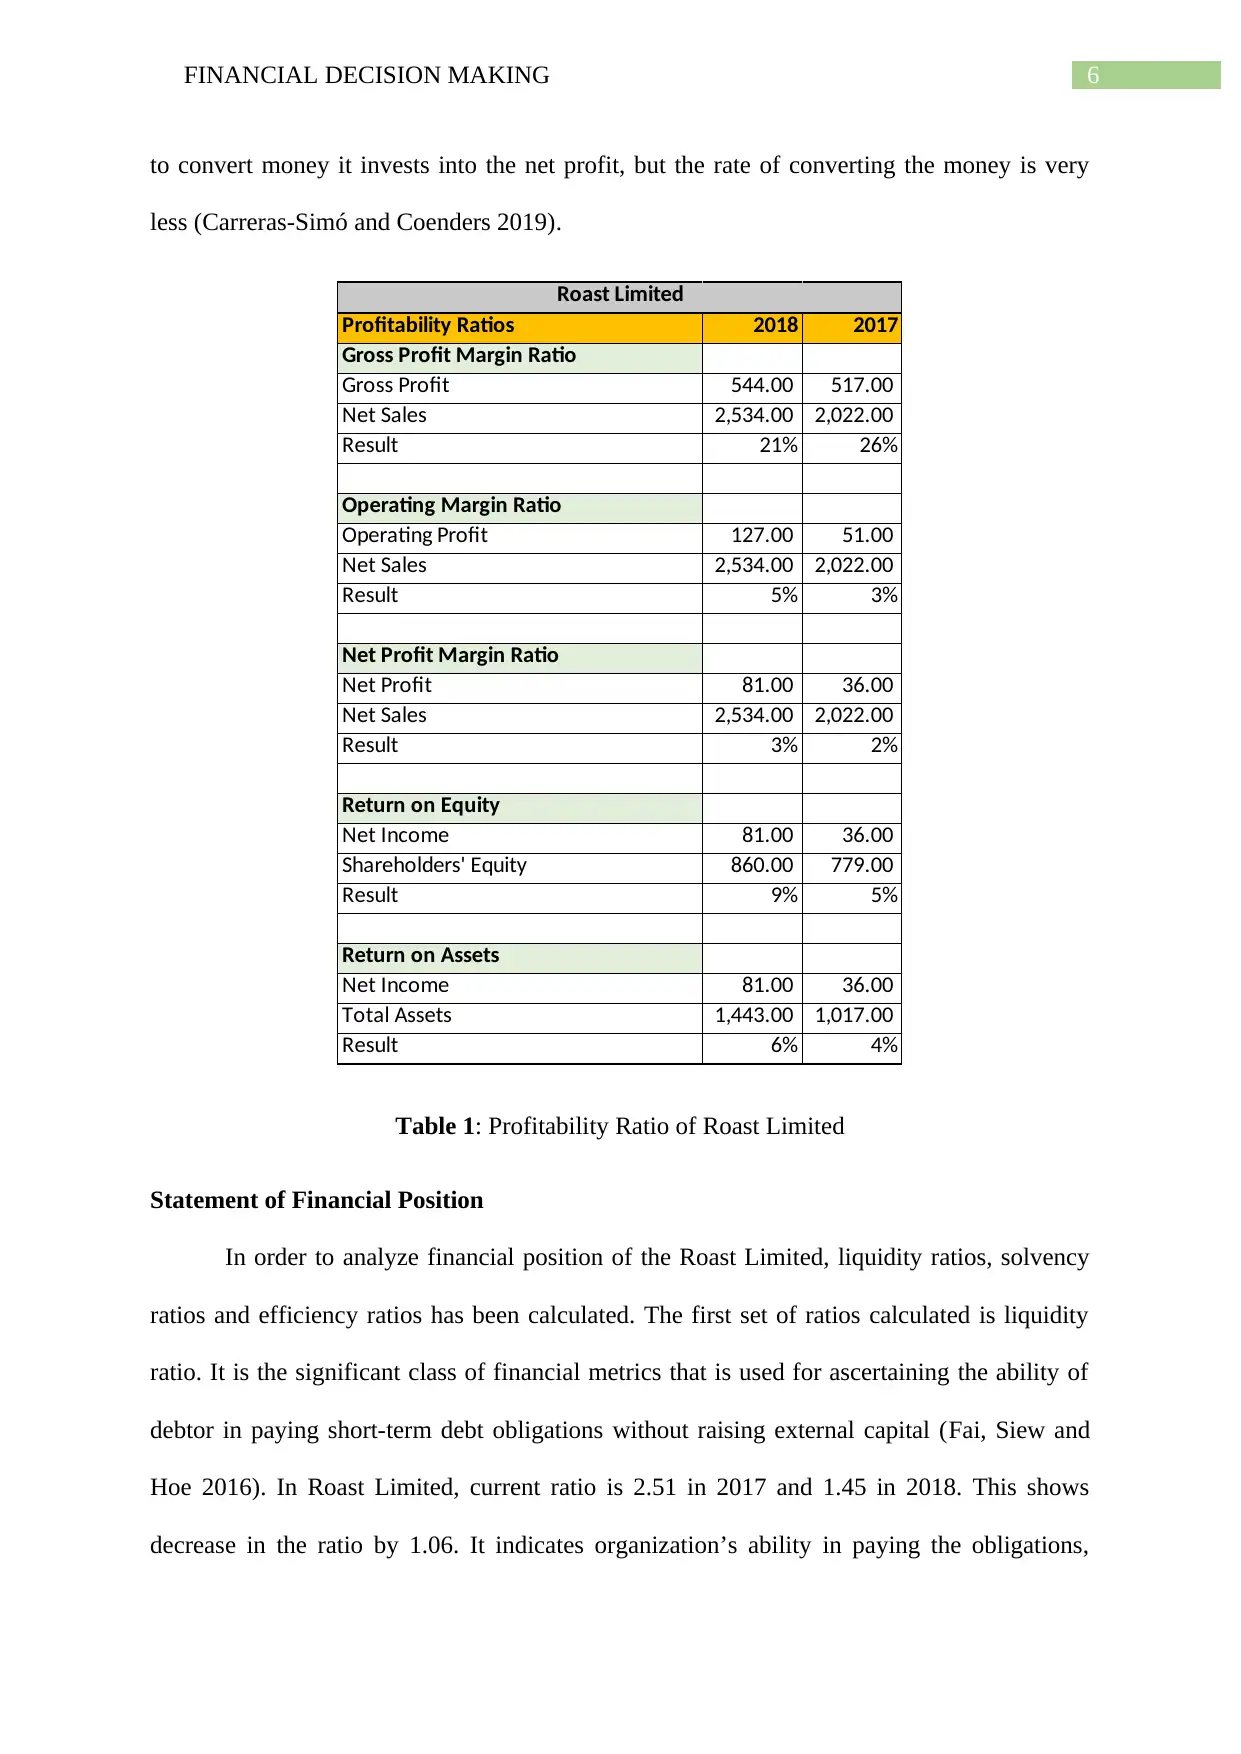
Profitability ratio of the Roast Limited will evaluate ability of entity in making
income in comparison to its expenses as well as other associated cost with income generation
during particular period. This helps in representing final outcome of entity. Hence, the first
ratio calculated for assessing the profitability of Roast Limited is gross profit margin ratio.
This ratio calculates the sales percentages, which exceeds cost of goods sold. It helps in
indicating performance of firm’s production and sales. In 2017, gross profit margin of Roast
was 26%, which reduced to 21% in 2018. It means that that the revenues left over after
paying off the cost of goods sold has been decreased by 5% (Dahmen and Rodríguez 2014).
“Operating profit margin ratio” is second ratio calculated for assessing profitability
of company. This ratio is the performance or profitability ratio, which reflects profit
percentage produced by the company from its operations, before subtracting interest charges
and taxes. It can be measured by dividing operating profit by the overall revenue and it is
expressed as percentage. Operating margin ratio of the Roast limited was 3% in year 2017
and 5% in 2017. It signifies that ratio has been increased by 2%. This increase in the ratio
indicates that ability of firm in making profit on sales after making payment for production’s
variable cost such as raw material and wages and before making payment of taxes and
interest has been increased. This shows proportion of the revenues available for covering
non-operating costs, for instance interest expense (Khadafi, Heikal and Ummah 2014).
“Net profit margin ratio” is the ratio, which is used for calculating percentage of the
profit that firm produces from its overall revenue. This measure amount of the net profit
2019 and maintaining loyalty of customer in fiercely competitive market
(Worldcoffeeportal.com. 2020).
Part 2: Business Performance Analysis
Statement of Profit or Loss
Profitability ratio of the Roast Limited will evaluate ability of entity in making
income in comparison to its expenses as well as other associated cost with income generation
during particular period. This helps in representing final outcome of entity. Hence, the first
ratio calculated for assessing the profitability of Roast Limited is gross profit margin ratio.
This ratio calculates the sales percentages, which exceeds cost of goods sold. It helps in
indicating performance of firm’s production and sales. In 2017, gross profit margin of Roast
was 26%, which reduced to 21% in 2018. It means that that the revenues left over after
paying off the cost of goods sold has been decreased by 5% (Dahmen and Rodríguez 2014).
“Operating profit margin ratio” is second ratio calculated for assessing profitability
of company. This ratio is the performance or profitability ratio, which reflects profit
percentage produced by the company from its operations, before subtracting interest charges
and taxes. It can be measured by dividing operating profit by the overall revenue and it is
expressed as percentage. Operating margin ratio of the Roast limited was 3% in year 2017
and 5% in 2017. It signifies that ratio has been increased by 2%. This increase in the ratio
indicates that ability of firm in making profit on sales after making payment for production’s
variable cost such as raw material and wages and before making payment of taxes and
interest has been increased. This shows proportion of the revenues available for covering
non-operating costs, for instance interest expense (Khadafi, Heikal and Ummah 2014).
“Net profit margin ratio” is the ratio, which is used for calculating percentage of the
profit that firm produces from its overall revenue. This measure amount of the net profit
5FINANCIAL DECISION MAKING
obtained by entity from per dollar of the sales generated. It is considered to be the bottom line
for the entity (Ehiedu 2014). It helps the investors in assessing that whether management of
company is generating sufficient profit from its total revenue and whether the overhead costs
and operating costs are being contained. It is the most significant indicator of firm’s financial
health. When it comes to Roast Ltd., net profit margin was 2% in 2017 and 3% in 2018. This
means that the ratio has been increased by 1%, but still it can be easily seen that compared to
sales, company is generating very less profit. This means cost of operations is higher. The
company need to control its cost for generating higher return (Kraft 2015).
Return on equity is measure of the financial performance that is measured by dividing
the net profit by total shareholders’ equity. If the ratio is higher, then it means management of
entity is more efficient in generating growth and income from its financing of equity
(Enekwe, Agu and Eziedo 2014). In case of the Roast Limited, the ROE was 5% in 2017 and
9% in 2018. This means that ROE of company has been increased by 4%. The rise in ratio
indicates that rate of the return on resources provided by the stockholders’ equity of company
has been increased. The business operations of Roast Limited are able to utilize successfully
the resources provided by accumulated profits of company and equity investors in generating
the income. However, still firm is not able to generate higher return compared to its total
equity (Yu et al. 2014).
Last, profitability ratio calculated is “return on assets”. It is financial ratio, which
shows percentage of the income earned by the firm in relation to its resources. Further, higher
is the ratio, the more will be efficiency of assets (Robinson et al. 2015). In Roast Limited,
ROA of firm was 4% in 2017 and 6% in 2018. It means that the ratio has been increased by
2%. This increase in the ratio indicates that firm is utilizing its assets in the most efficient
way. However, the rate of return in comparison to its assets is very less. Roast Limited is able
⊘ This is a preview!⊘
Do you want full access?
Subscribe today to unlock all pages.
Trusted by 1+ million students worldwide
6FINANCIAL DECISION MAKING
to convert money it invests into the net profit, but the rate of converting the money is very
less (Carreras-Simó and Coenders 2019).
Profitability Ratios 2018 2017
Gross Profit Margin Ratio
Gross Profit 544.00 517.00
Net Sales 2,534.00 2,022.00
Result 21% 26%
Operating Margin Ratio
Operating Profit 127.00 51.00
Net Sales 2,534.00 2,022.00
Result 5% 3%
Net Profit Margin Ratio
Net Profit 81.00 36.00
Net Sales 2,534.00 2,022.00
Result 3% 2%
Return on Equity
Net Income 81.00 36.00
Shareholders' Equity 860.00 779.00
Result 9% 5%
Return on Assets
Net Income 81.00 36.00
Total Assets 1,443.00 1,017.00
Result 6% 4%
Roast Limited
Table 1: Profitability Ratio of Roast Limited
Statement of Financial Position
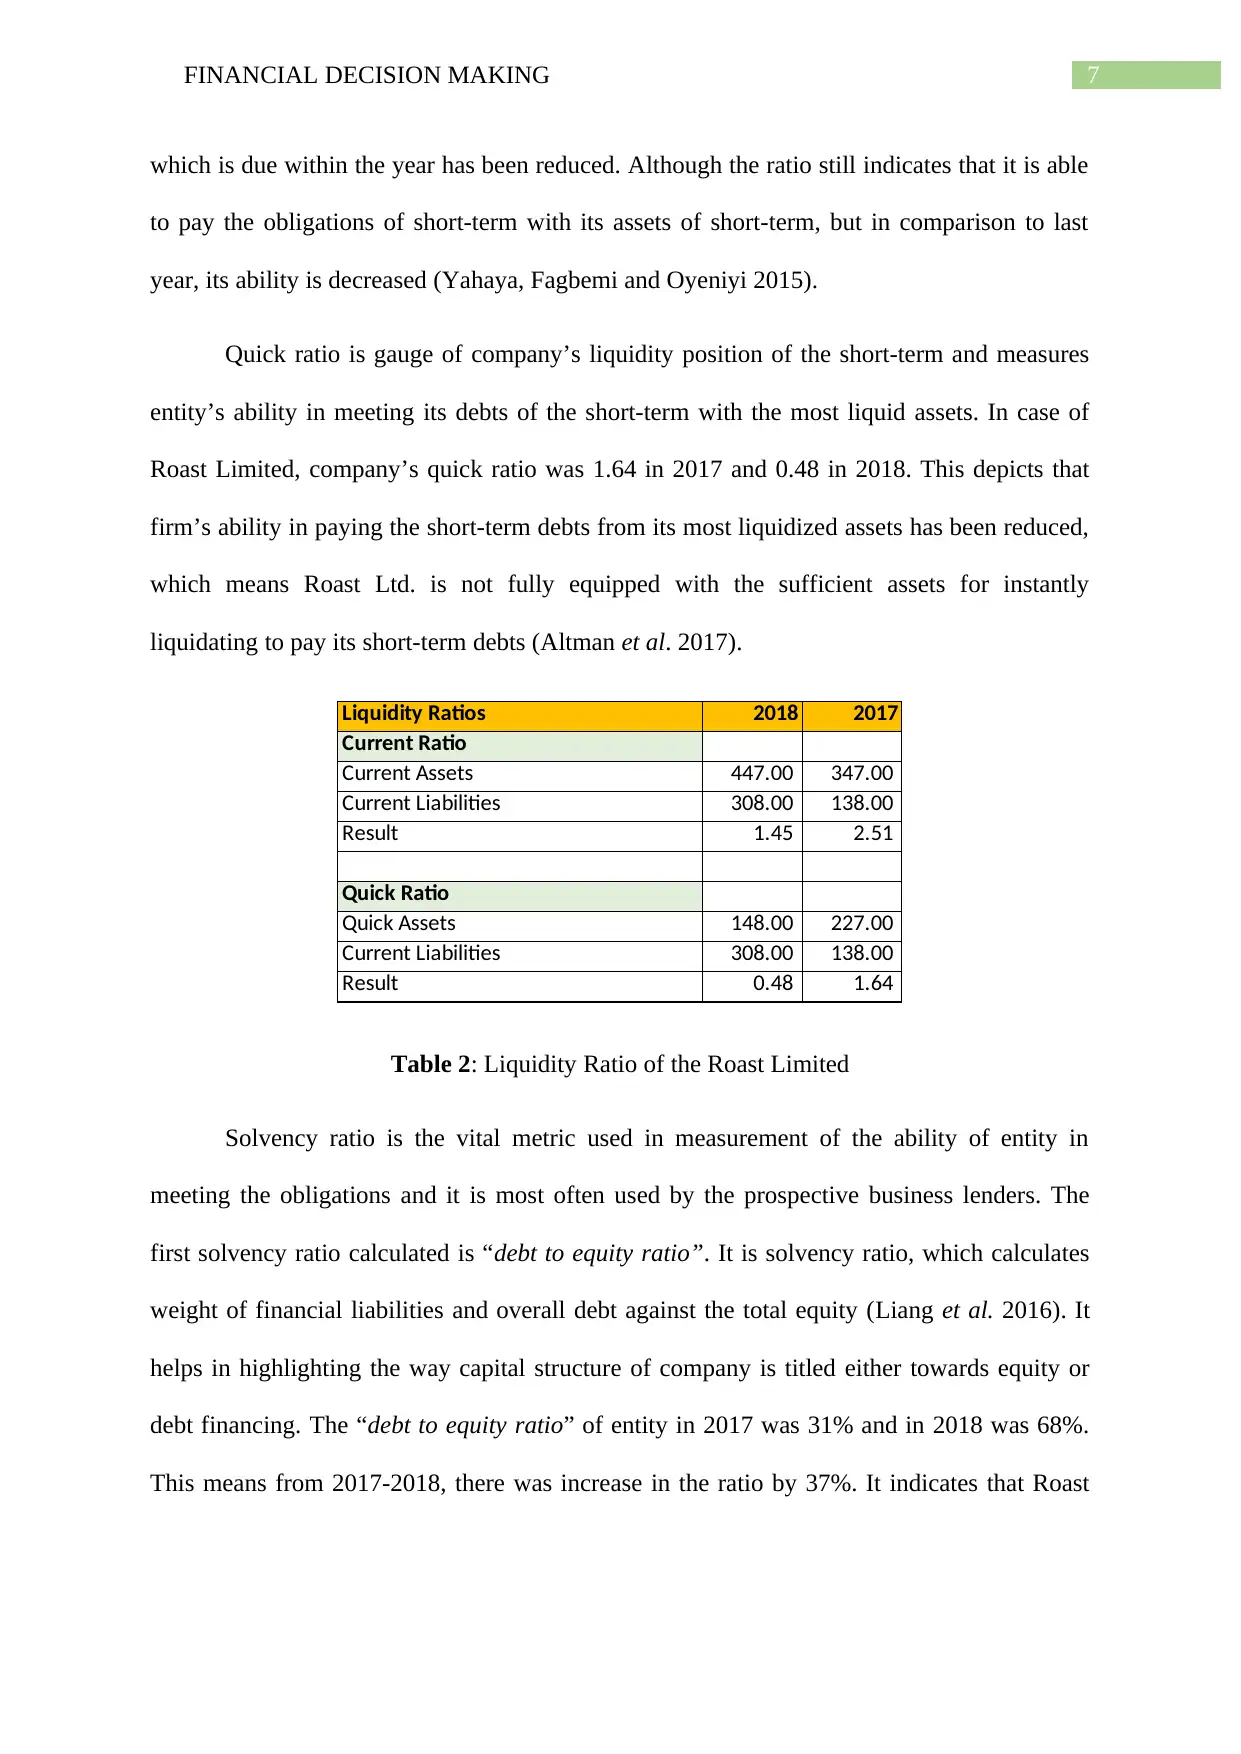
In order to analyze financial position of the Roast Limited, liquidity ratios, solvency
ratios and efficiency ratios has been calculated. The first set of ratios calculated is liquidity
ratio. It is the significant class of financial metrics that is used for ascertaining the ability of
debtor in paying short-term debt obligations without raising external capital (Fai, Siew and
Hoe 2016). In Roast Limited, current ratio is 2.51 in 2017 and 1.45 in 2018. This shows
decrease in the ratio by 1.06. It indicates organization’s ability in paying the obligations,
to convert money it invests into the net profit, but the rate of converting the money is very
less (Carreras-Simó and Coenders 2019).
Profitability Ratios 2018 2017
Gross Profit Margin Ratio
Gross Profit 544.00 517.00
Net Sales 2,534.00 2,022.00
Result 21% 26%
Operating Margin Ratio
Operating Profit 127.00 51.00
Net Sales 2,534.00 2,022.00
Result 5% 3%
Net Profit Margin Ratio
Net Profit 81.00 36.00
Net Sales 2,534.00 2,022.00
Result 3% 2%
Return on Equity
Net Income 81.00 36.00
Shareholders' Equity 860.00 779.00
Result 9% 5%
Return on Assets
Net Income 81.00 36.00
Total Assets 1,443.00 1,017.00
Result 6% 4%
Roast Limited
Table 1: Profitability Ratio of Roast Limited
Statement of Financial Position
In order to analyze financial position of the Roast Limited, liquidity ratios, solvency
ratios and efficiency ratios has been calculated. The first set of ratios calculated is liquidity
ratio. It is the significant class of financial metrics that is used for ascertaining the ability of
debtor in paying short-term debt obligations without raising external capital (Fai, Siew and
Hoe 2016). In Roast Limited, current ratio is 2.51 in 2017 and 1.45 in 2018. This shows
decrease in the ratio by 1.06. It indicates organization’s ability in paying the obligations,
Paraphrase This Document
Need a fresh take? Get an instant paraphrase of this document with our AI Paraphraser
7FINANCIAL DECISION MAKING
which is due within the year has been reduced. Although the ratio still indicates that it is able
to pay the obligations of short-term with its assets of short-term, but in comparison to last
year, its ability is decreased (Yahaya, Fagbemi and Oyeniyi 2015).
Quick ratio is gauge of company’s liquidity position of the short-term and measures
entity’s ability in meeting its debts of the short-term with the most liquid assets. In case of
Roast Limited, company’s quick ratio was 1.64 in 2017 and 0.48 in 2018. This depicts that
firm’s ability in paying the short-term debts from its most liquidized assets has been reduced,
which means Roast Ltd. is not fully equipped with the sufficient assets for instantly
liquidating to pay its short-term debts (Altman et al. 2017).
Liquidity Ratios 2018 2017
Current Ratio
Current Assets 447.00 347.00
Current Liabilities 308.00 138.00
Result 1.45 2.51
Quick Ratio
Quick Assets 148.00 227.00
Current Liabilities 308.00 138.00
Result 0.48 1.64
Table 2: Liquidity Ratio of the Roast Limited
Solvency ratio is the vital metric used in measurement of the ability of entity in
meeting the obligations and it is most often used by the prospective business lenders. The
first solvency ratio calculated is “debt to equity ratio”. It is solvency ratio, which calculates
weight of financial liabilities and overall debt against the total equity (Liang et al. 2016). It
helps in highlighting the way capital structure of company is titled either towards equity or
debt financing. The “debt to equity ratio” of entity in 2017 was 31% and in 2018 was 68%.
This means from 2017-2018, there was increase in the ratio by 37%. It indicates that Roast
8FINANCIAL DECISION MAKING
Limited is using higher level of debt in comparison to the equity, which is quite risky (Minnis
and Sutherland 2017).
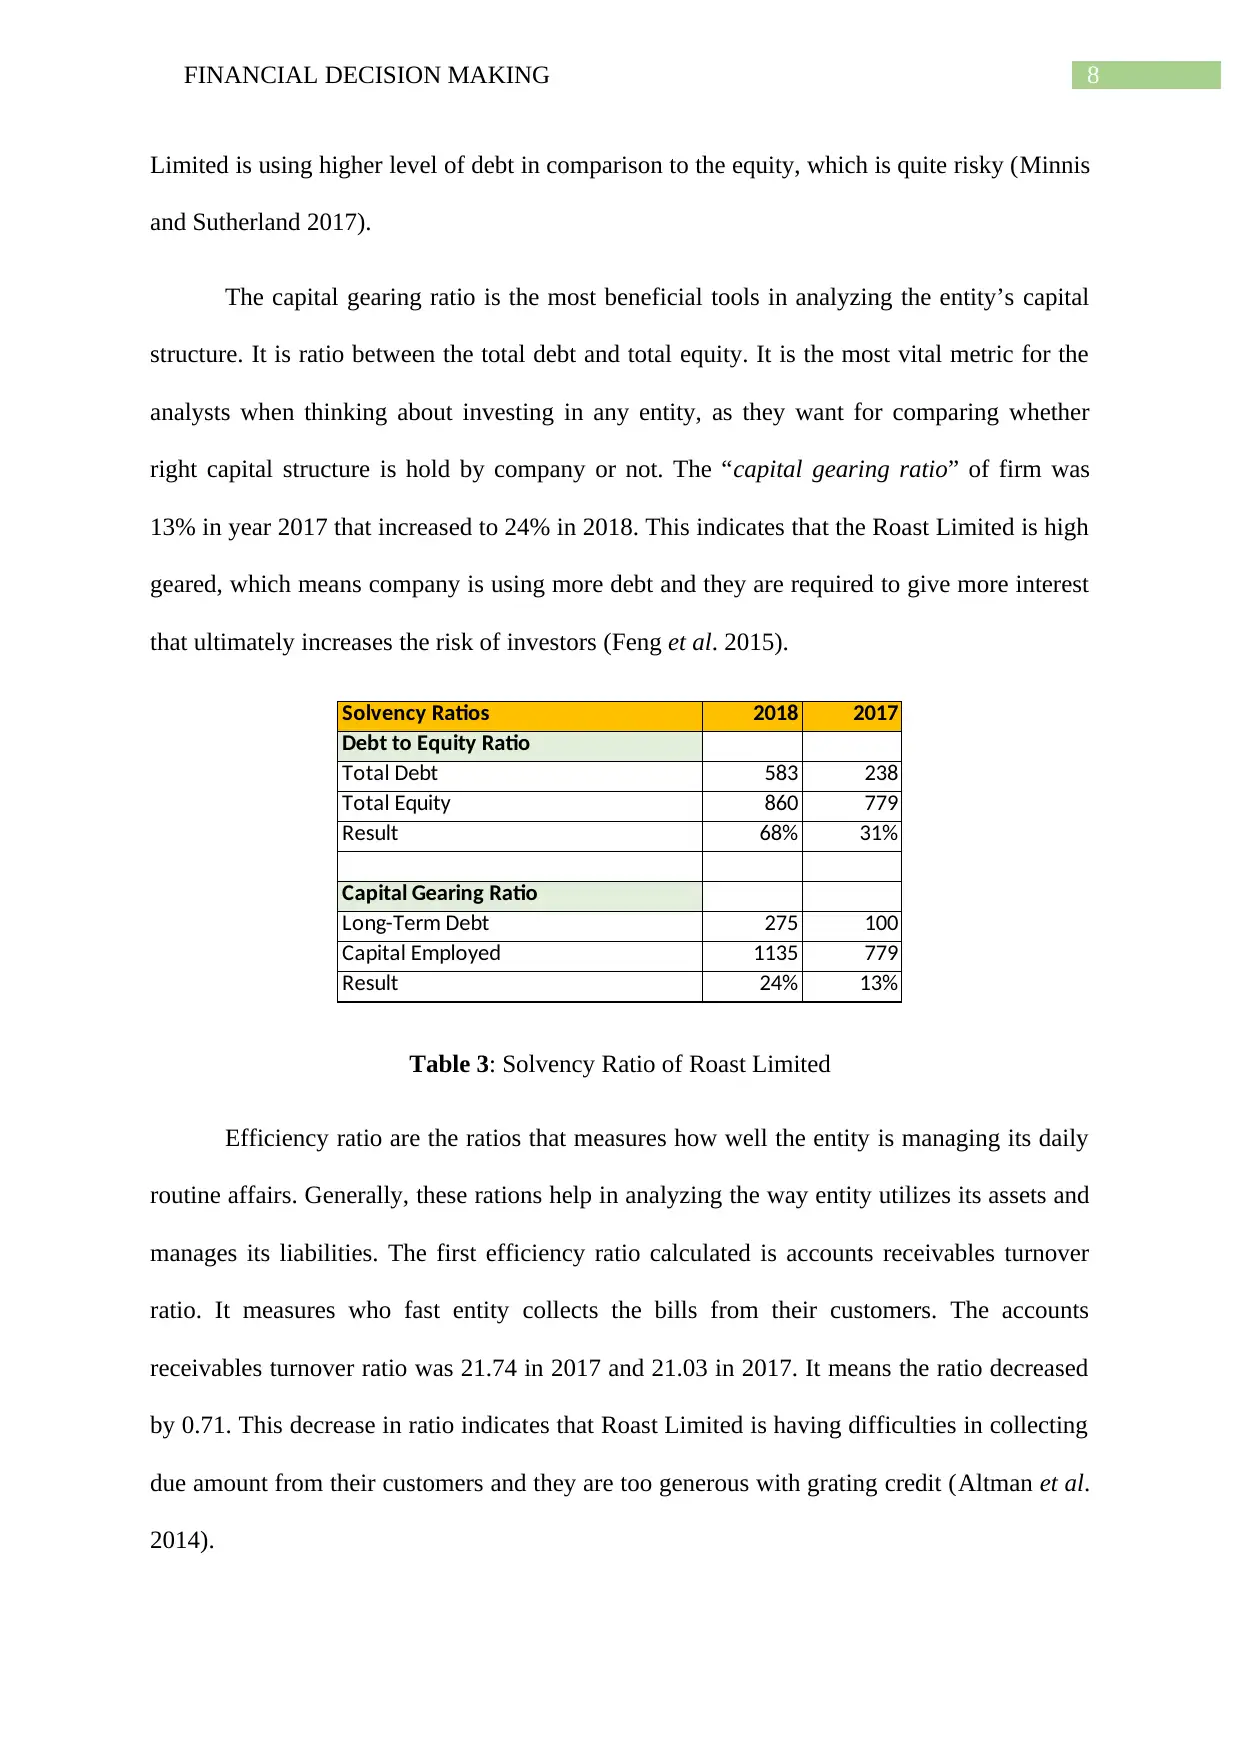
The capital gearing ratio is the most beneficial tools in analyzing the entity’s capital
structure. It is ratio between the total debt and total equity. It is the most vital metric for the
analysts when thinking about investing in any entity, as they want for comparing whether
right capital structure is hold by company or not. The “capital gearing ratio” of firm was
13% in year 2017 that increased to 24% in 2018. This indicates that the Roast Limited is high
geared, which means company is using more debt and they are required to give more interest
that ultimately increases the risk of investors (Feng et al. 2015).
Solvency Ratios 2018 2017
Debt to Equity Ratio
Total Debt 583 238
Total Equity 860 779
Result 68% 31%
Capital Gearing Ratio
Long-Term Debt 275 100
Capital Employed 1135 779
Result 24% 13%
Table 3: Solvency Ratio of Roast Limited
Efficiency ratio are the ratios that measures how well the entity is managing its daily
routine affairs. Generally, these rations help in analyzing the way entity utilizes its assets and
manages its liabilities. The first efficiency ratio calculated is accounts receivables turnover
ratio. It measures who fast entity collects the bills from their customers. The accounts
receivables turnover ratio was 21.74 in 2017 and 21.03 in 2017. It means the ratio decreased
by 0.71. This decrease in ratio indicates that Roast Limited is having difficulties in collecting
due amount from their customers and they are too generous with grating credit (Altman et al.
2014).
Limited is using higher level of debt in comparison to the equity, which is quite risky (Minnis
and Sutherland 2017).
The capital gearing ratio is the most beneficial tools in analyzing the entity’s capital
structure. It is ratio between the total debt and total equity. It is the most vital metric for the
analysts when thinking about investing in any entity, as they want for comparing whether
right capital structure is hold by company or not. The “capital gearing ratio” of firm was
13% in year 2017 that increased to 24% in 2018. This indicates that the Roast Limited is high
geared, which means company is using more debt and they are required to give more interest
that ultimately increases the risk of investors (Feng et al. 2015).
Solvency Ratios 2018 2017
Debt to Equity Ratio
Total Debt 583 238
Total Equity 860 779
Result 68% 31%
Capital Gearing Ratio
Long-Term Debt 275 100
Capital Employed 1135 779
Result 24% 13%
Table 3: Solvency Ratio of Roast Limited
Efficiency ratio are the ratios that measures how well the entity is managing its daily
routine affairs. Generally, these rations help in analyzing the way entity utilizes its assets and
manages its liabilities. The first efficiency ratio calculated is accounts receivables turnover
ratio. It measures who fast entity collects the bills from their customers. The accounts
receivables turnover ratio was 21.74 in 2017 and 21.03 in 2017. It means the ratio decreased
by 0.71. This decrease in ratio indicates that Roast Limited is having difficulties in collecting
due amount from their customers and they are too generous with grating credit (Altman et al.
2014).
⊘ This is a preview!⊘
Do you want full access?
Subscribe today to unlock all pages.
Trusted by 1+ million students worldwide
9FINANCIAL DECISION MAKING
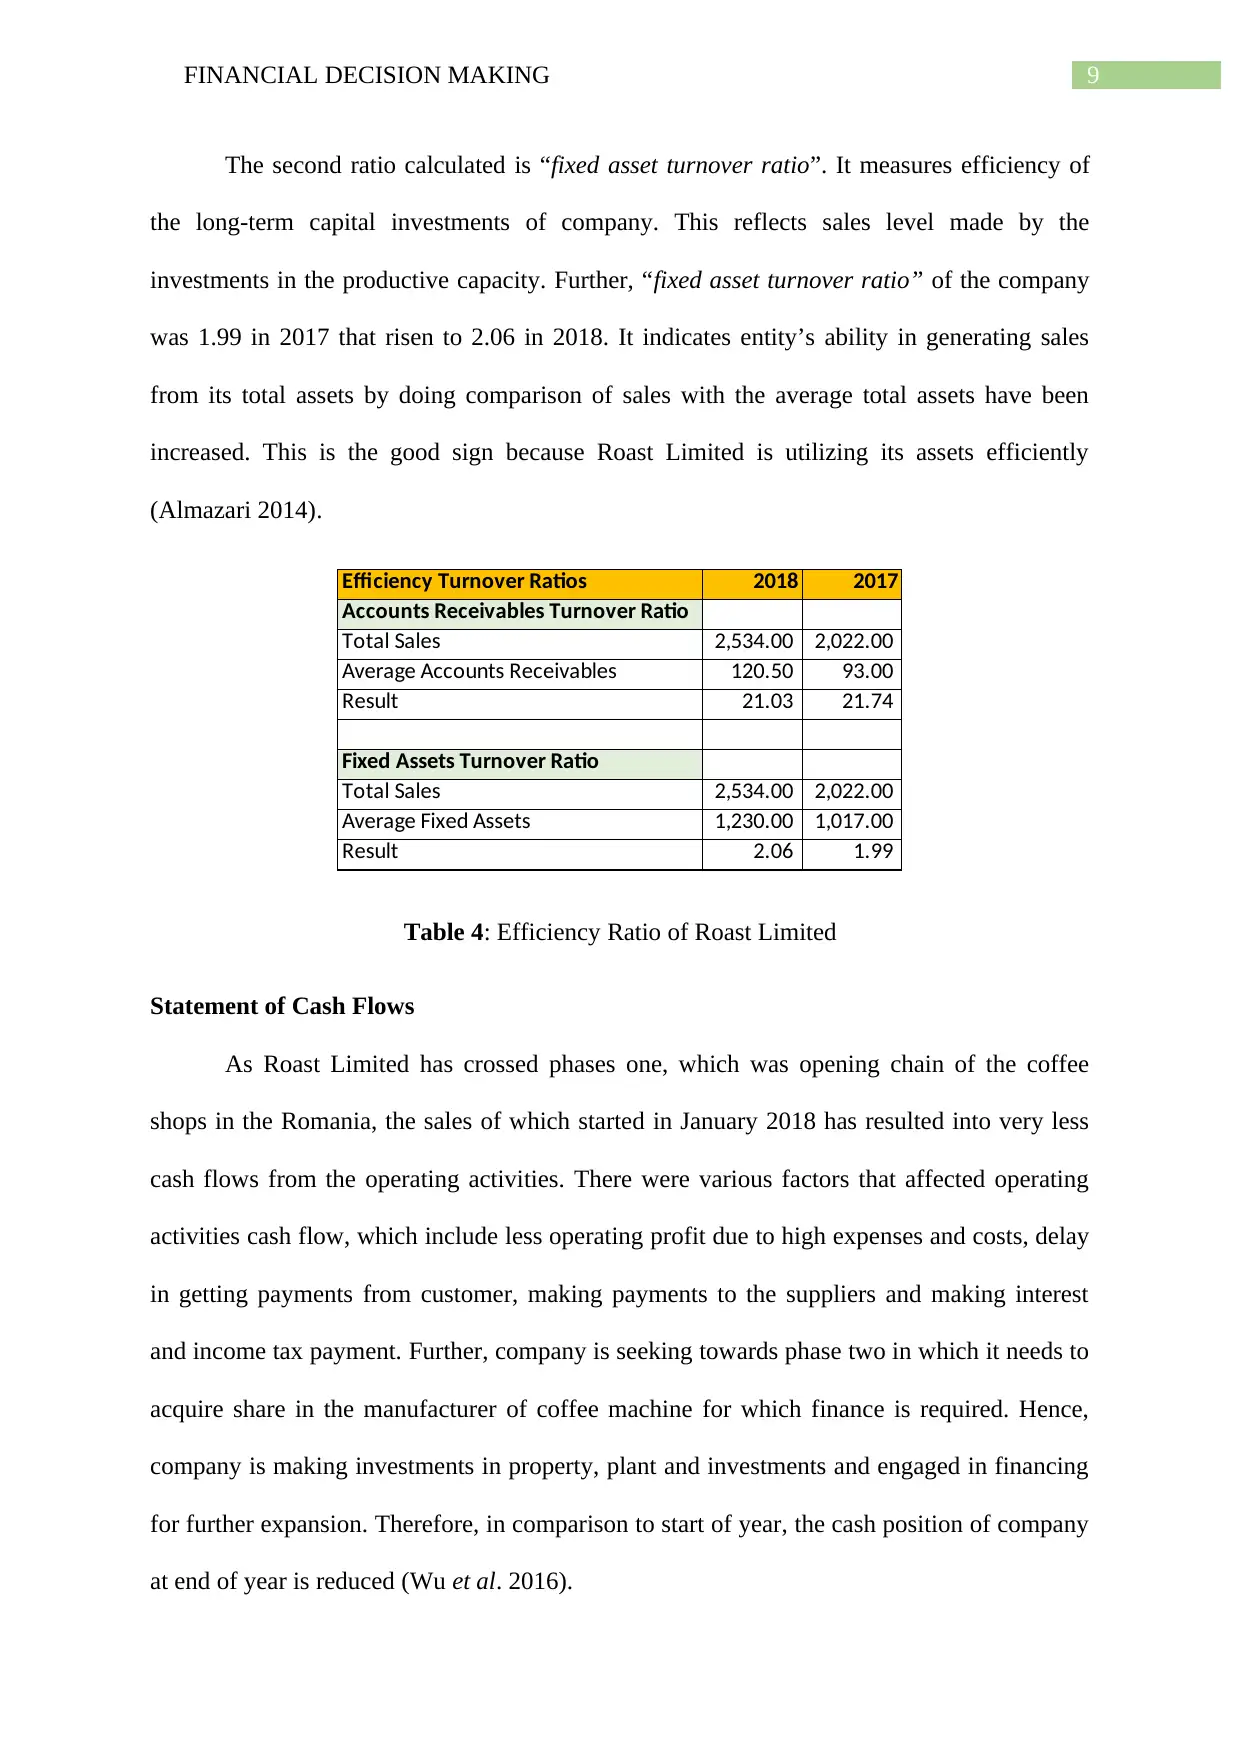
The second ratio calculated is “fixed asset turnover ratio”. It measures efficiency of
the long-term capital investments of company. This reflects sales level made by the
investments in the productive capacity. Further, “fixed asset turnover ratio” of the company
was 1.99 in 2017 that risen to 2.06 in 2018. It indicates entity’s ability in generating sales
from its total assets by doing comparison of sales with the average total assets have been
increased. This is the good sign because Roast Limited is utilizing its assets efficiently
(Almazari 2014).
Efficiency Turnover Ratios 2018 2017
Accounts Receivables Turnover Ratio
Total Sales 2,534.00 2,022.00
Average Accounts Receivables 120.50 93.00
Result 21.03 21.74
Fixed Assets Turnover Ratio
Total Sales 2,534.00 2,022.00
Average Fixed Assets 1,230.00 1,017.00
Result 2.06 1.99
Table 4: Efficiency Ratio of Roast Limited
Statement of Cash Flows
As Roast Limited has crossed phases one, which was opening chain of the coffee
shops in the Romania, the sales of which started in January 2018 has resulted into very less
cash flows from the operating activities. There were various factors that affected operating
activities cash flow, which include less operating profit due to high expenses and costs, delay
in getting payments from customer, making payments to the suppliers and making interest
and income tax payment. Further, company is seeking towards phase two in which it needs to
acquire share in the manufacturer of coffee machine for which finance is required. Hence,
company is making investments in property, plant and investments and engaged in financing
for further expansion. Therefore, in comparison to start of year, the cash position of company
at end of year is reduced (Wu et al. 2016).
Paraphrase This Document
Need a fresh take? Get an instant paraphrase of this document with our AI Paraphraser
10FINANCIAL DECISION MAKING
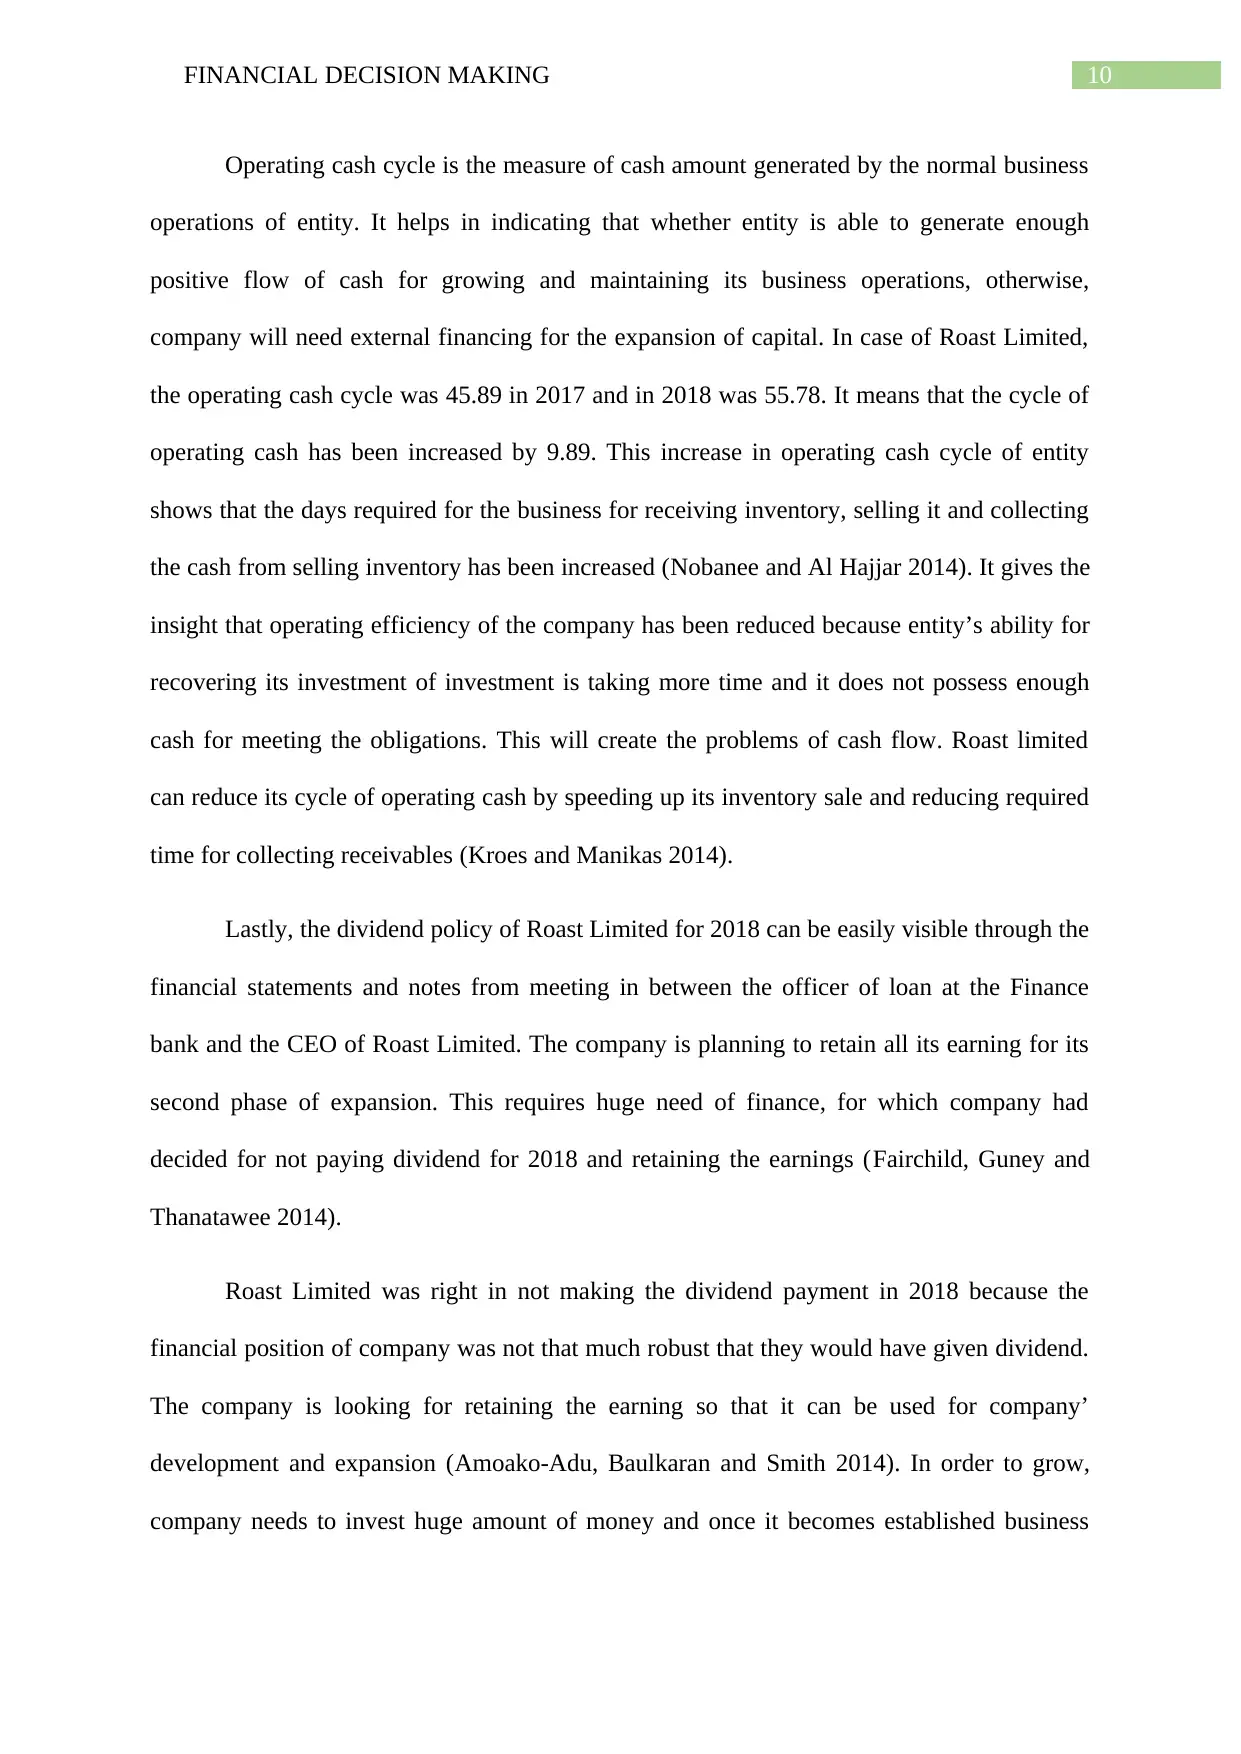
Operating cash cycle is the measure of cash amount generated by the normal business
operations of entity. It helps in indicating that whether entity is able to generate enough
positive flow of cash for growing and maintaining its business operations, otherwise,
company will need external financing for the expansion of capital. In case of Roast Limited,
the operating cash cycle was 45.89 in 2017 and in 2018 was 55.78. It means that the cycle of
operating cash has been increased by 9.89. This increase in operating cash cycle of entity
shows that the days required for the business for receiving inventory, selling it and collecting
the cash from selling inventory has been increased (Nobanee and Al Hajjar 2014). It gives the
insight that operating efficiency of the company has been reduced because entity’s ability for
recovering its investment of investment is taking more time and it does not possess enough
cash for meeting the obligations. This will create the problems of cash flow. Roast limited
can reduce its cycle of operating cash by speeding up its inventory sale and reducing required
time for collecting receivables (Kroes and Manikas 2014).
Lastly, the dividend policy of Roast Limited for 2018 can be easily visible through the
financial statements and notes from meeting in between the officer of loan at the Finance
bank and the CEO of Roast Limited. The company is planning to retain all its earning for its
second phase of expansion. This requires huge need of finance, for which company had
decided for not paying dividend for 2018 and retaining the earnings (Fairchild, Guney and
Thanatawee 2014).
Roast Limited was right in not making the dividend payment in 2018 because the
financial position of company was not that much robust that they would have given dividend.
The company is looking for retaining the earning so that it can be used for company’
development and expansion (Amoako-Adu, Baulkaran and Smith 2014). In order to grow,
company needs to invest huge amount of money and once it becomes established business
11FINANCIAL DECISION MAKING
and started earning good return, then they would be in position to pay dividend. Hence, it is
correct decision made by company (Yegon, Cheruiyot and Sang 2014).
Cash Flow Analysis 2018 2017
Operating Cash Cycle
Days Inventories Outstanding 38.43 29.10
Days Sales Outstanding 17.36 16.79
Result 55.78 45.89
Table 5: Cash Flow Analysis of the Roast Limited
Part 3: Investment Appraisal
3.1.a Management Forecast
The forecast by management is development by every company, whether small or
large for estimating its performance of future. These forecasts are being used for setting the
business targets, plans of resources, expectations of investors and plans of compensation.
Hence, depending upon business types, forecast can be done at the different intervals of time.
Generally, annual and quarterly forecasts are considered to be common across all the
businesses and industries (Dyson and Berry 2014).
In case of the Roast Limited, management has forecasted its revenue growth in £300
in 2017, £560 in 2018, £740 in 2019, £900 in 2020 and £1,120 in 2021. Further, the
forecasted variable cost is increasing from £240 in 2017, £448 in 2018, £592 in 2019, £720 in
2020 and £896 in 2021. Lastly, the resultant cash flow from investment was £60 in 2017,
£112 in 2018, £148 in 2019, £180 in 2020 and £224 in 2021. This forecast of management
can be challenged because there was no revenue in 2017 and in 2018, the revenue generated
by company was £350. Here, the forecast proves to be wrong. Further, as it was forecasted
that company will start making contributions right from its year of investment, which also
proves to be inaccurate. In actual, company was having negative cash balance because of
investment and increased cost of operations (Abdel-Kader, Dugdale and Taylor 2018).
⊘ This is a preview!⊘
Do you want full access?
Subscribe today to unlock all pages.
Trusted by 1+ million students worldwide
1 out of 20
Related Documents


Your All-in-One AI-Powered Toolkit for Academic Success.
+13062052269
info@desklib.com
Available 24*7 on WhatsApp / Email
![[object Object]](/_next/static/media/star-bottom.7253800d.svg)
Unlock your academic potential
Copyright © 2020–2026 A2Z Services. All Rights Reserved. Developed and managed by ZUCOL.