Financial Decision-Making Report: Starbucks & Roast Limited
VerifiedAdded on 2023/01/18
|14
|4109
|79
Report
AI Summary
This report provides a financial decision-making analysis, focusing on the potential acquisition of Roast Limited by Starbucks. The report begins with an industry review of the UK coffee shop market, highlighting market share and opportunities. It then delves into a detailed business performance analysis, examining Roast Limited's profit and loss account, statement of financial position (balance sheet), and cash flow statement for 2017 and 2018. Key financial ratios are calculated and interpreted to assess the company's financial health, including gross profit margin, net profit ratio, current ratio, quick ratio, and return on capital employed. The analysis reveals positive trends in Roast Limited's performance, particularly in 2018, with recommendations for cost management. Finally, the report performs investment appraisals using payback period, accounting rate of return, and net present value to support the recommendation that Starbucks should acquire Roast Limited due to its strong financial standing and growth potential. The report also analyzes the operating cash cycle of the company.
FINANCIAL
DECISION MAKING
DECISION MAKING
Paraphrase This Document
Need a fresh take? Get an instant paraphrase of this document with our AI Paraphraser
Table of Contents
EXECUTIVE SUMMARY ............................................................................................................3
MAIN BODY...................................................................................................................................3
Part 1. Industry review:...............................................................................................................3
Part 2. Business performance analysis:.......................................................................................3
Part 3. Investment appraisals:...................................................................................................10
REFERENCES..............................................................................................................................14
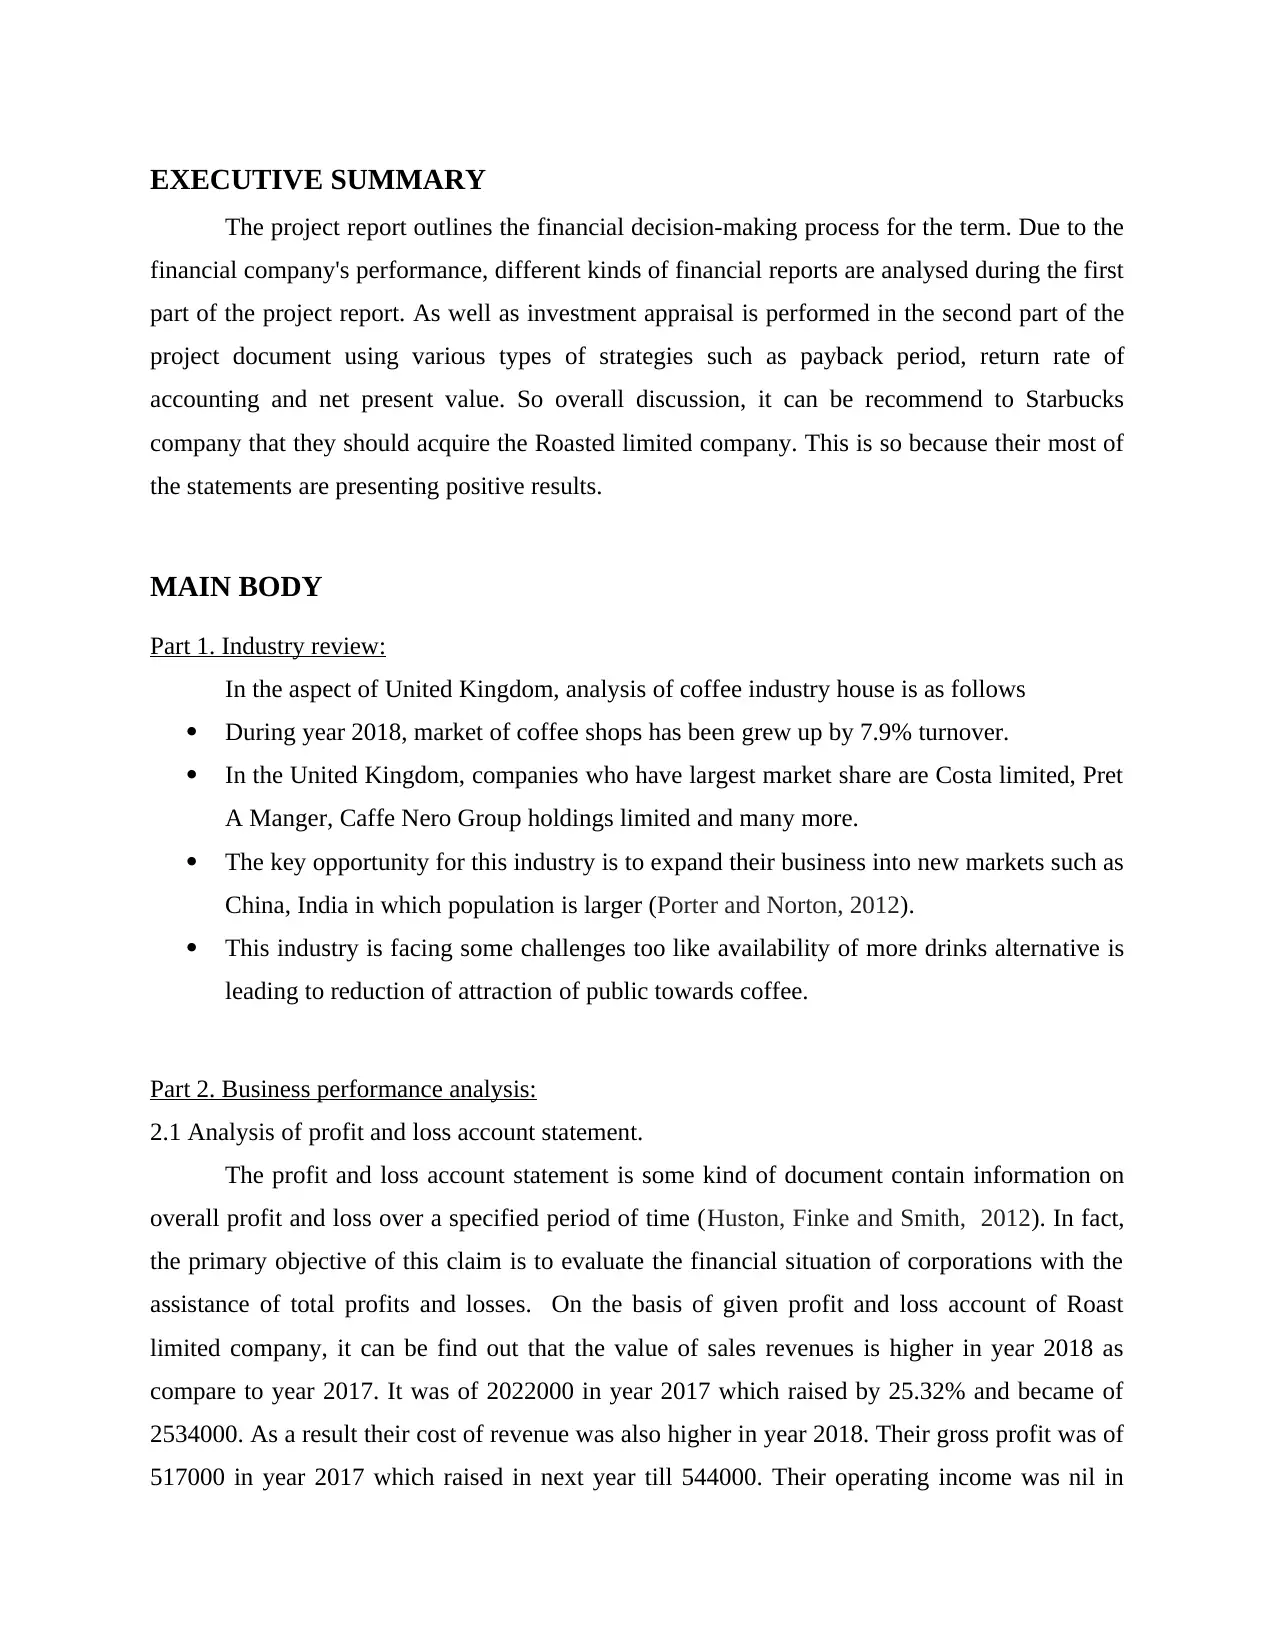
EXECUTIVE SUMMARY
The project report outlines the financial decision-making process for the term. Due to the
financial company's performance, different kinds of financial reports are analysed during the first
part of the project report. As well as investment appraisal is performed in the second part of the
project document using various types of strategies such as payback period, return rate of
accounting and net present value. So overall discussion, it can be recommend to Starbucks
company that they should acquire the Roasted limited company. This is so because their most of
the statements are presenting positive results.
MAIN BODY
Part 1. Industry review:
In the aspect of United Kingdom, analysis of coffee industry house is as follows
During year 2018, market of coffee shops has been grew up by 7.9% turnover.
In the United Kingdom, companies who have largest market share are Costa limited, Pret
A Manger, Caffe Nero Group holdings limited and many more.
The key opportunity for this industry is to expand their business into new markets such as
China, India in which population is larger (Porter and Norton, 2012).
This industry is facing some challenges too like availability of more drinks alternative is
leading to reduction of attraction of public towards coffee.
Part 2. Business performance analysis:
2.1 Analysis of profit and loss account statement.
The profit and loss account statement is some kind of document contain information on
overall profit and loss over a specified period of time (Huston, Finke and Smith, 2012). In fact,
the primary objective of this claim is to evaluate the financial situation of corporations with the
assistance of total profits and losses. On the basis of given profit and loss account of Roast
limited company, it can be find out that the value of sales revenues is higher in year 2018 as
compare to year 2017. It was of 2022000 in year 2017 which raised by 25.32% and became of
2534000. As a result their cost of revenue was also higher in year 2018. Their gross profit was of
517000 in year 2017 which raised in next year till 544000. Their operating income was nil in
⊘ This is a preview!⊘
Do you want full access?
Subscribe today to unlock all pages.
Trusted by 1+ million students worldwide
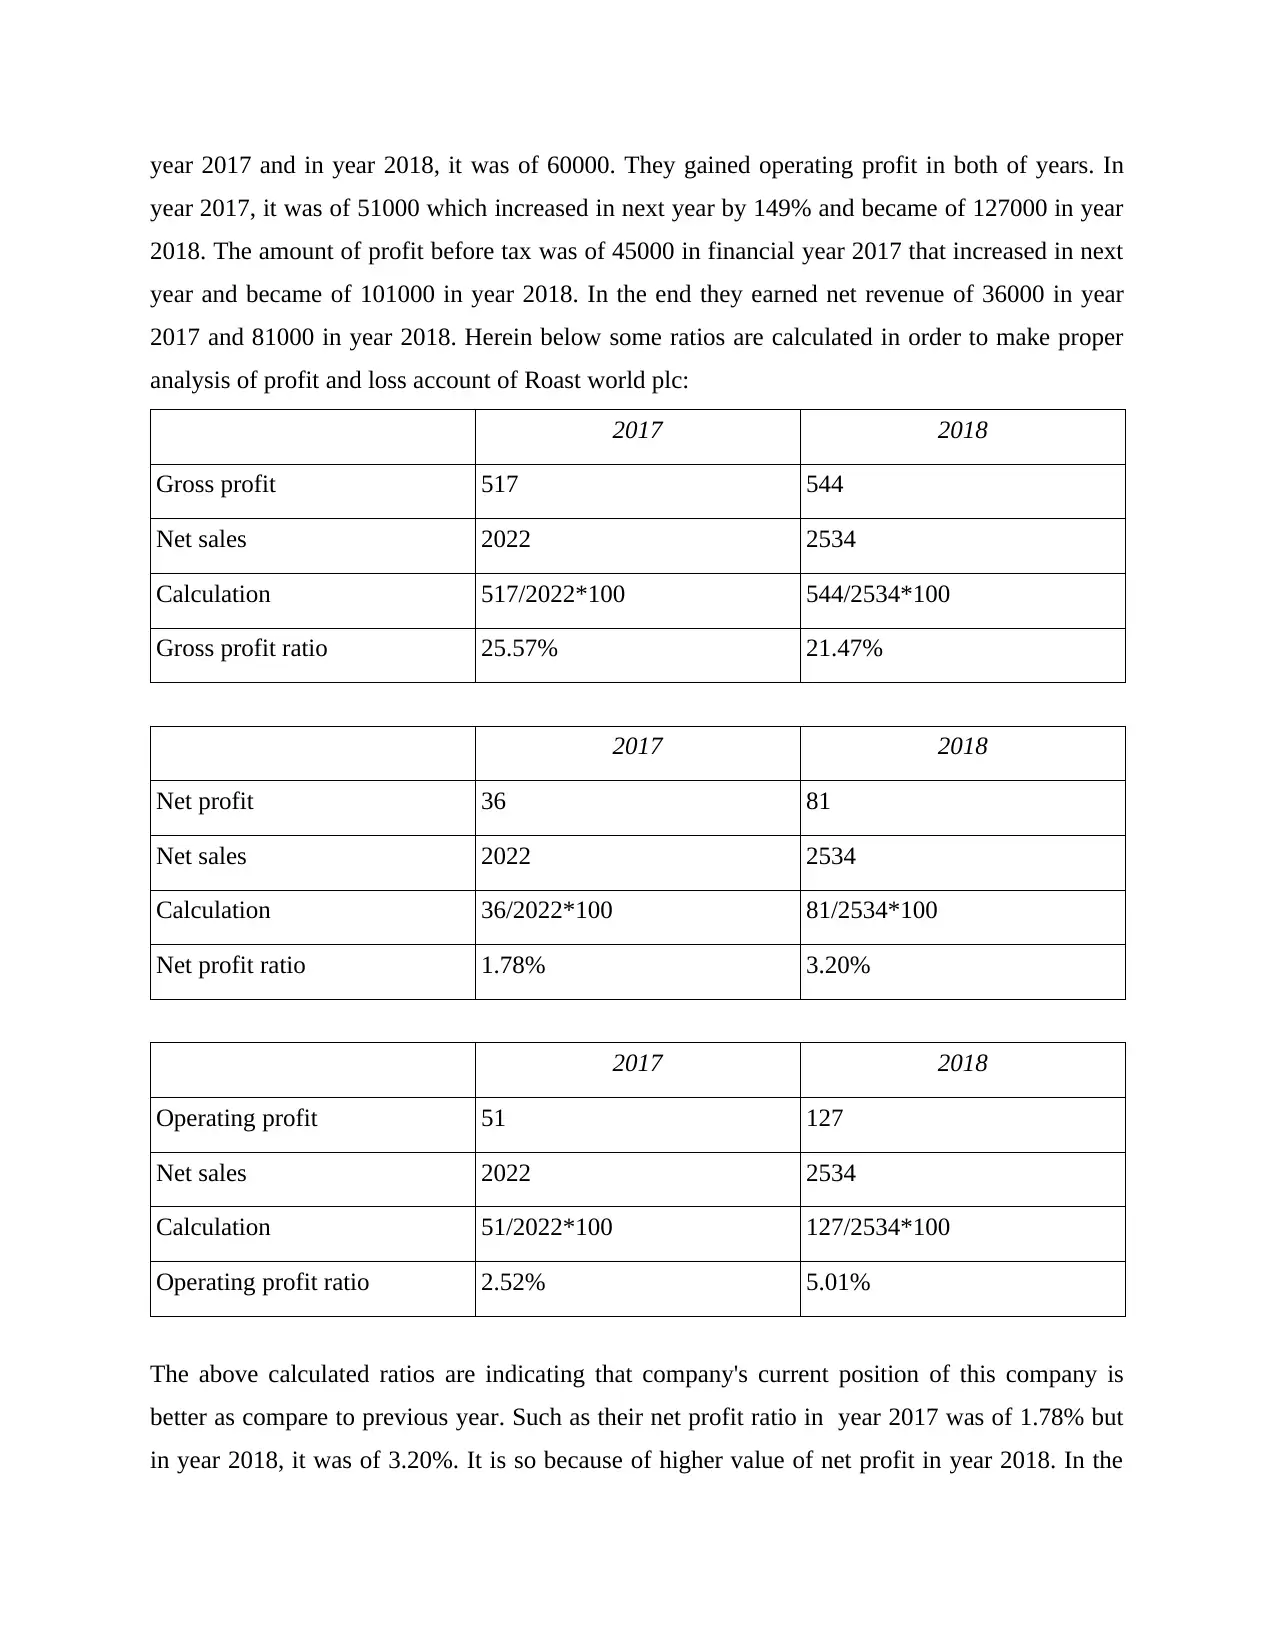
year 2017 and in year 2018, it was of 60000. They gained operating profit in both of years. In
year 2017, it was of 51000 which increased in next year by 149% and became of 127000 in year
2018. The amount of profit before tax was of 45000 in financial year 2017 that increased in next
year and became of 101000 in year 2018. In the end they earned net revenue of 36000 in year
2017 and 81000 in year 2018. Herein below some ratios are calculated in order to make proper
analysis of profit and loss account of Roast world plc:
2017 2018
Gross profit 517 544
Net sales 2022 2534
Calculation 517/2022*100 544/2534*100
Gross profit ratio 25.57% 21.47%
2017 2018
Net profit 36 81
Net sales 2022 2534
Calculation 36/2022*100 81/2534*100
Net profit ratio 1.78% 3.20%
2017 2018
Operating profit 51 127
Net sales 2022 2534
Calculation 51/2022*100 127/2534*100
Operating profit ratio 2.52% 5.01%
The above calculated ratios are indicating that company's current position of this company is
better as compare to previous year. Such as their net profit ratio in year 2017 was of 1.78% but
in year 2018, it was of 3.20%. It is so because of higher value of net profit in year 2018. In the
Paraphrase This Document
Need a fresh take? Get an instant paraphrase of this document with our AI Paraphraser
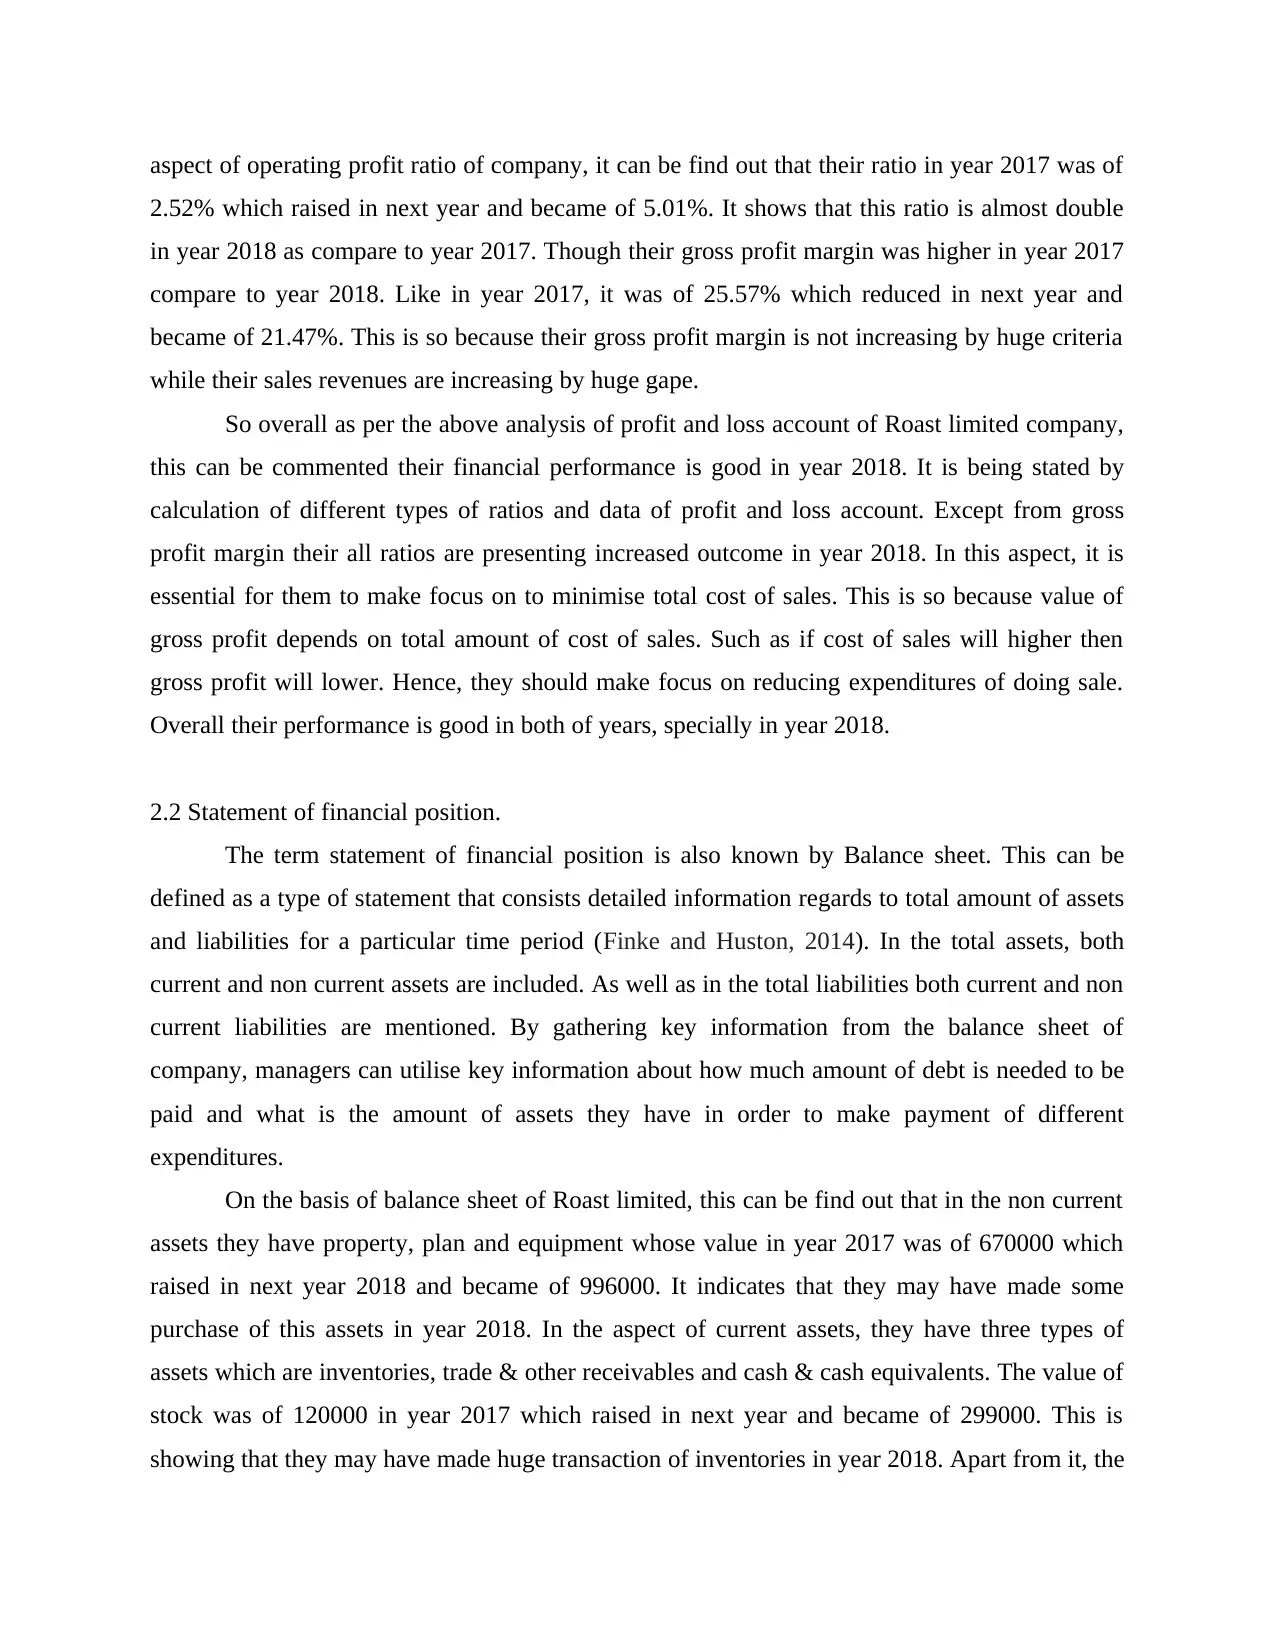
aspect of operating profit ratio of company, it can be find out that their ratio in year 2017 was of
2.52% which raised in next year and became of 5.01%. It shows that this ratio is almost double
in year 2018 as compare to year 2017. Though their gross profit margin was higher in year 2017
compare to year 2018. Like in year 2017, it was of 25.57% which reduced in next year and
became of 21.47%. This is so because their gross profit margin is not increasing by huge criteria
while their sales revenues are increasing by huge gape.
So overall as per the above analysis of profit and loss account of Roast limited company,
this can be commented their financial performance is good in year 2018. It is being stated by
calculation of different types of ratios and data of profit and loss account. Except from gross
profit margin their all ratios are presenting increased outcome in year 2018. In this aspect, it is
essential for them to make focus on to minimise total cost of sales. This is so because value of
gross profit depends on total amount of cost of sales. Such as if cost of sales will higher then
gross profit will lower. Hence, they should make focus on reducing expenditures of doing sale.
Overall their performance is good in both of years, specially in year 2018.
2.2 Statement of financial position.
The term statement of financial position is also known by Balance sheet. This can be
defined as a type of statement that consists detailed information regards to total amount of assets
and liabilities for a particular time period (Finke and Huston, 2014). In the total assets, both
current and non current assets are included. As well as in the total liabilities both current and non
current liabilities are mentioned. By gathering key information from the balance sheet of
company, managers can utilise key information about how much amount of debt is needed to be
paid and what is the amount of assets they have in order to make payment of different
expenditures.
On the basis of balance sheet of Roast limited, this can be find out that in the non current
assets they have property, plan and equipment whose value in year 2017 was of 670000 which
raised in next year 2018 and became of 996000. It indicates that they may have made some
purchase of this assets in year 2018. In the aspect of current assets, they have three types of
assets which are inventories, trade & other receivables and cash & cash equivalents. The value of
stock was of 120000 in year 2017 which raised in next year and became of 299000. This is
showing that they may have made huge transaction of inventories in year 2018. Apart from it, the
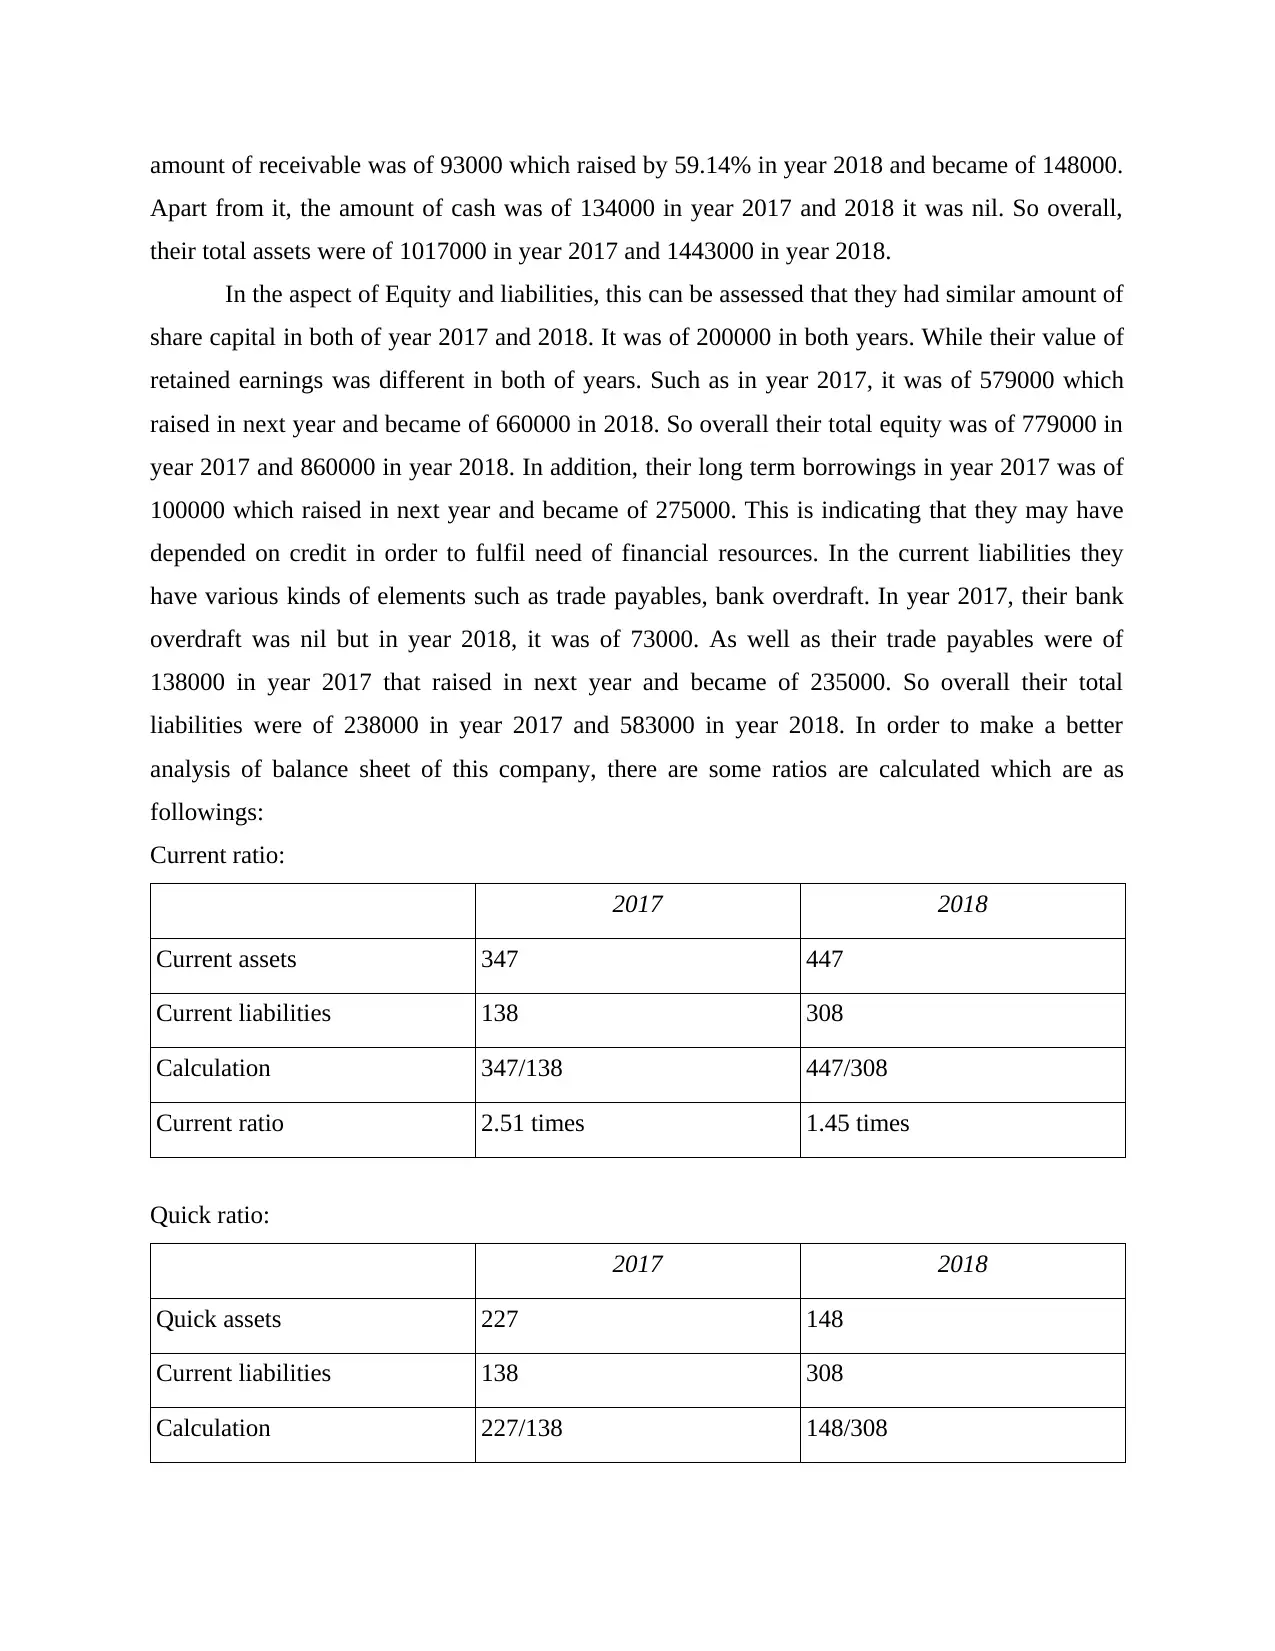
amount of receivable was of 93000 which raised by 59.14% in year 2018 and became of 148000.
Apart from it, the amount of cash was of 134000 in year 2017 and 2018 it was nil. So overall,
their total assets were of 1017000 in year 2017 and 1443000 in year 2018.
In the aspect of Equity and liabilities, this can be assessed that they had similar amount of
share capital in both of year 2017 and 2018. It was of 200000 in both years. While their value of
retained earnings was different in both of years. Such as in year 2017, it was of 579000 which
raised in next year and became of 660000 in 2018. So overall their total equity was of 779000 in
year 2017 and 860000 in year 2018. In addition, their long term borrowings in year 2017 was of
100000 which raised in next year and became of 275000. This is indicating that they may have
depended on credit in order to fulfil need of financial resources. In the current liabilities they
have various kinds of elements such as trade payables, bank overdraft. In year 2017, their bank
overdraft was nil but in year 2018, it was of 73000. As well as their trade payables were of
138000 in year 2017 that raised in next year and became of 235000. So overall their total
liabilities were of 238000 in year 2017 and 583000 in year 2018. In order to make a better
analysis of balance sheet of this company, there are some ratios are calculated which are as
followings:
Current ratio:
2017 2018
Current assets 347 447
Current liabilities 138 308
Calculation 347/138 447/308
Current ratio 2.51 times 1.45 times
Quick ratio:
2017 2018
Quick assets 227 148
Current liabilities 138 308
Calculation 227/138 148/308
⊘ This is a preview!⊘
Do you want full access?
Subscribe today to unlock all pages.
Trusted by 1+ million students worldwide
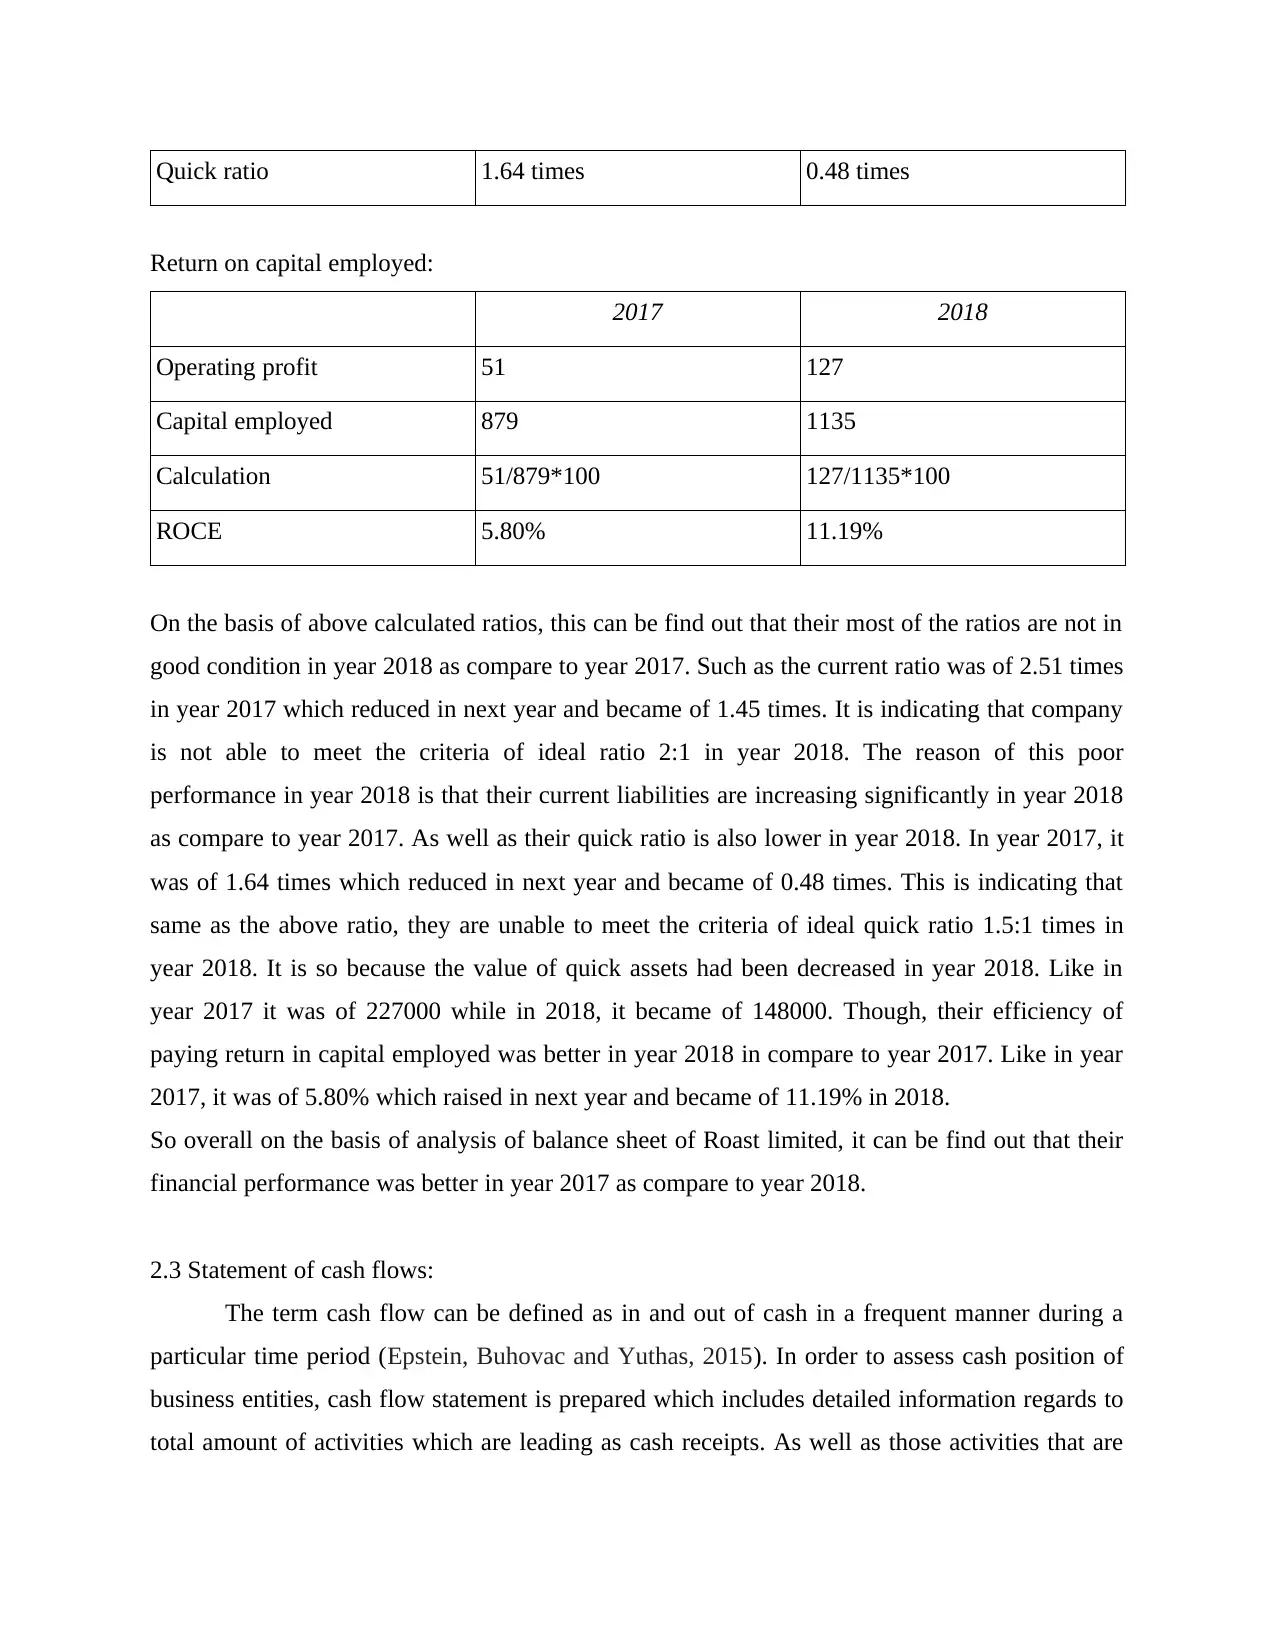
Quick ratio 1.64 times 0.48 times
Return on capital employed:
2017 2018
Operating profit 51 127
Capital employed 879 1135
Calculation 51/879*100 127/1135*100
ROCE 5.80% 11.19%
On the basis of above calculated ratios, this can be find out that their most of the ratios are not in
good condition in year 2018 as compare to year 2017. Such as the current ratio was of 2.51 times
in year 2017 which reduced in next year and became of 1.45 times. It is indicating that company
is not able to meet the criteria of ideal ratio 2:1 in year 2018. The reason of this poor
performance in year 2018 is that their current liabilities are increasing significantly in year 2018
as compare to year 2017. As well as their quick ratio is also lower in year 2018. In year 2017, it
was of 1.64 times which reduced in next year and became of 0.48 times. This is indicating that
same as the above ratio, they are unable to meet the criteria of ideal quick ratio 1.5:1 times in
year 2018. It is so because the value of quick assets had been decreased in year 2018. Like in
year 2017 it was of 227000 while in 2018, it became of 148000. Though, their efficiency of
paying return in capital employed was better in year 2018 in compare to year 2017. Like in year
2017, it was of 5.80% which raised in next year and became of 11.19% in 2018.
So overall on the basis of analysis of balance sheet of Roast limited, it can be find out that their
financial performance was better in year 2017 as compare to year 2018.
2.3 Statement of cash flows:
The term cash flow can be defined as in and out of cash in a frequent manner during a
particular time period (Epstein, Buhovac and Yuthas, 2015). In order to assess cash position of
business entities, cash flow statement is prepared which includes detailed information regards to
total amount of activities which are leading as cash receipts. As well as those activities that are
Paraphrase This Document
Need a fresh take? Get an instant paraphrase of this document with our AI Paraphraser
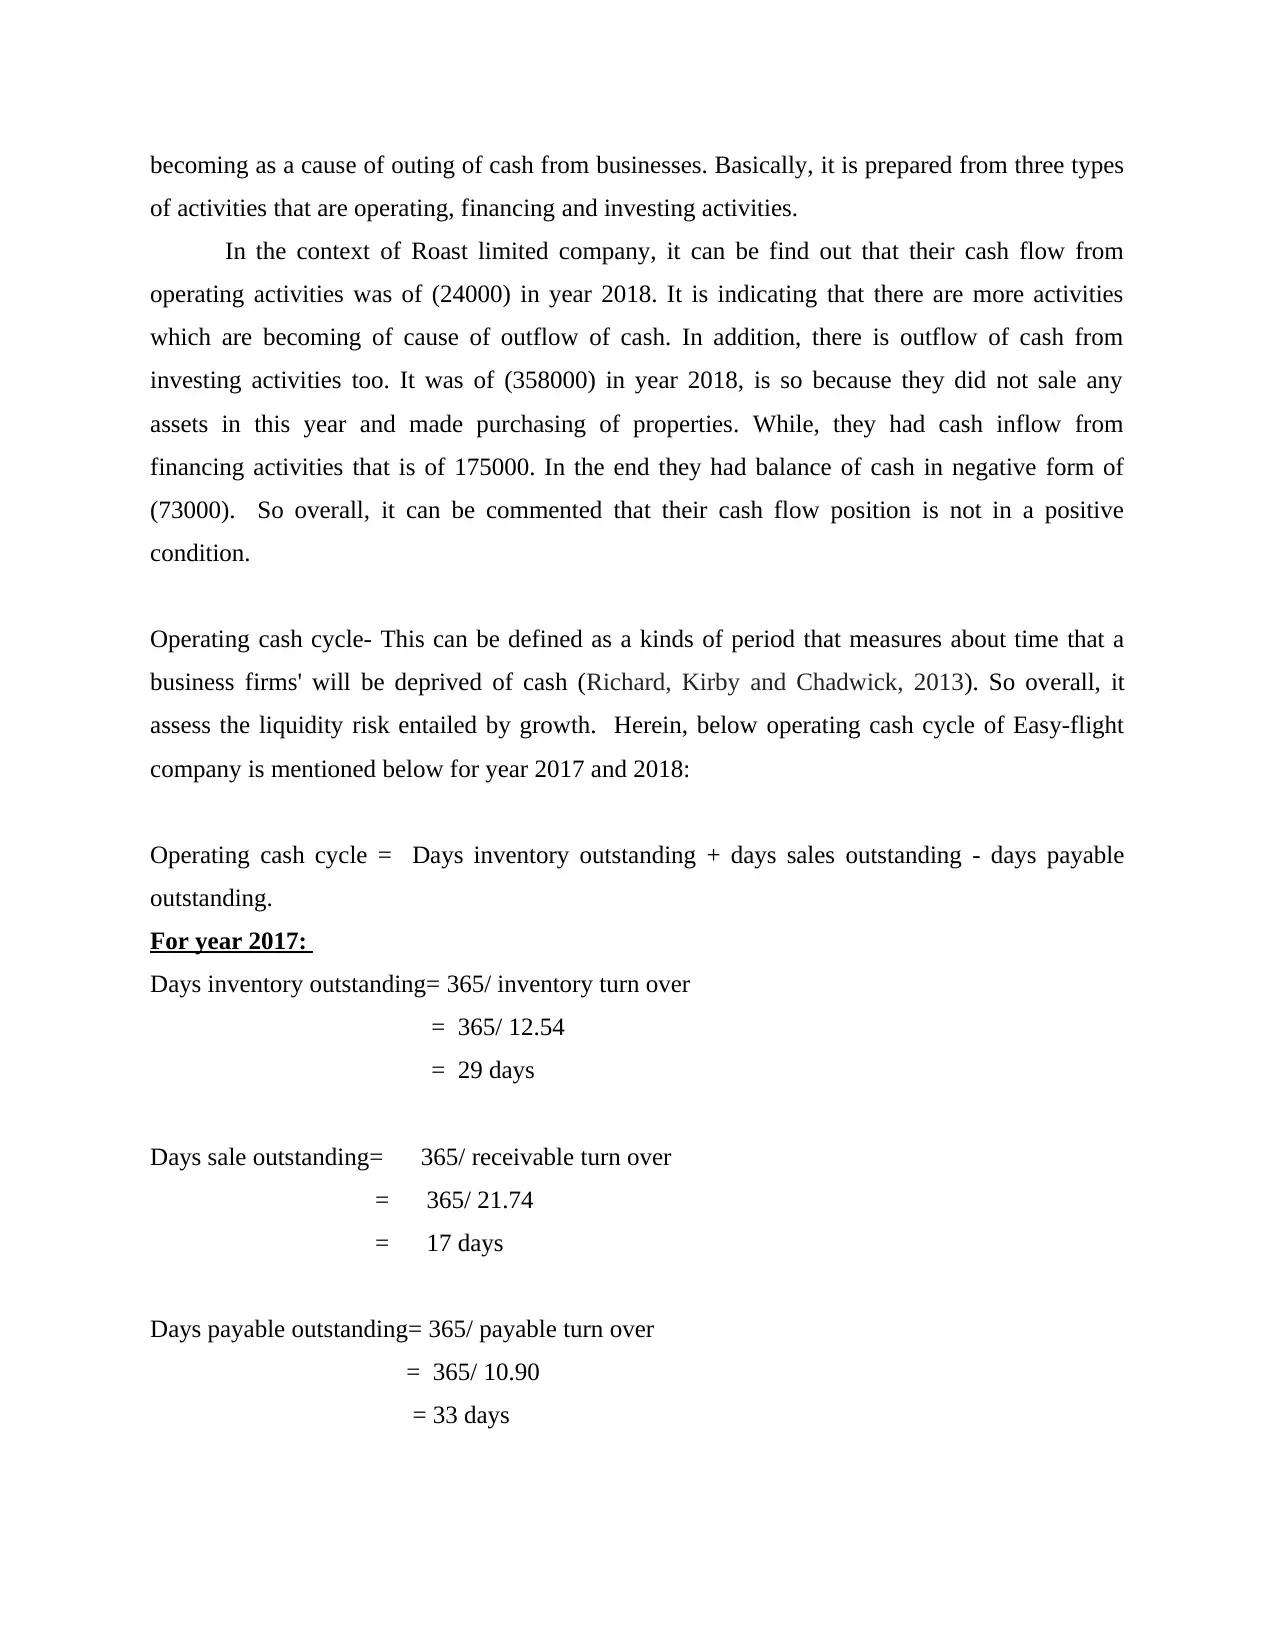
becoming as a cause of outing of cash from businesses. Basically, it is prepared from three types
of activities that are operating, financing and investing activities.
In the context of Roast limited company, it can be find out that their cash flow from
operating activities was of (24000) in year 2018. It is indicating that there are more activities
which are becoming of cause of outflow of cash. In addition, there is outflow of cash from
investing activities too. It was of (358000) in year 2018, is so because they did not sale any
assets in this year and made purchasing of properties. While, they had cash inflow from
financing activities that is of 175000. In the end they had balance of cash in negative form of
(73000). So overall, it can be commented that their cash flow position is not in a positive
condition.
Operating cash cycle- This can be defined as a kinds of period that measures about time that a
business firms' will be deprived of cash (Richard, Kirby and Chadwick, 2013). So overall, it
assess the liquidity risk entailed by growth. Herein, below operating cash cycle of Easy-flight
company is mentioned below for year 2017 and 2018:
Operating cash cycle = Days inventory outstanding + days sales outstanding - days payable
outstanding.
For year 2017:
Days inventory outstanding= 365/ inventory turn over
= 365/ 12.54
= 29 days
Days sale outstanding= 365/ receivable turn over
= 365/ 21.74
= 17 days
Days payable outstanding= 365/ payable turn over
= 365/ 10.90
= 33 days
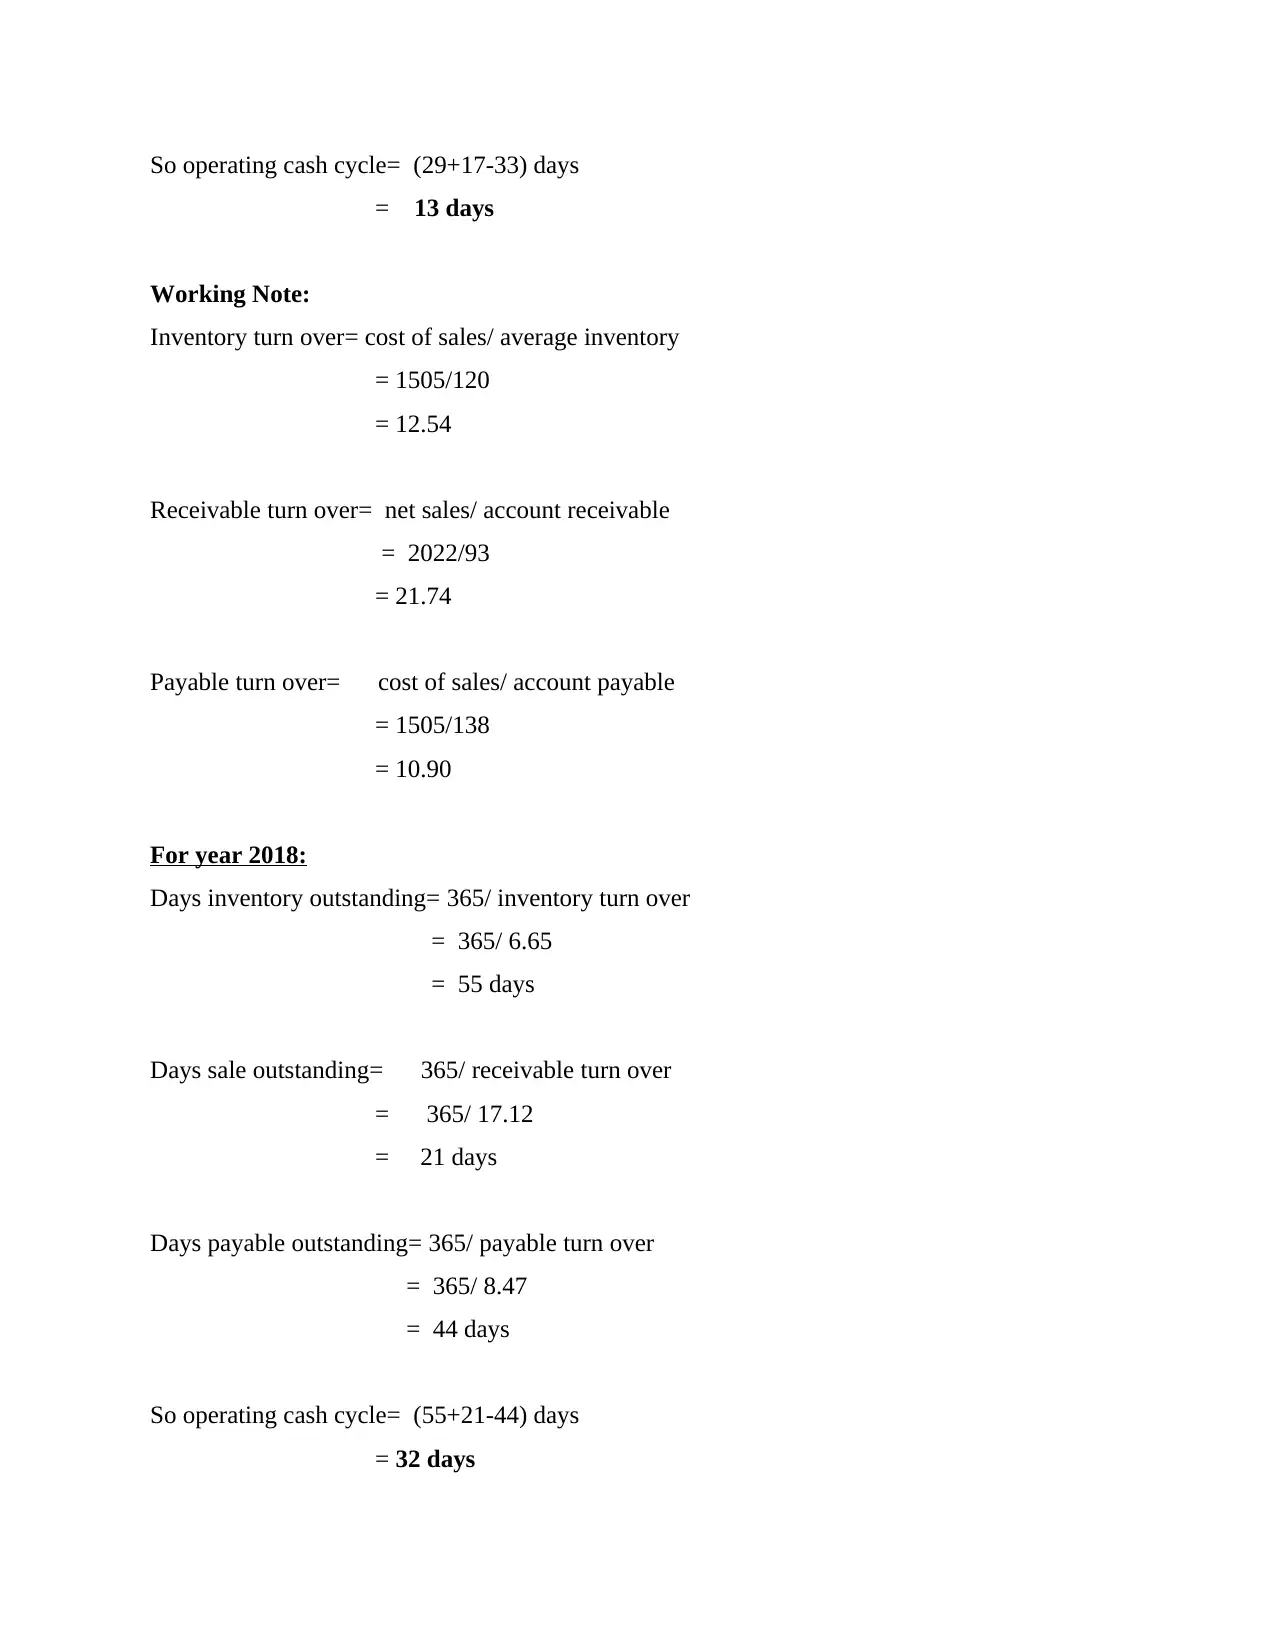
So operating cash cycle= (29+17-33) days
= 13 days
Working Note:
Inventory turn over= cost of sales/ average inventory
= 1505/120
= 12.54
Receivable turn over= net sales/ account receivable
= 2022/93
= 21.74
Payable turn over= cost of sales/ account payable
= 1505/138
= 10.90
For year 2018:
Days inventory outstanding= 365/ inventory turn over
= 365/ 6.65
= 55 days
Days sale outstanding= 365/ receivable turn over
= 365/ 17.12
= 21 days
Days payable outstanding= 365/ payable turn over
= 365/ 8.47
= 44 days
So operating cash cycle= (55+21-44) days
= 32 days
⊘ This is a preview!⊘
Do you want full access?
Subscribe today to unlock all pages.
Trusted by 1+ million students worldwide
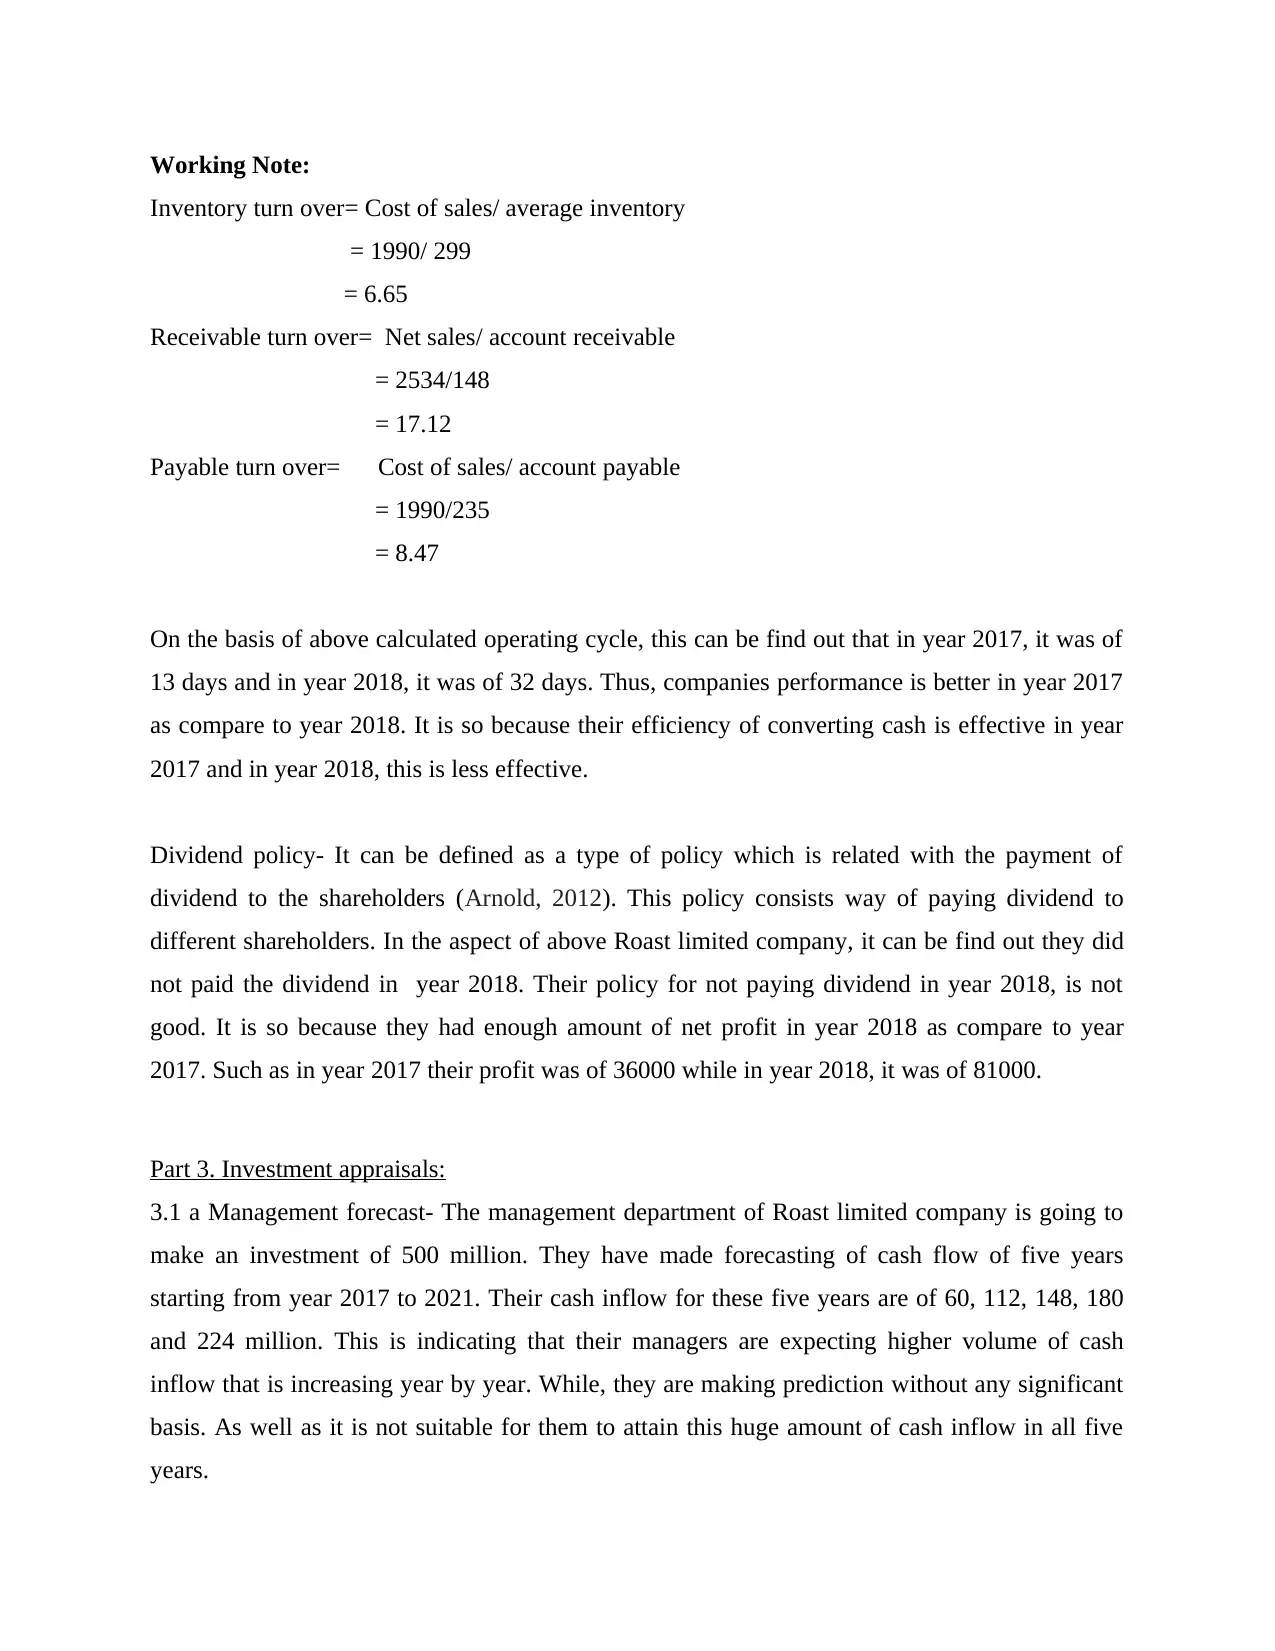
Working Note:
Inventory turn over= Cost of sales/ average inventory
= 1990/ 299
= 6.65
Receivable turn over= Net sales/ account receivable
= 2534/148
= 17.12
Payable turn over= Cost of sales/ account payable
= 1990/235
= 8.47
On the basis of above calculated operating cycle, this can be find out that in year 2017, it was of
13 days and in year 2018, it was of 32 days. Thus, companies performance is better in year 2017
as compare to year 2018. It is so because their efficiency of converting cash is effective in year
2017 and in year 2018, this is less effective.
Dividend policy- It can be defined as a type of policy which is related with the payment of
dividend to the shareholders (Arnold, 2012). This policy consists way of paying dividend to
different shareholders. In the aspect of above Roast limited company, it can be find out they did
not paid the dividend in year 2018. Their policy for not paying dividend in year 2018, is not
good. It is so because they had enough amount of net profit in year 2018 as compare to year
2017. Such as in year 2017 their profit was of 36000 while in year 2018, it was of 81000.
Part 3. Investment appraisals:
3.1 a Management forecast- The management department of Roast limited company is going to
make an investment of 500 million. They have made forecasting of cash flow of five years
starting from year 2017 to 2021. Their cash inflow for these five years are of 60, 112, 148, 180
and 224 million. This is indicating that their managers are expecting higher volume of cash
inflow that is increasing year by year. While, they are making prediction without any significant
basis. As well as it is not suitable for them to attain this huge amount of cash inflow in all five
years.
Paraphrase This Document
Need a fresh take? Get an instant paraphrase of this document with our AI Paraphraser
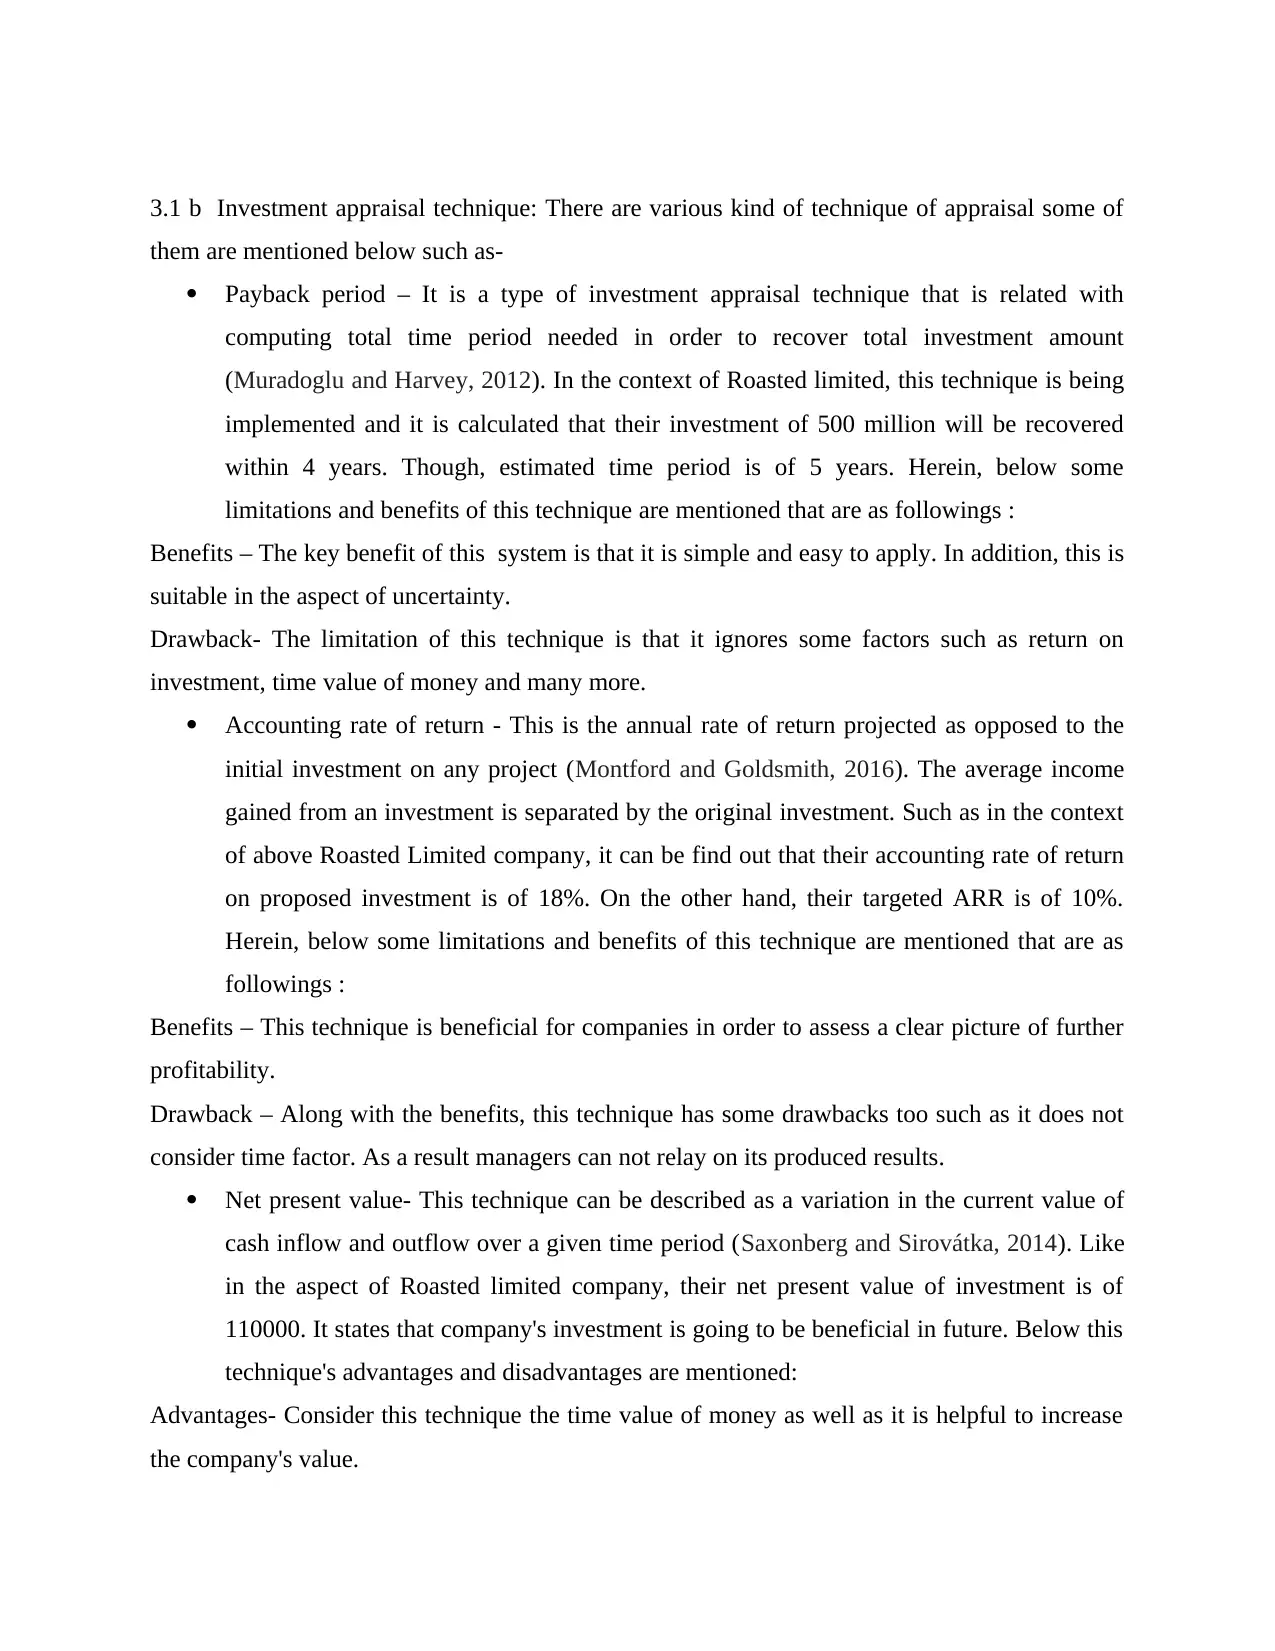
3.1 b Investment appraisal technique: There are various kind of technique of appraisal some of
them are mentioned below such as-
Payback period – It is a type of investment appraisal technique that is related with
computing total time period needed in order to recover total investment amount
(Muradoglu and Harvey, 2012). In the context of Roasted limited, this technique is being
implemented and it is calculated that their investment of 500 million will be recovered
within 4 years. Though, estimated time period is of 5 years. Herein, below some
limitations and benefits of this technique are mentioned that are as followings :
Benefits – The key benefit of this system is that it is simple and easy to apply. In addition, this is
suitable in the aspect of uncertainty.
Drawback- The limitation of this technique is that it ignores some factors such as return on
investment, time value of money and many more.
Accounting rate of return - This is the annual rate of return projected as opposed to the
initial investment on any project (Montford and Goldsmith, 2016). The average income
gained from an investment is separated by the original investment. Such as in the context
of above Roasted Limited company, it can be find out that their accounting rate of return
on proposed investment is of 18%. On the other hand, their targeted ARR is of 10%.
Herein, below some limitations and benefits of this technique are mentioned that are as
followings :
Benefits – This technique is beneficial for companies in order to assess a clear picture of further
profitability.
Drawback – Along with the benefits, this technique has some drawbacks too such as it does not
consider time factor. As a result managers can not relay on its produced results.
Net present value- This technique can be described as a variation in the current value of
cash inflow and outflow over a given time period (Saxonberg and Sirovátka, 2014). Like
in the aspect of Roasted limited company, their net present value of investment is of
110000. It states that company's investment is going to be beneficial in future. Below this
technique's advantages and disadvantages are mentioned:
Advantages- Consider this technique the time value of money as well as it is helpful to increase
the company's value.
Disadvantage- It's hard to use this system. In contrast to this form, it is difficult to calculate the
discount rate.
So overall on the basis of above mentioned investment appraisal techniques, this can be find out
that their proposal to invest 500 million can be beneficial. It is so because each technique is
providing positive result.
3.2 Source of finance.
In the aspect of financial market, there are a wide range of financial sources that are used
by business entities in order to fulfil the need of monetary needs (Lee and Lee, 2015). In the
aspect of above Roasted limited company, they can gather funds from different types of sources.
Each of them has some limitation and benefits. Herein, below some sources of finance are
mentioned that are as follows:
Long term funds- These can be defined as a type of source of funds which are acquired
by business for more then one year. It consists some source of fund like:
Equity share- It is one of the key source of long term funds for business entities. This
represents the ownership of a company. Eventually, the public limited company can raise
funds from public as equity share equity share capital by issuing ordinary equity share.
This is one of the key source of finance that is widely used by business entities in order to
gather huge amount of funds. In the context of above Roasted limited company, they can
get financial assistance by help of this source of fund. Herein, below some limitations and
benefits of this source of fund are mentioned that are as follows:
Benefits- On ordinary shares there are no specified charges connected. If a business earns
enough countable profits, a dividend can be paid but there is no obligation to pay dividend
payments.
Limitation- The corporation does not have a legal obligation to pay dividends on shares of stock.
Therefore, the probability of the investors losing the dividend is quite high.
Short term funds- These can be defined as a type of source of funds which are acquired by
business for less then one year. It consists some source of fund like :
Loans from Co-operative Banks - Co-operative banks are a great source of quick-term
funding (Dinçer and Yüksel, 2018). By getting funds from this source, it becomes easier
⊘ This is a preview!⊘
Do you want full access?
Subscribe today to unlock all pages.
Trusted by 1+ million students worldwide
1 out of 14
Related Documents


Your All-in-One AI-Powered Toolkit for Academic Success.
+13062052269
info@desklib.com
Available 24*7 on WhatsApp / Email
![[object Object]](/_next/static/media/star-bottom.7253800d.svg)
Unlock your academic potential
Copyright © 2020–2026 A2Z Services. All Rights Reserved. Developed and managed by ZUCOL.