Financial Decision Making Report: Singtel Financial Analysis
VerifiedAdded on 2020/05/28
|22
|4160
|37
Report
AI Summary
This report provides a comprehensive financial analysis of Singapore Telecommunications Limited (Singtel), examining its performance from 2012 to 2016. It begins with an introduction to Singtel and its position in the telecommunications market, followed by a trend analysis of sales revenue, profits, assets, and liabilities. The report then delves into profitability analysis, comparing Singtel's financial ratios (gross profit, net profit, return on assets, and operating ratios) to industry averages. Dividend ratios, including dividend yield, payout, and earnings per share, are analyzed and compared to a competitor, Starhub. The report assesses Singtel's short-term and long-term financial stability and liquidity using debt-to-equity, current, quick, and interest coverage ratios. Efficiency ratios such as asset turnover, inventory turnover, and debtor turnover ratios are also calculated and compared. Finally, the report examines other financial metrics such as return on investment, asset value per share, and market share price, concluding with a comparative analysis of Singtel's financial performance.
Running head: FINANCIAL DECISION MAKING
Financial decision making
Name of the student
Name of the university
Author note
Financial decision making
Name of the student
Name of the university
Author note
Paraphrase This Document
Need a fresh take? Get an instant paraphrase of this document with our AI Paraphraser
1FINANCIAL DECISION MAKING
Table of Contents
Section A....................................................................................................................................2
1. Selection of the company....................................................................................................2
2. Introduction.........................................................................................................................2
3. Trend on vertical and horizontal analysis regarding profits, sales, liabilities and assets. . .3
4. Identification of profits.......................................................................................................3
5. Identification of dividends..................................................................................................5
6. Satiability and liquidity.......................................................................................................7
7. Other ratios.......................................................................................................................10
8. Asset value per share and market share price...................................................................11
9. Non-financial parameters..................................................................................................12
10. Comparative analysis....................................................................................................13
Section B..................................................................................................................................13
Answer to Question 1...............................................................................................................13
Answer to Question 2...............................................................................................................14
Answer to Question 3...............................................................................................................14
Answer to Question 4...............................................................................................................15
Conclusion................................................................................................................................15
References................................................................................................................................17
Appendix..................................................................................................................................20
2FINANCIAL DECISION MAKING
Section A
1. Selection of the company
Singapore Telecommunication Limited, Singapore
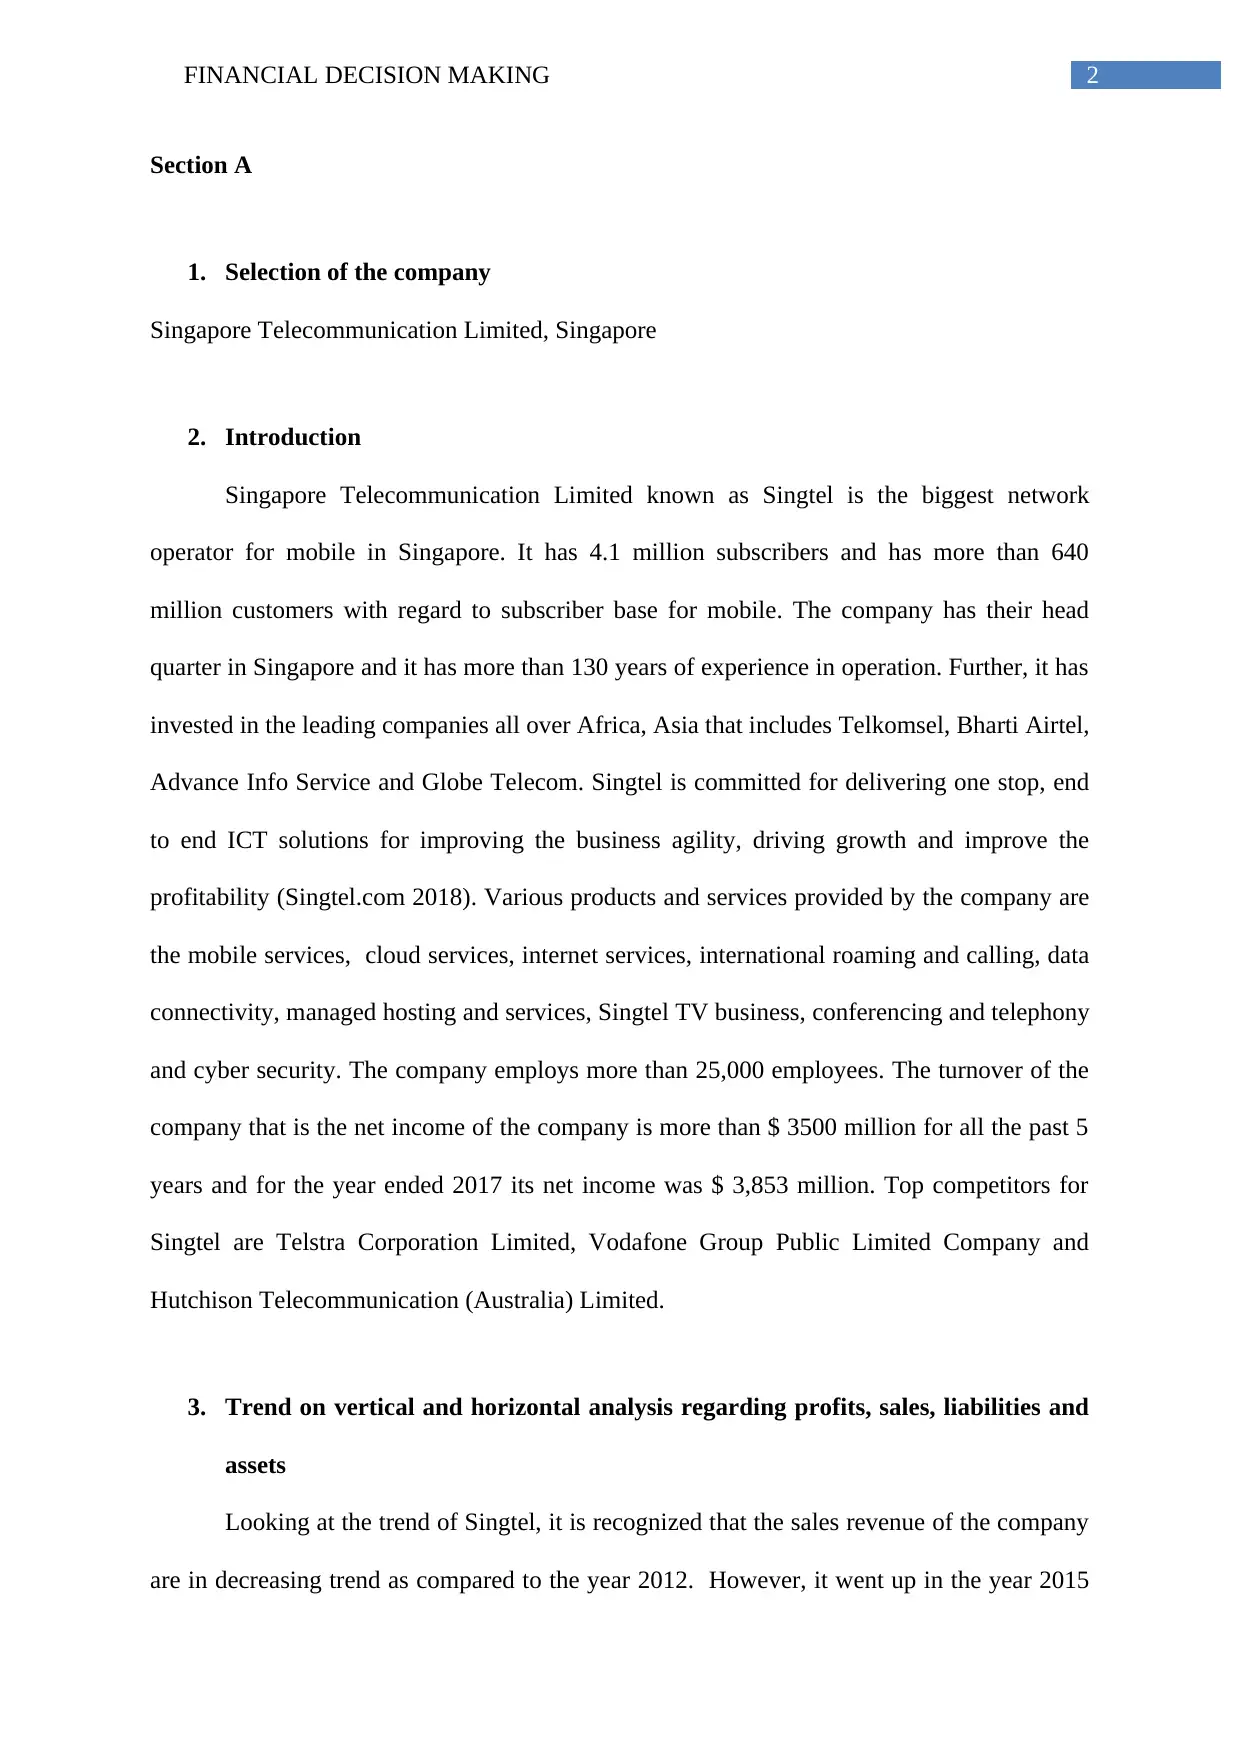
2. Introduction
Singapore Telecommunication Limited known as Singtel is the biggest network
operator for mobile in Singapore. It has 4.1 million subscribers and has more than 640
million customers with regard to subscriber base for mobile. The company has their head
quarter in Singapore and it has more than 130 years of experience in operation. Further, it has
invested in the leading companies all over Africa, Asia that includes Telkomsel, Bharti Airtel,
Advance Info Service and Globe Telecom. Singtel is committed for delivering one stop, end
to end ICT solutions for improving the business agility, driving growth and improve the
profitability (Singtel.com 2018). Various products and services provided by the company are
the mobile services, cloud services, internet services, international roaming and calling, data
connectivity, managed hosting and services, Singtel TV business, conferencing and telephony
and cyber security. The company employs more than 25,000 employees. The turnover of the
company that is the net income of the company is more than $ 3500 million for all the past 5
years and for the year ended 2017 its net income was $ 3,853 million. Top competitors for
Singtel are Telstra Corporation Limited, Vodafone Group Public Limited Company and
Hutchison Telecommunication (Australia) Limited.
3. Trend on vertical and horizontal analysis regarding profits, sales, liabilities and
assets
Looking at the trend of Singtel, it is recognized that the sales revenue of the company
are in decreasing trend as compared to the year 2012. However, it went up in the year 2015
Section A
1. Selection of the company
Singapore Telecommunication Limited, Singapore
2. Introduction
Singapore Telecommunication Limited known as Singtel is the biggest network
operator for mobile in Singapore. It has 4.1 million subscribers and has more than 640
million customers with regard to subscriber base for mobile. The company has their head
quarter in Singapore and it has more than 130 years of experience in operation. Further, it has
invested in the leading companies all over Africa, Asia that includes Telkomsel, Bharti Airtel,
Advance Info Service and Globe Telecom. Singtel is committed for delivering one stop, end
to end ICT solutions for improving the business agility, driving growth and improve the
profitability (Singtel.com 2018). Various products and services provided by the company are
the mobile services, cloud services, internet services, international roaming and calling, data
connectivity, managed hosting and services, Singtel TV business, conferencing and telephony
and cyber security. The company employs more than 25,000 employees. The turnover of the
company that is the net income of the company is more than $ 3500 million for all the past 5
years and for the year ended 2017 its net income was $ 3,853 million. Top competitors for
Singtel are Telstra Corporation Limited, Vodafone Group Public Limited Company and
Hutchison Telecommunication (Australia) Limited.
3. Trend on vertical and horizontal analysis regarding profits, sales, liabilities and
assets
Looking at the trend of Singtel, it is recognized that the sales revenue of the company
are in decreasing trend as compared to the year 2012. However, it went up in the year 2015
⊘ This is a preview!⊘
Do you want full access?
Subscribe today to unlock all pages.
Trusted by 1+ million students worldwide
3FINANCIAL DECISION MAKING
and again went down in the year 2016 (Delen, Kuzey and Uyar 2013). Whereas, the sales
trend in Singapore telecommunication industry is in increasing trend for the last 5 years. The
profit of the company through went down in 2013 as compared to 2012, after 2013 it is in
increasing trend till the year 2016. However, the industry growth with regard to the profits
was higher as compared to Singtel. On the other hand under the balance sheet the assets of
the company are in increasing trend whereas the liabilities of the companies are in decreasing
trend (Singtel.com 2018).
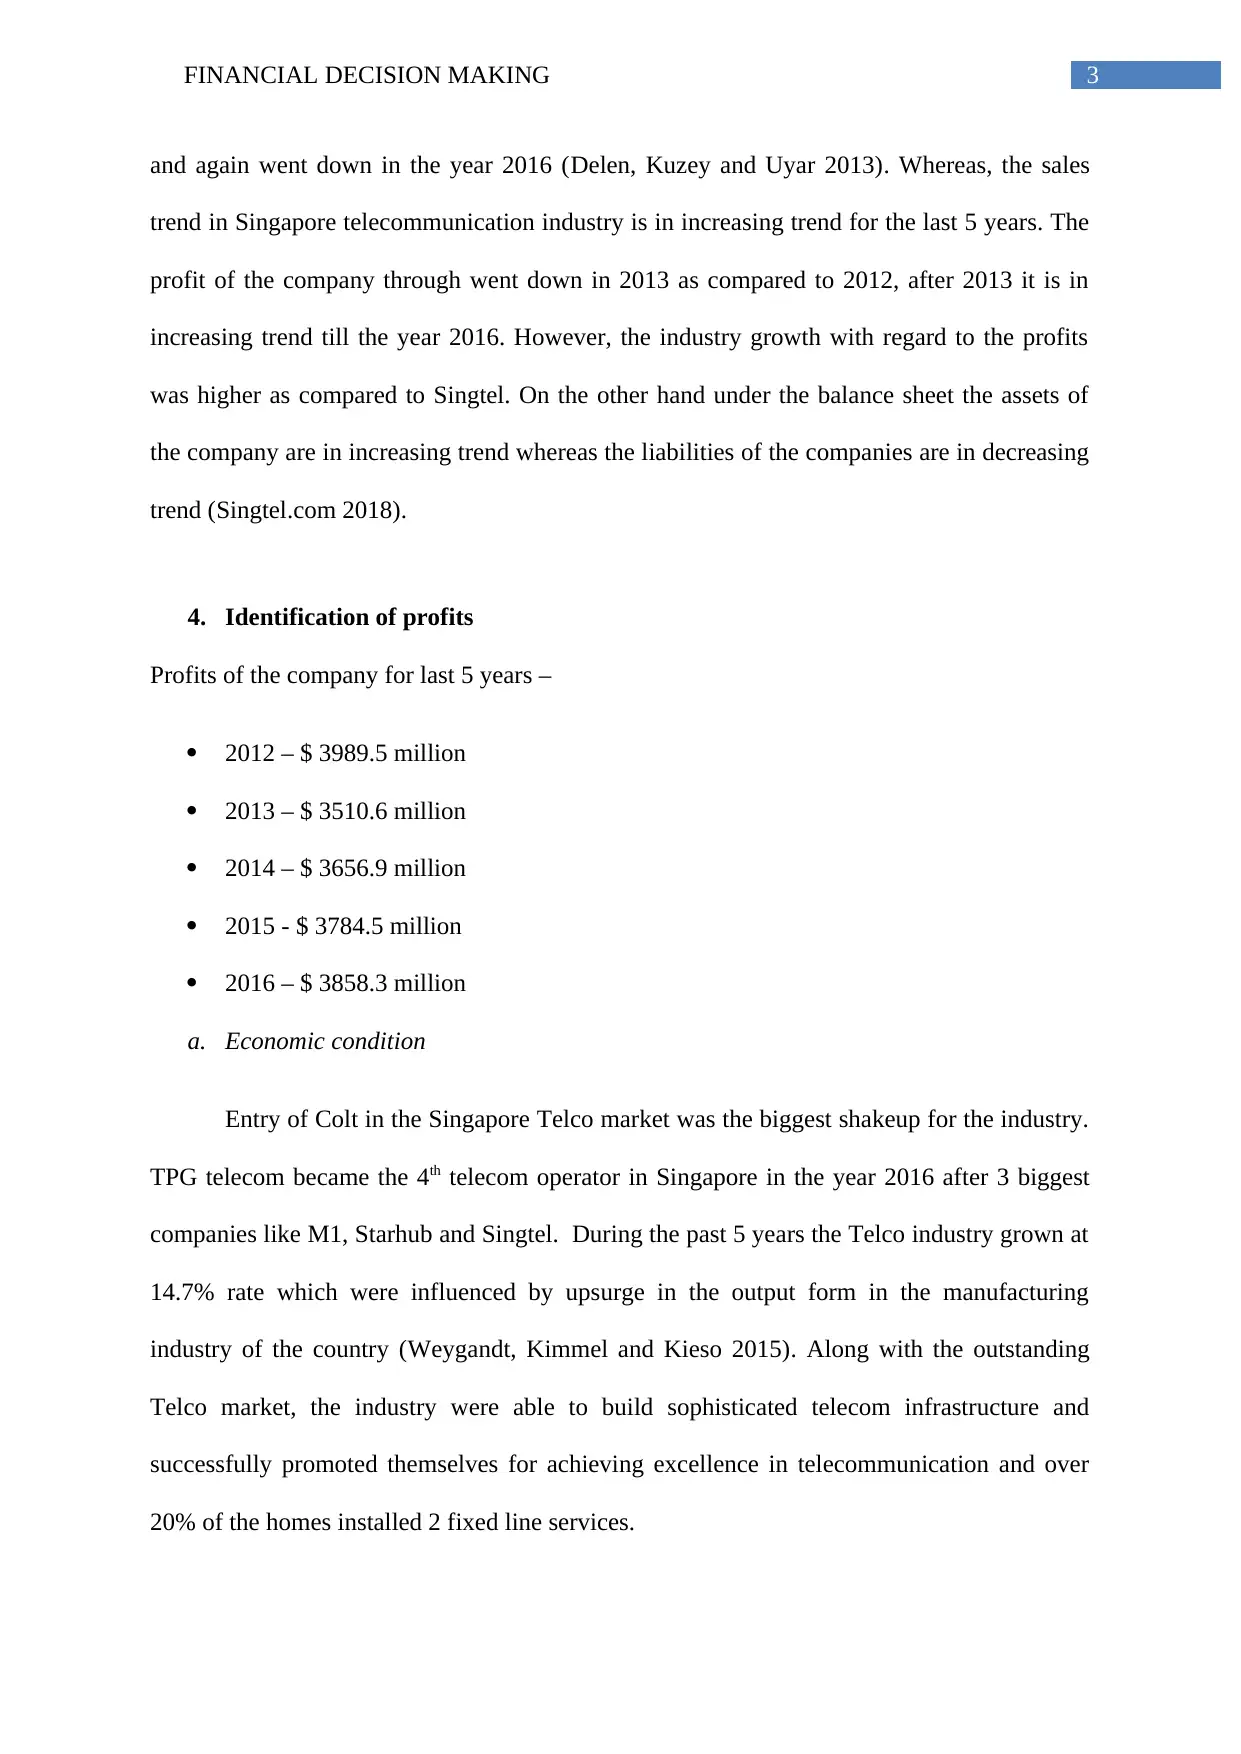
4. Identification of profits
Profits of the company for last 5 years –
2012 – $ 3989.5 million
2013 – $ 3510.6 million
2014 – $ 3656.9 million
2015 - $ 3784.5 million
2016 – $ 3858.3 million
a. Economic condition
Entry of Colt in the Singapore Telco market was the biggest shakeup for the industry.
TPG telecom became the 4th telecom operator in Singapore in the year 2016 after 3 biggest
companies like M1, Starhub and Singtel. During the past 5 years the Telco industry grown at
14.7% rate which were influenced by upsurge in the output form in the manufacturing
industry of the country (Weygandt, Kimmel and Kieso 2015). Along with the outstanding
Telco market, the industry were able to build sophisticated telecom infrastructure and
successfully promoted themselves for achieving excellence in telecommunication and over
20% of the homes installed 2 fixed line services.
and again went down in the year 2016 (Delen, Kuzey and Uyar 2013). Whereas, the sales
trend in Singapore telecommunication industry is in increasing trend for the last 5 years. The
profit of the company through went down in 2013 as compared to 2012, after 2013 it is in
increasing trend till the year 2016. However, the industry growth with regard to the profits
was higher as compared to Singtel. On the other hand under the balance sheet the assets of
the company are in increasing trend whereas the liabilities of the companies are in decreasing
trend (Singtel.com 2018).
4. Identification of profits
Profits of the company for last 5 years –
2012 – $ 3989.5 million
2013 – $ 3510.6 million
2014 – $ 3656.9 million
2015 - $ 3784.5 million
2016 – $ 3858.3 million
a. Economic condition
Entry of Colt in the Singapore Telco market was the biggest shakeup for the industry.
TPG telecom became the 4th telecom operator in Singapore in the year 2016 after 3 biggest
companies like M1, Starhub and Singtel. During the past 5 years the Telco industry grown at
14.7% rate which were influenced by upsurge in the output form in the manufacturing
industry of the country (Weygandt, Kimmel and Kieso 2015). Along with the outstanding
Telco market, the industry were able to build sophisticated telecom infrastructure and
successfully promoted themselves for achieving excellence in telecommunication and over
20% of the homes installed 2 fixed line services.
Paraphrase This Document
Need a fresh take? Get an instant paraphrase of this document with our AI Paraphraser
4FINANCIAL DECISION MAKING
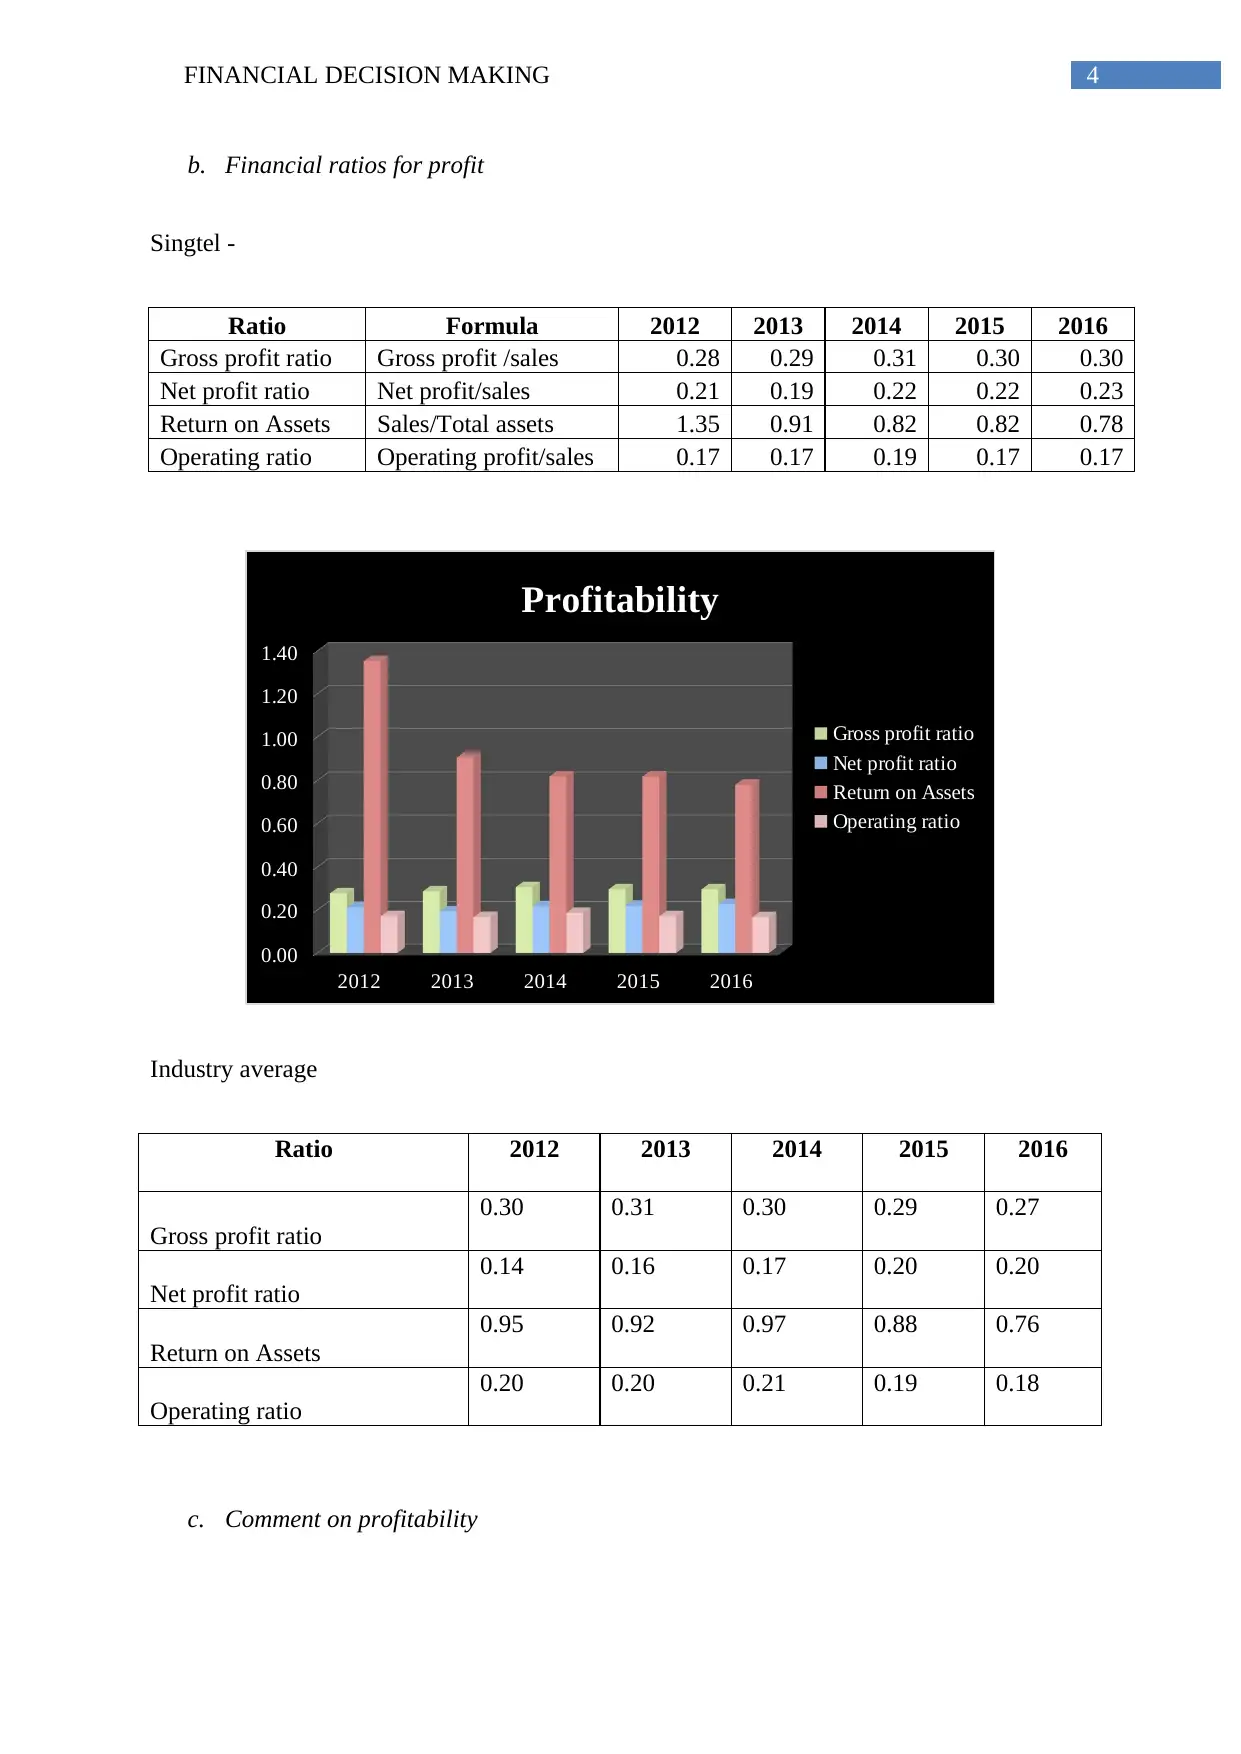
b. Financial ratios for profit
Singtel -
Ratio Formula 2012 2013 2014 2015 2016
Gross profit ratio Gross profit /sales 0.28 0.29 0.31 0.30 0.30
Net profit ratio Net profit/sales 0.21 0.19 0.22 0.22 0.23
Return on Assets Sales/Total assets 1.35 0.91 0.82 0.82 0.78
Operating ratio Operating profit/sales 0.17 0.17 0.19 0.17 0.17
2012 2013 2014 2015 2016
0.00
0.20
0.40
0.60
0.80
1.00
1.20
1.40
Profitability
Gross profit ratio
Net profit ratio
Return on Assets
Operating ratio
Industry average
Ratio 2012 2013 2014 2015 2016
Gross profit ratio
0.30 0.31 0.30 0.29 0.27
Net profit ratio
0.14 0.16 0.17 0.20 0.20
Return on Assets
0.95 0.92 0.97 0.88 0.76
Operating ratio
0.20 0.20 0.21 0.19 0.18
c. Comment on profitability
5FINANCIAL DECISION MAKING
From the above tables it can be identified that the gross profit ratio of the company is
moving between 0.28 and 0.31 whereas the industry average for the same is moving between
0.27 and 0.31. Therefore, the gross profit ratio of the company is more or same with the
industry average. On the other hand the net profit ratio of Singtel is high as compared to the
industry average for the last 5 years. The net profit ratio of the company as well as the
industry both are in increasing trend except the net profit of Singtel for the year 2013 that was
in decreasing trend (Singtel.com 2018). Return on assets of Singtel for 2012 is significantly
higher as compared to the industry and for the years from 2013 to 2016 the ratios were as per
the industry average. Finally the operating ratios of the company for all the 5 years were
lower as compared to the industry average. Therefore, the company shall control the
operating expenses to achieve the operating ratio as per the industry average.
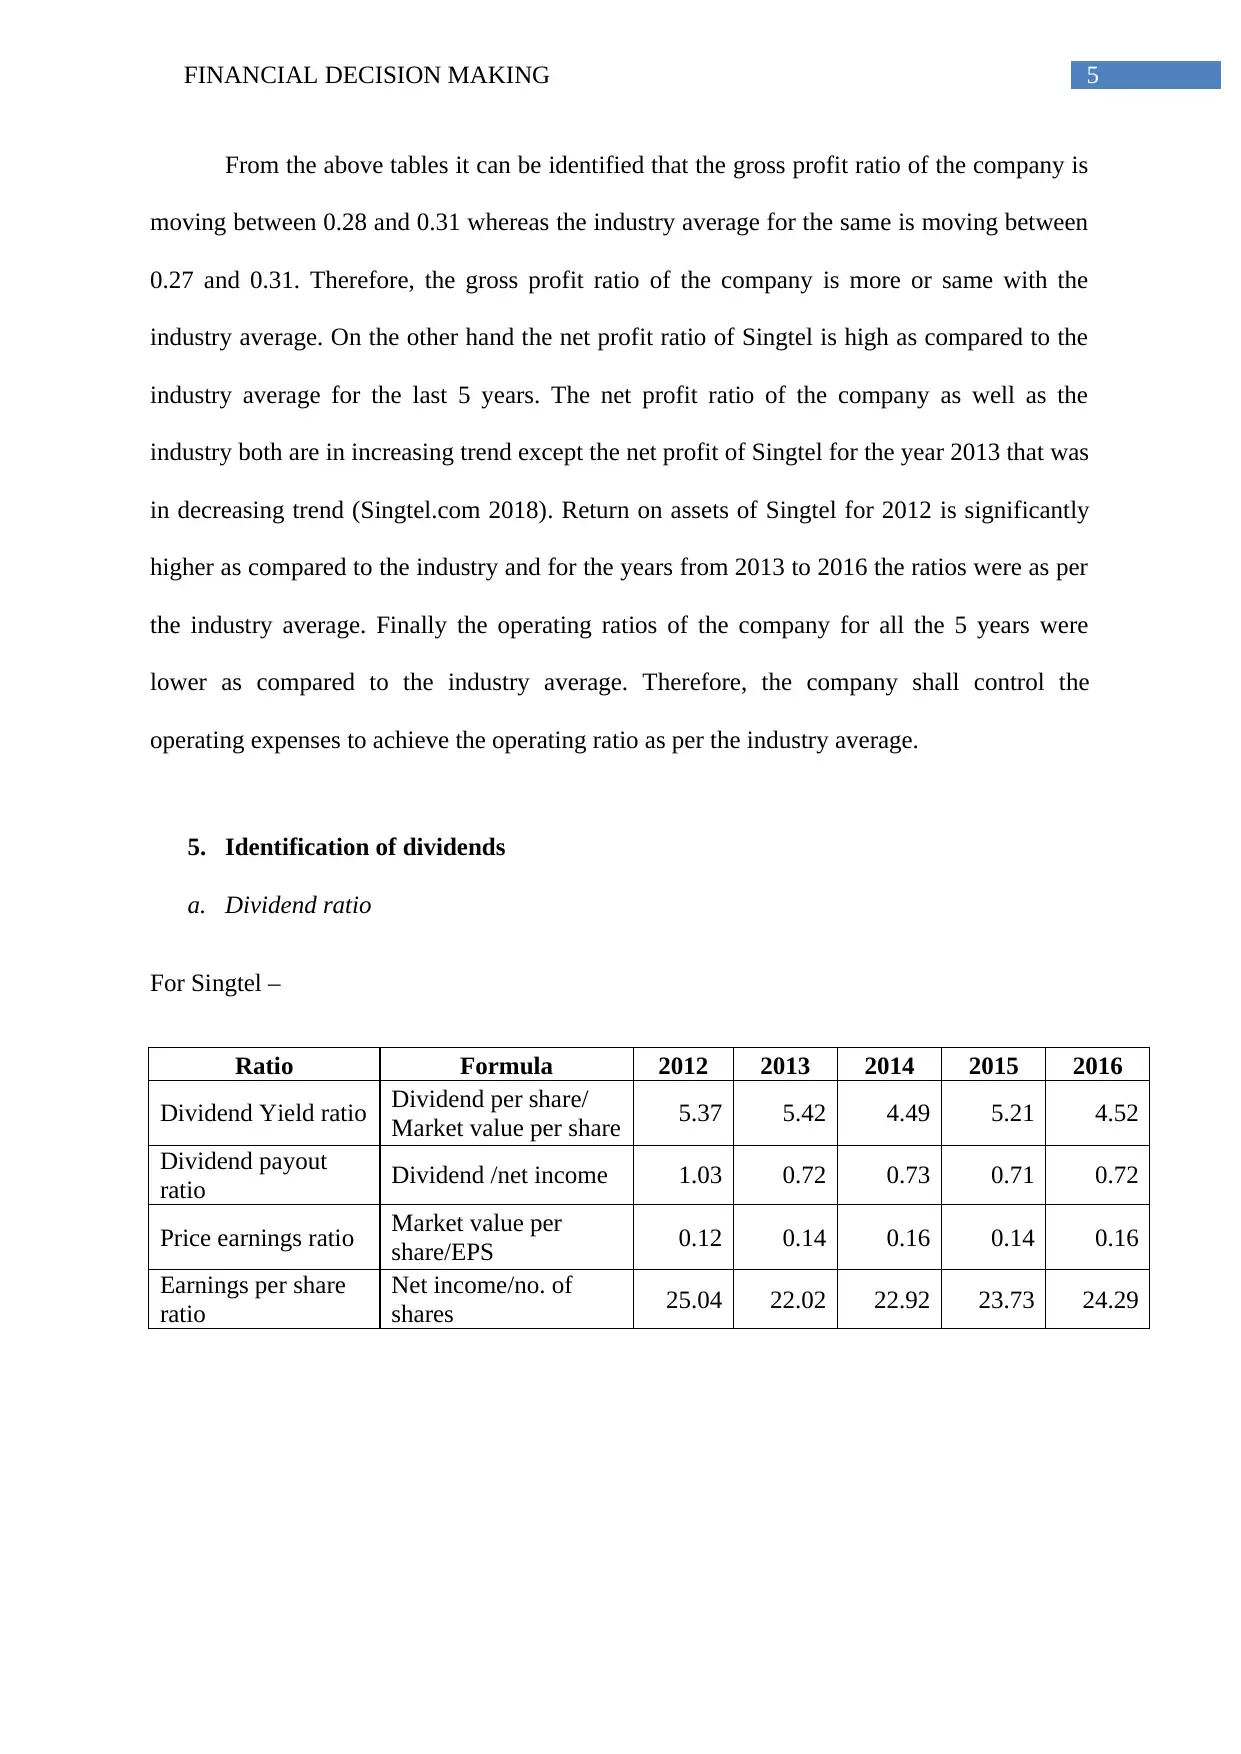
5. Identification of dividends
a. Dividend ratio
For Singtel –
Ratio Formula 2012 2013 2014 2015 2016
Dividend Yield ratio Dividend per share/
Market value per share 5.37 5.42 4.49 5.21 4.52
Dividend payout
ratio Dividend /net income 1.03 0.72 0.73 0.71 0.72
Price earnings ratio Market value per
share/EPS 0.12 0.14 0.16 0.14 0.16
Earnings per share
ratio
Net income/no. of
shares 25.04 22.02 22.92 23.73 24.29
From the above tables it can be identified that the gross profit ratio of the company is
moving between 0.28 and 0.31 whereas the industry average for the same is moving between
0.27 and 0.31. Therefore, the gross profit ratio of the company is more or same with the
industry average. On the other hand the net profit ratio of Singtel is high as compared to the
industry average for the last 5 years. The net profit ratio of the company as well as the
industry both are in increasing trend except the net profit of Singtel for the year 2013 that was
in decreasing trend (Singtel.com 2018). Return on assets of Singtel for 2012 is significantly
higher as compared to the industry and for the years from 2013 to 2016 the ratios were as per
the industry average. Finally the operating ratios of the company for all the 5 years were
lower as compared to the industry average. Therefore, the company shall control the
operating expenses to achieve the operating ratio as per the industry average.
5. Identification of dividends
a. Dividend ratio
For Singtel –
Ratio Formula 2012 2013 2014 2015 2016
Dividend Yield ratio Dividend per share/
Market value per share 5.37 5.42 4.49 5.21 4.52
Dividend payout
ratio Dividend /net income 1.03 0.72 0.73 0.71 0.72
Price earnings ratio Market value per
share/EPS 0.12 0.14 0.16 0.14 0.16
Earnings per share
ratio
Net income/no. of
shares 25.04 22.02 22.92 23.73 24.29
⊘ This is a preview!⊘
Do you want full access?
Subscribe today to unlock all pages.
Trusted by 1+ million students worldwide
6FINANCIAL DECISION MAKING
2012 2013 2014 2015 2016
0.00
5.00
10.00
15.00
20.00
25.00
30.00
Dividend
Dividend Yield ratio
Dividend payout ratio
Price earning ratio
Earning per share ratio
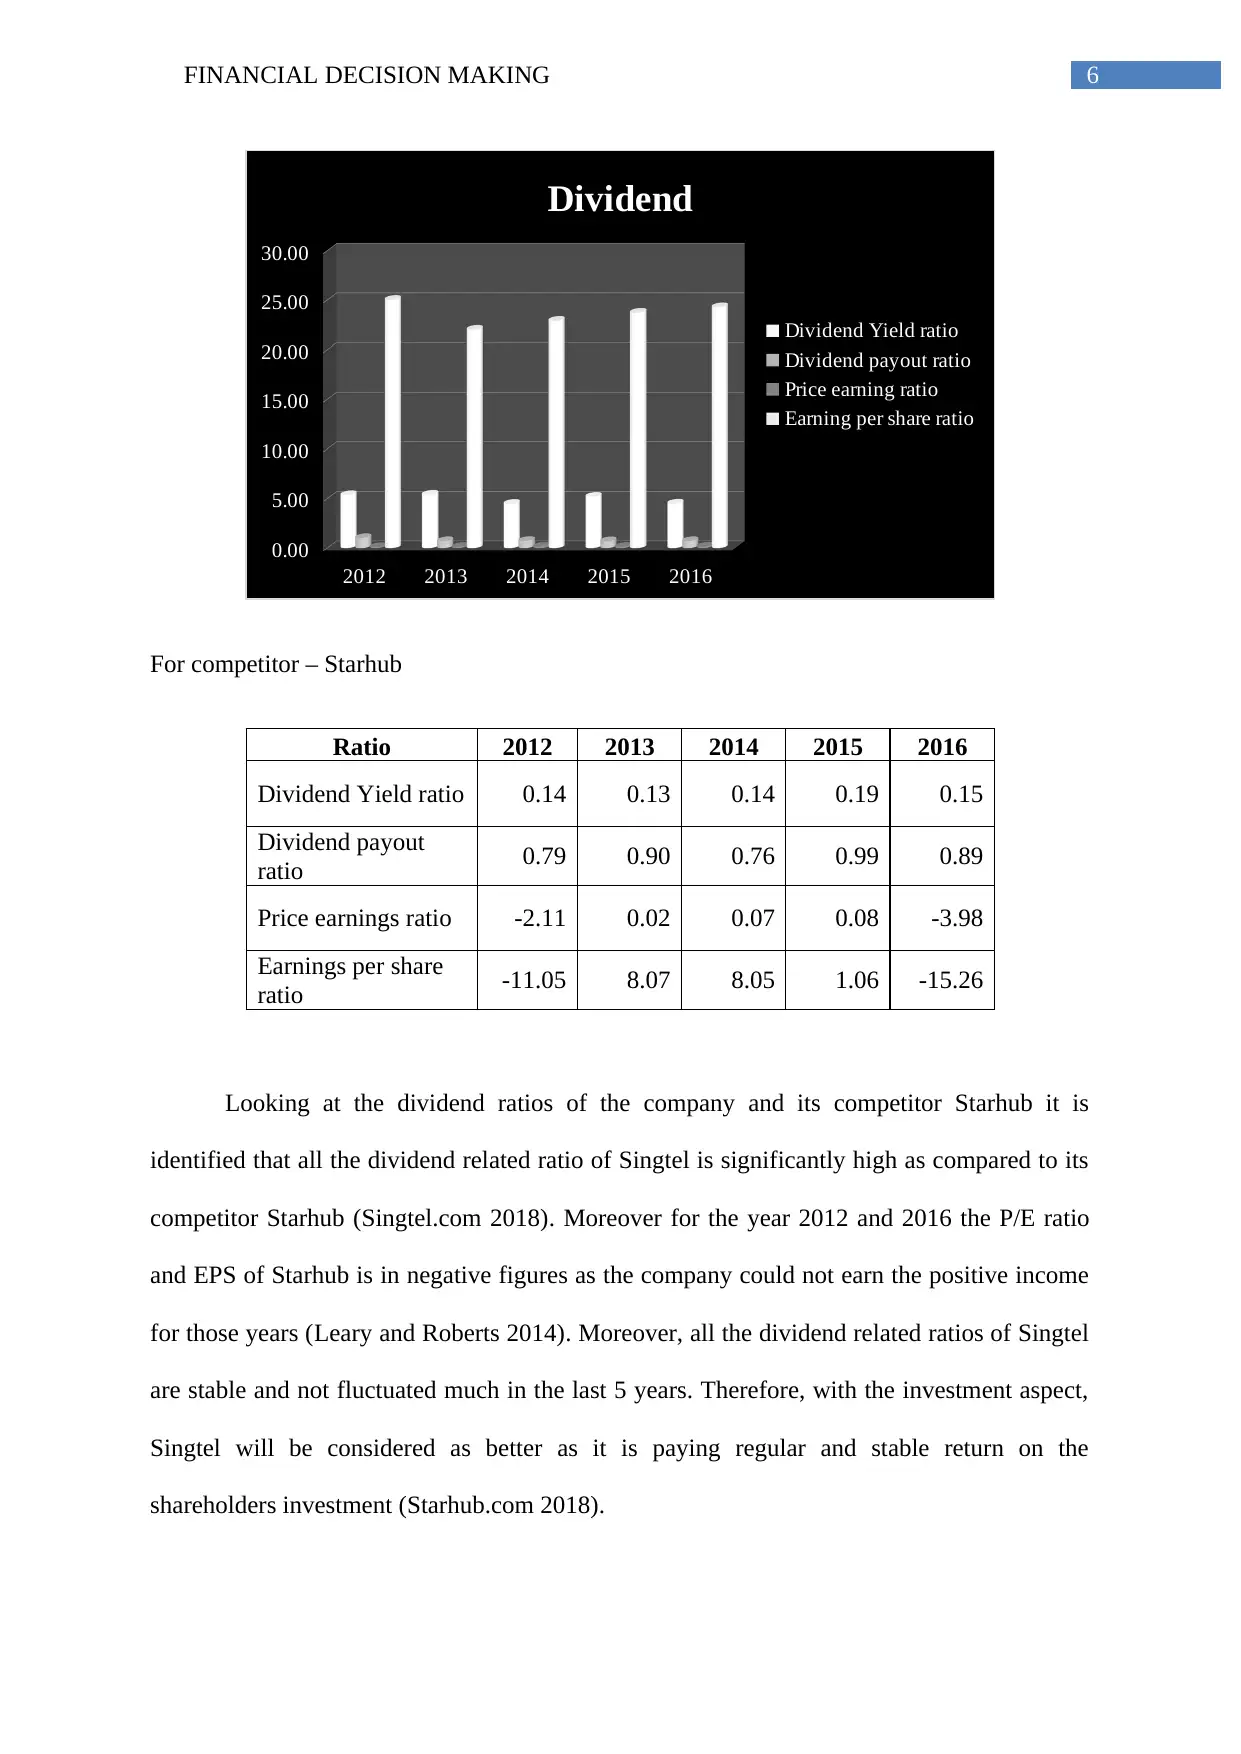
For competitor – Starhub
Ratio 2012 2013 2014 2015 2016
Dividend Yield ratio 0.14 0.13 0.14 0.19 0.15
Dividend payout
ratio 0.79 0.90 0.76 0.99 0.89
Price earnings ratio -2.11 0.02 0.07 0.08 -3.98
Earnings per share
ratio -11.05 8.07 8.05 1.06 -15.26
Looking at the dividend ratios of the company and its competitor Starhub it is
identified that all the dividend related ratio of Singtel is significantly high as compared to its
competitor Starhub (Singtel.com 2018). Moreover for the year 2012 and 2016 the P/E ratio
and EPS of Starhub is in negative figures as the company could not earn the positive income
for those years (Leary and Roberts 2014). Moreover, all the dividend related ratios of Singtel
are stable and not fluctuated much in the last 5 years. Therefore, with the investment aspect,
Singtel will be considered as better as it is paying regular and stable return on the
shareholders investment (Starhub.com 2018).
2012 2013 2014 2015 2016
0.00
5.00
10.00
15.00
20.00
25.00
30.00
Dividend
Dividend Yield ratio
Dividend payout ratio
Price earning ratio
Earning per share ratio
For competitor – Starhub
Ratio 2012 2013 2014 2015 2016
Dividend Yield ratio 0.14 0.13 0.14 0.19 0.15
Dividend payout
ratio 0.79 0.90 0.76 0.99 0.89
Price earnings ratio -2.11 0.02 0.07 0.08 -3.98
Earnings per share
ratio -11.05 8.07 8.05 1.06 -15.26
Looking at the dividend ratios of the company and its competitor Starhub it is
identified that all the dividend related ratio of Singtel is significantly high as compared to its
competitor Starhub (Singtel.com 2018). Moreover for the year 2012 and 2016 the P/E ratio
and EPS of Starhub is in negative figures as the company could not earn the positive income
for those years (Leary and Roberts 2014). Moreover, all the dividend related ratios of Singtel
are stable and not fluctuated much in the last 5 years. Therefore, with the investment aspect,
Singtel will be considered as better as it is paying regular and stable return on the
shareholders investment (Starhub.com 2018).
Paraphrase This Document
Need a fresh take? Get an instant paraphrase of this document with our AI Paraphraser
7FINANCIAL DECISION MAKING
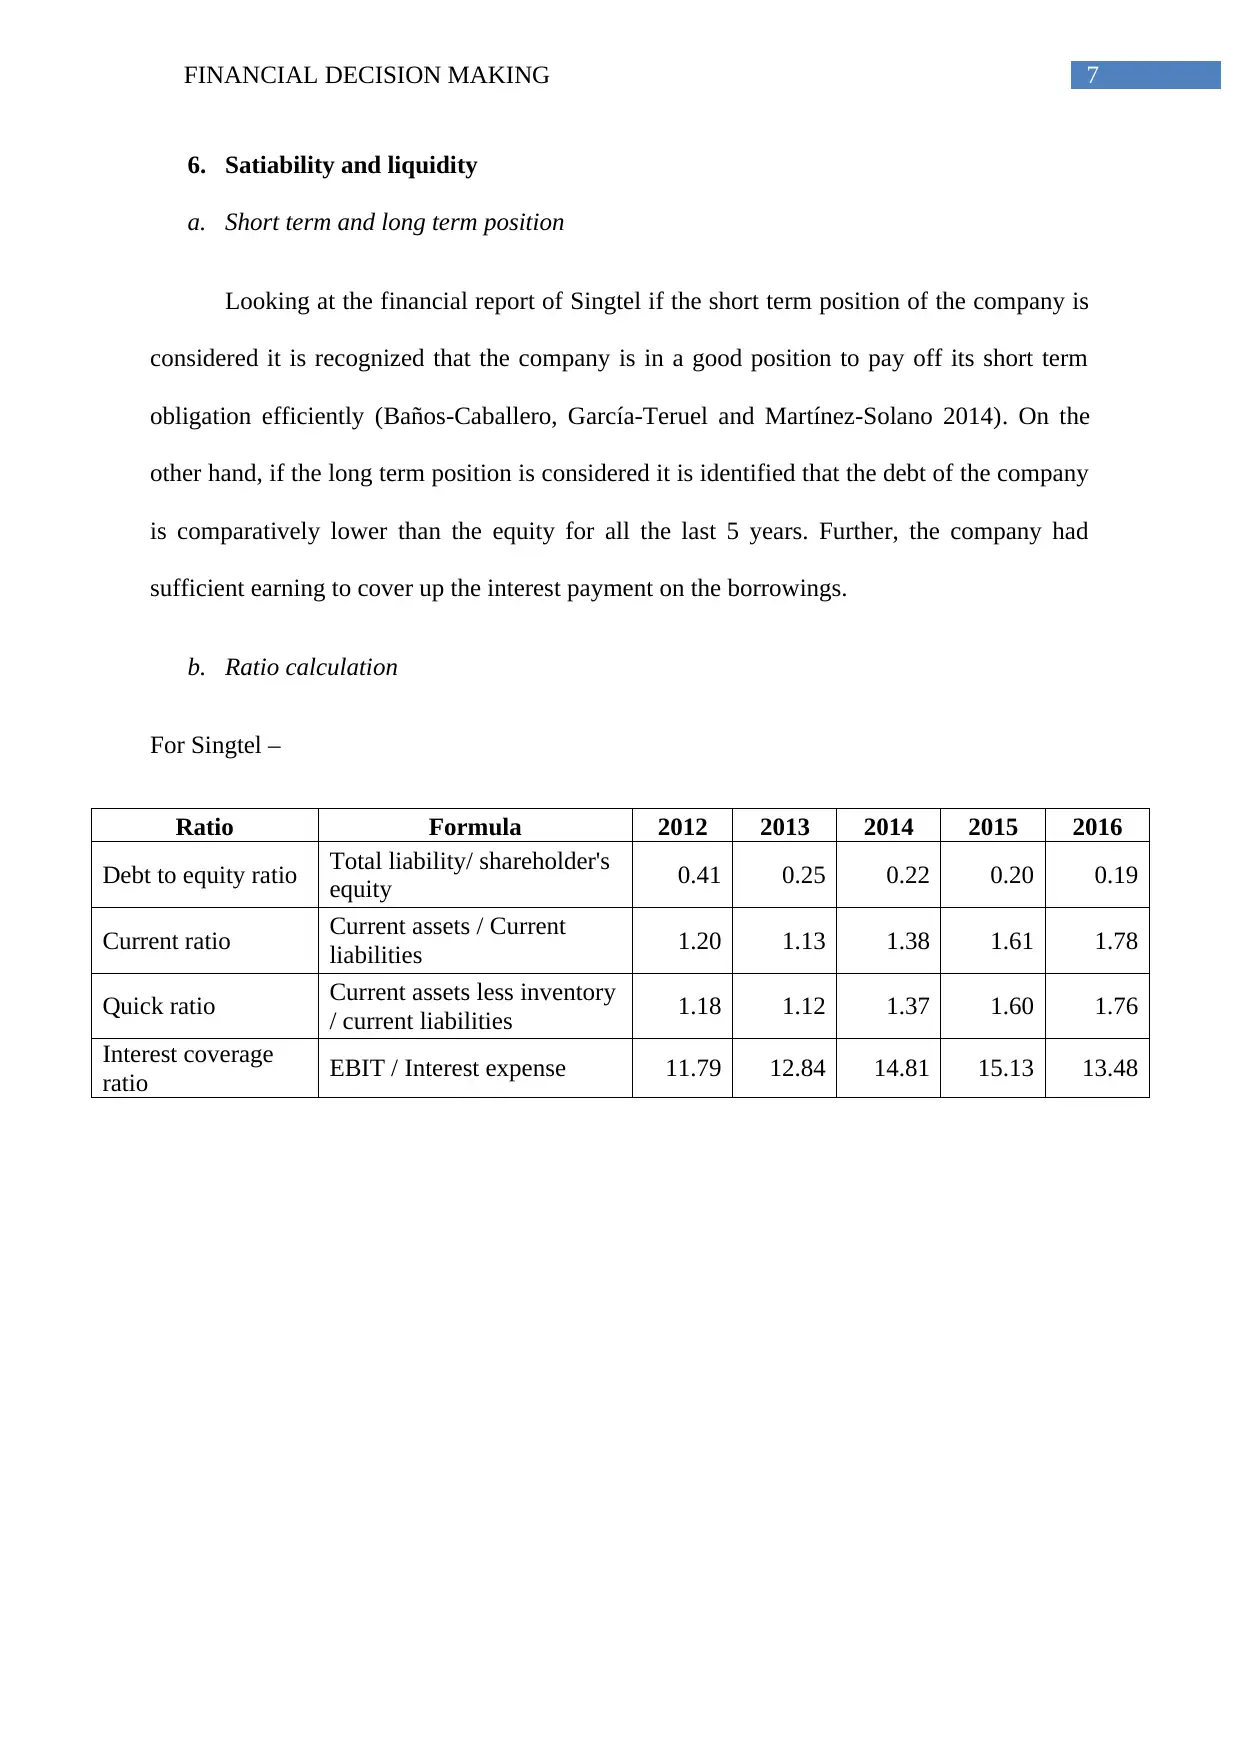
6. Satiability and liquidity
a. Short term and long term position
Looking at the financial report of Singtel if the short term position of the company is
considered it is recognized that the company is in a good position to pay off its short term
obligation efficiently (Baños-Caballero, García-Teruel and Martínez-Solano 2014). On the
other hand, if the long term position is considered it is identified that the debt of the company
is comparatively lower than the equity for all the last 5 years. Further, the company had
sufficient earning to cover up the interest payment on the borrowings.
b. Ratio calculation
For Singtel –
Ratio Formula 2012 2013 2014 2015 2016
Debt to equity ratio Total liability/ shareholder's
equity 0.41 0.25 0.22 0.20 0.19
Current ratio Current assets / Current
liabilities 1.20 1.13 1.38 1.61 1.78
Quick ratio Current assets less inventory
/ current liabilities 1.18 1.12 1.37 1.60 1.76
Interest coverage
ratio EBIT / Interest expense 11.79 12.84 14.81 15.13 13.48
8FINANCIAL DECISION MAKING
2012 2013 2014 2015 2016
0.00
2.00
4.00
6.00
8.00
10.00
12.00
14.00
16.00
Debt to equity ratio
Quick ratio
Stability and liquidity
Debt to equity ratio
Current ratio
Quick ratio
Interest coverage ratio
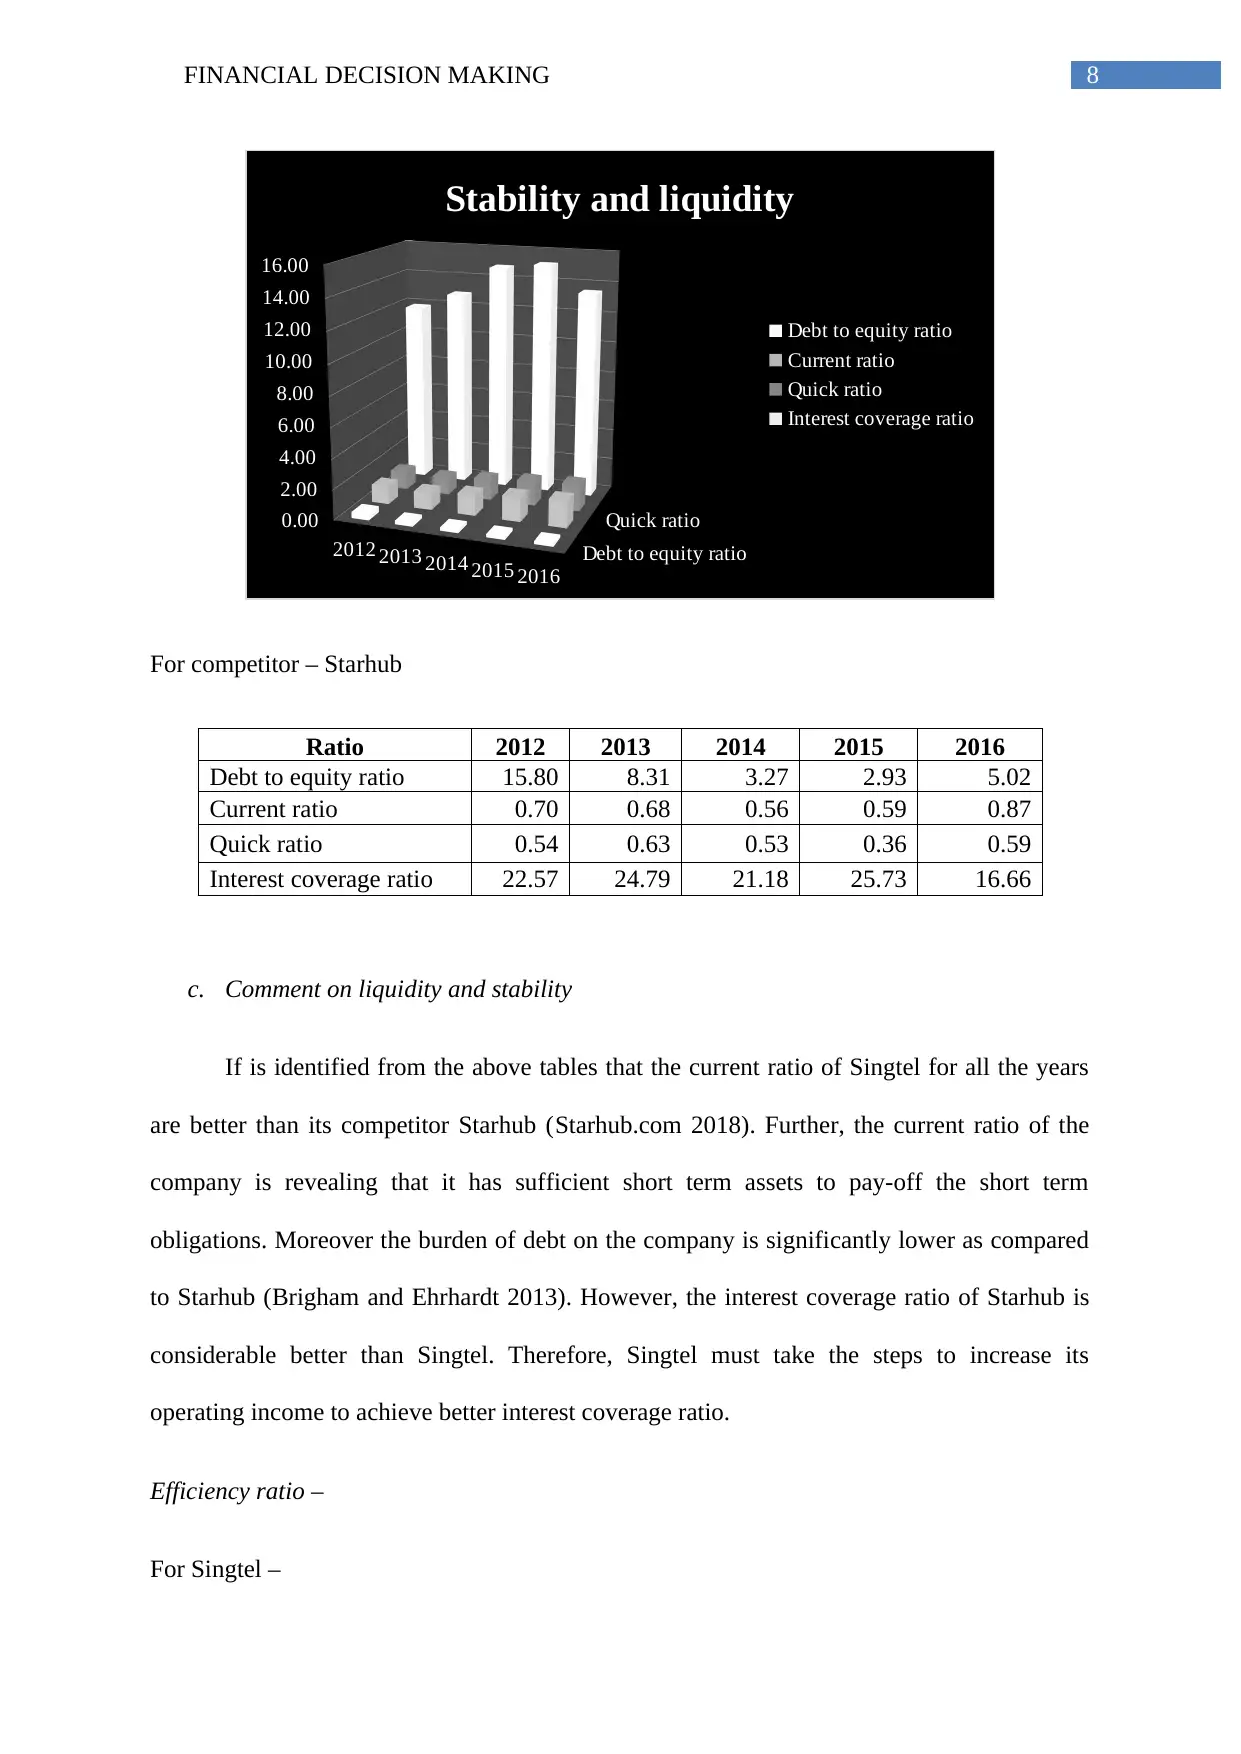
For competitor – Starhub
Ratio 2012 2013 2014 2015 2016
Debt to equity ratio 15.80 8.31 3.27 2.93 5.02
Current ratio 0.70 0.68 0.56 0.59 0.87
Quick ratio 0.54 0.63 0.53 0.36 0.59
Interest coverage ratio 22.57 24.79 21.18 25.73 16.66
c. Comment on liquidity and stability
If is identified from the above tables that the current ratio of Singtel for all the years
are better than its competitor Starhub (Starhub.com 2018). Further, the current ratio of the
company is revealing that it has sufficient short term assets to pay-off the short term
obligations. Moreover the burden of debt on the company is significantly lower as compared
to Starhub (Brigham and Ehrhardt 2013). However, the interest coverage ratio of Starhub is
considerable better than Singtel. Therefore, Singtel must take the steps to increase its
operating income to achieve better interest coverage ratio.
Efficiency ratio –
For Singtel –
2012 2013 2014 2015 2016
0.00
2.00
4.00
6.00
8.00
10.00
12.00
14.00
16.00
Debt to equity ratio
Quick ratio
Stability and liquidity
Debt to equity ratio
Current ratio
Quick ratio
Interest coverage ratio
For competitor – Starhub
Ratio 2012 2013 2014 2015 2016
Debt to equity ratio 15.80 8.31 3.27 2.93 5.02
Current ratio 0.70 0.68 0.56 0.59 0.87
Quick ratio 0.54 0.63 0.53 0.36 0.59
Interest coverage ratio 22.57 24.79 21.18 25.73 16.66
c. Comment on liquidity and stability
If is identified from the above tables that the current ratio of Singtel for all the years
are better than its competitor Starhub (Starhub.com 2018). Further, the current ratio of the
company is revealing that it has sufficient short term assets to pay-off the short term
obligations. Moreover the burden of debt on the company is significantly lower as compared
to Starhub (Brigham and Ehrhardt 2013). However, the interest coverage ratio of Starhub is
considerable better than Singtel. Therefore, Singtel must take the steps to increase its
operating income to achieve better interest coverage ratio.
Efficiency ratio –
For Singtel –
⊘ This is a preview!⊘
Do you want full access?
Subscribe today to unlock all pages.
Trusted by 1+ million students worldwide
9FINANCIAL DECISION MAKING
Ratio Formula 2012 2013 2014 2015 2016
Asset turnover ratio Net sales/Total
assets 1.35 0.91 0.82 0.82 0.78
Inventory turnover ratio Sales/ inventory 605.3
2
656.4
3
864.0
1
642.6
5
788.8
9
Current asset turnover
ratio
Net sales/ current
assets 6.60 7.07 6.21 6.67 5.39
Debtors turnover ratio
Net sales/
accounts
receivable
7.35 7.66 6.52 7.05 5.60
2012 2013 2014 2015 2016
0.00
100.00
200.00
300.00
400.00
500.00
600.00
700.00
800.00
900.00
Efficiency
Asset turnover ratio
Inventory turnover ratio
Current asset turnover
ratio
Debtors turnover ratio
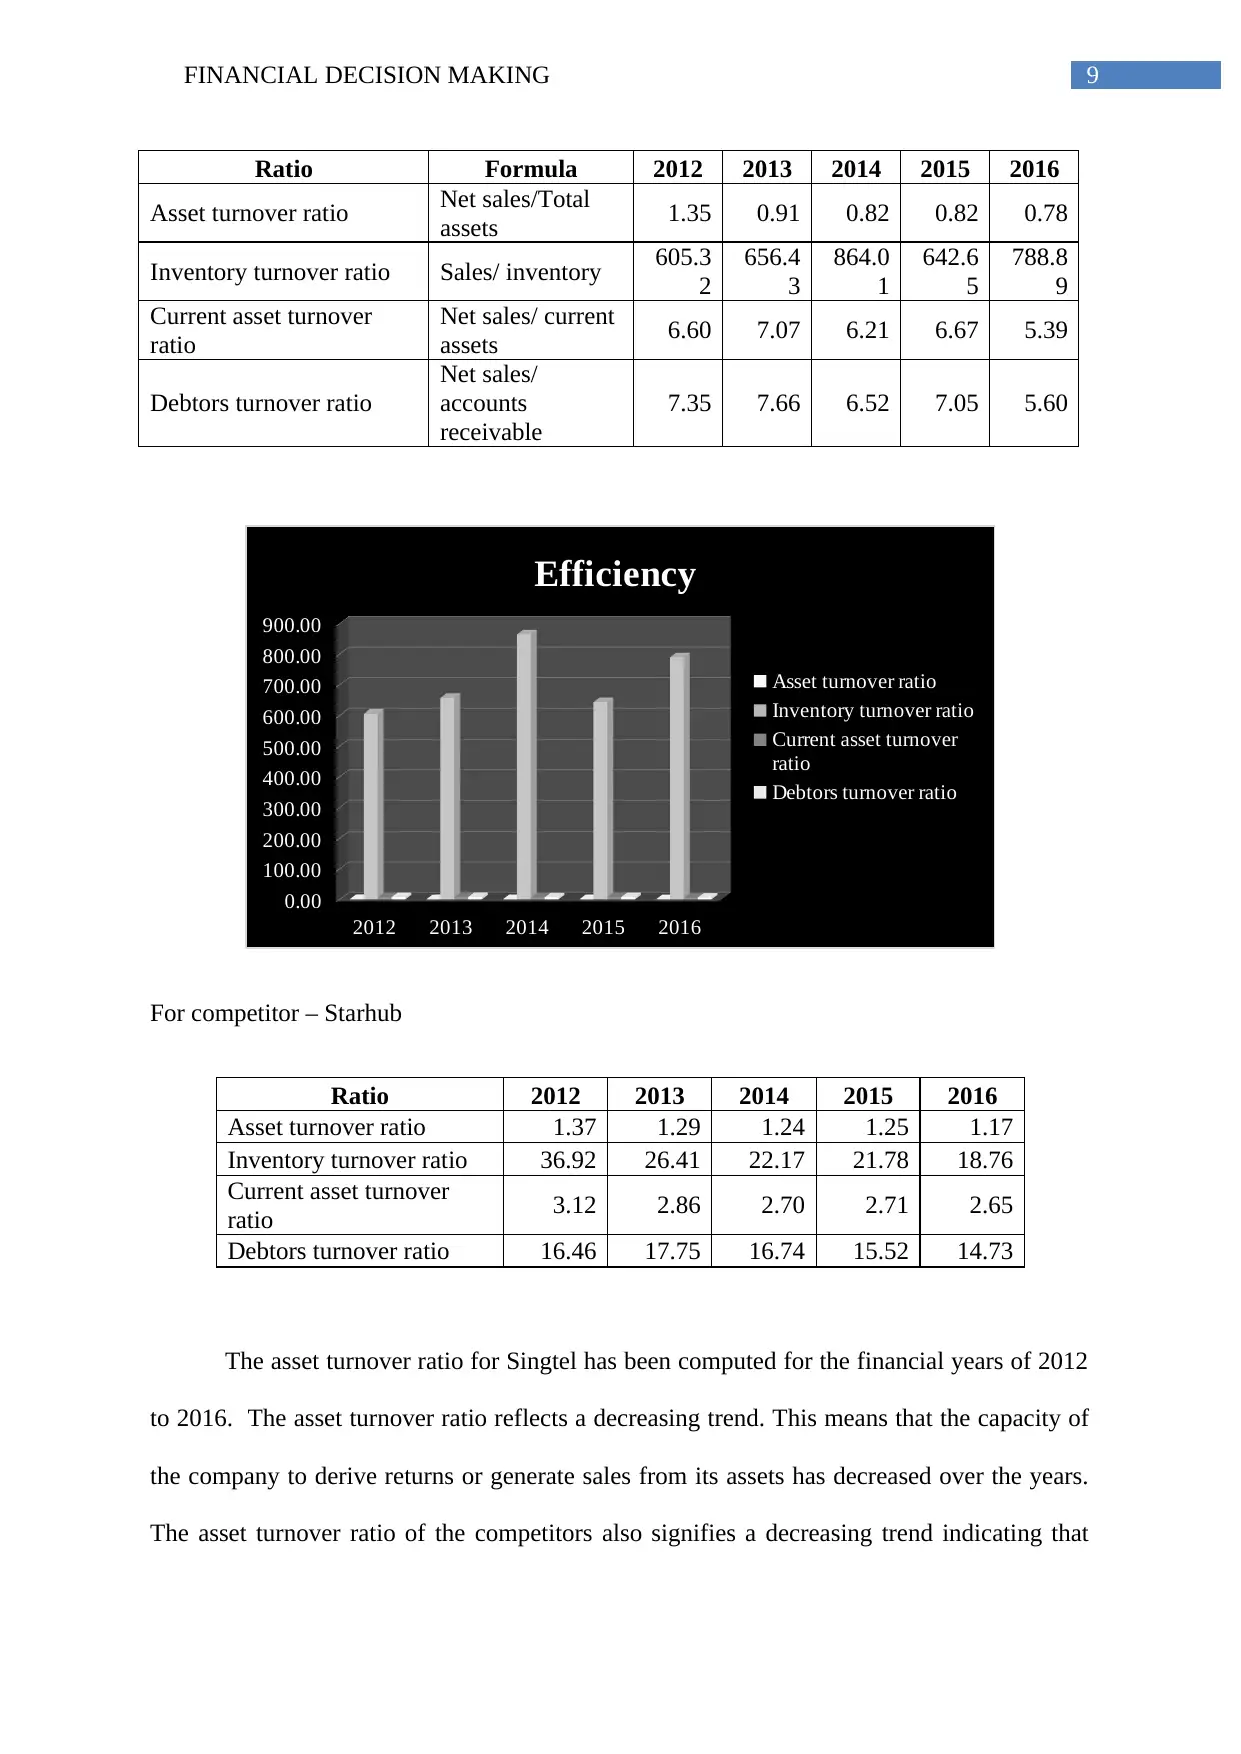
For competitor – Starhub
Ratio 2012 2013 2014 2015 2016
Asset turnover ratio 1.37 1.29 1.24 1.25 1.17
Inventory turnover ratio 36.92 26.41 22.17 21.78 18.76
Current asset turnover
ratio 3.12 2.86 2.70 2.71 2.65
Debtors turnover ratio 16.46 17.75 16.74 15.52 14.73
The asset turnover ratio for Singtel has been computed for the financial years of 2012
to 2016. The asset turnover ratio reflects a decreasing trend. This means that the capacity of
the company to derive returns or generate sales from its assets has decreased over the years.
The asset turnover ratio of the competitors also signifies a decreasing trend indicating that
Ratio Formula 2012 2013 2014 2015 2016
Asset turnover ratio Net sales/Total
assets 1.35 0.91 0.82 0.82 0.78
Inventory turnover ratio Sales/ inventory 605.3
2
656.4
3
864.0
1
642.6
5
788.8
9
Current asset turnover
ratio
Net sales/ current
assets 6.60 7.07 6.21 6.67 5.39
Debtors turnover ratio
Net sales/
accounts
receivable
7.35 7.66 6.52 7.05 5.60
2012 2013 2014 2015 2016
0.00
100.00
200.00
300.00
400.00
500.00
600.00
700.00
800.00
900.00
Efficiency
Asset turnover ratio
Inventory turnover ratio
Current asset turnover
ratio
Debtors turnover ratio
For competitor – Starhub
Ratio 2012 2013 2014 2015 2016
Asset turnover ratio 1.37 1.29 1.24 1.25 1.17
Inventory turnover ratio 36.92 26.41 22.17 21.78 18.76
Current asset turnover
ratio 3.12 2.86 2.70 2.71 2.65
Debtors turnover ratio 16.46 17.75 16.74 15.52 14.73
The asset turnover ratio for Singtel has been computed for the financial years of 2012
to 2016. The asset turnover ratio reflects a decreasing trend. This means that the capacity of
the company to derive returns or generate sales from its assets has decreased over the years.
The asset turnover ratio of the competitors also signifies a decreasing trend indicating that
Paraphrase This Document
Need a fresh take? Get an instant paraphrase of this document with our AI Paraphraser
10FINANCIAL DECISION MAKING
Singtel has been performing at par with the industry standards (Weil, Schipper and Francis
2013). The inventory turnover ratio for Singtel represents a fluctuating trend where as the
inventory turnover ratio of the industry reflects a decreasing trend over the years. This means
that the capacity of the company to utilize its inventory has been much better as per industry
standards. The current asset turnover ratio of Singtel represents greater ability of the company
to derive returns from the sale of the current assets in comparison to the current asset turnover
ratio of the industry. The debtors turnover ratio of Singtel represent a much higher rate than
that of the competitor firm signifying the fact that the time cycle within which Singtel
receives the due amount from its debtors is much more frequent compared to the competitor
firm (Mohr 2017).
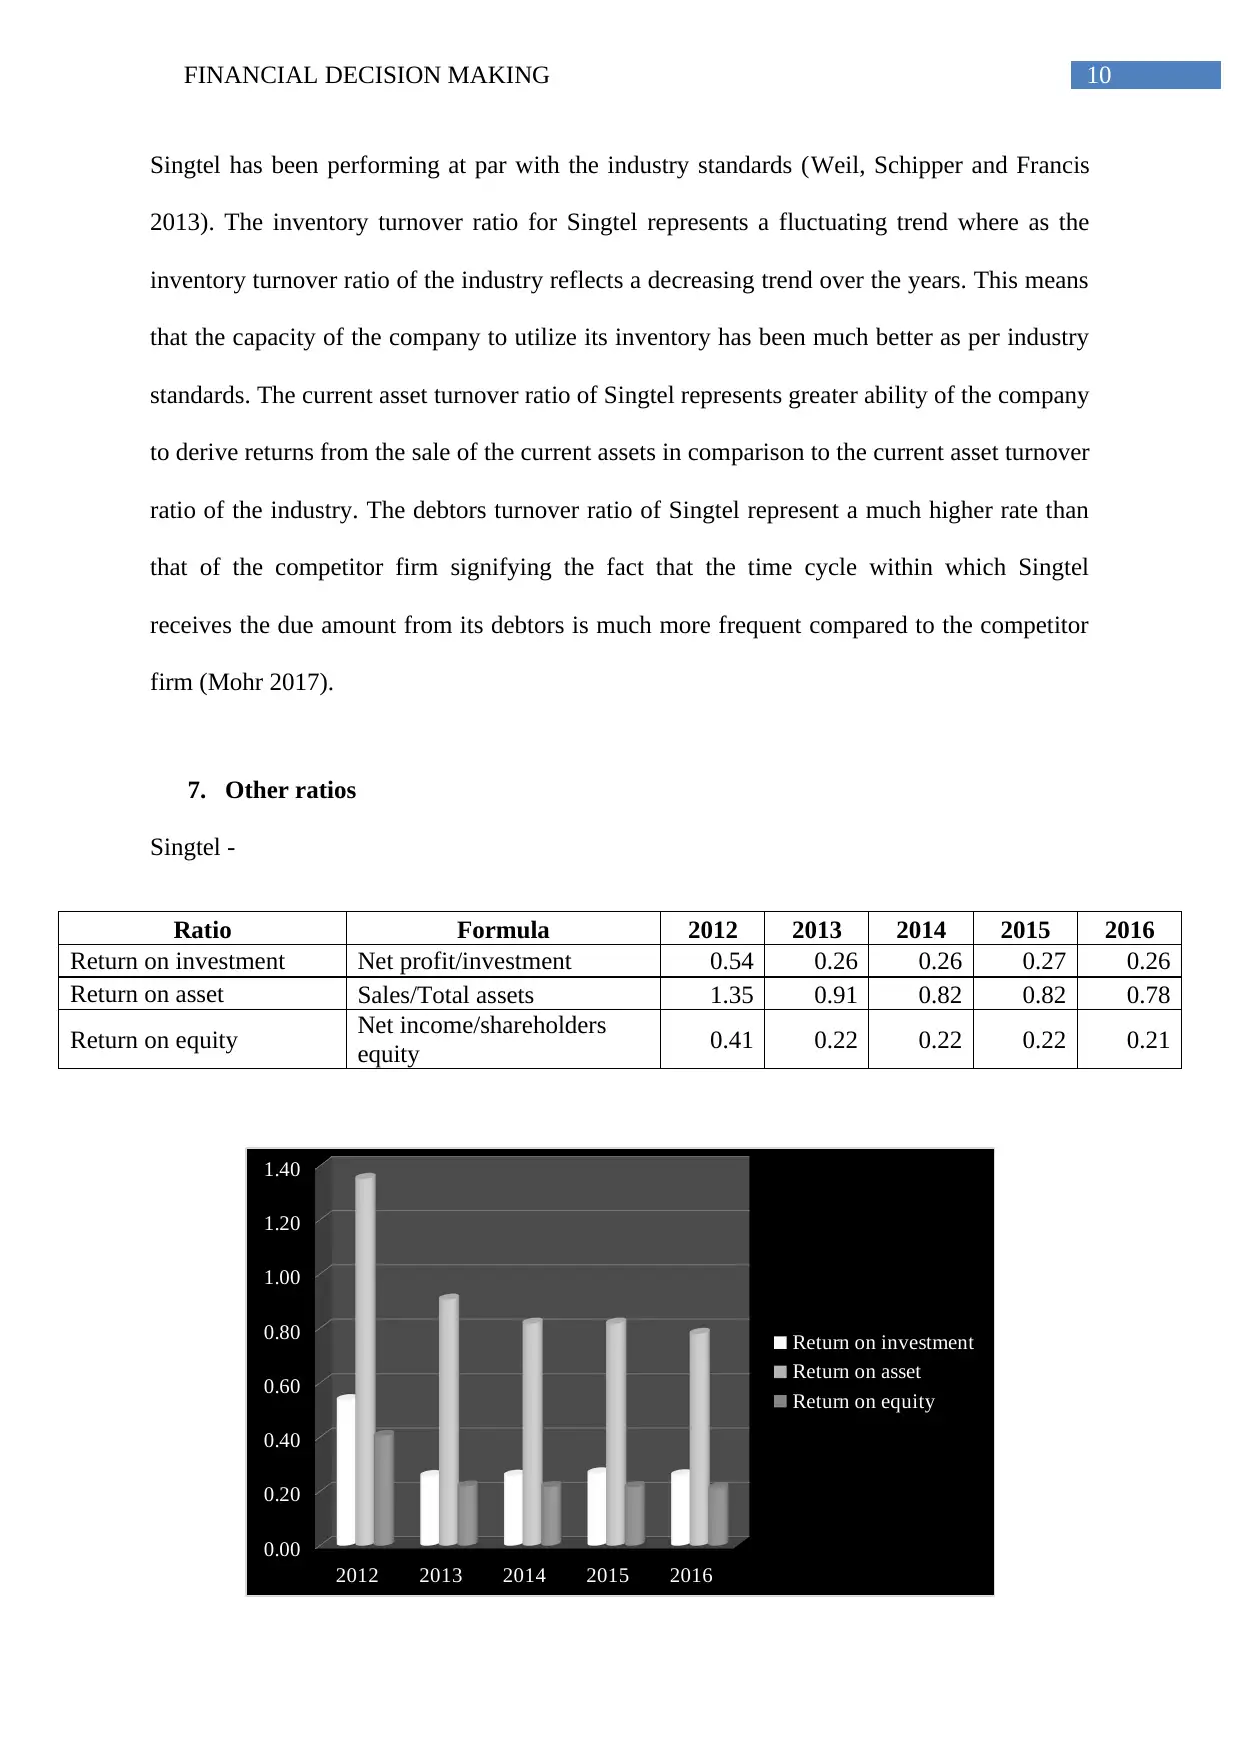
7. Other ratios
Singtel -
Ratio Formula 2012 2013 2014 2015 2016
Return on investment Net profit/investment 0.54 0.26 0.26 0.27 0.26
Return on asset Sales/Total assets 1.35 0.91 0.82 0.82 0.78
Return on equity Net income/shareholders
equity 0.41 0.22 0.22 0.22 0.21
2012 2013 2014 2015 2016
0.00
0.20
0.40
0.60
0.80
1.00
1.20
1.40
Return on investment
Return on asset
Return on equity
Singtel has been performing at par with the industry standards (Weil, Schipper and Francis
2013). The inventory turnover ratio for Singtel represents a fluctuating trend where as the
inventory turnover ratio of the industry reflects a decreasing trend over the years. This means
that the capacity of the company to utilize its inventory has been much better as per industry
standards. The current asset turnover ratio of Singtel represents greater ability of the company
to derive returns from the sale of the current assets in comparison to the current asset turnover
ratio of the industry. The debtors turnover ratio of Singtel represent a much higher rate than
that of the competitor firm signifying the fact that the time cycle within which Singtel
receives the due amount from its debtors is much more frequent compared to the competitor
firm (Mohr 2017).
7. Other ratios
Singtel -
Ratio Formula 2012 2013 2014 2015 2016
Return on investment Net profit/investment 0.54 0.26 0.26 0.27 0.26
Return on asset Sales/Total assets 1.35 0.91 0.82 0.82 0.78
Return on equity Net income/shareholders
equity 0.41 0.22 0.22 0.22 0.21
2012 2013 2014 2015 2016
0.00
0.20
0.40
0.60
0.80
1.00
1.20
1.40
Return on investment
Return on asset
Return on equity
11FINANCIAL DECISION MAKING
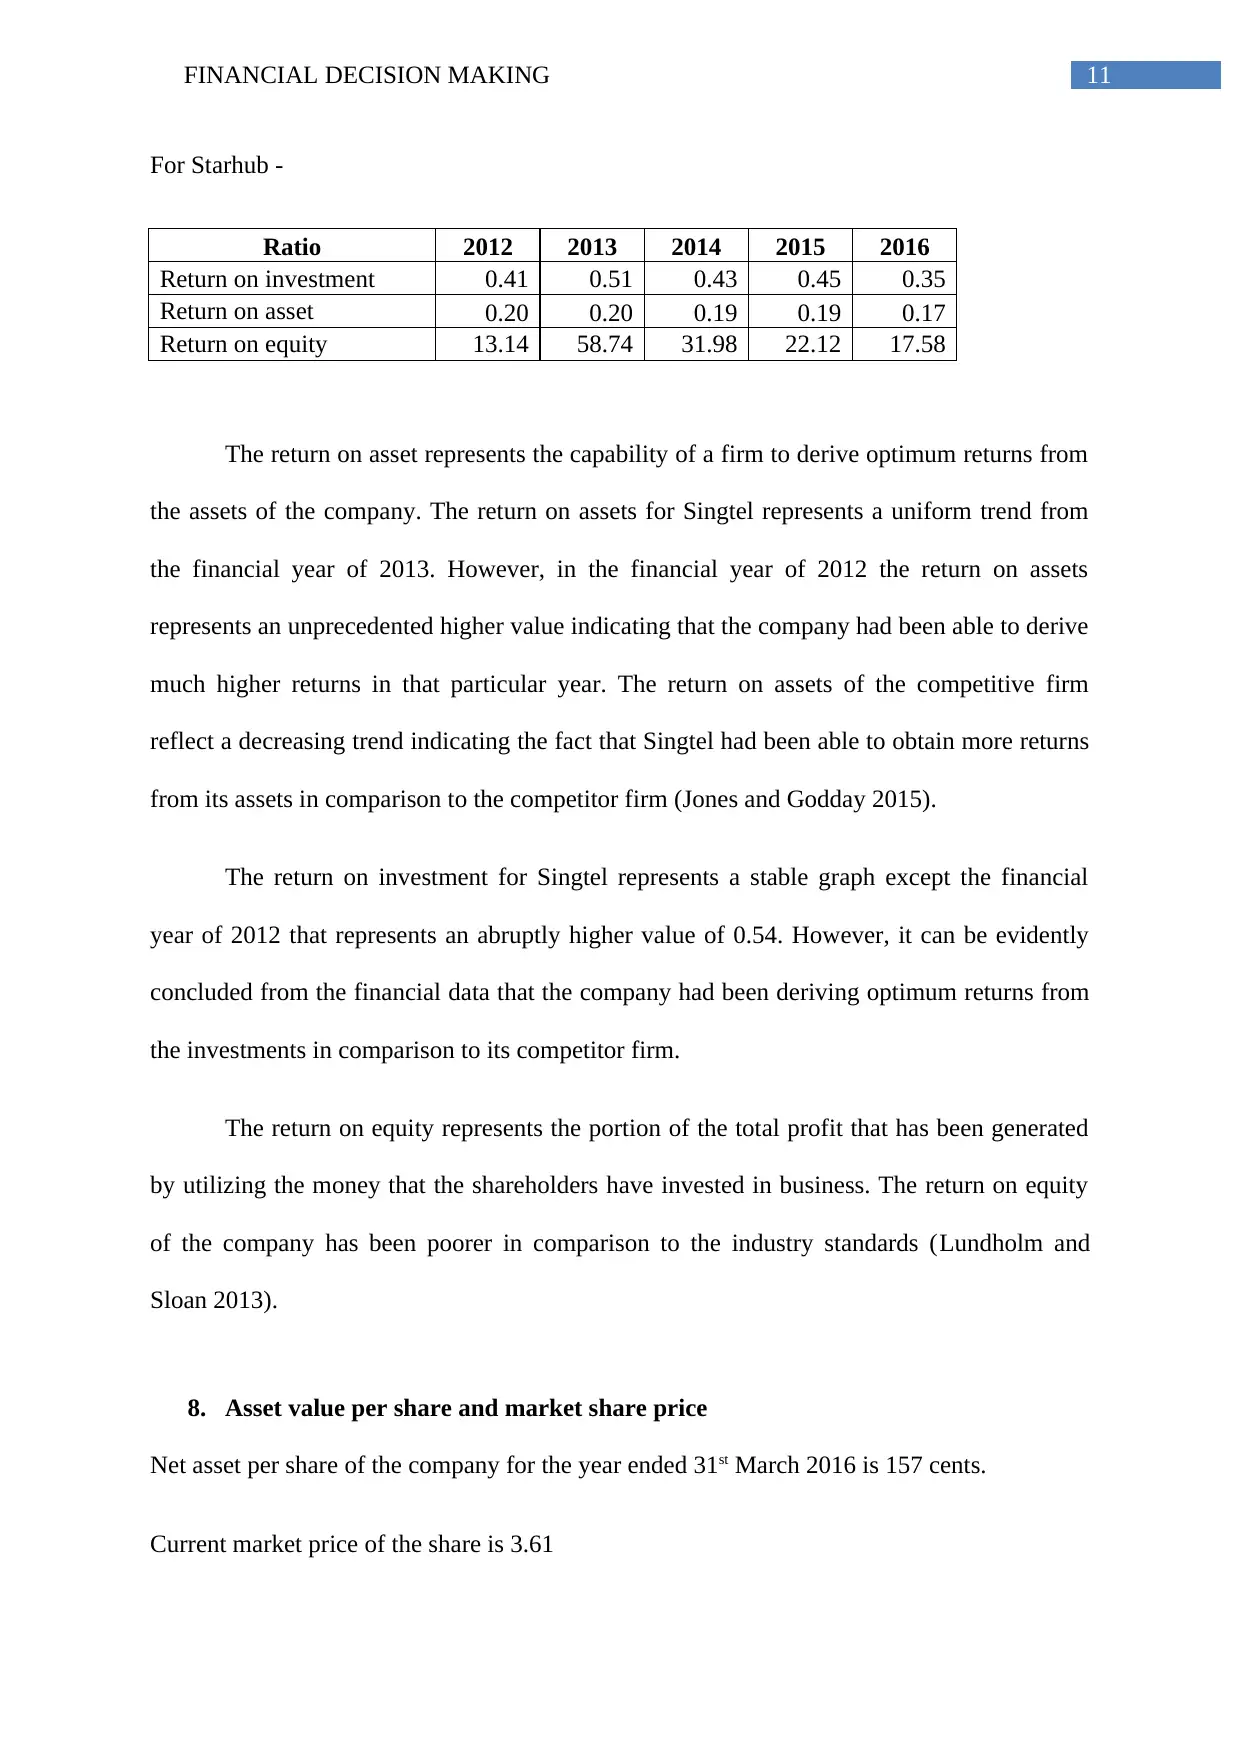
For Starhub -
Ratio 2012 2013 2014 2015 2016
Return on investment 0.41 0.51 0.43 0.45 0.35
Return on asset 0.20 0.20 0.19 0.19 0.17
Return on equity 13.14 58.74 31.98 22.12 17.58
The return on asset represents the capability of a firm to derive optimum returns from
the assets of the company. The return on assets for Singtel represents a uniform trend from
the financial year of 2013. However, in the financial year of 2012 the return on assets
represents an unprecedented higher value indicating that the company had been able to derive
much higher returns in that particular year. The return on assets of the competitive firm
reflect a decreasing trend indicating the fact that Singtel had been able to obtain more returns
from its assets in comparison to the competitor firm (Jones and Godday 2015).
The return on investment for Singtel represents a stable graph except the financial
year of 2012 that represents an abruptly higher value of 0.54. However, it can be evidently
concluded from the financial data that the company had been deriving optimum returns from
the investments in comparison to its competitor firm.
The return on equity represents the portion of the total profit that has been generated
by utilizing the money that the shareholders have invested in business. The return on equity
of the company has been poorer in comparison to the industry standards (Lundholm and
Sloan 2013).
8. Asset value per share and market share price
Net asset per share of the company for the year ended 31st March 2016 is 157 cents.
Current market price of the share is 3.61
⊘ This is a preview!⊘
Do you want full access?
Subscribe today to unlock all pages.
Trusted by 1+ million students worldwide
1 out of 22
Related Documents


Your All-in-One AI-Powered Toolkit for Academic Success.
+13062052269
info@desklib.com
Available 24*7 on WhatsApp / Email
![[object Object]](/_next/static/media/star-bottom.7253800d.svg)
Unlock your academic potential
Copyright © 2020–2026 A2Z Services. All Rights Reserved. Developed and managed by ZUCOL.