Decision Support Tools: Profit Analysis and Regression

Verified

Added on  2019/10/31

|7
|1107
|270
Homework Assignment
AI Summary
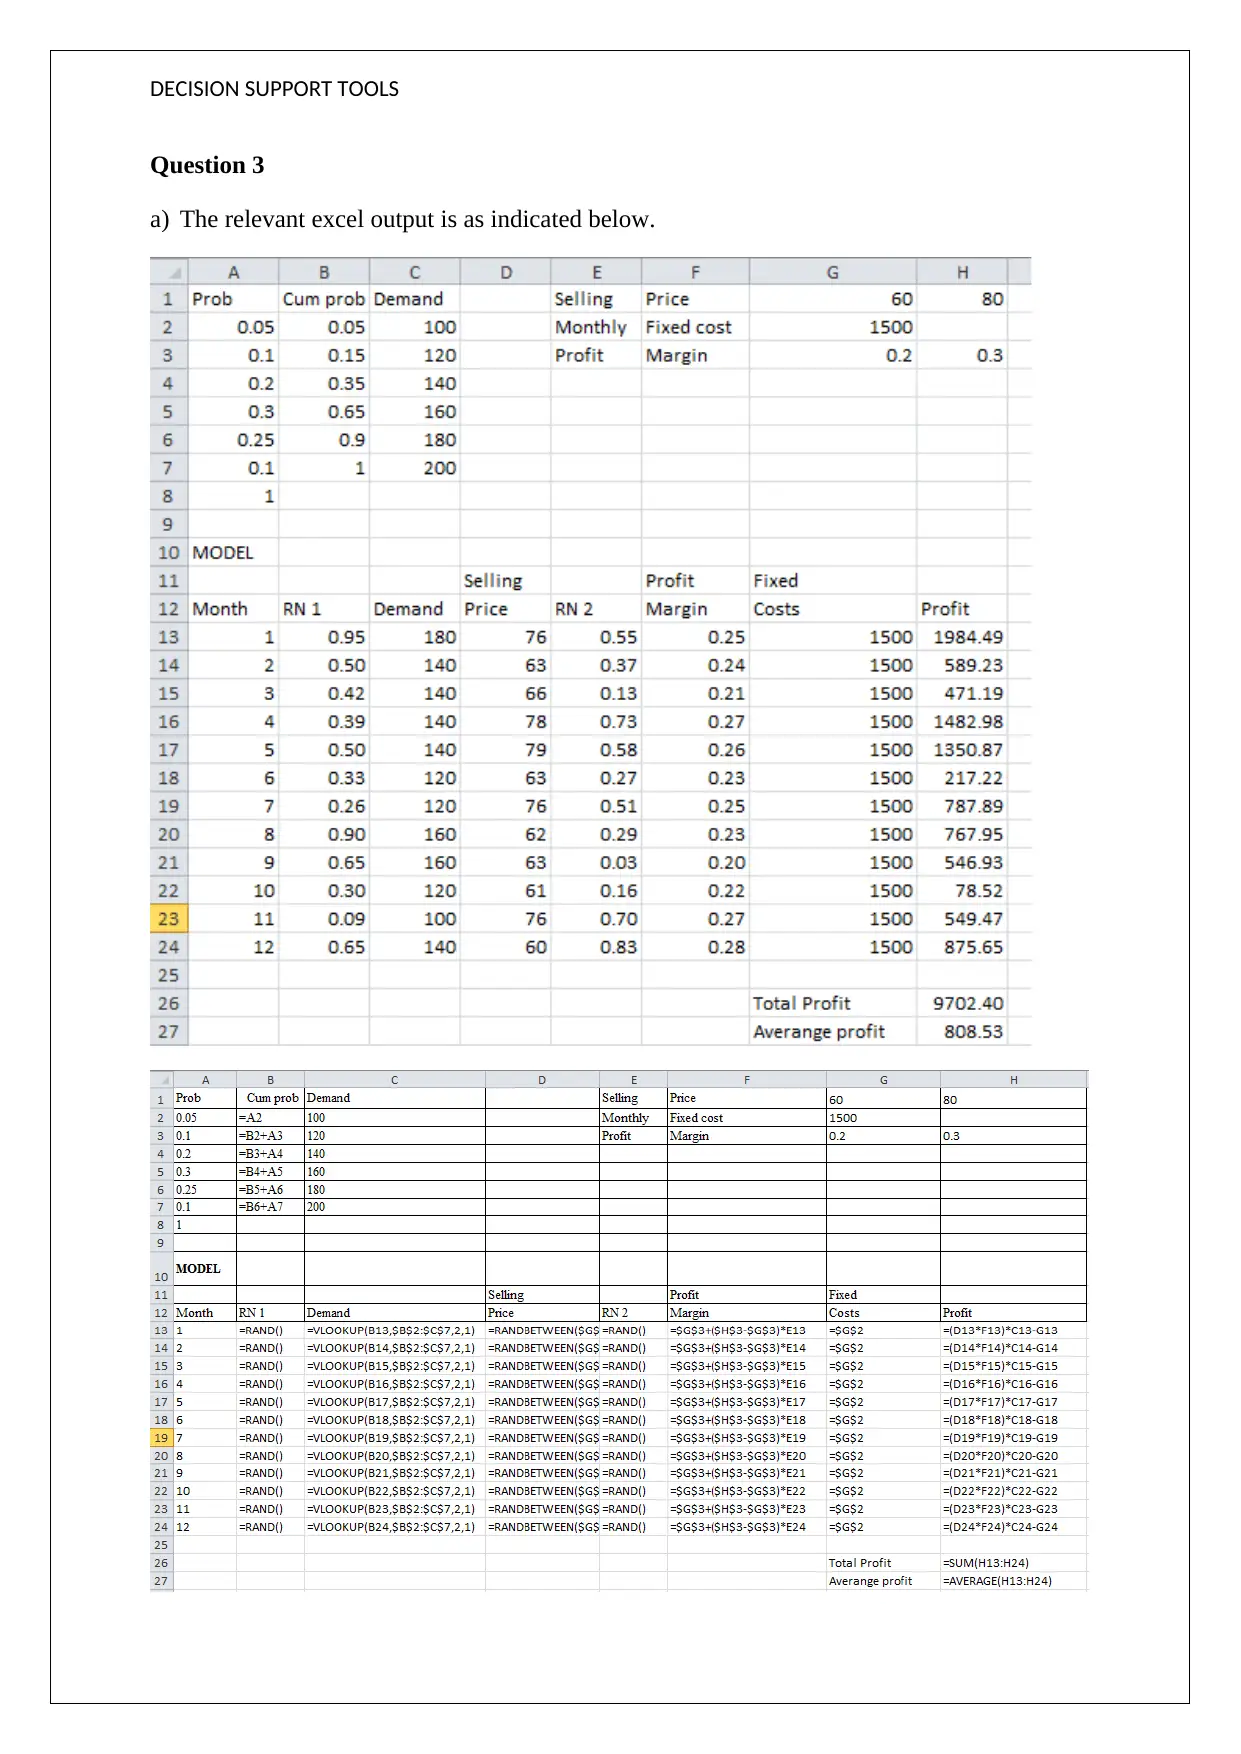
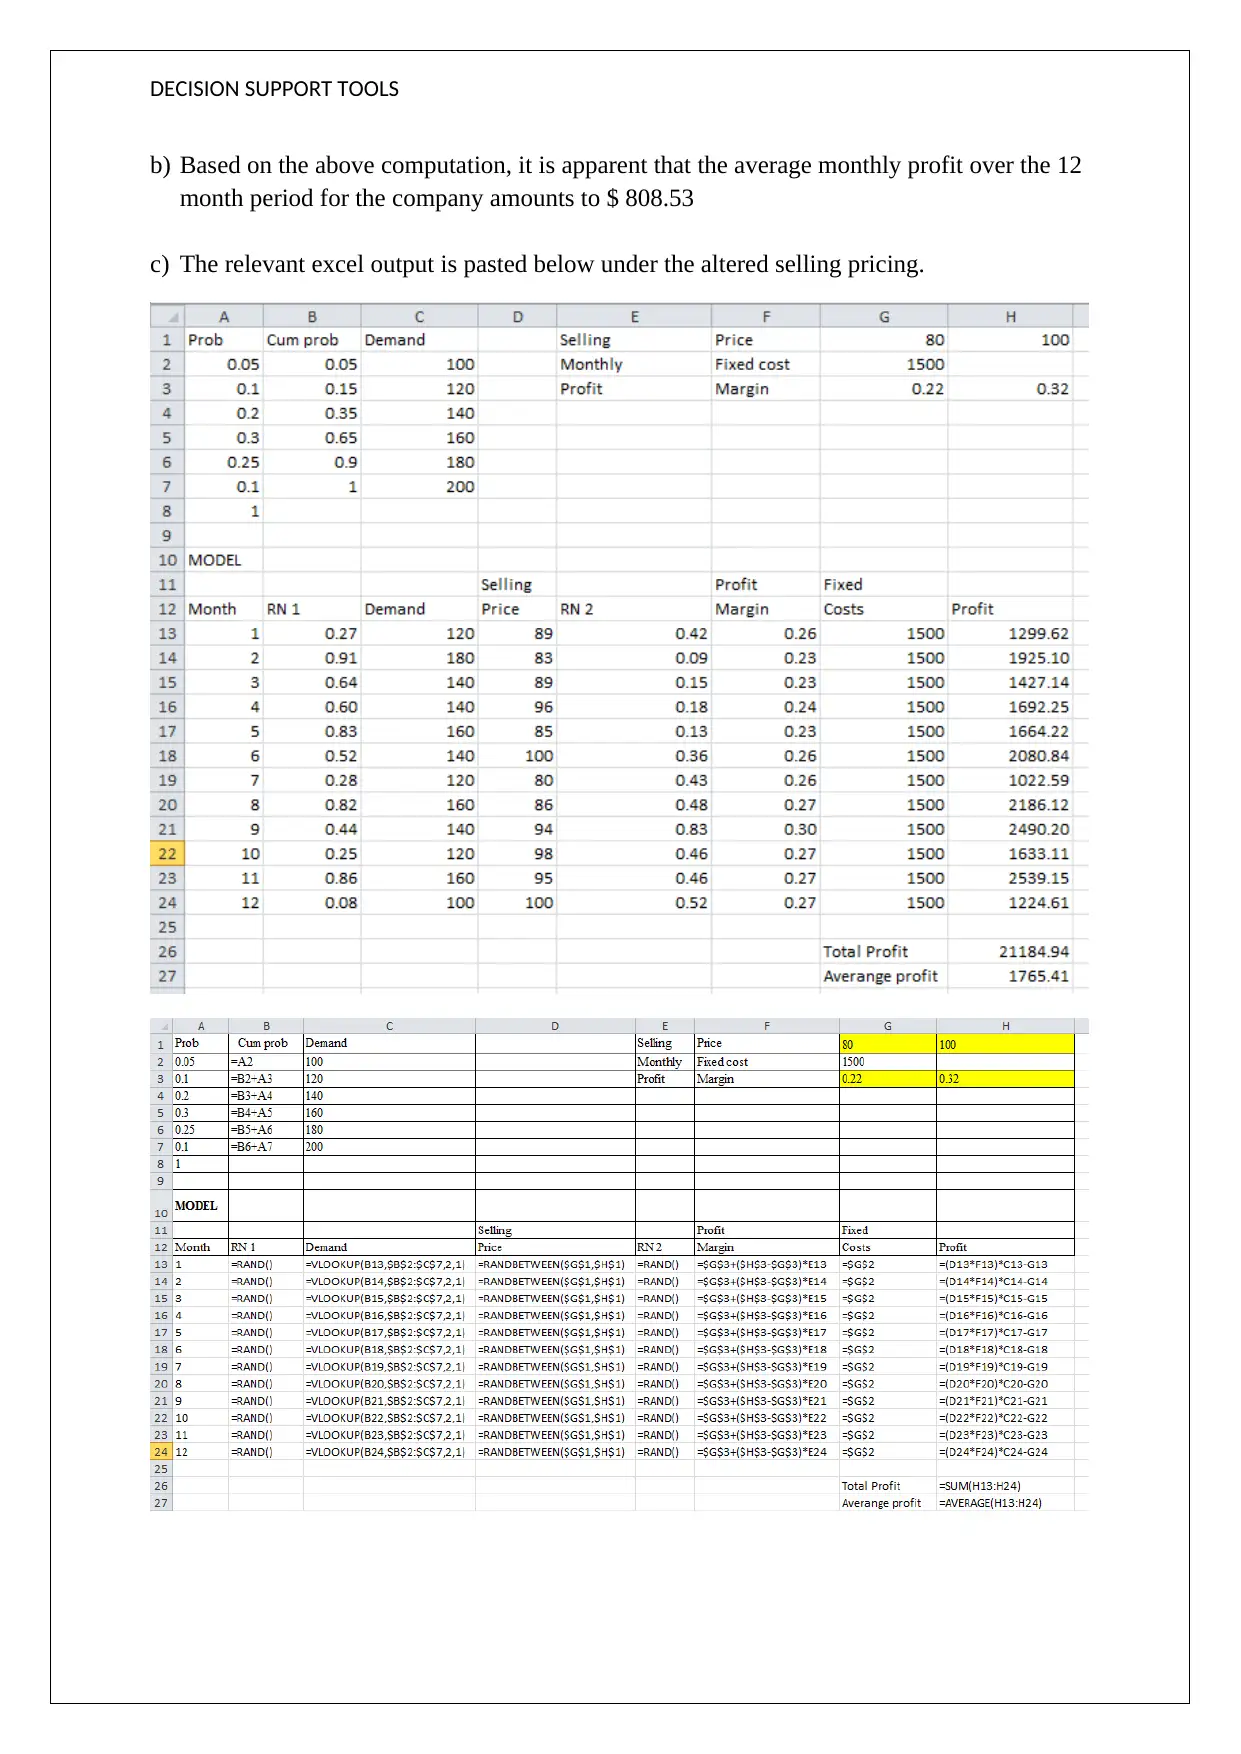
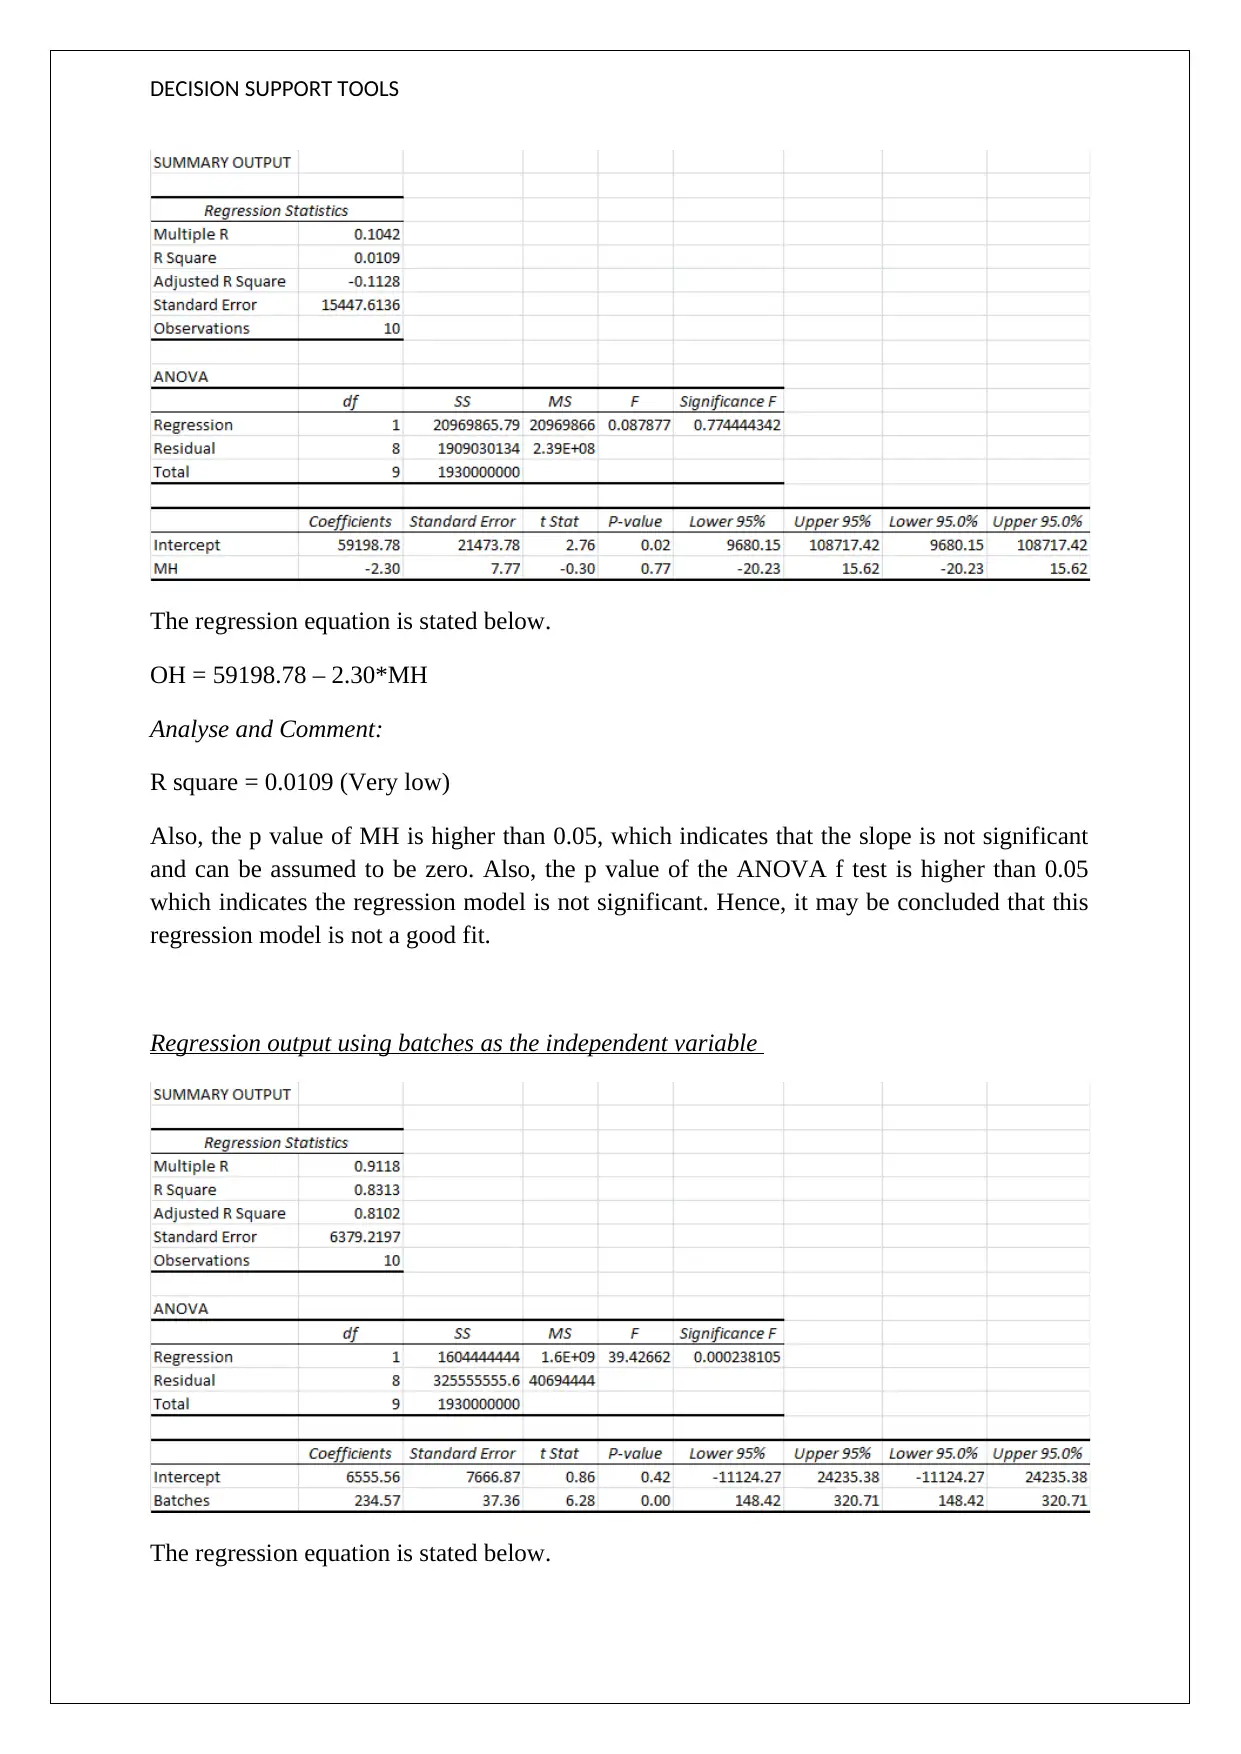
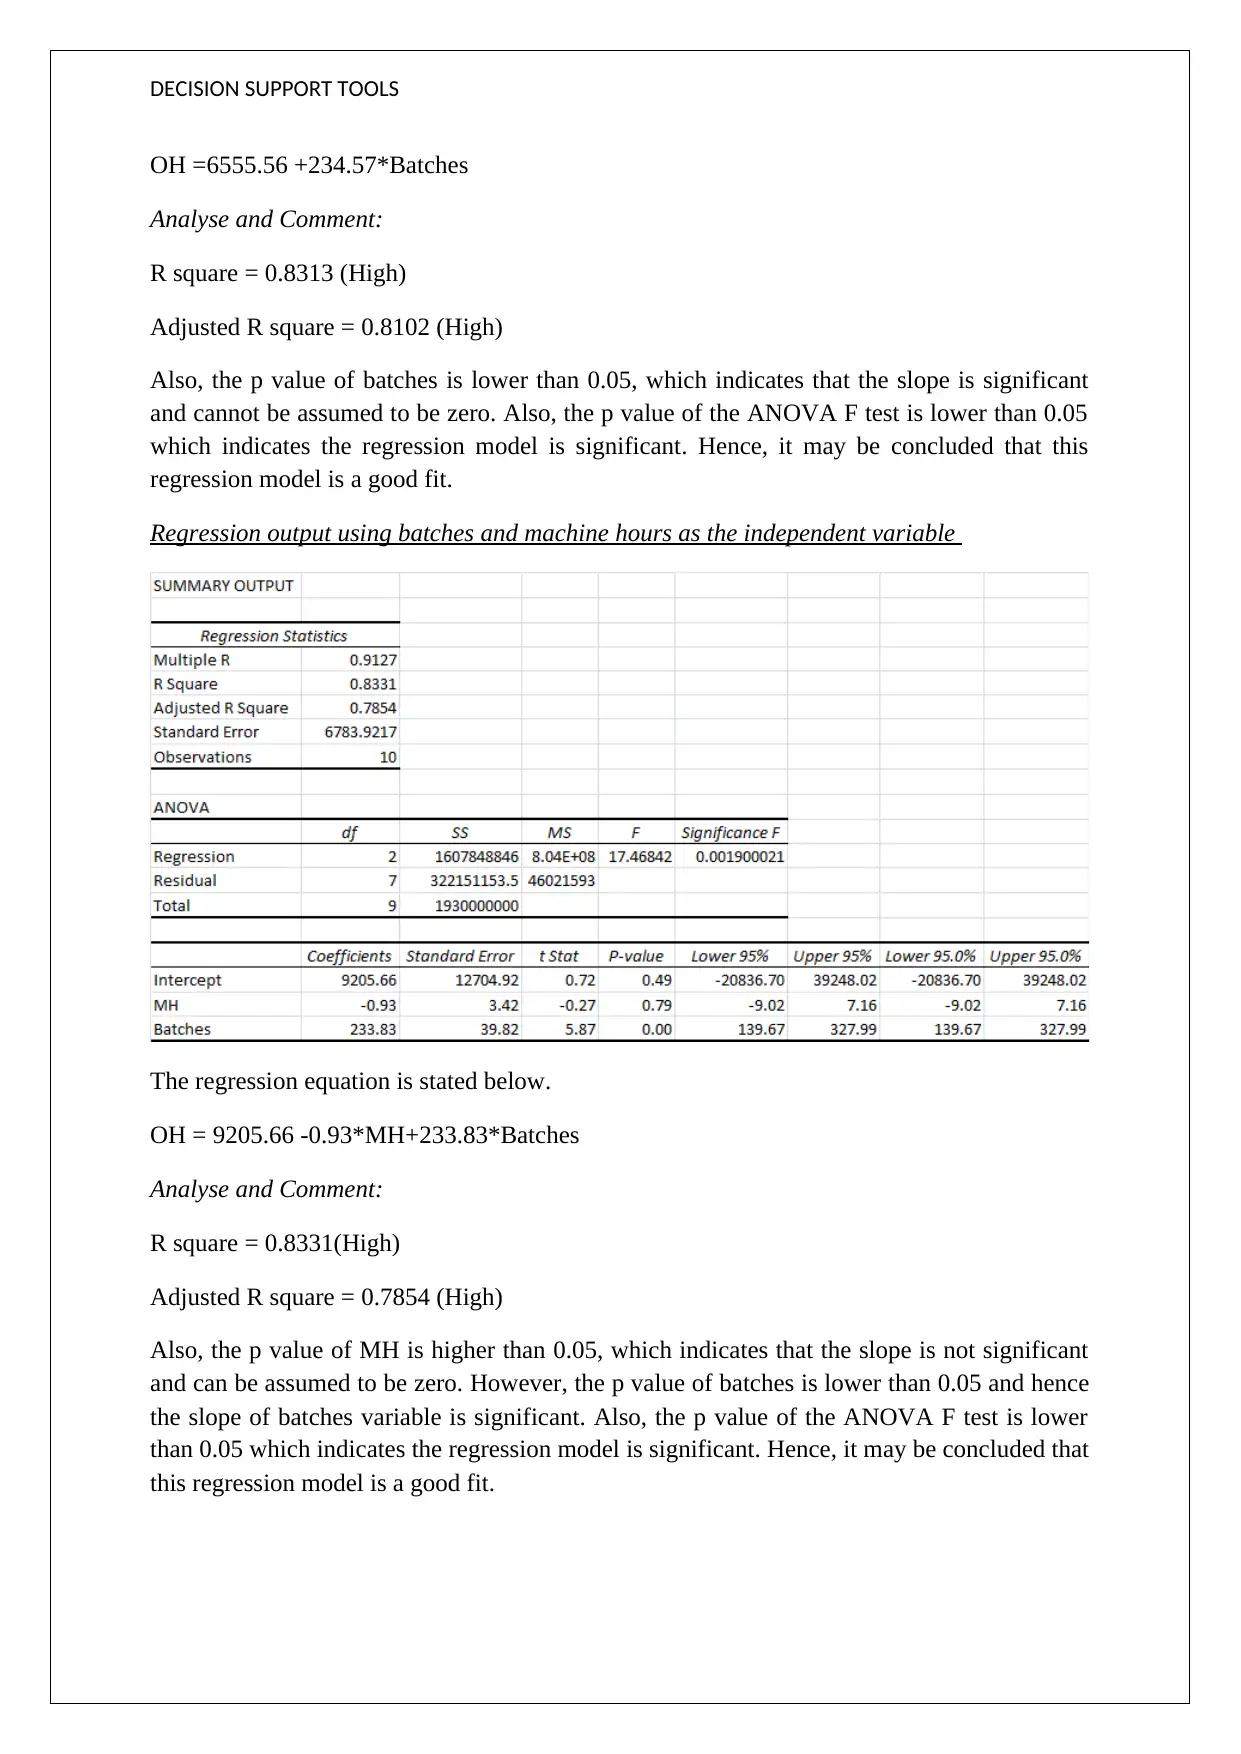
This assignment solution delves into the application of decision support tools for financial analysis. It begins with an analysis of profit changes due to price adjustments, including considerations of potential sales impacts. The solution then demonstrates the high-low method for determining regression coefficients and evaluates the effectiveness of different regression models (using machine hours and batches as independent variables) for estimating overhead costs, concluding that a regression model using batches is the best fit. Finally, the assignment addresses contribution margin analysis, break-even points, and target sales volume calculations for different products, considering both pre-tax and post-tax profit targets. The solution provides detailed calculations and explanations for each step, illustrating how financial data can be used to inform decision-making.
Document Page
DECISION SUPPORT TOOLS
Question 3
a) The relevant excel output is as indicated below.
tabler-icon-diamond-filled.svg

Paraphrase This Document

Need a fresh take? Get an instant paraphrase of this document with our AI Paraphraser
Document Page
DECISION SUPPORT TOOLS
b) Based on the above computation, it is apparent that the average monthly profit over the 12
month period for the company amounts to $ 808.53
c) The relevant excel output is pasted below under the altered selling pricing.
Document Page
DECISION SUPPORT TOOLS
To: Sales Manager
Date: September 19, 2017
Based on the above output, it is apparent that there has been a jump in the average profit on
account of increased selling price. The $ 20 jump in the selling price has caused the average
profit to double owing to higher profit margins. This is in line with the expectations at the
time of the price increase.
However, a tacit assumption that has been made in the above analysis is that there would not
be any adverse impact on the sales which may not hold true. In case of sales declining on
account of the higher prices, then there could be neutralisation of the higher profit margins
with the lower sales leading to the average profits being adversely impacted. As a result, it is
crucial to keep an eye on the monthly sales and comparing the same with previous or
expected sales volume so that rectifying measure can be taken if required.
Yours Sincerely
STUDENT NAME
Question 4
a) In the high low method, the objective is to determine the various regression coefficients
using the given data.
Variable cost per unit = (Overhead cost at highest machine hours – Overhead cost at lowest
machine hours)/(Highest machine hours – Lowest machine hours)
Thus, taking into consideration, the given data,
Variable cost per unit = (48000-46000)/(3800-1800) = $1
Total fixed cost = 48000 – 3800*1 = $ 44,200
Hence, the regression equation using the high low method is indicated below.
Total overheads cost = 44200 + 1*Machine Hours
Hence, estimated overheads cost for 3000 machine hours = 44200 +1*3000 = $ 47,200
b) Regression output using machine hours as the independent variable
Document Page
DECISION SUPPORT TOOLS
The regression equation is stated below.
OH = 59198.78 – 2.30*MH
Analyse and Comment:
R square = 0.0109 (Very low)
Also, the p value of MH is higher than 0.05, which indicates that the slope is not significant
and can be assumed to be zero. Also, the p value of the ANOVA f test is higher than 0.05
which indicates the regression model is not significant. Hence, it may be concluded that this
regression model is not a good fit.
Regression output using batches as the independent variable
The regression equation is stated below.
tabler-icon-diamond-filled.svg

Paraphrase This Document

Need a fresh take? Get an instant paraphrase of this document with our AI Paraphraser
Document Page
DECISION SUPPORT TOOLS
OH =6555.56 +234.57*Batches
Analyse and Comment:
R square = 0.8313 (High)
Adjusted R square = 0.8102 (High)
Also, the p value of batches is lower than 0.05, which indicates that the slope is significant
and cannot be assumed to be zero. Also, the p value of the ANOVA F test is lower than 0.05
which indicates the regression model is significant. Hence, it may be concluded that this
regression model is a good fit.
Regression output using batches and machine hours as the independent variable
The regression equation is stated below.
OH = 9205.66 -0.93*MH+233.83*Batches
Analyse and Comment:
R square = 0.8331(High)
Adjusted R square = 0.7854 (High)
Also, the p value of MH is higher than 0.05, which indicates that the slope is not significant
and can be assumed to be zero. However, the p value of batches is lower than 0.05 and hence
the slope of batches variable is significant. Also, the p value of the ANOVA F test is lower
than 0.05 which indicates the regression model is significant. Hence, it may be concluded that
this regression model is a good fit.
Document Page
DECISION SUPPORT TOOLS
c) The simple regression model which uses only batches as the independent variable would
be used. This is because machine hours is not a significant independent variable for the
determination of overheads cost as has been seen from the regression output that have
been obtained above. Also, the highest adjusted R square value exists for the regression
model with only batches as the independent variable. Even though the highest R square
exists for the multiple regression model but it may arise on account of extra independent
variable added in the form of machine hours. Hence, comparison of the adjusted R square
is better which clearly indicates that the best fit is provided by regression with independent
variables as batches.
d) The regression equation for the best regression model is indicated below.
OH =6555.56 +234.57*Batches
Here batches = 150
Hence, OH = 6555.56 + 234.57*150 = $ 41,740.74
Question 5
(a)Contribution Margin = Sale price – variable cost
Unit contribution margin (Product A) = 10 – 5 = $ 5
Unit contribution margin (Product B) = 20 -12 = $ 8
(b)Break-even point (in terms of unit) = Total fixed costs/Unit contribution margin of B =
4000/8 = 500 units
(c)Break-even point (in terms of unit) = Total fixed costs/Unit contribution margin of A =
4000/5 = 800 units
Breakeven sales volume = 800*10 = $ 8,000
(d)It is now known that ratio of unit sales would be A:B= 2:1
(i) Average contribution margin = (2/3)*5 + (1/3)*8 = $ 6
Total month profit desired before tax = $ 5,000
Target sales volume = (Profit before tax + fixed cost)/Average contribution margin =
(5000+4000)/6 = 1500 units
Document Page
DECISION SUPPORT TOOLS
Hence, units of A required = (1500)*(2/3) = 1000
Unit of B required = (1500)*(1/3) = 500
(ii) Desired post tax profit = $ 21,000
Let the pre-tax profit be X
Hence X(1-0.3) = 21000
Solving the above, X = $ 30,000
Total month profit desired before tax = $ 30,000
Target sales volume = (Profit before tax + fixed cost)/Average contribution margin =
(30000+4000)/6 = 5667 units
Hence, units of A required = (5667)*(2/3) = 3778
Units of B required = (5667)*(1/3) = 1889
chevron_up_icon
1 out of 7
circle_padding
hide_on_mobile
zoom_out_icon
[object Object]