Financial Analysis, Budgeting, and Investment Decisions

Verified

Added on  2020/05/04

|7
|1074
|35
Homework Assignment
AI Summary
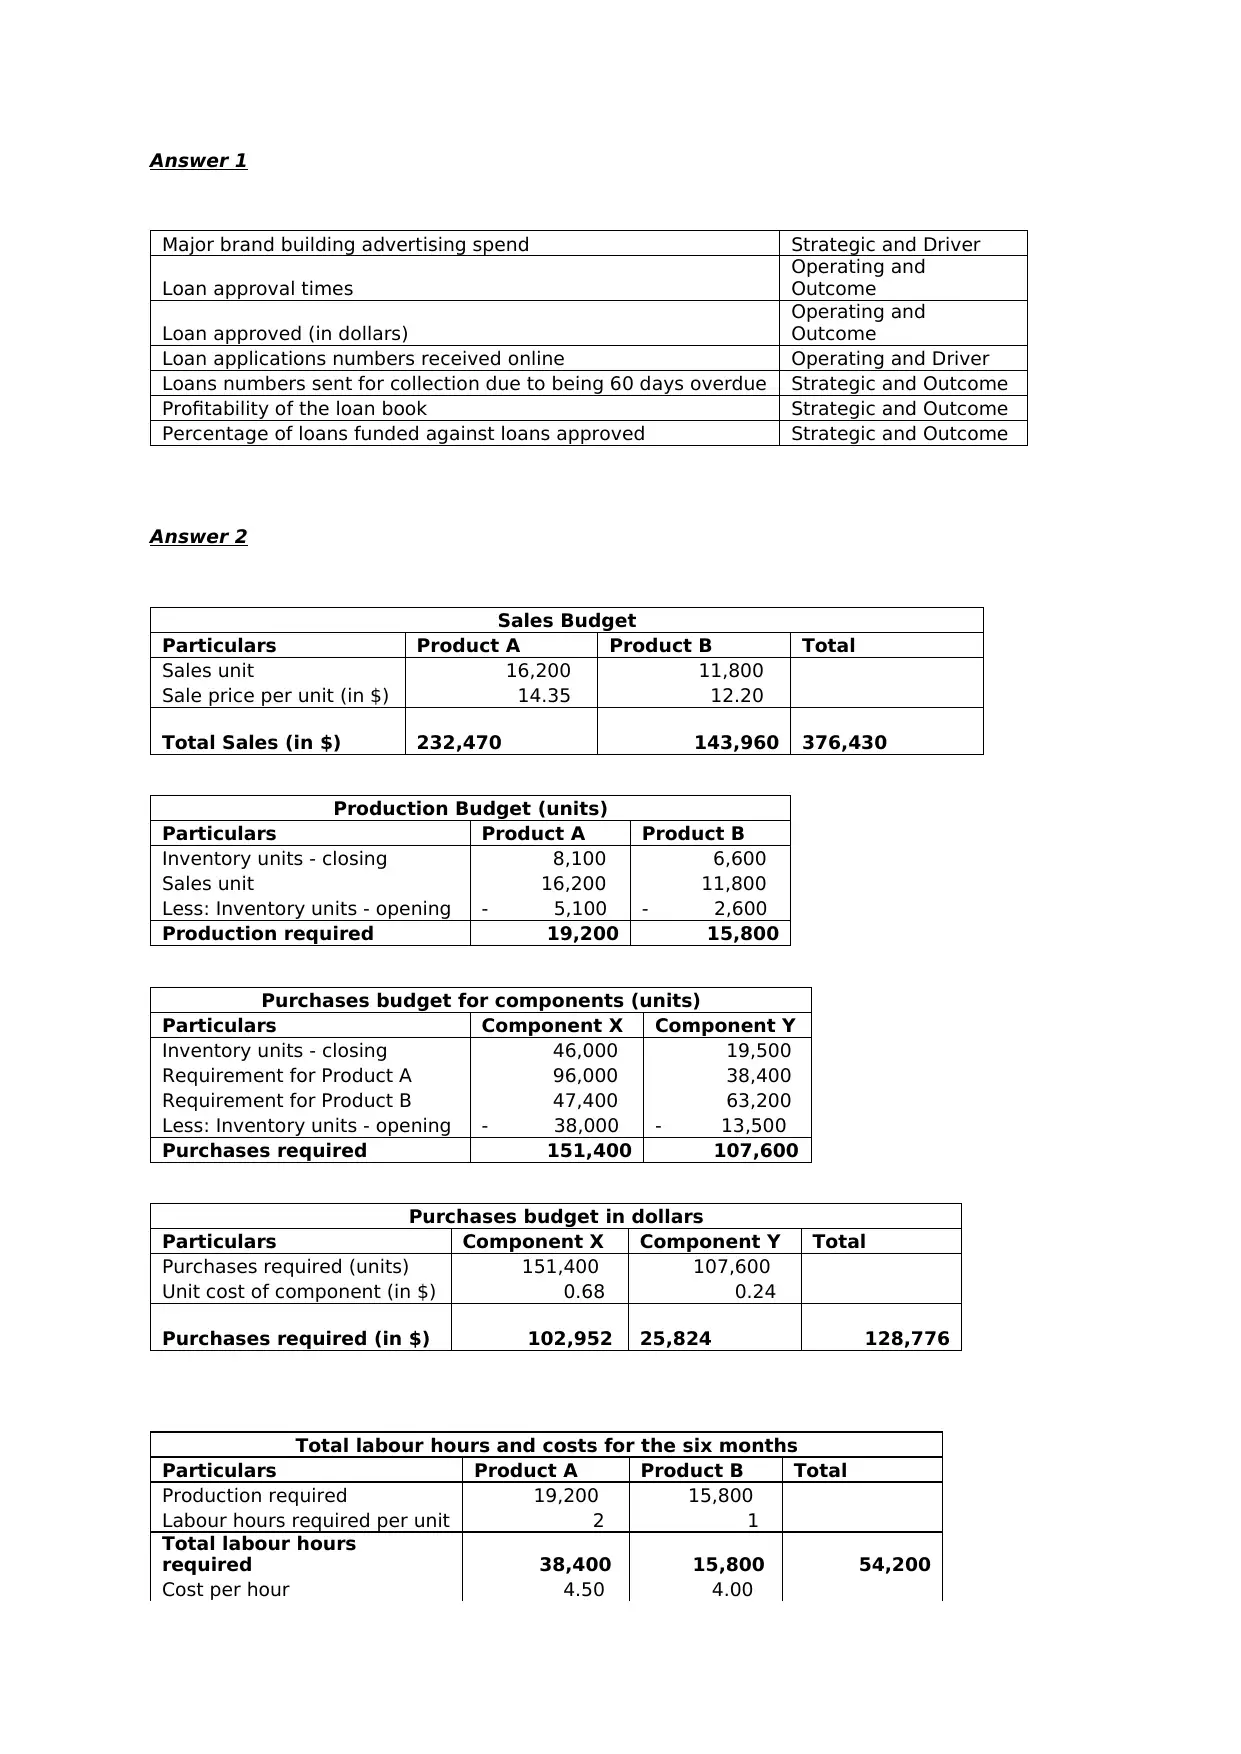
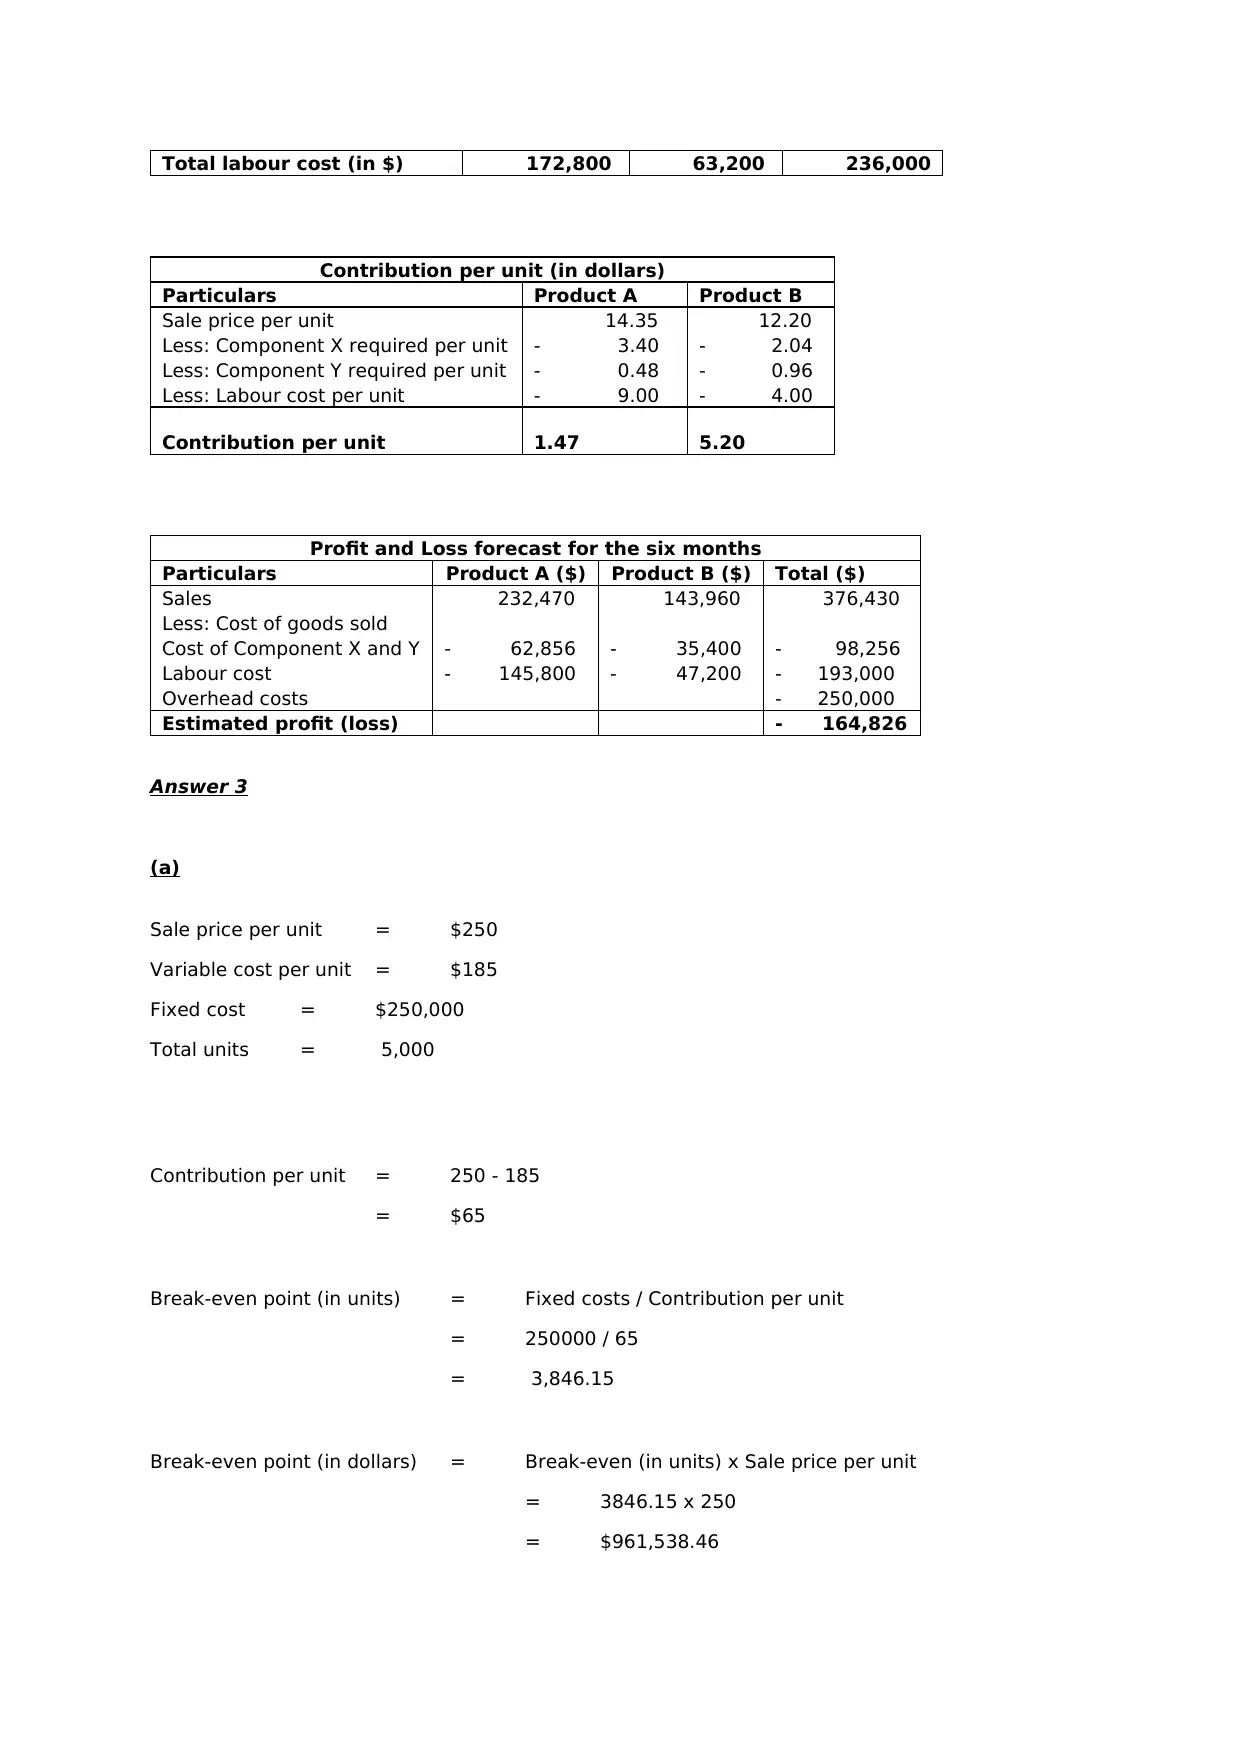
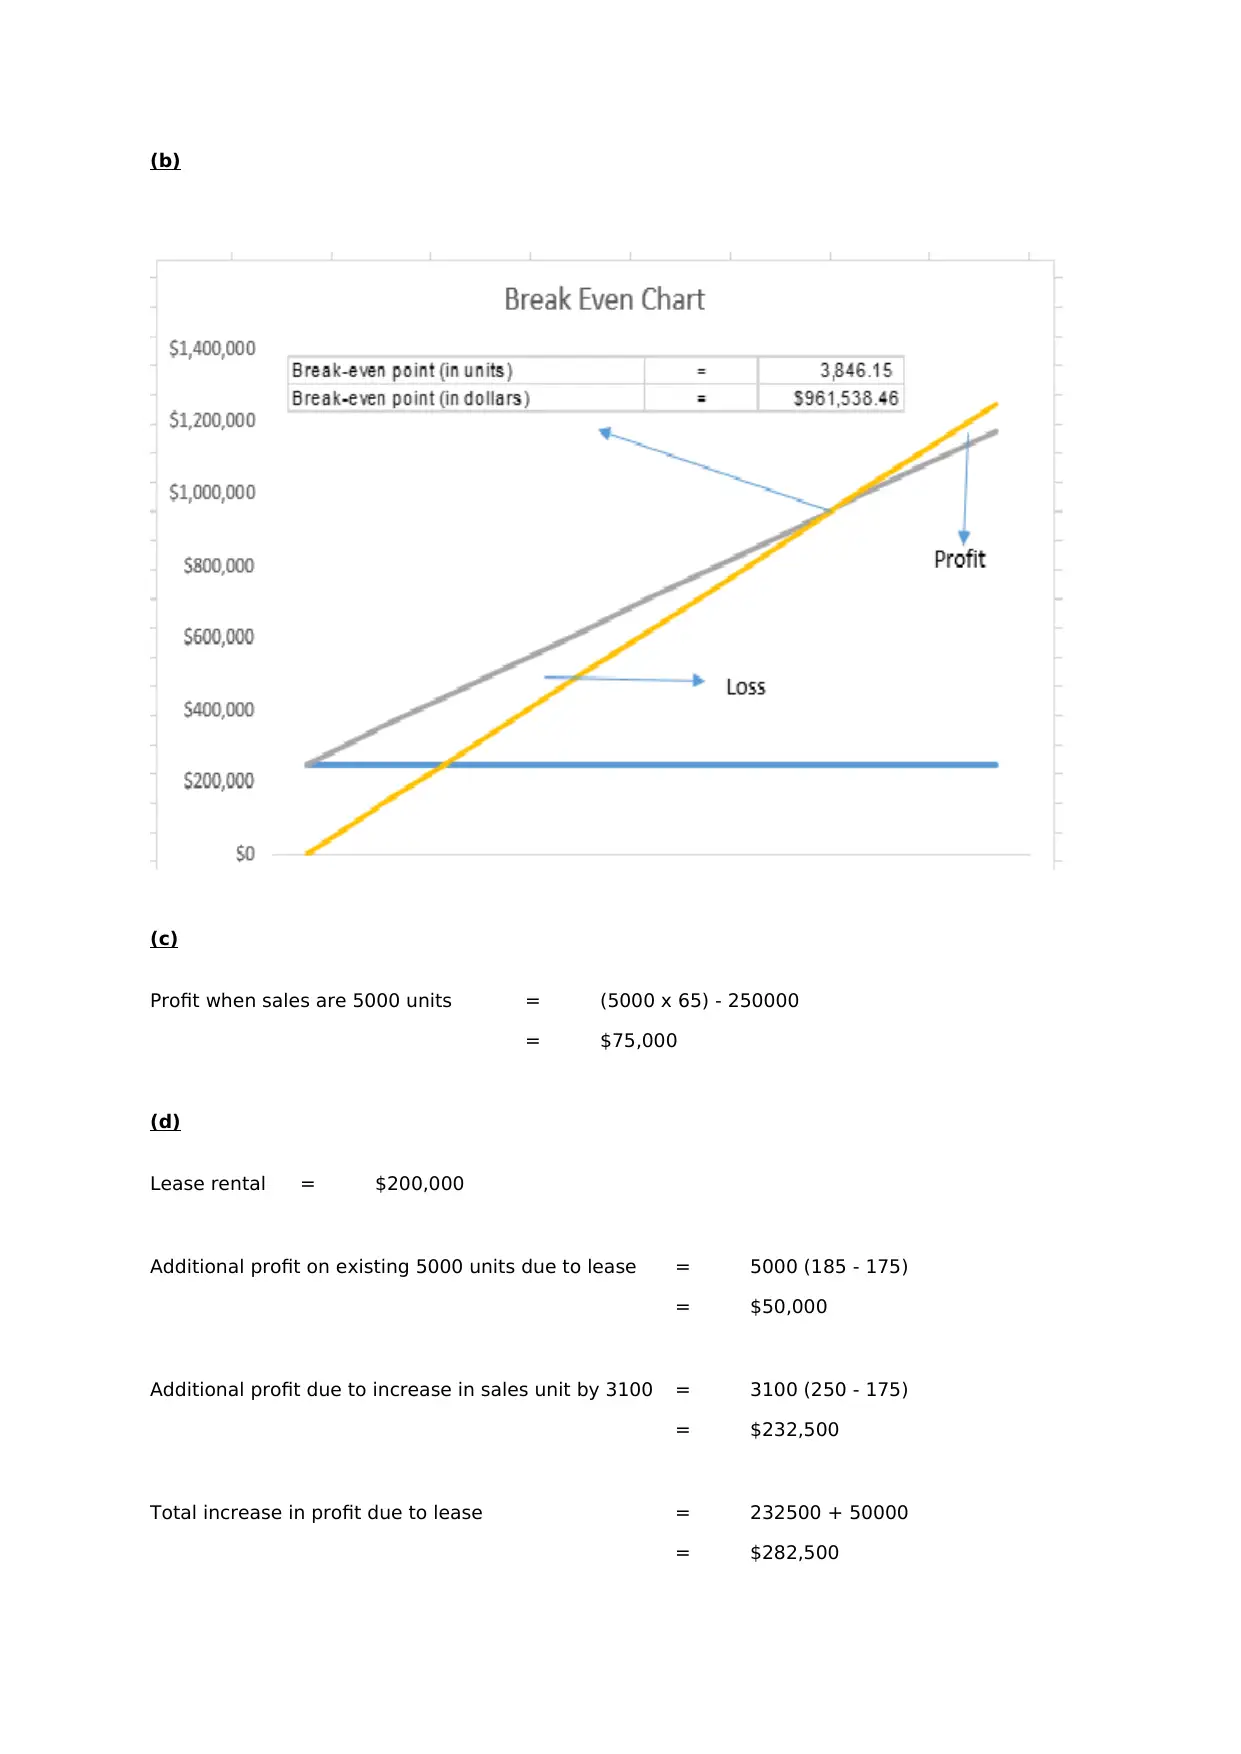
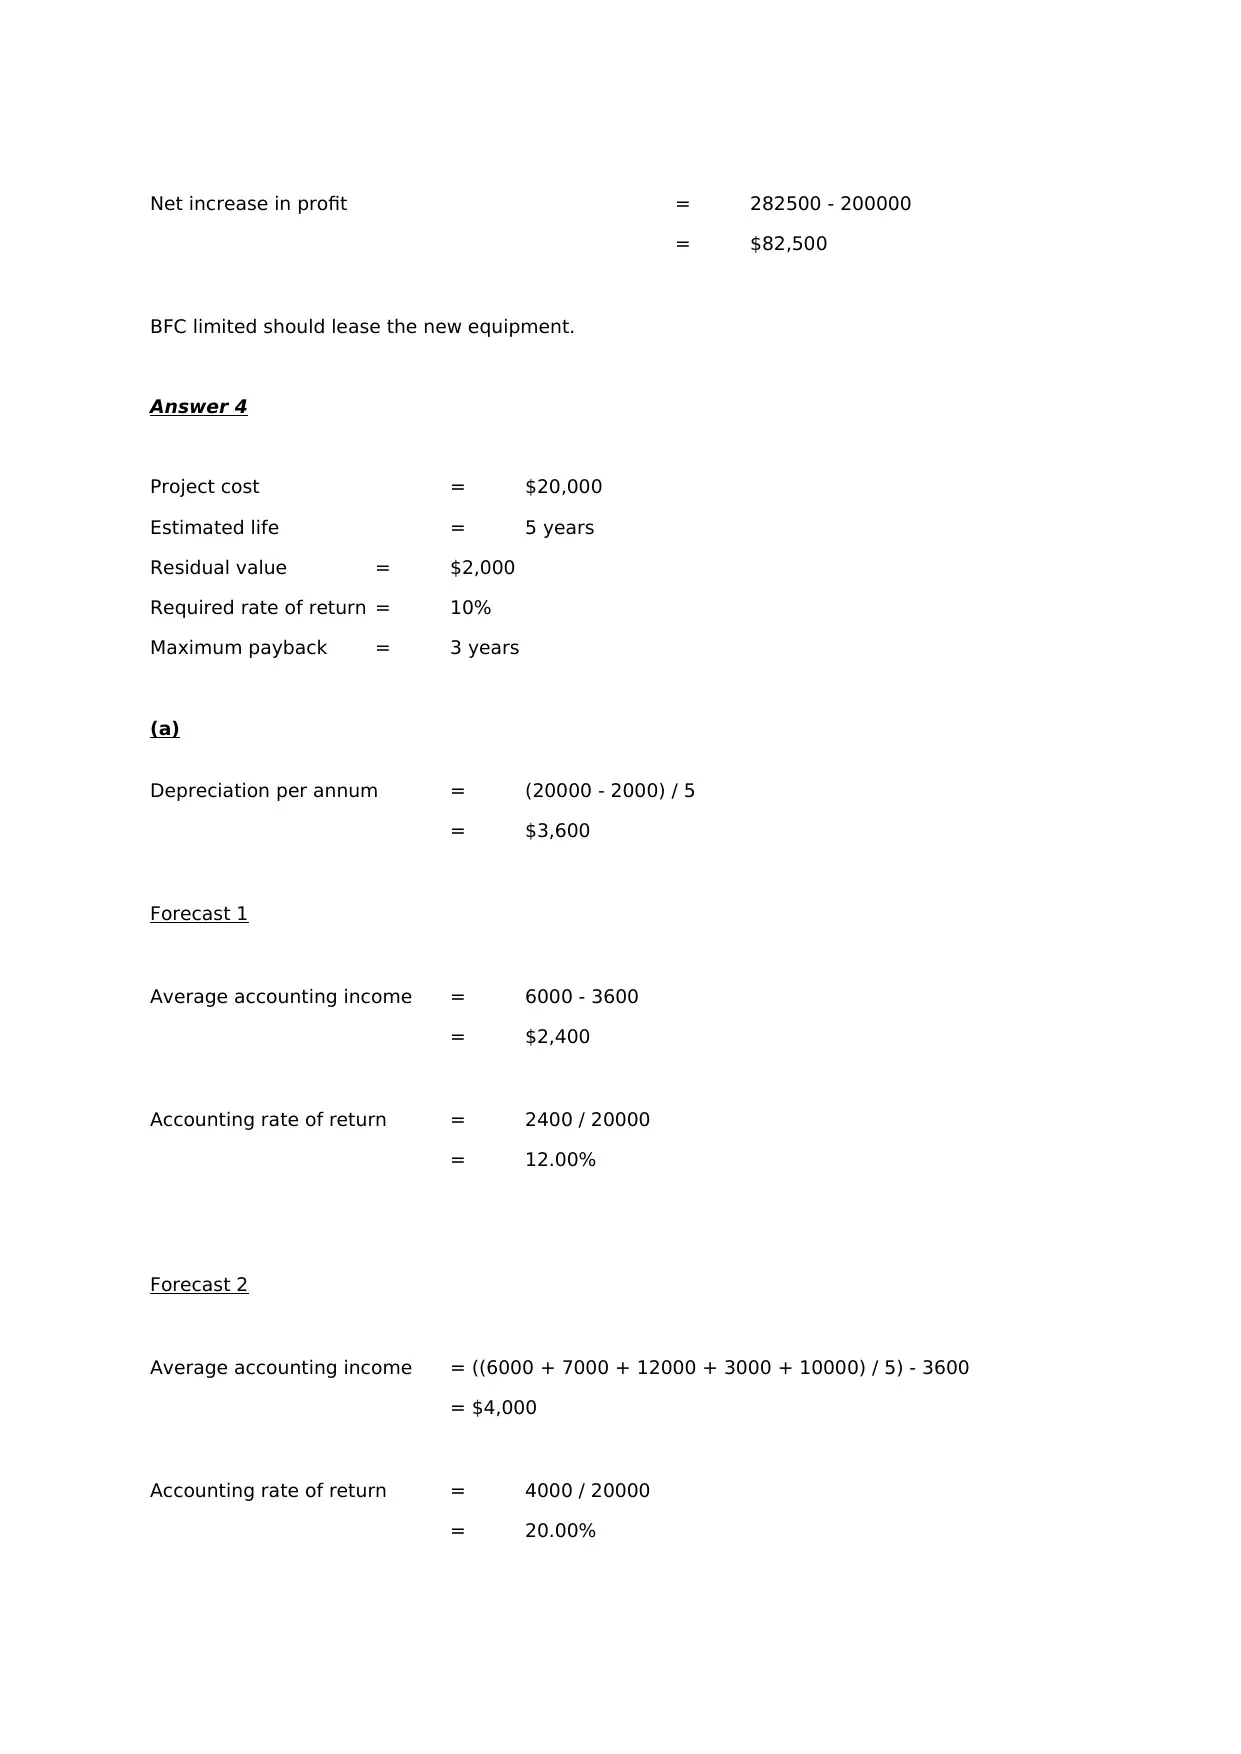
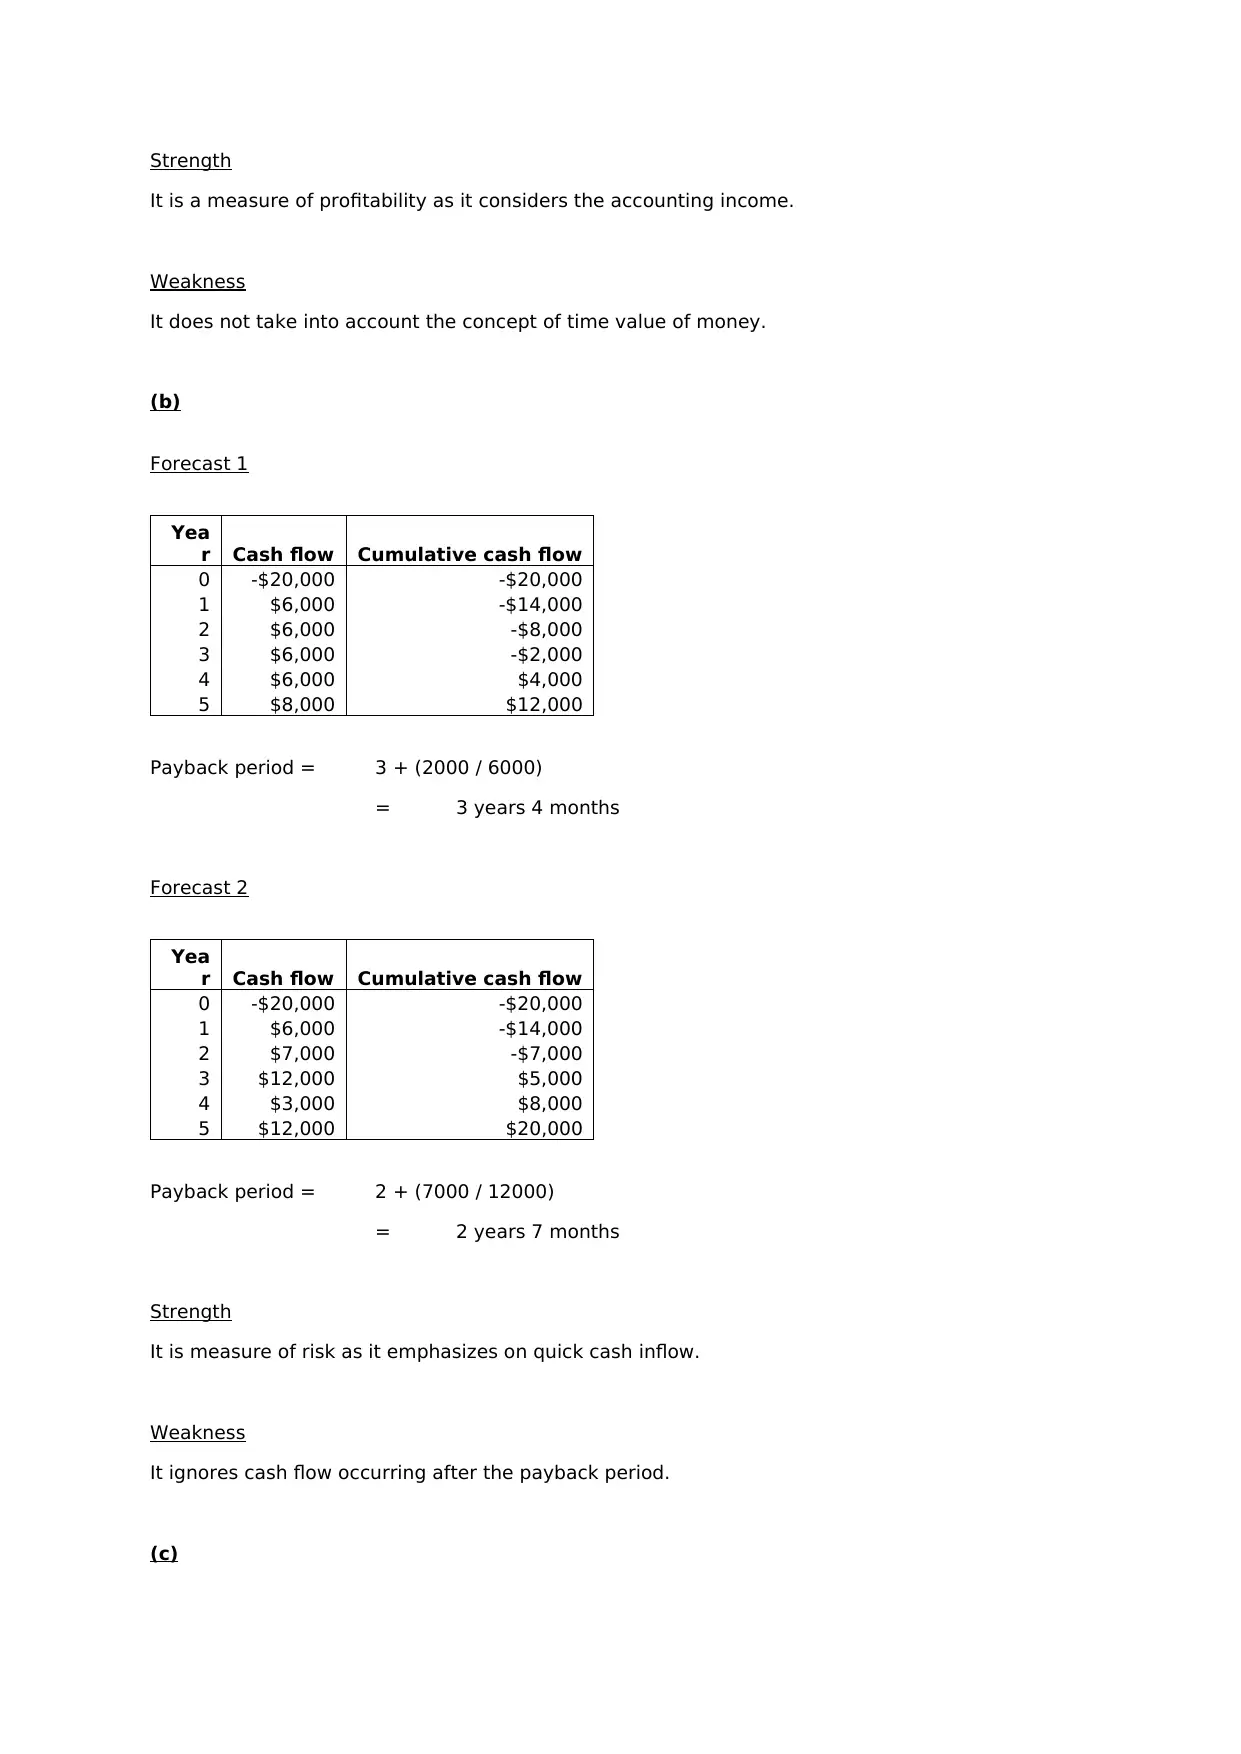
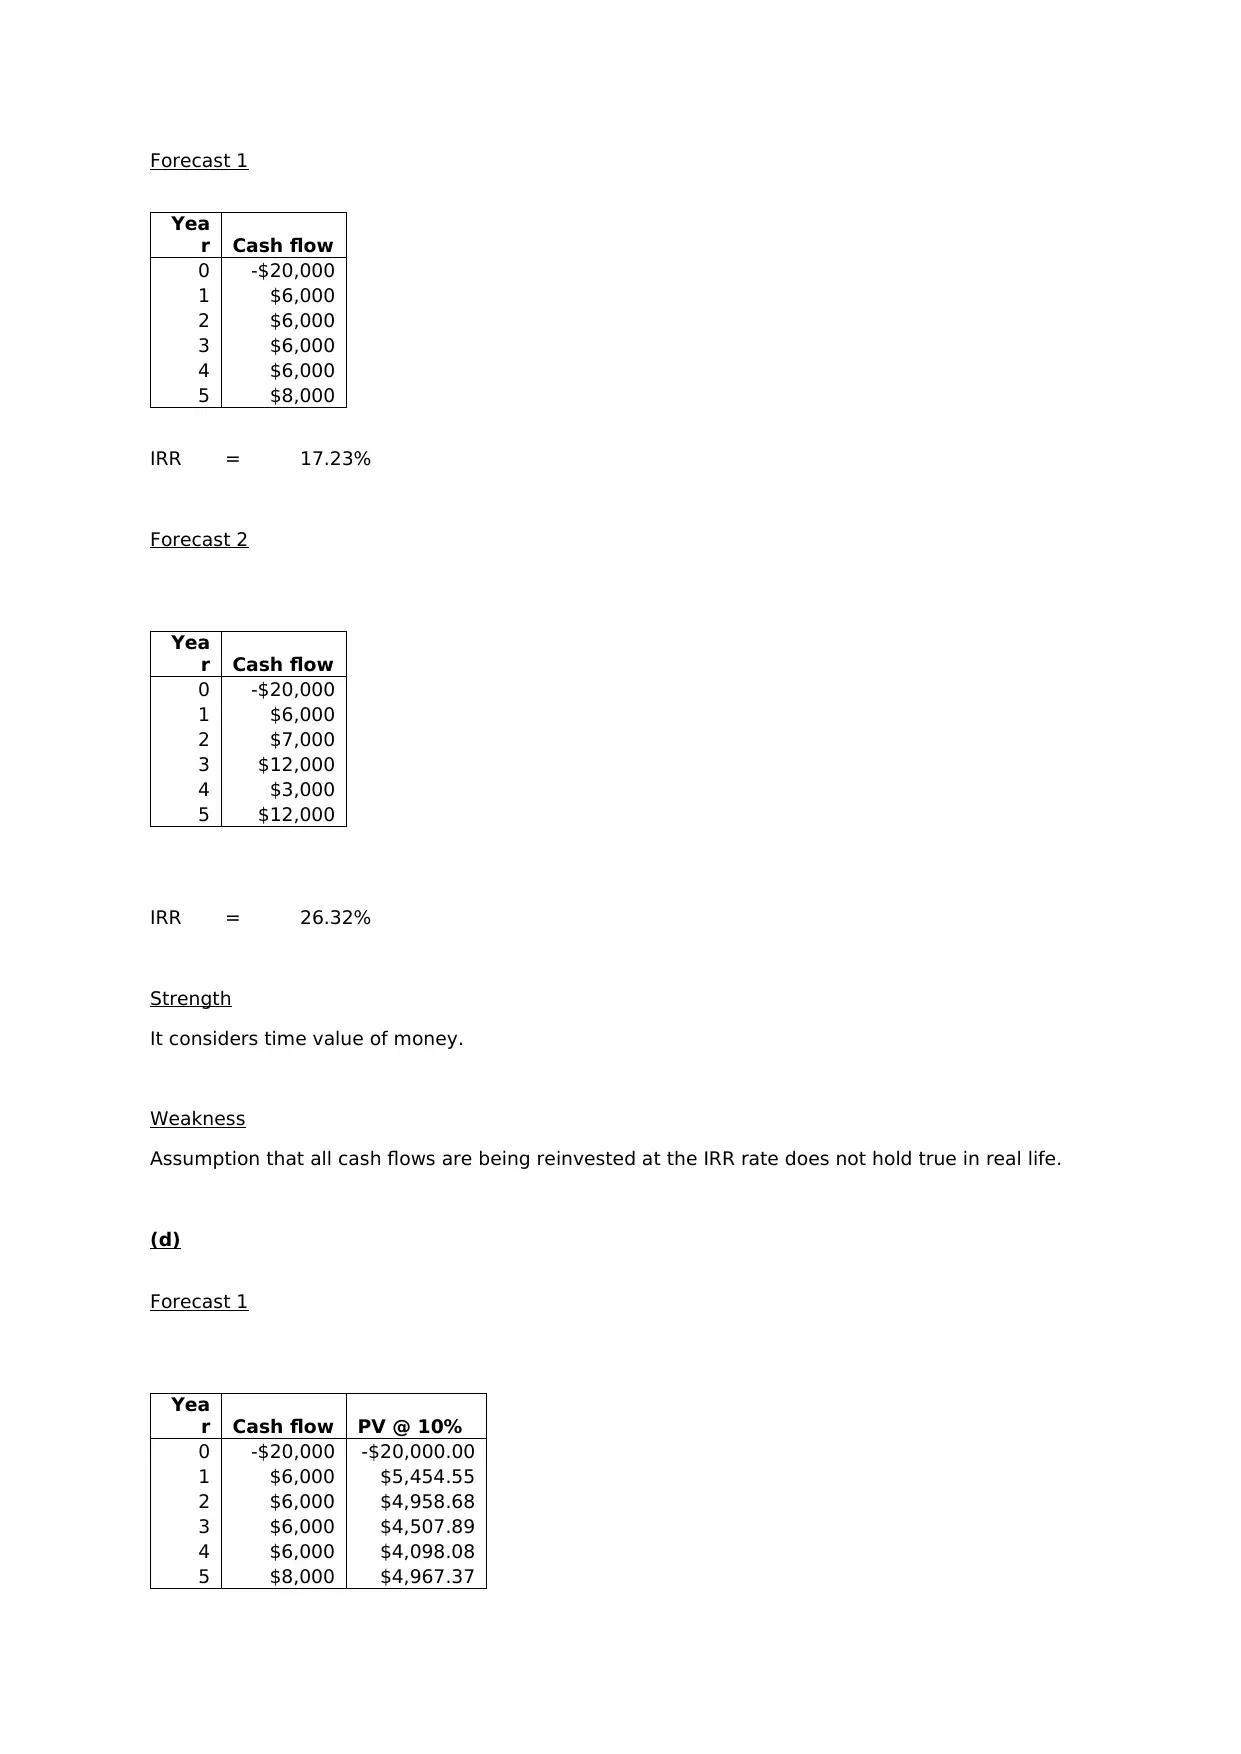
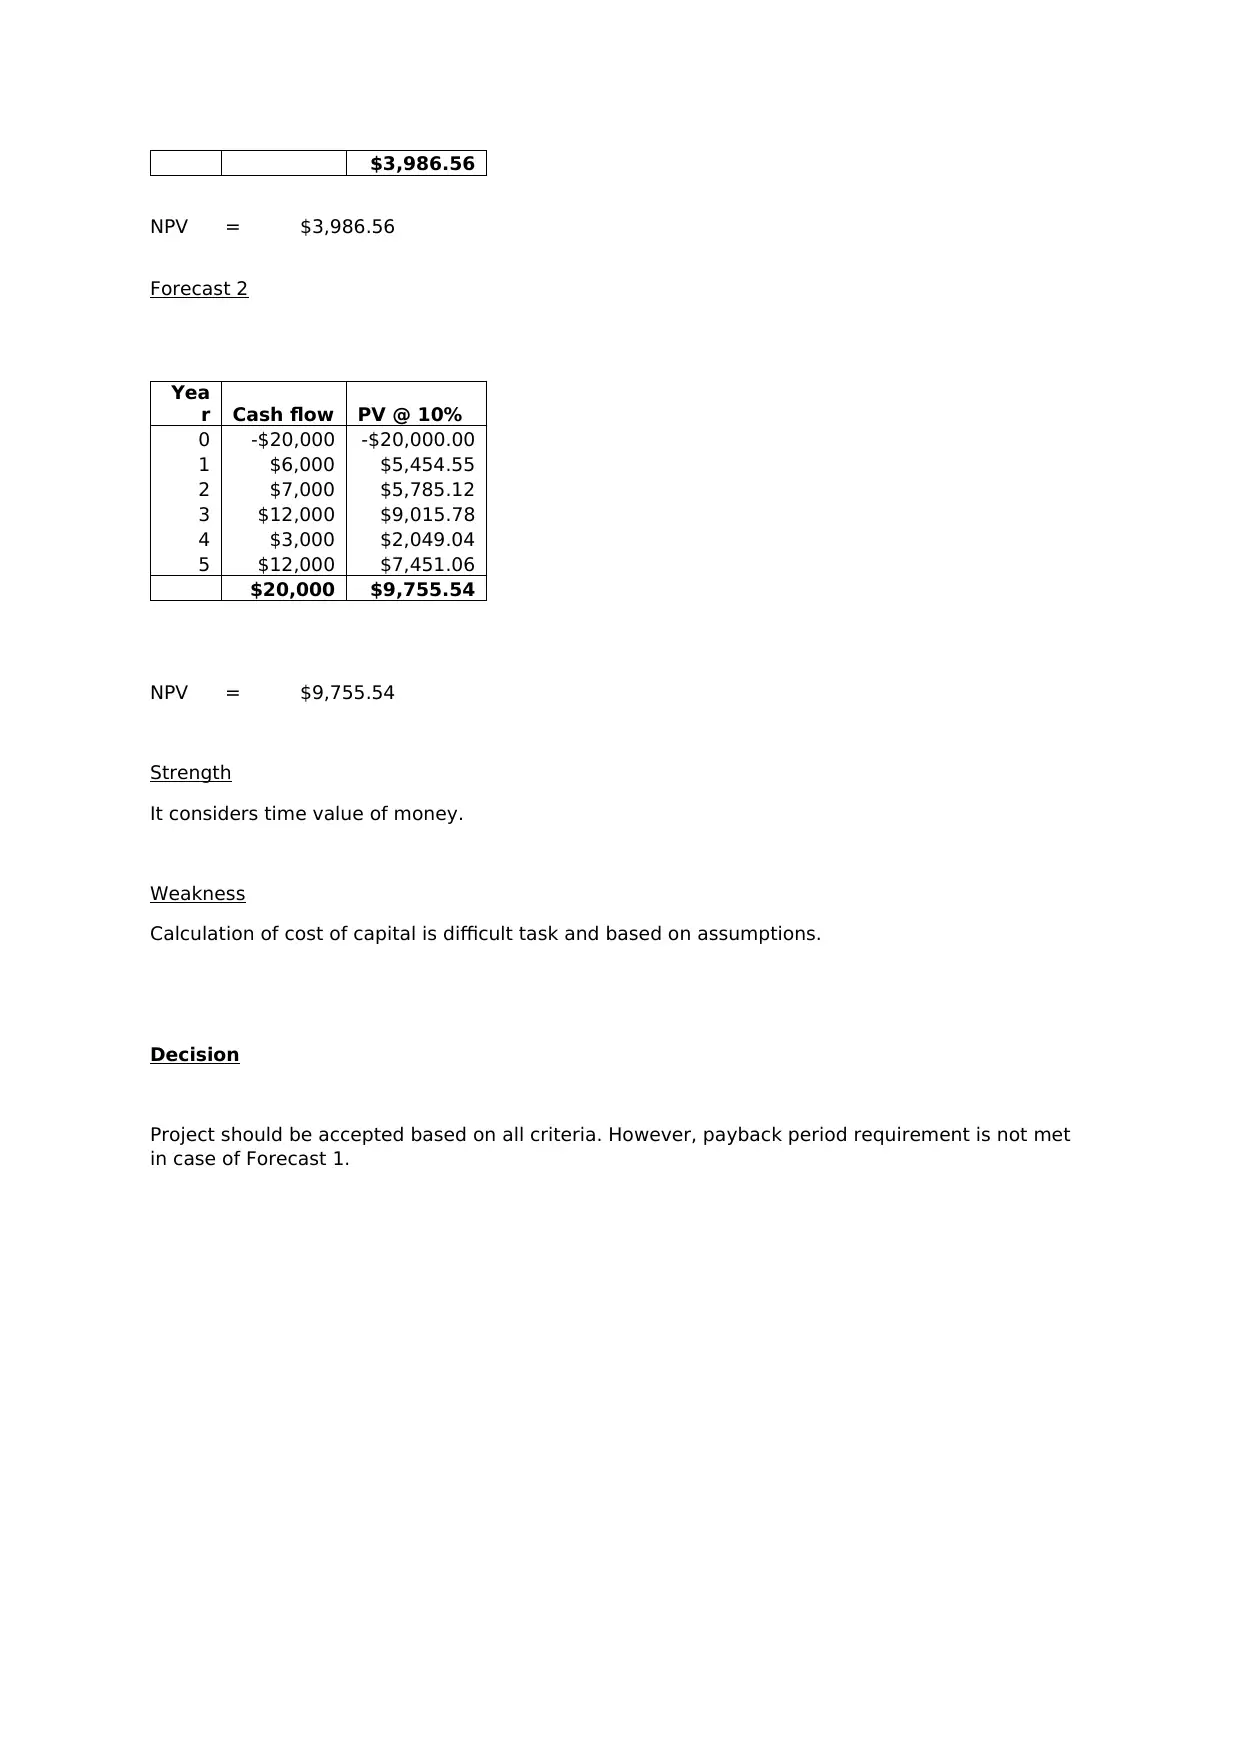
This assignment provides a comprehensive financial analysis, covering various aspects of financial planning and decision-making. It begins with an analysis of key performance indicators, including advertising spend, loan approval times, and profitability metrics. The assignment then delves into sales and production budgeting, including detailed calculations for product sales, production requirements, and component purchases. A profit and loss forecast is also included, projecting financial performance over a six-month period. Further, the assignment explores break-even analysis, determining the break-even point in units and dollars, and assessing the impact of leasing equipment on profitability. Finally, the assignment evaluates investment decisions using different appraisal techniques, such as accounting rate of return, payback period, internal rate of return, and net present value, providing a comparative analysis of the strengths and weaknesses of each method.
Document Page
Answer 1
Major brand building advertising spend Strategic and Driver
Loan approval times
Operating and
Outcome
Loan approved (in dollars)
Operating and
Outcome
Loan applications numbers received online Operating and Driver
Loans numbers sent for collection due to being 60 days overdue Strategic and Outcome
Profitability of the loan book Strategic and Outcome
Percentage of loans funded against loans approved Strategic and Outcome
Answer 2
Sales Budget
Particulars Product A Product B Total
Sales unit 16,200 11,800
Sale price per unit (in $) 14.35 12.20
Total Sales (in $) 232,470 143,960 376,430
Production Budget (units)
Particulars Product A Product B
Inventory units - closing 8,100 6,600
Sales unit 16,200 11,800
Less: Inventory units - opening - 5,100 - 2,600
Production required 19,200 15,800
Purchases budget for components (units)
Particulars Component X Component Y
Inventory units - closing 46,000 19,500
Requirement for Product A 96,000 38,400
Requirement for Product B 47,400 63,200
Less: Inventory units - opening - 38,000 - 13,500
Purchases required 151,400 107,600
Purchases budget in dollars
Particulars Component X Component Y Total
Purchases required (units) 151,400 107,600
Unit cost of component (in $) 0.68 0.24
Purchases required (in $) 102,952 25,824 128,776
Total labour hours and costs for the six months
Particulars Product A Product B Total
Production required 19,200 15,800
Labour hours required per unit 2 1
Total labour hours
required 38,400 15,800 54,200
Cost per hour 4.50 4.00
tabler-icon-diamond-filled.svg

Paraphrase This Document

Need a fresh take? Get an instant paraphrase of this document with our AI Paraphraser
Document Page
Total labour cost (in $) 172,800 63,200 236,000
Contribution per unit (in dollars)
Particulars Product A Product B
Sale price per unit 14.35 12.20
Less: Component X required per unit - 3.40 - 2.04
Less: Component Y required per unit - 0.48 - 0.96
Less: Labour cost per unit - 9.00 - 4.00
Contribution per unit 1.47 5.20
Profit and Loss forecast for the six months
Particulars Product A ($) Product B ($) Total ($)
Sales 232,470 143,960 376,430
Less: Cost of goods sold
Cost of Component X and Y - 62,856 - 35,400 - 98,256
Labour cost - 145,800 - 47,200 - 193,000
Overhead costs - 250,000
Estimated profit (loss) - 164,826
Answer 3
(a)
Sale price per unit = $250
Variable cost per unit = $185
Fixed cost = $250,000
Total units = 5,000
Contribution per unit = 250 - 185
= $65
Break-even point (in units) = Fixed costs / Contribution per unit
= 250000 / 65
= 3,846.15
Break-even point (in dollars) = Break-even (in units) x Sale price per unit
= 3846.15 x 250
= $961,538.46
Document Page
(b)
(c)
Profit when sales are 5000 units = (5000 x 65) - 250000
= $75,000
(d)
Lease rental = $200,000
Additional profit on existing 5000 units due to lease = 5000 (185 - 175)
= $50,000
Additional profit due to increase in sales unit by 3100 = 3100 (250 - 175)
= $232,500
Total increase in profit due to lease = 232500 + 50000
= $282,500
Document Page
Net increase in profit = 282500 - 200000
= $82,500
BFC limited should lease the new equipment.
Answer 4
Project cost = $20,000
Estimated life = 5 years
Residual value = $2,000
Required rate of return = 10%
Maximum payback = 3 years
(a)
Depreciation per annum = (20000 - 2000) / 5
= $3,600
Forecast 1
Average accounting income = 6000 - 3600
= $2,400
Accounting rate of return = 2400 / 20000
= 12.00%
Forecast 2
Average accounting income = ((6000 + 7000 + 12000 + 3000 + 10000) / 5) - 3600
= $4,000
Accounting rate of return = 4000 / 20000
= 20.00%
tabler-icon-diamond-filled.svg

Paraphrase This Document

Need a fresh take? Get an instant paraphrase of this document with our AI Paraphraser
Document Page
Strength
It is a measure of profitability as it considers the accounting income.
Weakness
It does not take into account the concept of time value of money.
(b)
Forecast 1
Yea
r Cash flow Cumulative cash flow
0 -$20,000 -$20,000
1 $6,000 -$14,000
2 $6,000 -$8,000
3 $6,000 -$2,000
4 $6,000 $4,000
5 $8,000 $12,000
Payback period = 3 + (2000 / 6000)
= 3 years 4 months
Forecast 2
Yea
r Cash flow Cumulative cash flow
0 -$20,000 -$20,000
1 $6,000 -$14,000
2 $7,000 -$7,000
3 $12,000 $5,000
4 $3,000 $8,000
5 $12,000 $20,000
Payback period = 2 + (7000 / 12000)
= 2 years 7 months
Strength
It is measure of risk as it emphasizes on quick cash inflow.
Weakness
It ignores cash flow occurring after the payback period.
(c)
Document Page
Forecast 1
Yea
r Cash flow
0 -$20,000
1 $6,000
2 $6,000
3 $6,000
4 $6,000
5 $8,000
IRR = 17.23%
Forecast 2
Yea
r Cash flow
0 -$20,000
1 $6,000
2 $7,000
3 $12,000
4 $3,000
5 $12,000
IRR = 26.32%
Strength
It considers time value of money.
Weakness
Assumption that all cash flows are being reinvested at the IRR rate does not hold true in real life.
(d)
Forecast 1
Yea
r Cash flow PV @ 10%
0 -$20,000 -$20,000.00
1 $6,000 $5,454.55
2 $6,000 $4,958.68
3 $6,000 $4,507.89
4 $6,000 $4,098.08
5 $8,000 $4,967.37
Document Page
$3,986.56
NPV = $3,986.56
Forecast 2
Yea
r Cash flow PV @ 10%
0 -$20,000 -$20,000.00
1 $6,000 $5,454.55
2 $7,000 $5,785.12
3 $12,000 $9,015.78
4 $3,000 $2,049.04
5 $12,000 $7,451.06
$20,000 $9,755.54
NPV = $9,755.54
Strength
It considers time value of money.
Weakness
Calculation of cost of capital is difficult task and based on assumptions.
Decision
Project should be accepted based on all criteria. However, payback period requirement is not met
in case of Forecast 1.
chevron_up_icon
1 out of 7
circle_padding
hide_on_mobile
zoom_out_icon
[object Object]