University Finance: Managing Financial Resources and Decisions Report
VerifiedAdded on 2019/12/03
|31
|6508
|25
Report
AI Summary
This report comprehensively examines financial resource management and decision-making. It begins by exploring various sources of finance for enterprises, including bank loans, equity, and debentures, along with their implications and suitability for different business types. The report then delves into the importance of financial planning, types of financial information required by managers (income statements, balance sheets, and cash flow statements), and explanatory notes on financial statements. The core of the report involves an in-depth analysis of a sales budget and cash flow forecast, calculation of breakeven points under different scenarios, and the application of project evaluation techniques like payback period, ARR, NPV, and IRR. Finally, the report concludes with a discussion of financial terms, formats of financial statements for different business structures (sole trader, company, partnership, and non-profit organizations), and a detailed ratio analysis to evaluate company performance.

MANAGING FINANCIAL
RESOURCES AND DECISIONS
RESOURCES AND DECISIONS
Paraphrase This Document
Need a fresh take? Get an instant paraphrase of this document with our AI Paraphraser
TABLE OF CONTENTS
INTRODUCTION...........................................................................................................................3
TASK 1............................................................................................................................................3
1.1 Sources of finance for enterprises ........................................................................................3
1.2 Implications of source of finance .........................................................................................3
1.3 Selection of source of finance ..............................................................................................5
TASK 2............................................................................................................................................5
2.2 Importance of financial planning..........................................................................................6
2.3 Types of financial information required by the managers....................................................6
2.4 Explanatory notes on financial statements with reference to finance and cost ....................7
TASK 3............................................................................................................................................7
3.1 Analysis of sales budget and cash flow forecast...................................................................7
3.2 Calculation of breakeven point under different options........................................................9
3.3 Project evaluation techniques..............................................................................................13
TASK 4..........................................................................................................................................15
4.1 Explanation on various terms and accounts........................................................................15
4.2 Format of financial statements for different business ........................................................16
..................................................................................................................................................16
4.3 Ratio analysis......................................................................................................................29
CONCLSUION .............................................................................................................................30
REFERECNES..............................................................................................................................31
INDEX OF TABLES
Table 1: Implications of sources of finance.....................................................................................4
Table 2: Sample income statement..................................................................................................8
Table 3: Sample balance sheet.........................................................................................................8
Table 4: Break even in case of increase in sales price...................................................................11
Table 5: Break even in case of increase or decrease in fixed cost.................................................11
Table 6: Break even in case of increase or decrease in material rates...........................................12
Table 7: Break even in case of increase or decrease in labor rates................................................13
Table 8: Calculation of payback period method............................................................................14
Table 9: Calculation of ARR.........................................................................................................14
Table 10: Calculation of NPV........................................................................................................15
Table 11: Calculation of IRR.........................................................................................................15
Table 12: Ratio analysis.................................................................................................................31
ILLUSTRATION INDEX
Illustration 1: Sole trader income statement..................................................................................17
Illustration 2: Balance sheet of sole trader.....................................................................................18
Illustration 3: Cash flow statement of sole trader..........................................................................19
Illustration 4: Income statement of company.................................................................................22
Illustration 5: Balance sheet of company.......................................................................................23
Illustration 6: Cash flow statement of company............................................................................24
Illustration 7: Income statement of partnership.............................................................................25
Illustration 8: Balance sheet of partnership...................................................................................26
Illustration 9: Cash flow statement for partnership........................................................................27
Illustration 10: Income statement of nonprofit organizations........................................................29
Illustration 11: Balance sheet of nonprofit organizations..............................................................30
⊘ This is a preview!⊘
Do you want full access?
Subscribe today to unlock all pages.
Trusted by 1+ million students worldwide
INTRODUCTION
Finance plays a vital role in growth of an organization. Thus, it is necessary to look after
various issues related to the finance. In respect to this in report sources of finance are described
and along with this their suitability to business requirements is also defined. At the middle part
of the report, project evaluation techniques are applied and their results are interpreted in proper
manner. Along with this breaks even analysis is also done on the available options and their
interpretation is also done in proper manner. At the end of the report, ratio analysis is done and
company performance is evaluated from various points.
TASK 1
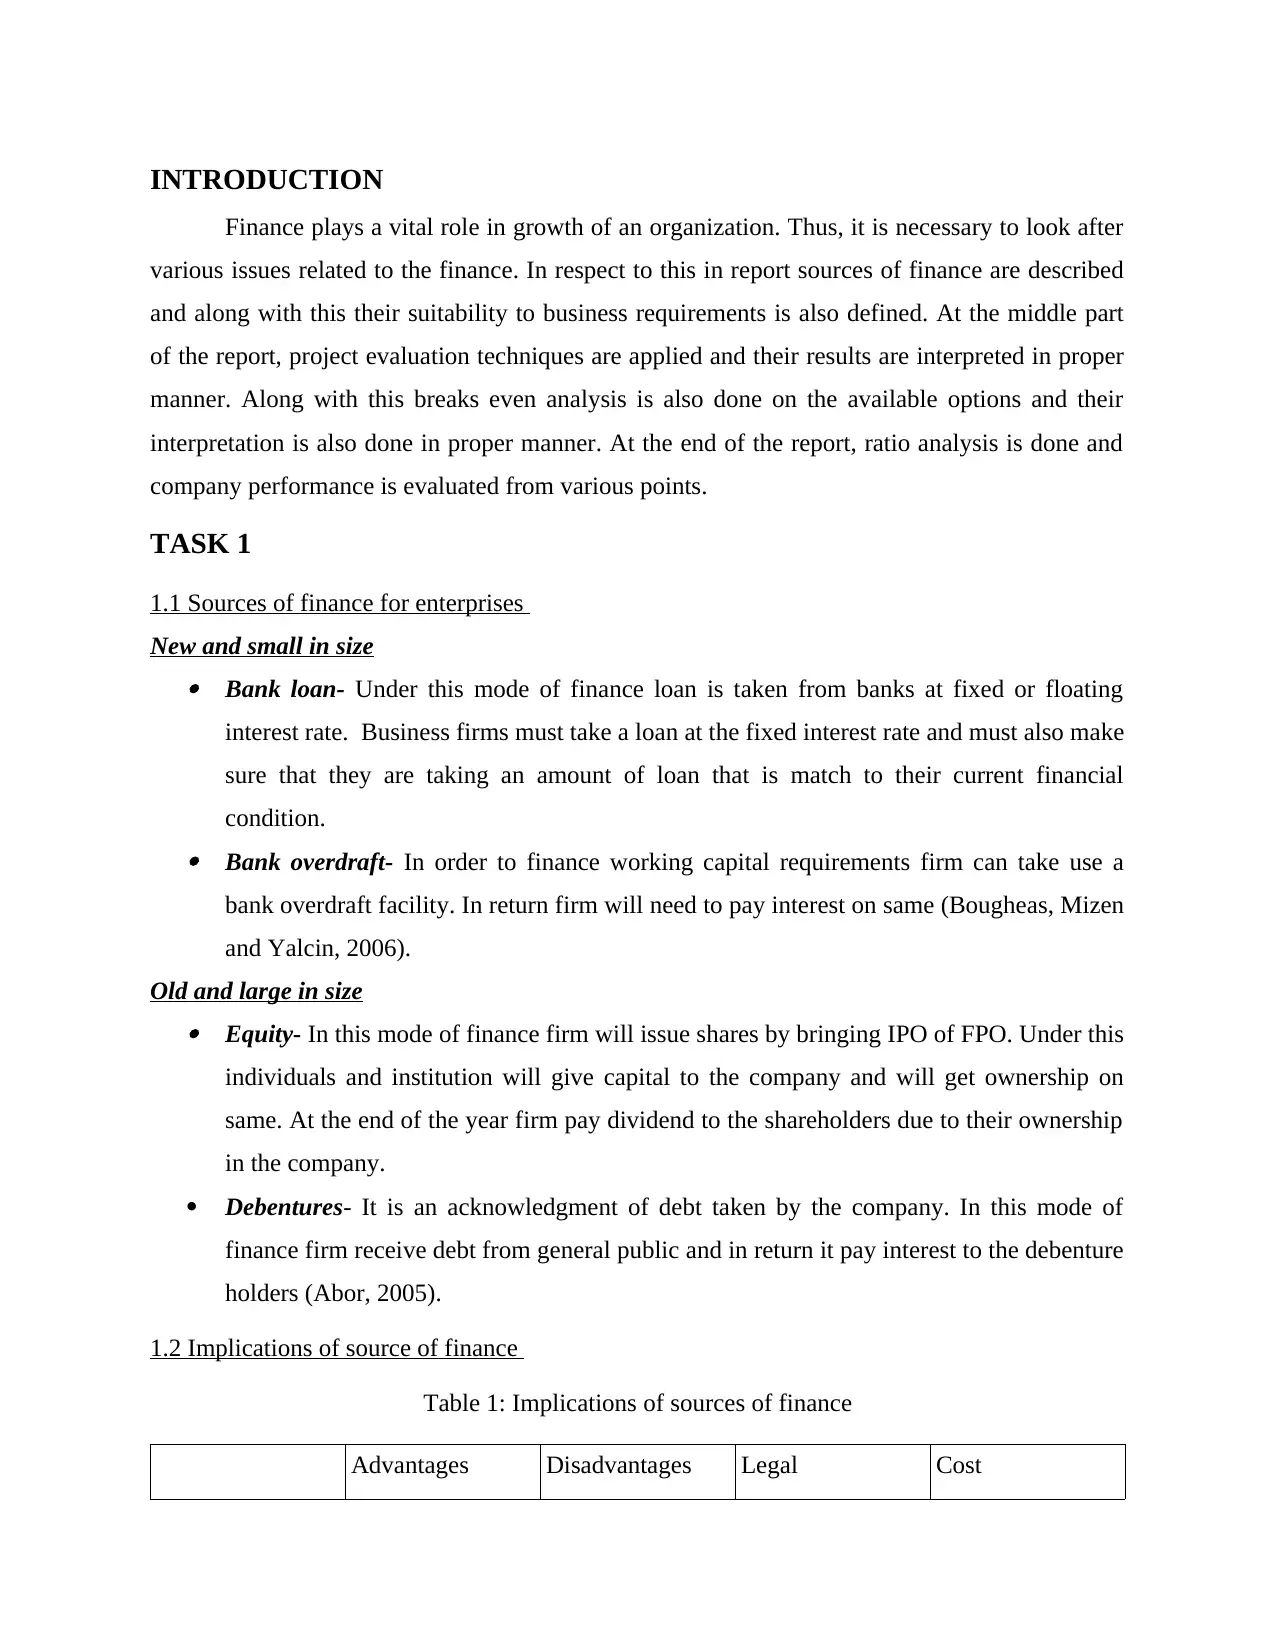
1.1 Sources of finance for enterprises
New and small in size Bank loan- Under this mode of finance loan is taken from banks at fixed or floating
interest rate. Business firms must take a loan at the fixed interest rate and must also make
sure that they are taking an amount of loan that is match to their current financial
condition. Bank overdraft- In order to finance working capital requirements firm can take use a
bank overdraft facility. In return firm will need to pay interest on same (Bougheas, Mizen
and Yalcin, 2006).
Old and large in size Equity- In this mode of finance firm will issue shares by bringing IPO of FPO. Under this
individuals and institution will give capital to the company and will get ownership on
same. At the end of the year firm pay dividend to the shareholders due to their ownership
in the company.
Debentures- It is an acknowledgment of debt taken by the company. In this mode of
finance firm receive debt from general public and in return it pay interest to the debenture
holders (Abor, 2005).
1.2 Implications of source of finance
Table 1: Implications of sources of finance
Advantages Disadvantages Legal Cost
Finance plays a vital role in growth of an organization. Thus, it is necessary to look after
various issues related to the finance. In respect to this in report sources of finance are described
and along with this their suitability to business requirements is also defined. At the middle part
of the report, project evaluation techniques are applied and their results are interpreted in proper
manner. Along with this breaks even analysis is also done on the available options and their
interpretation is also done in proper manner. At the end of the report, ratio analysis is done and
company performance is evaluated from various points.
TASK 1
1.1 Sources of finance for enterprises
New and small in size Bank loan- Under this mode of finance loan is taken from banks at fixed or floating
interest rate. Business firms must take a loan at the fixed interest rate and must also make
sure that they are taking an amount of loan that is match to their current financial
condition. Bank overdraft- In order to finance working capital requirements firm can take use a
bank overdraft facility. In return firm will need to pay interest on same (Bougheas, Mizen
and Yalcin, 2006).
Old and large in size Equity- In this mode of finance firm will issue shares by bringing IPO of FPO. Under this
individuals and institution will give capital to the company and will get ownership on
same. At the end of the year firm pay dividend to the shareholders due to their ownership
in the company.
Debentures- It is an acknowledgment of debt taken by the company. In this mode of
finance firm receive debt from general public and in return it pay interest to the debenture
holders (Abor, 2005).
1.2 Implications of source of finance
Table 1: Implications of sources of finance
Advantages Disadvantages Legal Cost
Paraphrase This Document
Need a fresh take? Get an instant paraphrase of this document with our AI Paraphraser
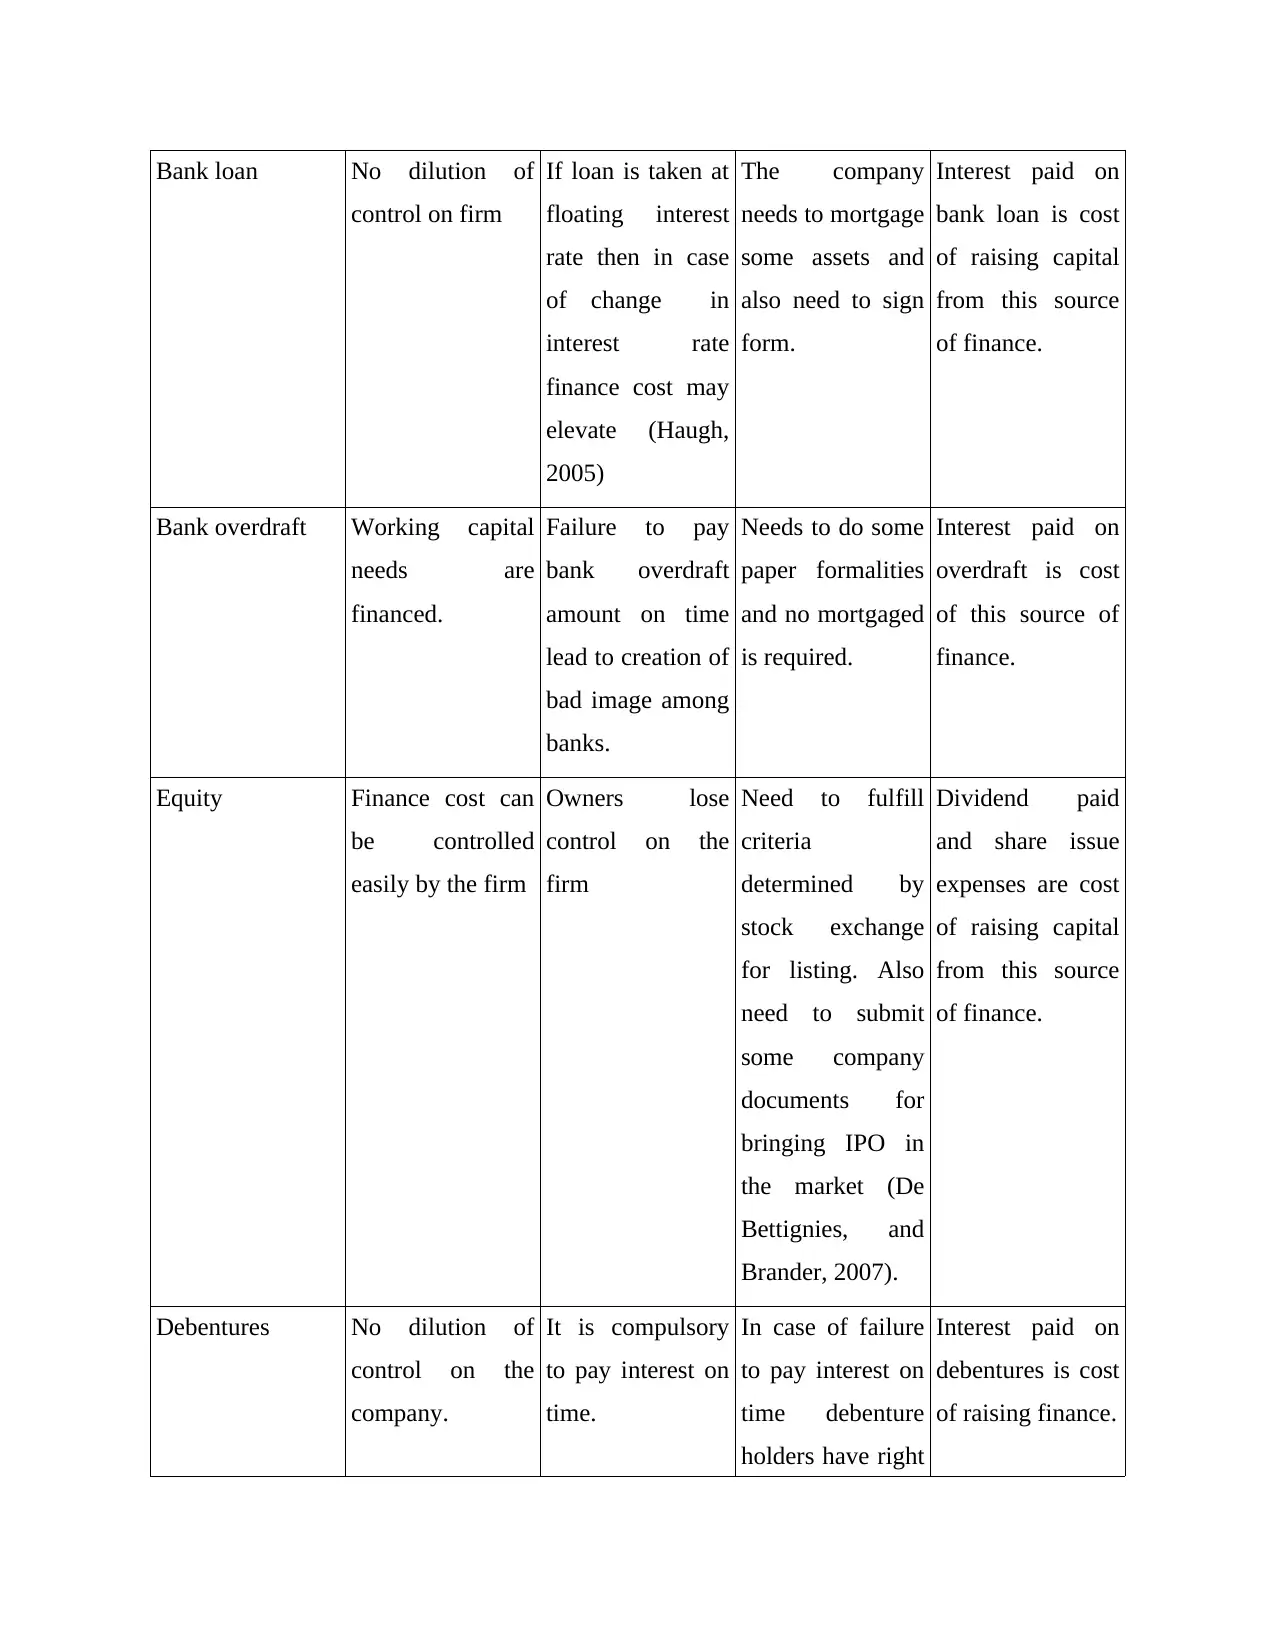
Bank loan No dilution of
control on firm
If loan is taken at
floating interest
rate then in case
of change in
interest rate
finance cost may
elevate (Haugh,
2005)
The company
needs to mortgage
some assets and
also need to sign
form.
Interest paid on
bank loan is cost
of raising capital
from this source
of finance.
Bank overdraft Working capital
needs are
financed.
Failure to pay
bank overdraft
amount on time
lead to creation of
bad image among
banks.
Needs to do some
paper formalities
and no mortgaged
is required.
Interest paid on
overdraft is cost
of this source of
finance.
Equity Finance cost can
be controlled
easily by the firm
Owners lose
control on the
firm
Need to fulfill
criteria
determined by
stock exchange
for listing. Also
need to submit
some company
documents for
bringing IPO in
the market (De
Bettignies, and
Brander, 2007).
Dividend paid
and share issue
expenses are cost
of raising capital
from this source
of finance.
Debentures No dilution of
control on the
company.
It is compulsory
to pay interest on
time.
In case of failure
to pay interest on
time debenture
holders have right
Interest paid on
debentures is cost
of raising finance.
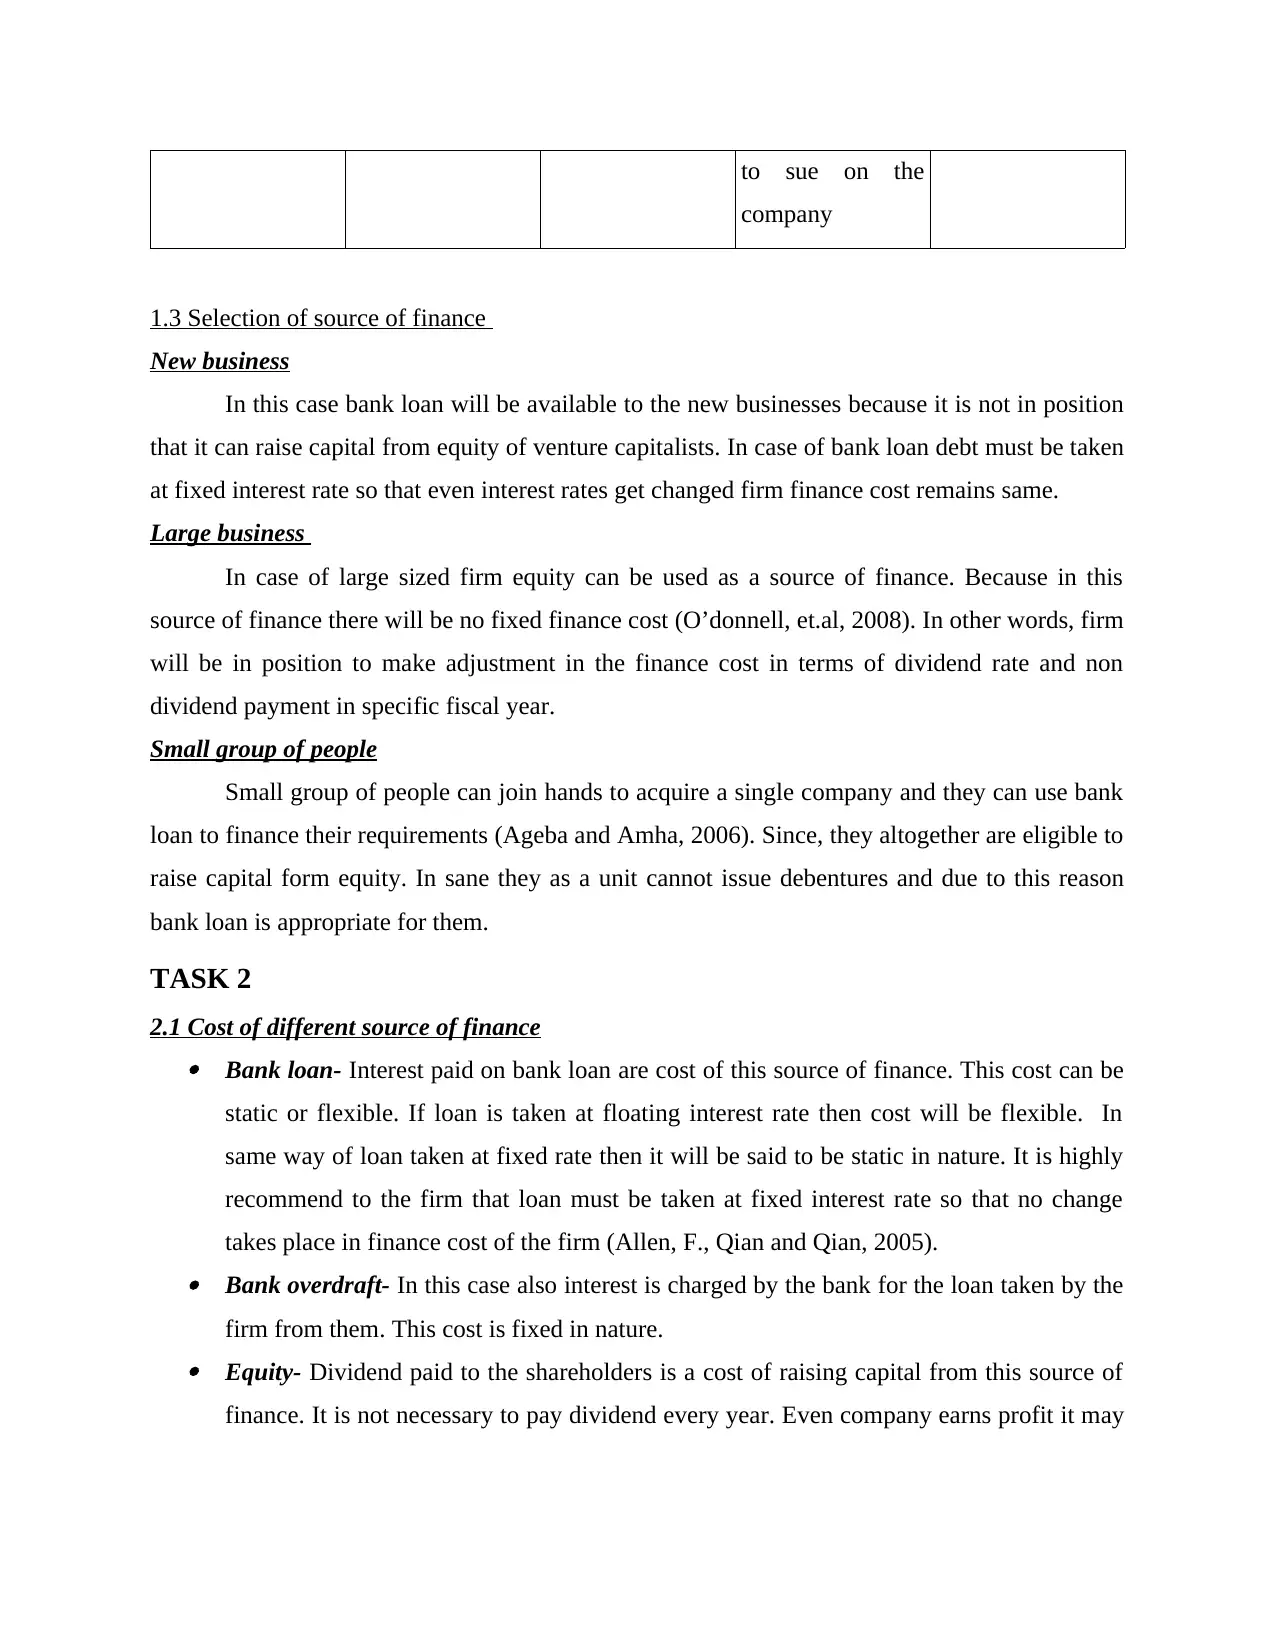
to sue on the
company
1.3 Selection of source of finance
New business
In this case bank loan will be available to the new businesses because it is not in position
that it can raise capital from equity of venture capitalists. In case of bank loan debt must be taken
at fixed interest rate so that even interest rates get changed firm finance cost remains same.
Large business
In case of large sized firm equity can be used as a source of finance. Because in this
source of finance there will be no fixed finance cost (O’donnell, et.al, 2008). In other words, firm
will be in position to make adjustment in the finance cost in terms of dividend rate and non
dividend payment in specific fiscal year.
Small group of people
Small group of people can join hands to acquire a single company and they can use bank
loan to finance their requirements (Ageba and Amha, 2006). Since, they altogether are eligible to
raise capital form equity. In sane they as a unit cannot issue debentures and due to this reason
bank loan is appropriate for them.
TASK 2
2.1 Cost of different source of finance Bank loan- Interest paid on bank loan are cost of this source of finance. This cost can be
static or flexible. If loan is taken at floating interest rate then cost will be flexible. In
same way of loan taken at fixed rate then it will be said to be static in nature. It is highly
recommend to the firm that loan must be taken at fixed interest rate so that no change
takes place in finance cost of the firm (Allen, F., Qian and Qian, 2005). Bank overdraft- In this case also interest is charged by the bank for the loan taken by the
firm from them. This cost is fixed in nature. Equity- Dividend paid to the shareholders is a cost of raising capital from this source of
finance. It is not necessary to pay dividend every year. Even company earns profit it may
⊘ This is a preview!⊘
Do you want full access?
Subscribe today to unlock all pages.
Trusted by 1+ million students worldwide
deny from paying dividend to the shareholders. Hence, finance cost is adjustable in case
of equity.
Debentures- In case of this source of finance also interest is paid by the firm to the
debenture holders. It is fixed finance cost and cannot be altered like can be done in case
of bank loan (Abor and Biekpe, 2006). In case of downturn in economy interest payment
may create heavy burden on the firm.
2.2 Importance of financial planning
Financial planning has a great importance for the business because money is a resource
that is limited available to the firm. On other hand, firm perform lots of activities that required
finance. Hence, this makes it inevitable for the firm to make prudent use of the finance. There are
various categories of activities for which finance is required like investment and finance
activities. In these activities there are many sub activities (Corsatea, Giaccaria. and Arántegui,
2014). By preparing a finance plan firm determine from where it will arrange finance and way in
which it will use funds in all these sub activities; so that they can be performed easily without
any problem. Hence, it can be said that by making this plan funds are allocated among several
activities in legitimate manner and make best possible use of this scarce resource.
2.3 Types of financial information required by the managers
Types of financial information that are required for decision making purpose are as
follows. Income statement- In this statement all information about income and expenses is made
available. By reviewing these statement managers comes to know about expenses where
they make extravagance. Hence, it can be said that this statement helps managers in
identifying areas where they are making a mistake and needs to take immediate action to
rectify mistake (Huggins, 2008). Balance sheet- By analyzing balance sheet managers came to know about the financial
position of the company. By doing this managers also identify various areas where they
gives fabulous and poor performance. Hence, managers form a tactics to convert their
weakness in to strength. In this way, balance sheet gets improved for the next financial
year.
Cash flow statement- This statement indicate the areas from which cash inflow happen
and domains where these cash flows are incurred by the business (Hyman, 2013). Thus,
Paraphrase This Document
Need a fresh take? Get an instant paraphrase of this document with our AI Paraphraser
analysis of this statement helps firm in formulating its cash management strategy for the
next financial year.
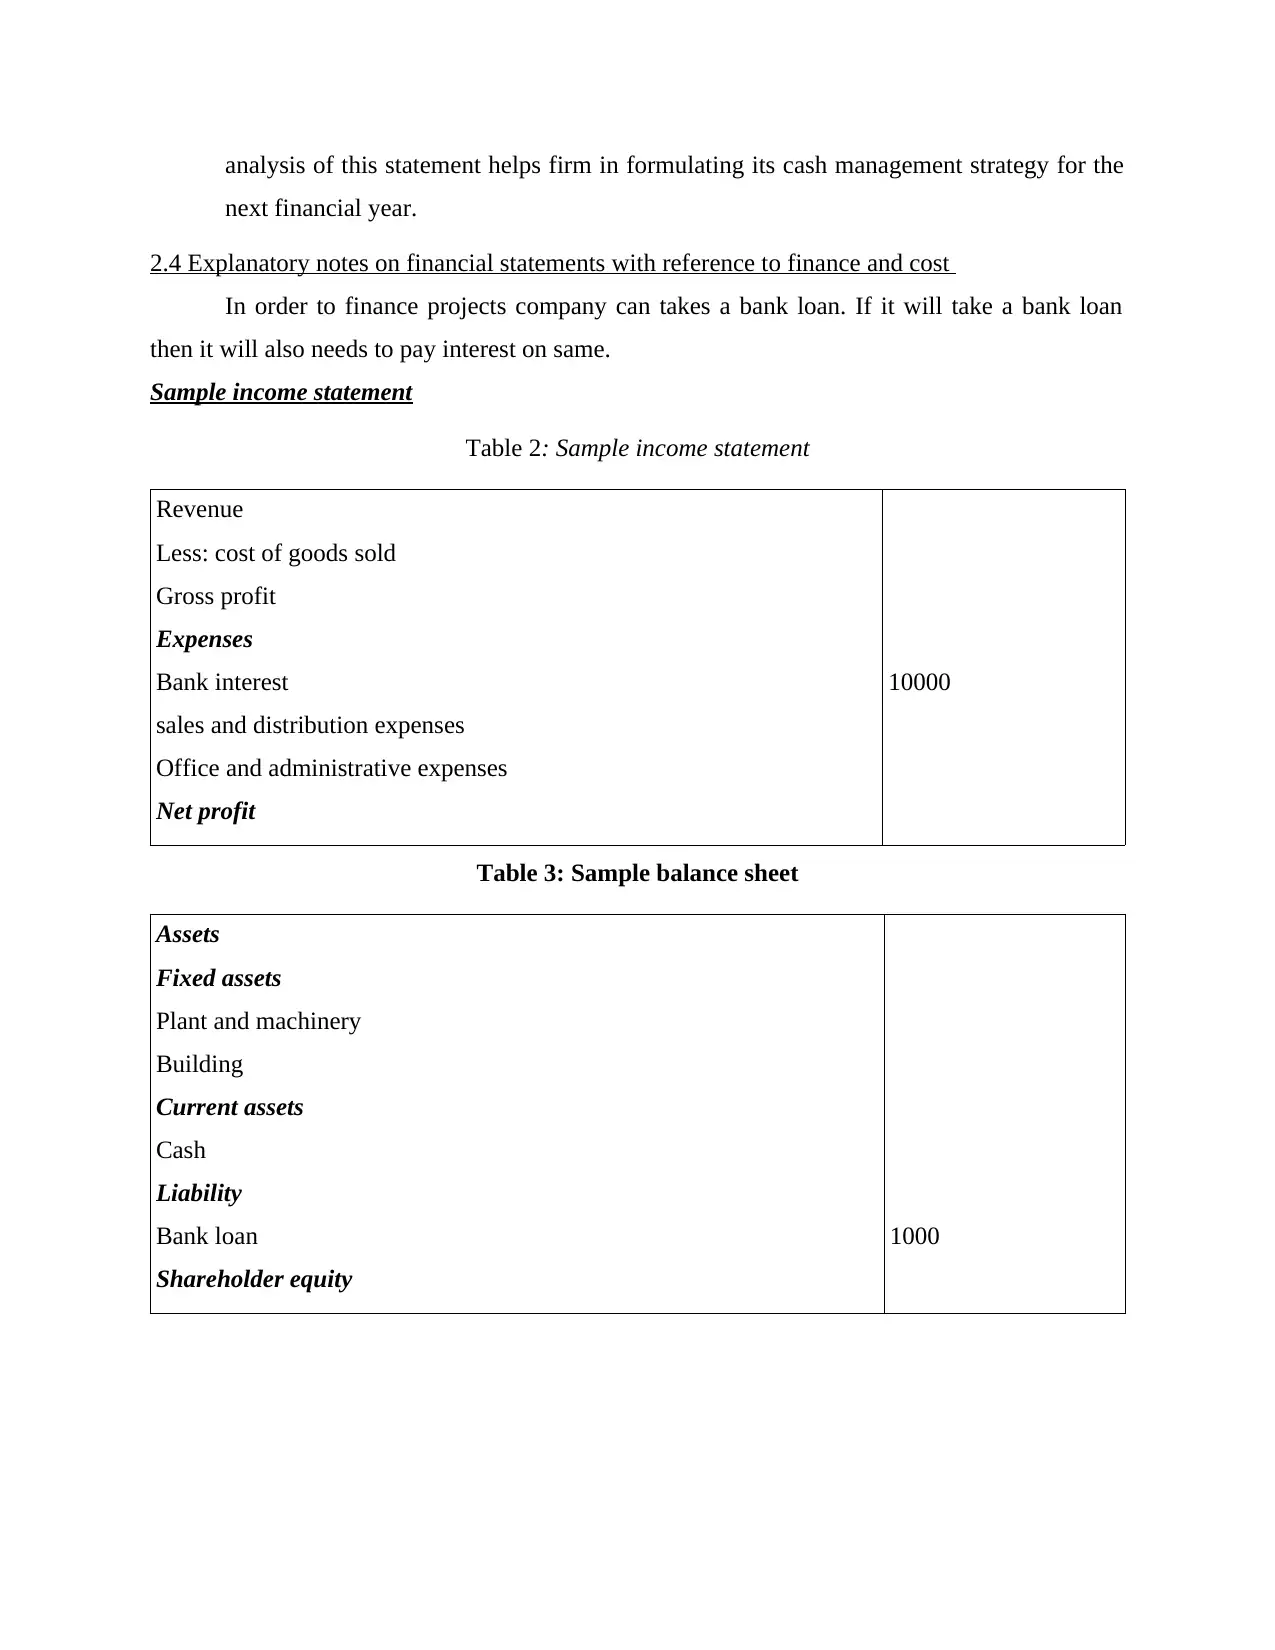
2.4 Explanatory notes on financial statements with reference to finance and cost
In order to finance projects company can takes a bank loan. If it will take a bank loan
then it will also needs to pay interest on same.
Sample income statement
Table 2: Sample income statement
Revenue
Less: cost of goods sold
Gross profit
Expenses
Bank interest
sales and distribution expenses
Office and administrative expenses
Net profit
10000
Table 3: Sample balance sheet
Assets
Fixed assets
Plant and machinery
Building
Current assets
Cash
Liability
Bank loan
Shareholder equity
1000
next financial year.
2.4 Explanatory notes on financial statements with reference to finance and cost
In order to finance projects company can takes a bank loan. If it will take a bank loan
then it will also needs to pay interest on same.
Sample income statement
Table 2: Sample income statement
Revenue
Less: cost of goods sold
Gross profit
Expenses
Bank interest
sales and distribution expenses
Office and administrative expenses
Net profit
10000
Table 3: Sample balance sheet
Assets
Fixed assets
Plant and machinery
Building
Current assets
Cash
Liability
Bank loan
Shareholder equity
1000
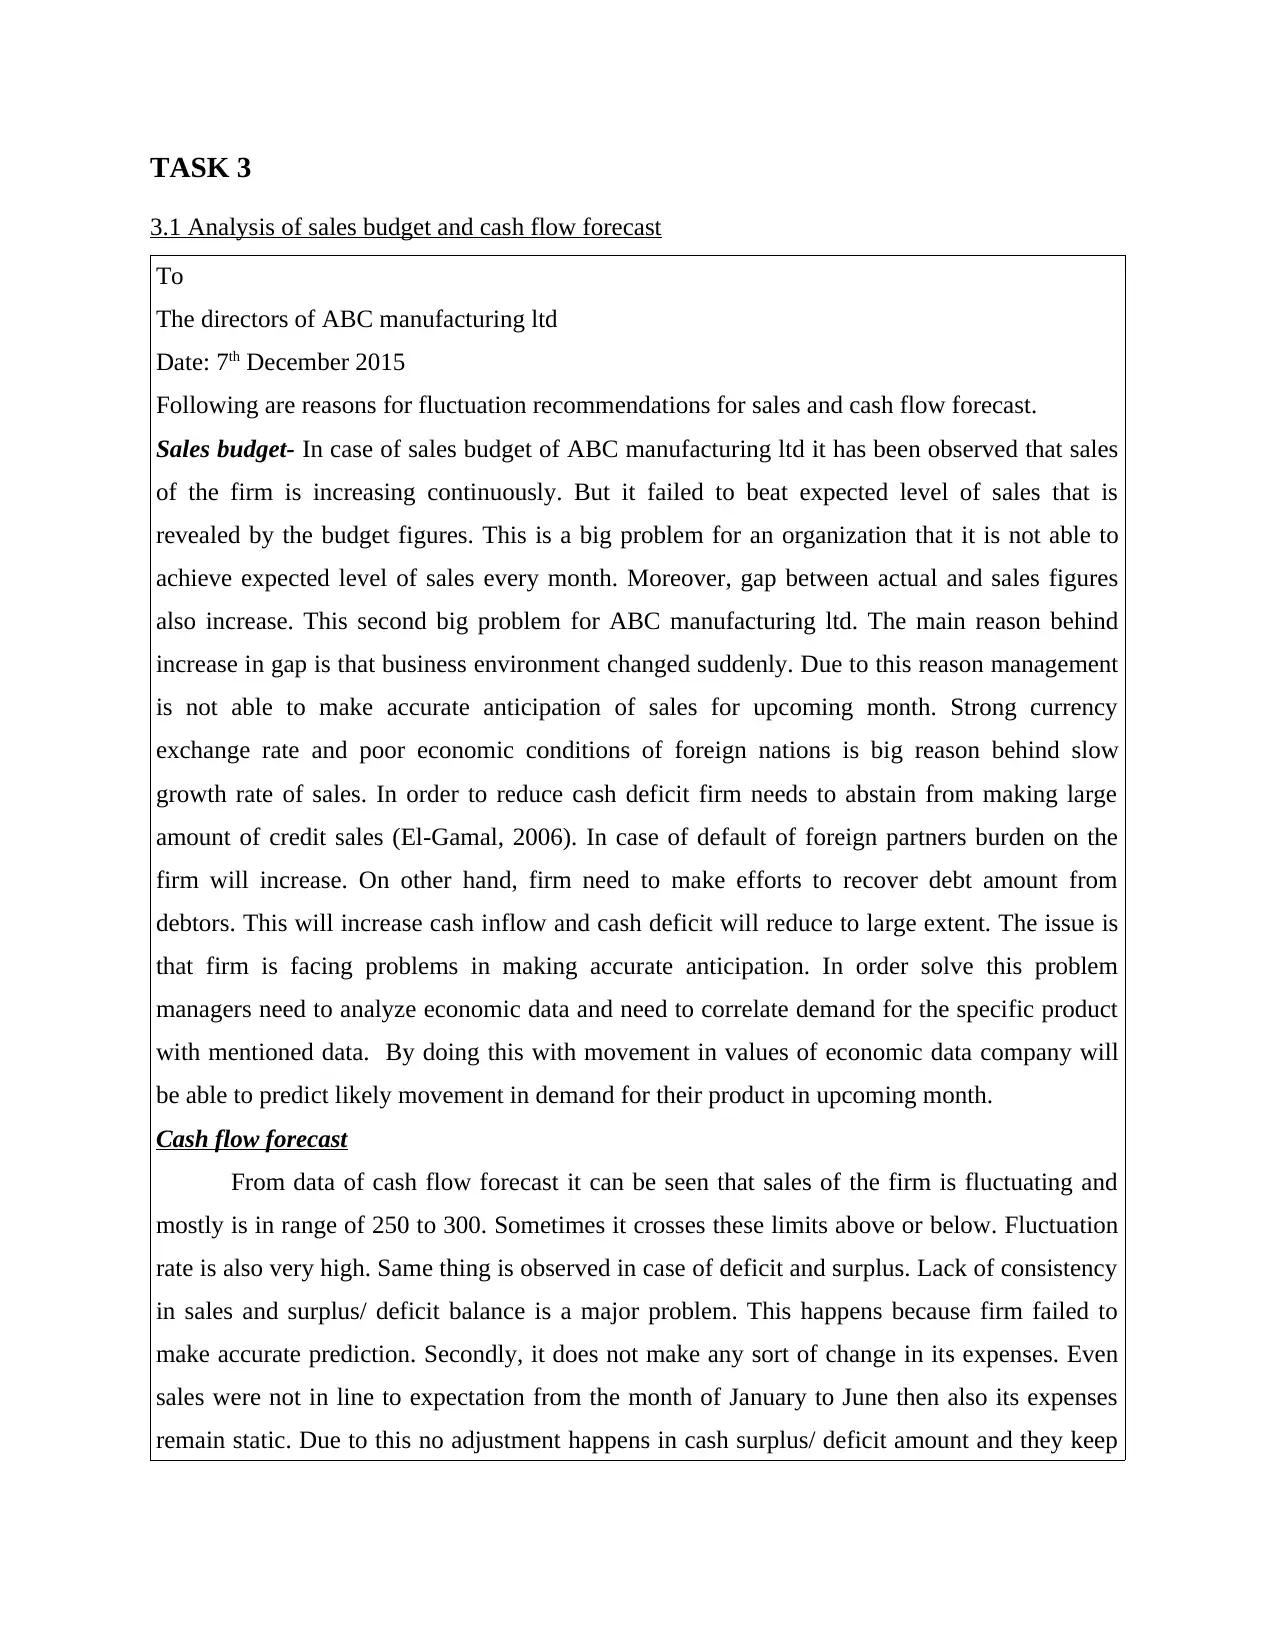
TASK 3
3.1 Analysis of sales budget and cash flow forecast
To
The directors of ABC manufacturing ltd
Date: 7th December 2015
Following are reasons for fluctuation recommendations for sales and cash flow forecast.
Sales budget- In case of sales budget of ABC manufacturing ltd it has been observed that sales
of the firm is increasing continuously. But it failed to beat expected level of sales that is
revealed by the budget figures. This is a big problem for an organization that it is not able to
achieve expected level of sales every month. Moreover, gap between actual and sales figures
also increase. This second big problem for ABC manufacturing ltd. The main reason behind
increase in gap is that business environment changed suddenly. Due to this reason management
is not able to make accurate anticipation of sales for upcoming month. Strong currency
exchange rate and poor economic conditions of foreign nations is big reason behind slow
growth rate of sales. In order to reduce cash deficit firm needs to abstain from making large
amount of credit sales (El-Gamal, 2006). In case of default of foreign partners burden on the
firm will increase. On other hand, firm need to make efforts to recover debt amount from
debtors. This will increase cash inflow and cash deficit will reduce to large extent. The issue is
that firm is facing problems in making accurate anticipation. In order solve this problem
managers need to analyze economic data and need to correlate demand for the specific product
with mentioned data. By doing this with movement in values of economic data company will
be able to predict likely movement in demand for their product in upcoming month.
Cash flow forecast
From data of cash flow forecast it can be seen that sales of the firm is fluctuating and
mostly is in range of 250 to 300. Sometimes it crosses these limits above or below. Fluctuation
rate is also very high. Same thing is observed in case of deficit and surplus. Lack of consistency
in sales and surplus/ deficit balance is a major problem. This happens because firm failed to
make accurate prediction. Secondly, it does not make any sort of change in its expenses. Even
sales were not in line to expectation from the month of January to June then also its expenses
remain static. Due to this no adjustment happens in cash surplus/ deficit amount and they keep
⊘ This is a preview!⊘
Do you want full access?
Subscribe today to unlock all pages.
Trusted by 1+ million students worldwide
on fluctuating sharply (Marlow, Patton, 2005). Thus, it is recommended that firm must curtail
its advertisement and other expenses. By doing this fluctuation in cash flows can be reduced to
large extent.
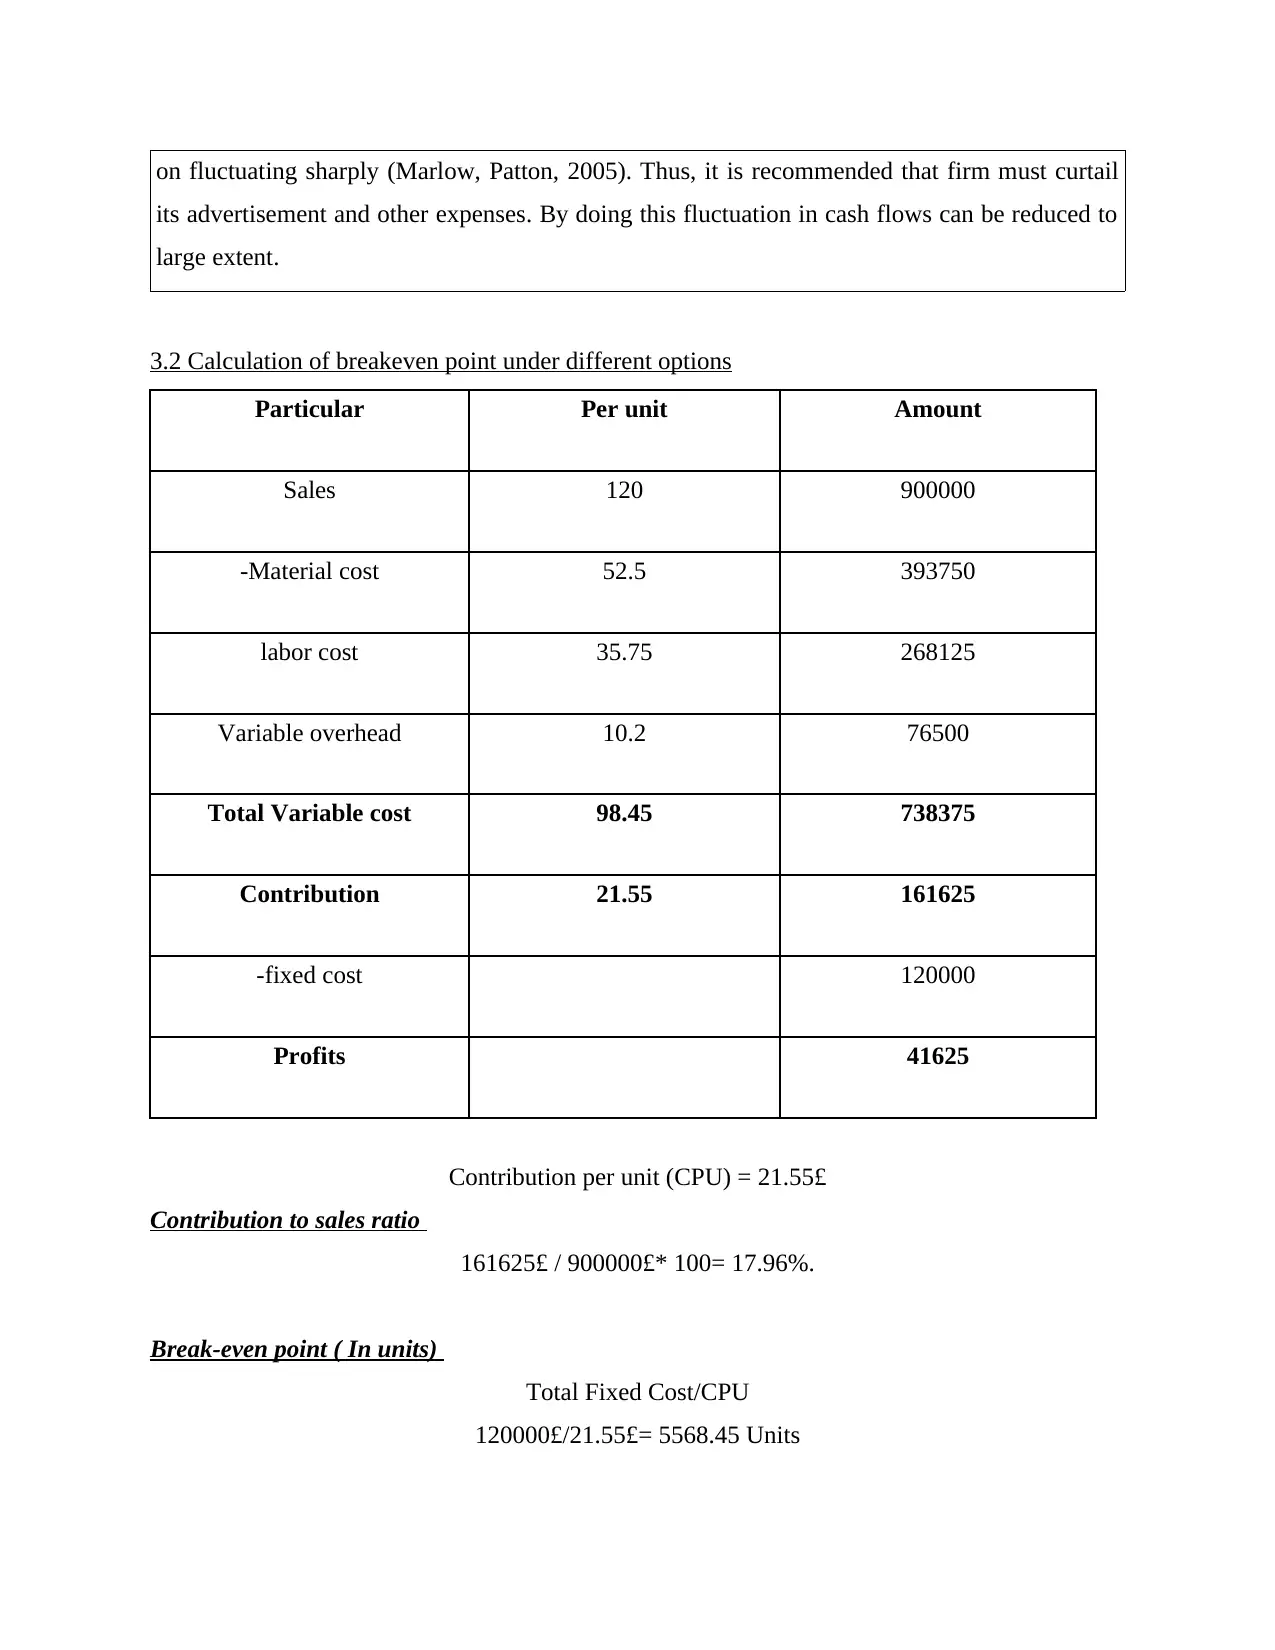
3.2 Calculation of breakeven point under different options
Particular Per unit Amount
Sales 120 900000
-Material cost 52.5 393750
labor cost 35.75 268125
Variable overhead 10.2 76500
Total Variable cost 98.45 738375
Contribution 21.55 161625
-fixed cost 120000
Profits 41625
Contribution per unit (CPU) = 21.55£
Contribution to sales ratio
161625£ / 900000£* 100= 17.96%.
Break-even point ( In units)
Total Fixed Cost/CPU
120000£/21.55£= 5568.45 Units
its advertisement and other expenses. By doing this fluctuation in cash flows can be reduced to
large extent.
3.2 Calculation of breakeven point under different options
Particular Per unit Amount
Sales 120 900000
-Material cost 52.5 393750
labor cost 35.75 268125
Variable overhead 10.2 76500
Total Variable cost 98.45 738375
Contribution 21.55 161625
-fixed cost 120000
Profits 41625
Contribution per unit (CPU) = 21.55£
Contribution to sales ratio
161625£ / 900000£* 100= 17.96%.
Break-even point ( In units)
Total Fixed Cost/CPU
120000£/21.55£= 5568.45 Units
Paraphrase This Document
Need a fresh take? Get an instant paraphrase of this document with our AI Paraphraser
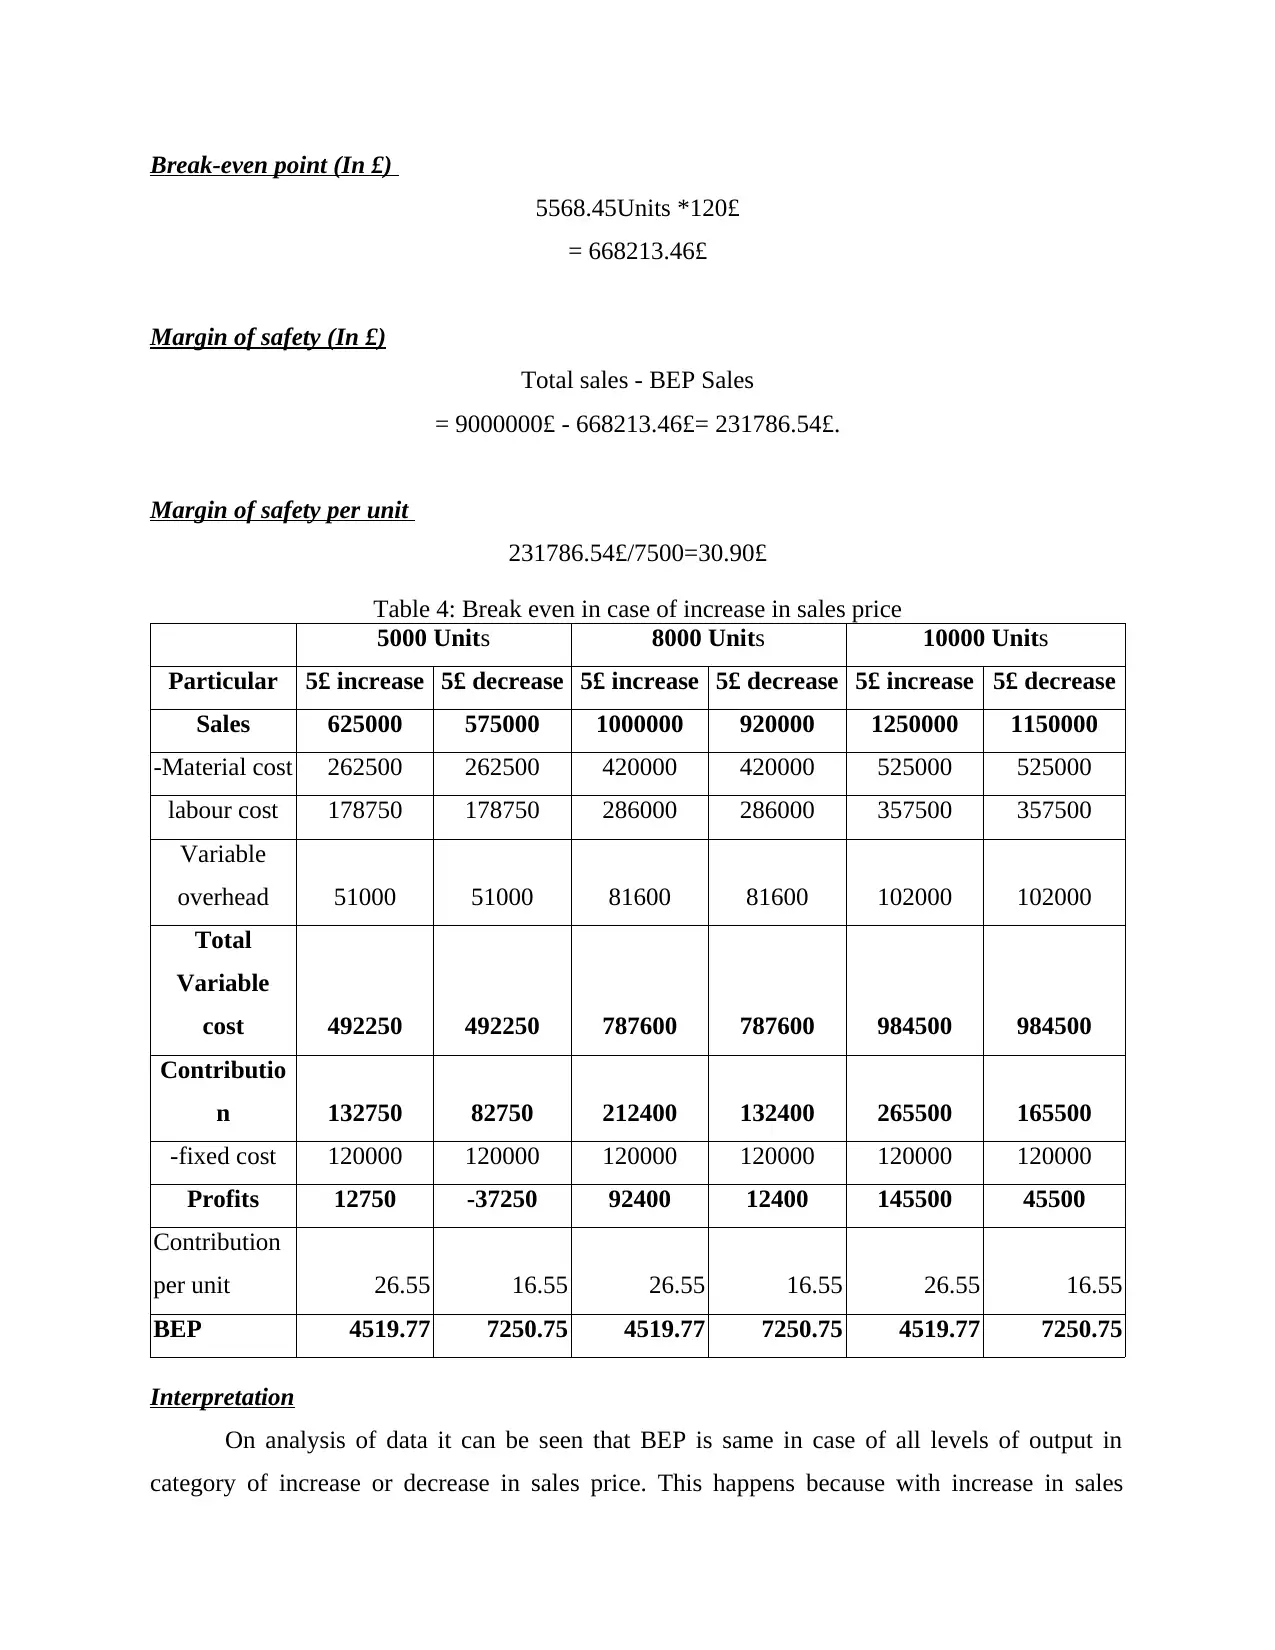
Break-even point (In £)
5568.45Units *120£
= 668213.46£
Margin of safety (In £)
Total sales - BEP Sales
= 9000000£ - 668213.46£= 231786.54£.
Margin of safety per unit
231786.54£/7500=30.90£
Table 4: Break even in case of increase in sales price
5000 Units 8000 Units 10000 Units
Particular 5£ increase 5£ decrease 5£ increase 5£ decrease 5£ increase 5£ decrease
Sales 625000 575000 1000000 920000 1250000 1150000
-Material cost 262500 262500 420000 420000 525000 525000
labour cost 178750 178750 286000 286000 357500 357500
Variable
overhead 51000 51000 81600 81600 102000 102000
Total
Variable
cost 492250 492250 787600 787600 984500 984500
Contributio
n 132750 82750 212400 132400 265500 165500
-fixed cost 120000 120000 120000 120000 120000 120000
Profits 12750 -37250 92400 12400 145500 45500
Contribution
per unit 26.55 16.55 26.55 16.55 26.55 16.55
BEP 4519.77 7250.75 4519.77 7250.75 4519.77 7250.75
Interpretation
On analysis of data it can be seen that BEP is same in case of all levels of output in
category of increase or decrease in sales price. This happens because with increase in sales
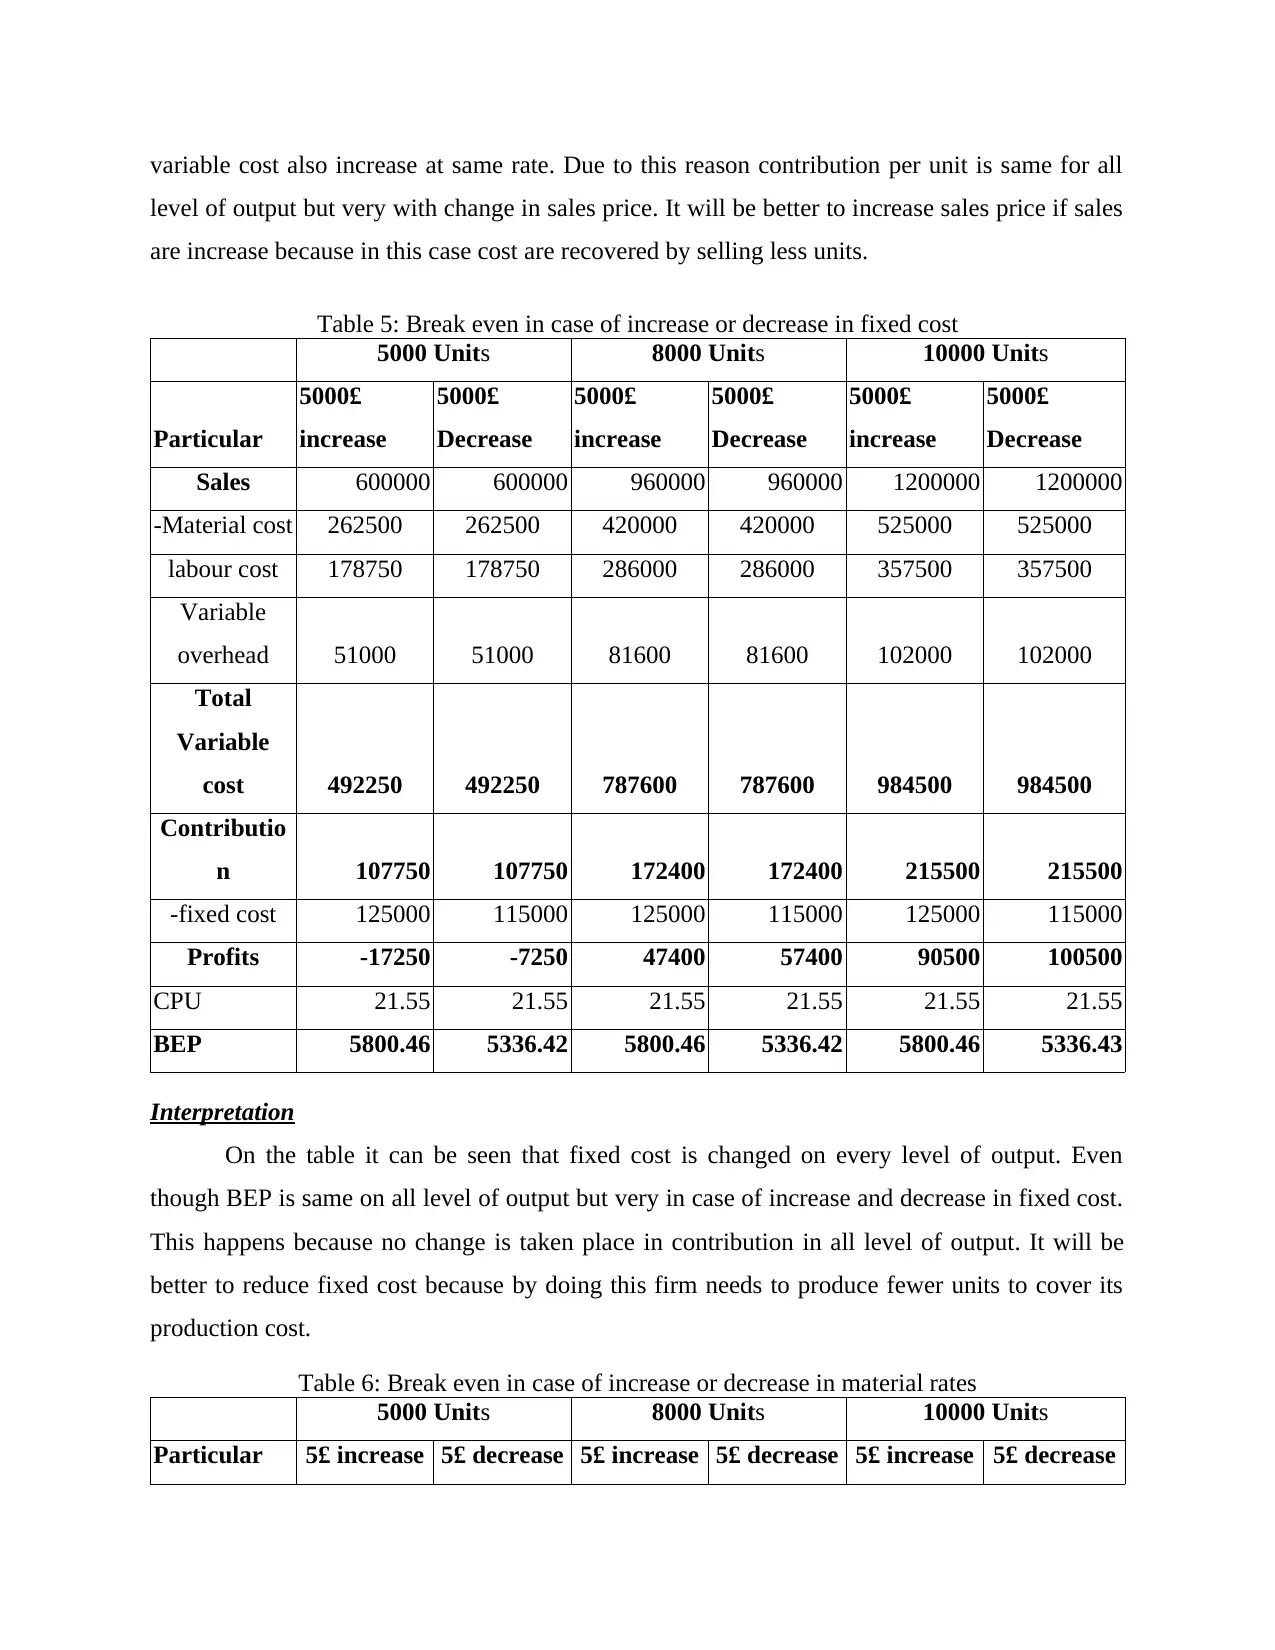
variable cost also increase at same rate. Due to this reason contribution per unit is same for all
level of output but very with change in sales price. It will be better to increase sales price if sales
are increase because in this case cost are recovered by selling less units.
Table 5: Break even in case of increase or decrease in fixed cost
5000 Units 8000 Units 10000 Units
Particular
5000£
increase
5000£
Decrease
5000£
increase
5000£
Decrease
5000£
increase
5000£
Decrease
Sales 600000 600000 960000 960000 1200000 1200000
-Material cost 262500 262500 420000 420000 525000 525000
labour cost 178750 178750 286000 286000 357500 357500
Variable
overhead 51000 51000 81600 81600 102000 102000
Total
Variable
cost 492250 492250 787600 787600 984500 984500
Contributio
n 107750 107750 172400 172400 215500 215500
-fixed cost 125000 115000 125000 115000 125000 115000
Profits -17250 -7250 47400 57400 90500 100500
CPU 21.55 21.55 21.55 21.55 21.55 21.55
BEP 5800.46 5336.42 5800.46 5336.42 5800.46 5336.43
Interpretation
On the table it can be seen that fixed cost is changed on every level of output. Even
though BEP is same on all level of output but very in case of increase and decrease in fixed cost.
This happens because no change is taken place in contribution in all level of output. It will be
better to reduce fixed cost because by doing this firm needs to produce fewer units to cover its
production cost.
Table 6: Break even in case of increase or decrease in material rates
5000 Units 8000 Units 10000 Units
Particular 5£ increase 5£ decrease 5£ increase 5£ decrease 5£ increase 5£ decrease
⊘ This is a preview!⊘
Do you want full access?
Subscribe today to unlock all pages.
Trusted by 1+ million students worldwide
1 out of 31
Related Documents


Your All-in-One AI-Powered Toolkit for Academic Success.
+13062052269
info@desklib.com
Available 24*7 on WhatsApp / Email
![[object Object]](/_next/static/media/star-bottom.7253800d.svg)
Unlock your academic potential
Copyright © 2020–2026 A2Z Services. All Rights Reserved. Developed and managed by ZUCOL.