Comprehensive Analysis of Index Options: Finance Project, C39SN

Verified

Added on  2023/04/25

|12
|2260
|196
Project
AI Summary
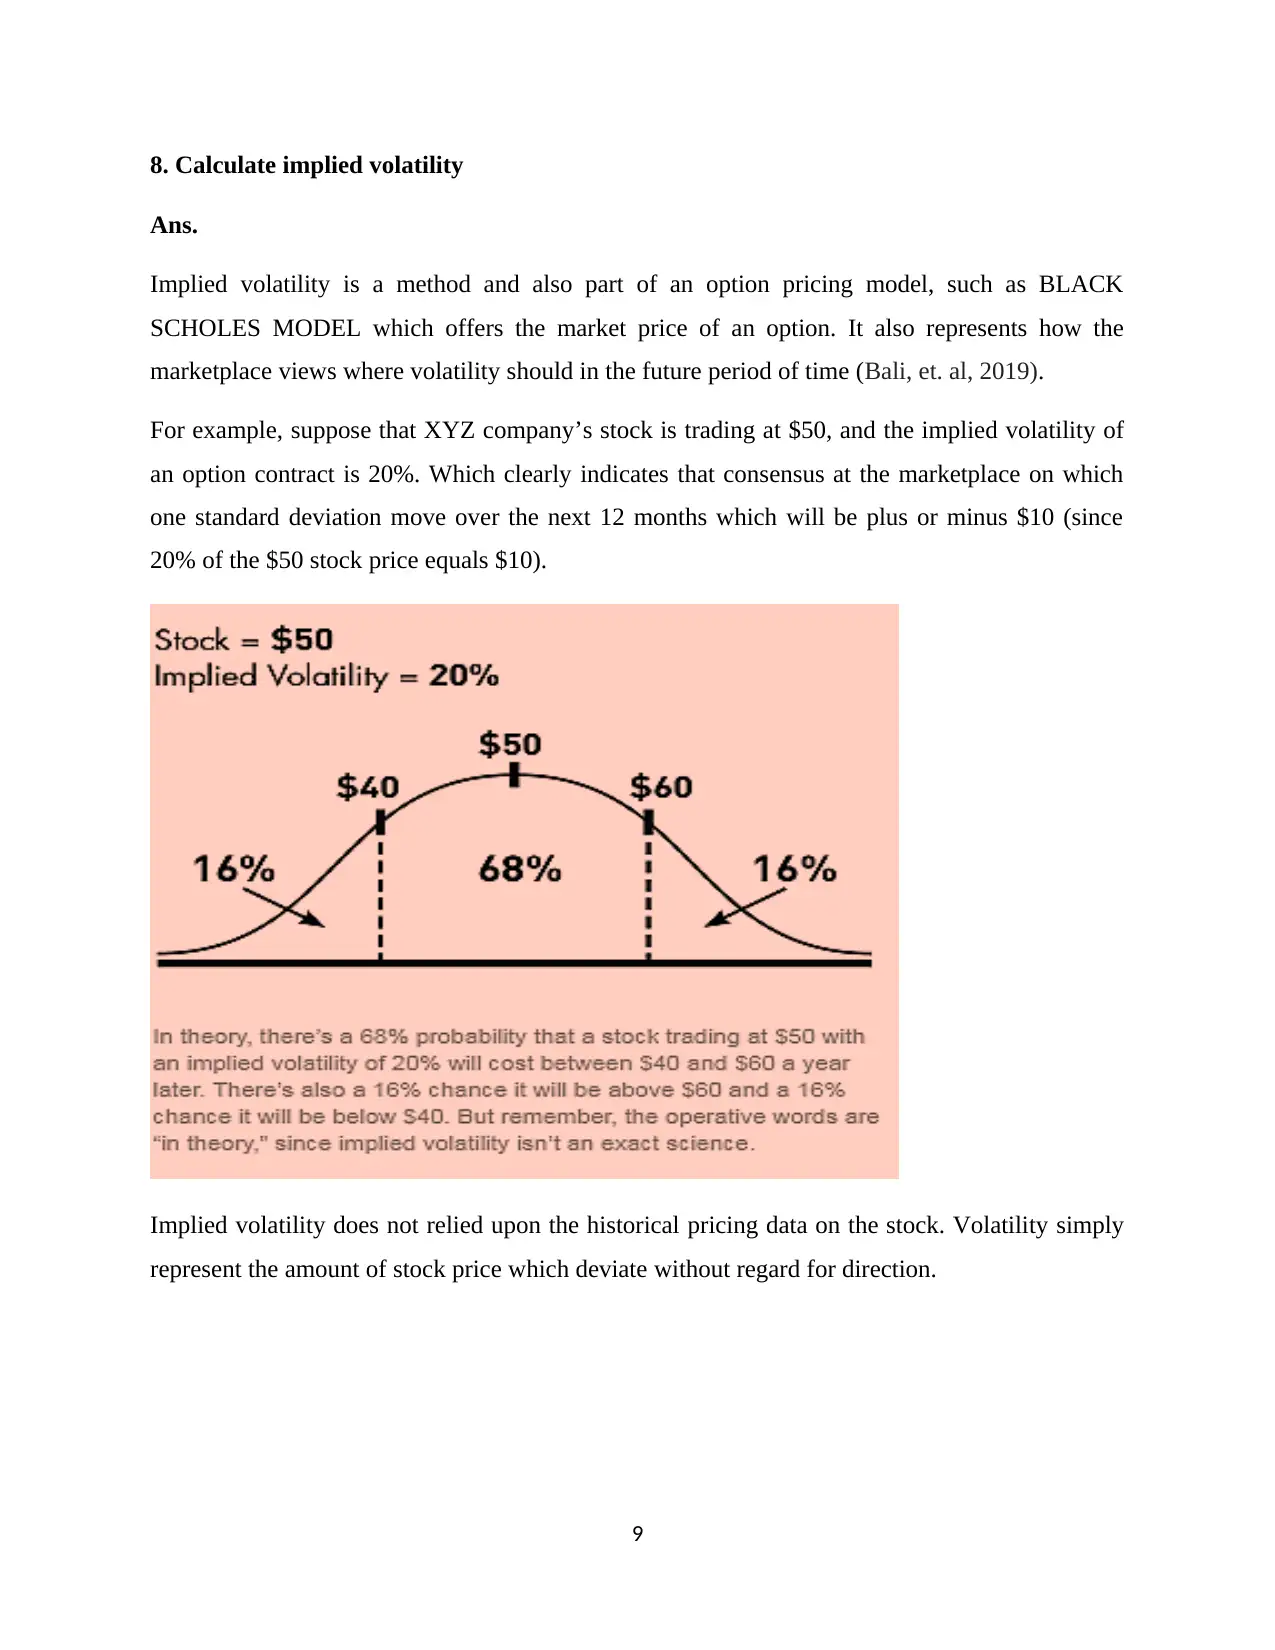
This finance project delves into the analysis of index options, covering various aspects of option pricing and market dynamics. The project begins with a discussion on the put-call parity and its applicability to European and American options. It then explores the differences between American and European options, examining their pricing and exercise features. The project further investigates the Black-Scholes model, including its assumptions and its comparison to actual market prices. A three-step binomial model is constructed, followed by a comparison of binomial and actual prices. The project also includes the calculation of Black-Scholes prices and a comparison of B&S with binomial prices, highlighting differences between American and European options, and at-the-money (ATM) versus out-of-the-money (OTM) options. The concept of implied volatility is introduced, and its calculation is demonstrated. The project concludes with a discussion of the plot of implied volatility against moneyness and a comparison of implied volatility with the VXO, interpreting the differences between these volatility measures. References are provided to support the analysis.
Document Page
Finance
1
tabler-icon-diamond-filled.svg

Paraphrase This Document

Need a fresh take? Get an instant paraphrase of this document with our AI Paraphraser
Document Page
1. Discussions of whether the put call parity holds for actual market prices of European
and American options?
Ans.
The put/ call parity establishes a relationship between call options and put options price.
Call – Put = Stock – Strike
Let’s assume that the under mentioned fact for a call and a put option on XYZ stock. Is given:
Exercise price: $100
Call option price: $7
Put option price: $5
Risk-free rate: 8%
Current market price of XYZ: $98
Time to maturity: 0.5 years
Let’s plug these values in the put-call parity equation:
7 + 100/ (1.08) ^0.5 = 5 + 99
103.225 = 104
As, this can be rightly said that, the right hand side is higher than the side which are in the left
hand side by (104 – 103.225) = 0.775
Put/ call parity only holds true for European style options as American style options can be
exercised at any time prior to its expiry (Robe, et. al., 2016).
2
Document Page
2. Interpret differences between American and European option prices.
Ans.
Assumption: Let S&P 100 Index is currently at 1230 in the spot market.
American (OEX) Strike Price
ATM CALL 1230
OTM CALL 1250
ITM CALL 1200
ATM PUT 1230
OTM PUT 1200
ITM PUT 1250
European (XEO) Strike Price
ATM CALL 1230
OTM CALL 1250
ITM CALL 1200
ATM PUT 1230
OTM PUT 1200
ITM PUT 1250
American and European options have same features but in the case of American option, this can
be exercised at any point of time which can also come before the option expires. While on the
other hand, European options, the owners may exercise their right only at expiration (Carr, et. al.,
2016).
American options close on the every third Friday of the expiry month whereas European options
close on the Thursday preceding to the third Friday of the expiry month.
Settlement price in the American options for the underlying assets is closing price which is
regular whereas in the case of European- style options it is not easily to identify the settlement
price (Livieri, et. al., 2018)
3
Document Page
3. Interpret differences between Black and Scholes and actual prices.
Ans.
Black and Scholes Model
This option model is basically based on the fundamental that in the future the price of the
underlying assets will either increase or decrease as compared to the spot price of the underlying
assets (Bayram, et. al.,2018).
This model has following assumptions which are listed below:
The underlying assets price change continuously.
The share price has a log normal distribution.
Transaction costs and taxes do not exist.
No restriction on short selling
Funds can be borrowed at risk-free rate of return to create risk neutral portfolio.
Actual prices
The actual prices of the underlying assets depend on the movement of share market. The share
price fluctuate in the market because change in government policies, company policies, etc. The
change in spot price does not affect the options contracts of derivative market.
4. Construct 3-step binomial.
Ans. Following steps are taken to calculate the price of the option
Step 1: Calculation of d1
d1 = In (So/E) + (r + .5 * σ2) * t
σ √t
In = Log Normal
So= Spot price of the underlying share
E = Exercise price of the underlying share for option contract
r = Risk – free rate of return
4
tabler-icon-diamond-filled.svg

Paraphrase This Document

Need a fresh take? Get an instant paraphrase of this document with our AI Paraphraser
Document Page
σ = Standard deviation of the return of the underlying share representing risk
t = Time period till expiration in year 6 month equal to 0.5 year.
Step 2: Calculation of d2
d2 = d1 - σ √t
Step 3: Application of the formula to calculate the price/value of call option:
Co= So * N (d1) – E * e-rt* N (d2)
Co= Premium of call option
So= Spot price of the underlying assets
r = Risk – free rate of return
t = Time period till expiration in year 6 month equal to 0.5 year.
e = 2.71828
E = Exercise price of the underlying share for option contract
Value or price of a put option
Po= Co- So+ E * e-rt
Po= Premium of put option
e = 2.71828
Co= Premium of call option
E = Exercise price of the underlying share for option contract
5
Document Page
5. Compare binomial and actual prices – interpret any differences.
Ans.
Binomial Model
Binomial Model is based on the fundamental that price of the underlying share can either
decrease or increase in the future period in comparison to the spot price at present (Richardson,
et. al., 2015).
The main assumption in this model is that the price of underlying share moves in random walk.
Binomial Model of calculating option price
a. One- step Binomial model
Option equivalent method
Risk neutral method
b. Two- step Binomial model
Risk neutral model
Actual prices
The actual prices are considered in the equity market where the transactions are done on
actual price which are based on share market. In the capital and money market, the actual
price is considered for the share.
6
Document Page
6. Calculate B&S prices.
For example: Spot price of shares of Abc company is $60 with an exercise price of 60 with time
to expiration 6 month, i.e., 0.5 year, risk- free rate of return 12%, i.e., 0.12 and standard
deviation of the return of the share is 30%, i.e., 0.30. Calculate price of the call option.
Ans.
d1 = In (So/E) + (r + .5 * σ2) * t
σ √t
= 0 + (0.12 + .5 * 0.09) * 0.5
0.3 √0.5
= 0.0825 = 0.389
0.2121
d1= 0.389
d2 = d1 - σ √t
= 0.389 - 0.3 √0.5
d2= 0.177
N (d1) = N (0.389) = 0.6517
N (d2) = N (0.177) = 0.5714
The value of call option is as follows:
Co= 60 * 0.6517 – (60* e-0.12*0.5) * 0.5714
= $6.81
By applying the same data set we can calculate the value of put option also:
Po = 6.81 – 60 + 60 * 0.9417
= $3.31
7
tabler-icon-diamond-filled.svg

Paraphrase This Document

Need a fresh take? Get an instant paraphrase of this document with our AI Paraphraser
Document Page
7. Compare B&S with binomial prices – discuss differences,
B&S vs. Binomial
American vs. European
ATM vs. OTM
Ans.
B&S vs. Binomial Model
Binomial model is basically based on price of underlying assets or shares that can be either
increase or decrease in the future in comparison to the spot price at present whereas Black
Scholes model is based on the fundamental that in the future the underlying asset price will either
decrease or increase as compared to the spot price of the underlying assets or shares
American vs. European
In an American option buyer of the option can exercise his right on any day till the expiry date.
This result into more risk for the seller of the option as it has wider spectrum for option being
exercised by the option buyer whereas the buyer of an option exercise his right only on the
expiration date, then such contract is known as European Option (Kopp, et. al., 2017).
ATM vs. OTM
In the case of call option
When spot price equals the exercise price or strike price it is at-the-money whereas when the
spot price is less than exercise or strike price it is out- the – money.
In the case of put option
When spot price equals the exercise price or strike price it is at-the-money whereas when spot
price is more than the strike or exercise price it is out- the-money.
8
Document Page
8. Calculate implied volatility
Ans.
Implied volatility is a method and also part of an option pricing model, such as BLACK
SCHOLES MODEL which offers the market price of an option. It also represents how the
marketplace views where volatility should in the future period of time (Bali, et. al, 2019).
For example, suppose that XYZ company’s stock is trading at $50, and the implied volatility of
an option contract is 20%. Which clearly indicates that consensus at the marketplace on which
one standard deviation move over the next 12 months which will be plus or minus $10 (since
20% of the $50 stock price equals $10).
Implied volatility does not relied upon the historical pricing data on the stock. Volatility simply
represent the amount of stock price which deviate without regard for direction.
9
Document Page
9. Discussion of the plot of implied volatility against moneyless or X.
Ans.
Volatility measures the degree to which the price of a financial instrument changes over time.
Statistically volatility is often measured as the standard deviation of the prices, σ. Based on the
ways volatilities are calculated; there are two types of volatility series: implied volatility series
historical volatility series. Implied volatility, as the name suggests, is the volatility “implied” by
the market prices of the derivatives on a financial instrument. Historical volatility series is
obtained from the historical prices of the financial instruments.In derivatives trading, particularly
options trading, implied volatility is an integral component (Fu, Xi, et. al., 2016).
In the options trading world, often implied volatility is quoted instead of price, which is similar
to the way yield, instead of actual price, is quoted in the fixed income trading.
10. Compare implied vol. with each other and with VXO – interpret differences.
Ans.
Basically, this is rightly said that the implied volatility is the forecasted of an asset that
underlying an option. This derives from the option’s price, and also consider as the inputs of
diverse option pricing models like black-Scholes method. However, this can’t observed directly.
This reflects the market beliefs as to the forecasted volatility of an underlying contract. By using
the VXO, Black-scholes put and call option prices is calculated. In simple terms, this can be
rightly said that implied volatility is different from the VXO as this have the expiration date of
30 or more than that. While on the other hand, implied volatility reflects 30 days or lesser
options for the expiration of contract. This reflects the major difference between both.
10
tabler-icon-diamond-filled.svg

Paraphrase This Document

Need a fresh take? Get an instant paraphrase of this document with our AI Paraphraser
Document Page
References
Bali, Turan G., Jianfeng Hu, and Scott Murray. "Option implied volatility, skewness, and
kurtosis and the cross-section of expected stock returns." Georgetown McDonough School of
Business Research Paper (2019).
Bayram, Mustafa, GulsenOrucovaBuyukoz, and TugcemPartal."Parameter Estimation in a
Black-Scholes Model." Thermal Science 22, no. 1 (2018): S117-S122.
Carr, Peter, and Liuren Wu."Analyzing volatility risk and risk premium in option contracts: A
new theory." Journal of Financial Economics 120, no. 1 (2016): 1-20.
Fu, Xi, Y. EserArisoy, Mark Broughton Shackleton, and Mehmet Umutlu. "Option implied
volatility measures and stock return predictability." Journal of Derivatives 24, no. 1 (2016): 58-
78.
Kopp, Sandra L., Jens Børglum, AsokumarBuvanendran, Terese T. Horlocker, Brian M. Ilfeld,
Stavros G. Memtsoudis, Joseph M. Neal, NarinderRawal, and Jessica T. Wegener. "Anesthesia
and analgesia practice pathway options for total knee arthroplasty: an evidence-based review by
the American and European Societies of Regional Anesthesia and Pain Medicine." Regional
anesthesia and pain medicine 42, no. 6 (2017): 683-697.
Livieri, Giulia, SaadMouti, Andrea Pallavicini, and Mathieu Rosenbaum. "Rough volatility:
evidence from option prices." IISE Transactions 50, no. 9 (2018): 767-776.
Richardson, David B., Alan C. Kinlaw, Richard F. MacLehose, and Stephen R.
Cole."Standardized binomial models for risk or prevalence ratios and differences." International
journal of epidemiology 44, no. 5 (2015): 1660-1672.
Robe, Michel A., and Jonathan Wallen. "Fundamentals, derivatives market information and oil
price volatility." Journal of Futures Markets 36, no. 4 (2016): 317-344.
11
Document Page
Appendix
12
chevron_up_icon
1 out of 12
circle_padding
hide_on_mobile
zoom_out_icon
[object Object]