University Report: Financial Economic Literacy for Managers
VerifiedAdded on 2020/01/06
|16
|3765
|179
Report
AI Summary
This report provides a comprehensive analysis of financial and economic literacy for managers, focusing on Marks and Spencer as a case study. It begins by exploring production classifications, opportunity costs, and the UK Standard Industrial Classification. The report then delves into market types, public goods, government intervention, and macroeconomic policy objectives. Further, the report examines the four major areas of finance, determinants of market interest rates, and the four basic financial statements. Ratio analysis of M&S is performed, and capital budgeting decisions are discussed, including the use of the NPV technique and yield curve analysis. The report covers the circular flow of income, income and substitution effects, and various financial concepts essential for managerial decision-making. References are also included.

FINANCIAL
ECONOMIC
LITERACY FOR MANAGERS
ECONOMIC
LITERACY FOR MANAGERS
Paraphrase This Document
Need a fresh take? Get an instant paraphrase of this document with our AI Paraphraser
TABLE OF CONTENTS
Introduction .....................................................................................................................................3
TASK ..............................................................................................................................................3
Question 1........................................................................................................................................3
a) The classification of production along with examples ...........................................................3
b) Explaining opportunity cost with example..............................................................................4
c) Explaining the purpose of the UK standard industrial classification.......................................4
d)Explaining the concept of shift in demand curve and movement along the curve ..................4
e) Explaining the income and substitution impact on increase in price ......................................5
Question 2........................................................................................................................................6
a) The types of market along with examples ..............................................................................6
b) The public good and its example. ...........................................................................................6
c) Explaining the ways in which government intervene in the market........................................6
d)Explaining the four key macro economic policy objectives.....................................................6
e) Explaining the circular flow of income involving the inner flow, withdrawal, injection etc. 7
Question 3........................................................................................................................................8
a) Defining the four major areas of finance with examples ........................................................8
b) The determinants of market interest rate with different types of risk premium. ....................8
c) Explaining the four basic financial statements .......................................................................8
d) Calculating ratios of M&S.....................................................................................................12
Question 4......................................................................................................................................13
a) Describing the importance of capital budgeting decisions ...................................................13
b) Describing the use of NPV technique for investment decisions ..........................................13
c) Explaining the yield curve involving the reason for difference.............................................14
d) Calculating expected return on two projects .......................................................................14
Conclusion ....................................................................................................................................14
REFERENCES .............................................................................................................................16
2
INTRODUCTION
The managers hold position within the organisation as are responsible for entire control
and management of firm or group of employees. They are in charge of specific group of task.
The profitability, long term success and sustainability of company depends upon the
effectiveness of decision taken by managers (MacNeilage, 2012). In this report, various aspects
of financial, economic literacy for managers will be studied in the context of Marks and Spencer.
It is multinational company of UK that is renowned for its fashion apparels, home and luxury
food products. In this report, ratio analysis of M&S in UK economy will be provided. The yield
curve will be explained along with reason for its difference. Further, description about the NPV
technique and its use in making investment decision will be discussed.
TASK
QUESTION 1
a) The classification of production along with examples
The production function refers to modification of different inputs into needed output. It is
method that determines the way in which manufacturing function is executed in M&S. Further,
production system is classified into various types which are explained as follows:
Continuous production: In this method, the products are manufactured for the stock and
not for particular orders. The main feature of this system is that it have standardize
production process as it use specific processes, plant and equipment ( Weale and Blake.,
2015). For instance, food industry use this production system.
Mass production: This system aims at manufacturing of discrete components using a
constant method called mass production. Here, manufacturing system is reasoned due to
bulk production. Example, Ford motors have mass production.
Job shop production: It is featured by producing few or one quantity of products
designed and manufactured as per the customized requirement of customers within
predetermined time and cost. The repair shop, commercial printers etc have this kind of
production method (Rapetti, 2013).
3
⊘ This is a preview!⊘
Do you want full access?
Subscribe today to unlock all pages.
Trusted by 1+ million students worldwide
b) Explaining opportunity cost with example.
The opportunity cost can be defined as cost of an option that must be forgone so as to
pursue a specific action. It further help in understanding the relationship between scarcity and
choice. The aim of this is to assure optimum utilization of limited resources (Baker, Singleton,
and Veit, 2011). For example, employee of M&S want to leave its job and attend higher
education for career growth. Here, opportunity cost of such decision is loss of remuneration for a
year.
c) Explaining the purpose of the UK standard industrial classification
The standard industrial classification (SIC)is a four digit code system that ascertain the
mode of economic function. It was initiated in 1948 in UK with the objective of categorizing
business enterprises and other statistical units by the kind of economic functions in which they
are involved. The SIC codes are allotted as per the common features in business offerings,
manufacturing and delivery system of a business (Borras and et.al., 2011).
d)Explaining the concept of shift in demand curve and movement along the curve
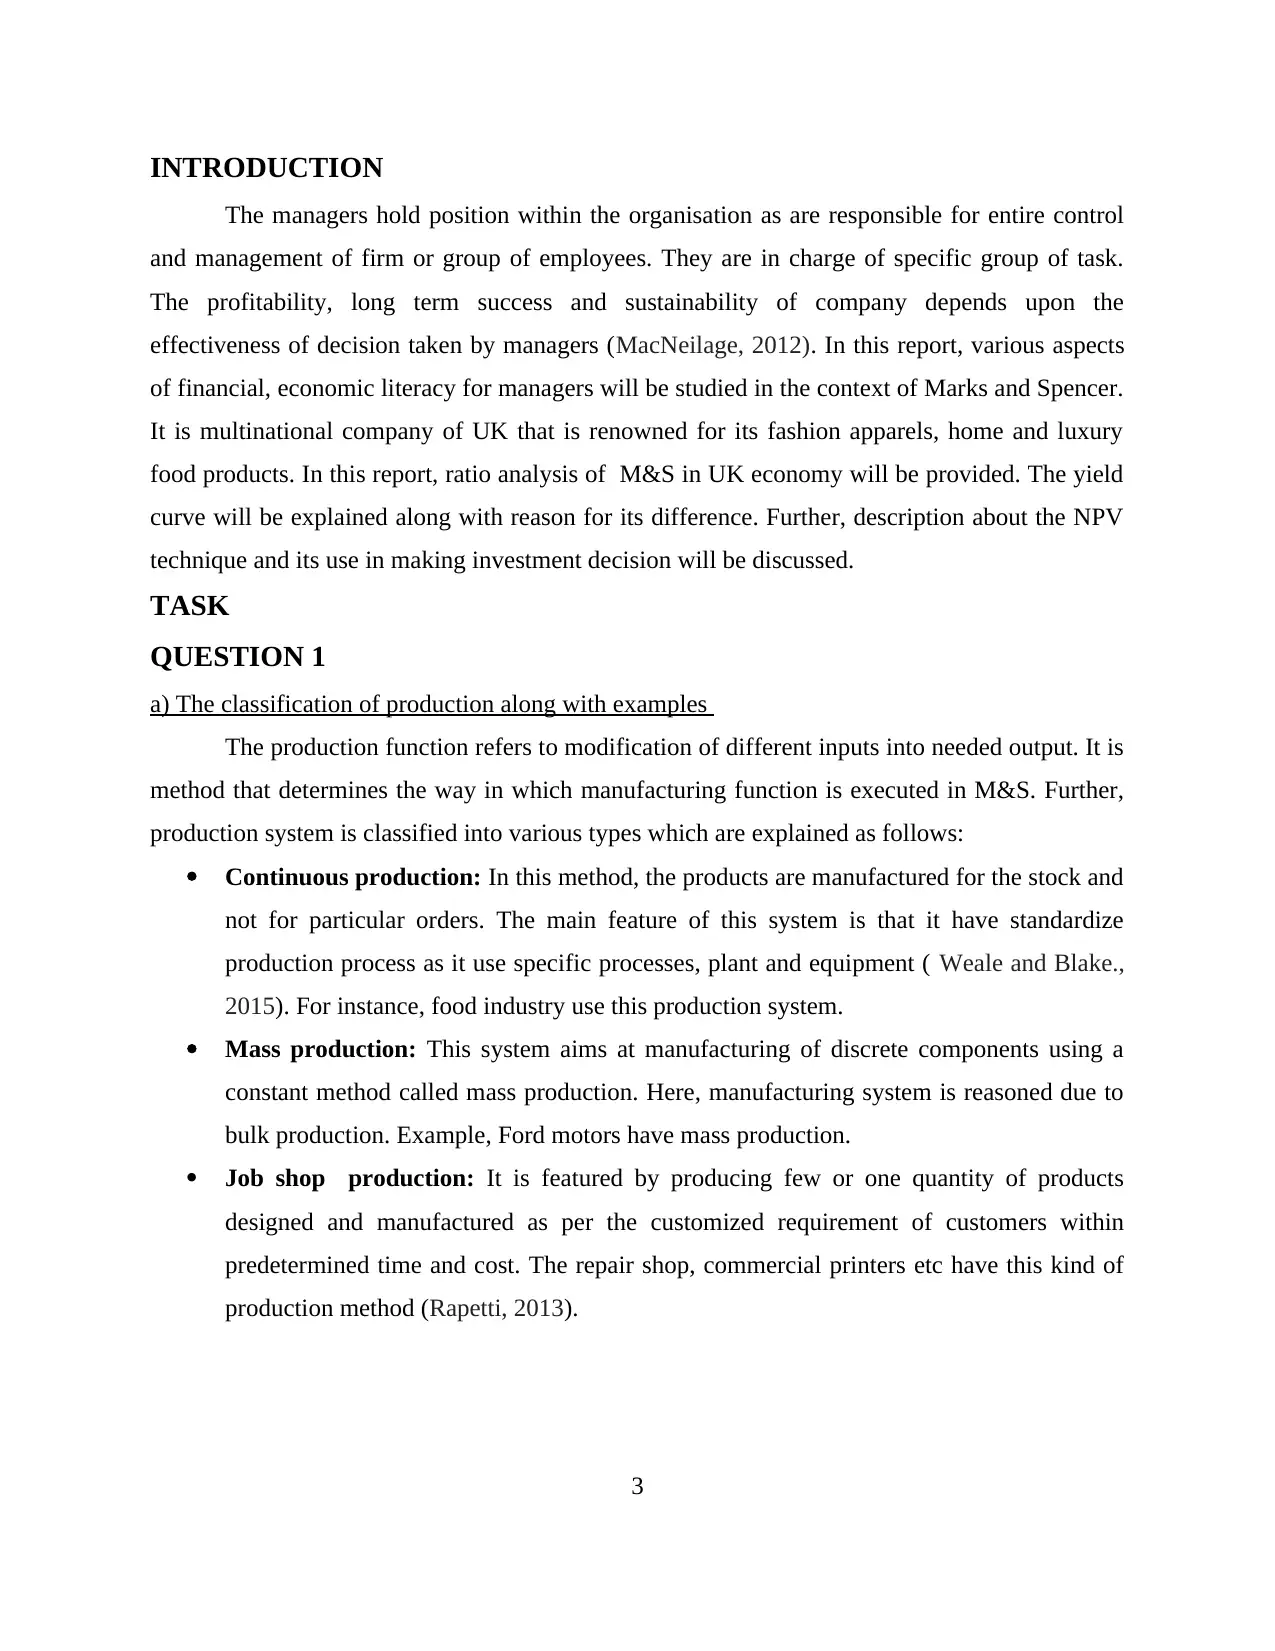
The shift in demand curve represent the state when demand changes in market. It means
modification in the components other than the price of offerings . Example, increase in income
of customer may cause him/her to purchase more products offered by M&S. Such as in
following diagram price is consistent at 15 $but quantity demanded increased from 8 to 12 units.
4
Illustration 1: Shift in demand curve
The opportunity cost can be defined as cost of an option that must be forgone so as to
pursue a specific action. It further help in understanding the relationship between scarcity and
choice. The aim of this is to assure optimum utilization of limited resources (Baker, Singleton,
and Veit, 2011). For example, employee of M&S want to leave its job and attend higher
education for career growth. Here, opportunity cost of such decision is loss of remuneration for a
year.
c) Explaining the purpose of the UK standard industrial classification
The standard industrial classification (SIC)is a four digit code system that ascertain the
mode of economic function. It was initiated in 1948 in UK with the objective of categorizing
business enterprises and other statistical units by the kind of economic functions in which they
are involved. The SIC codes are allotted as per the common features in business offerings,
manufacturing and delivery system of a business (Borras and et.al., 2011).
d)Explaining the concept of shift in demand curve and movement along the curve
The shift in demand curve represent the state when demand changes in market. It means
modification in the components other than the price of offerings . Example, increase in income
of customer may cause him/her to purchase more products offered by M&S. Such as in
following diagram price is consistent at 15 $but quantity demanded increased from 8 to 12 units.
4
Illustration 1: Shift in demand curve
Paraphrase This Document
Need a fresh take? Get an instant paraphrase of this document with our AI Paraphraser
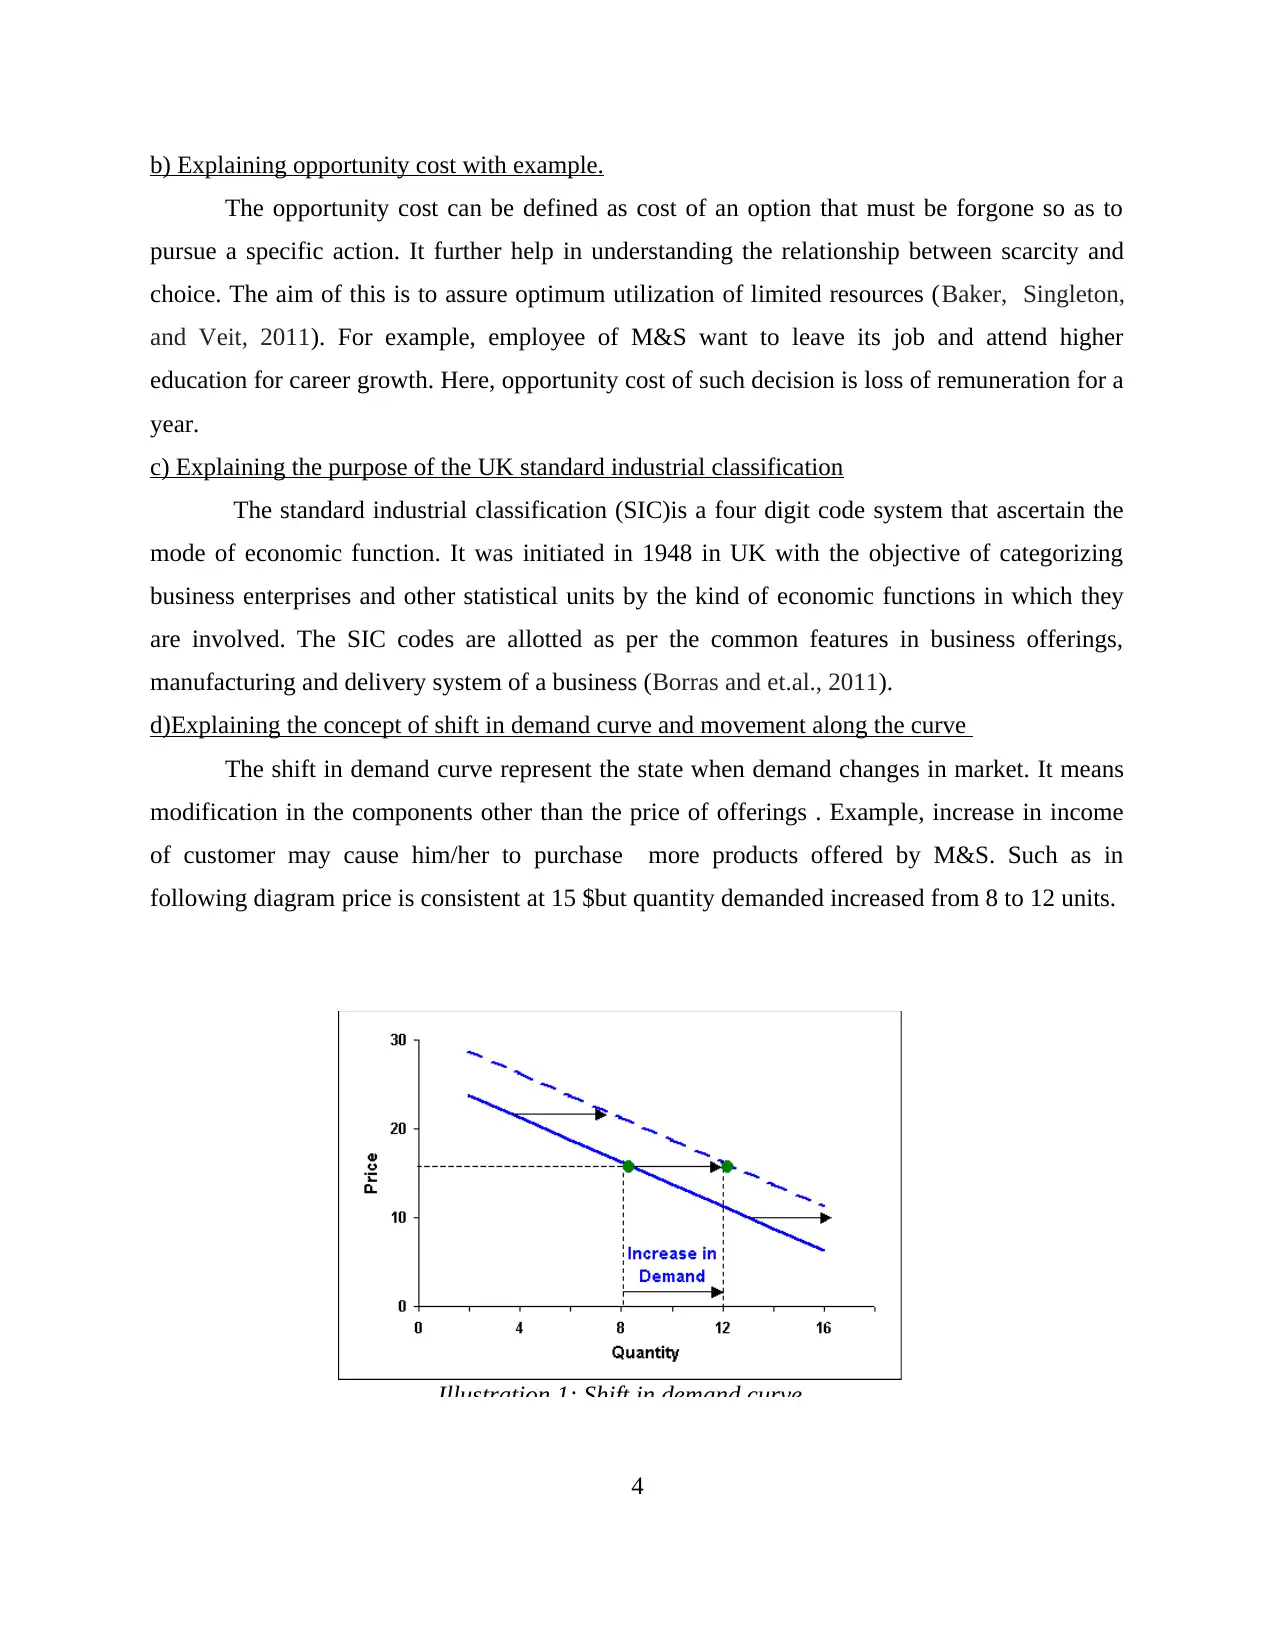
On the other hand, movement along the demand curve represent the state when the
quantity demanded changes with the change in price of commodity. Such as in following
diagram, at price 15 quantity demanded was 6 (Al Mutairi and et.al., 2012). While, with the
decrease in price at 10 the quantity demanded increased by 4 units.
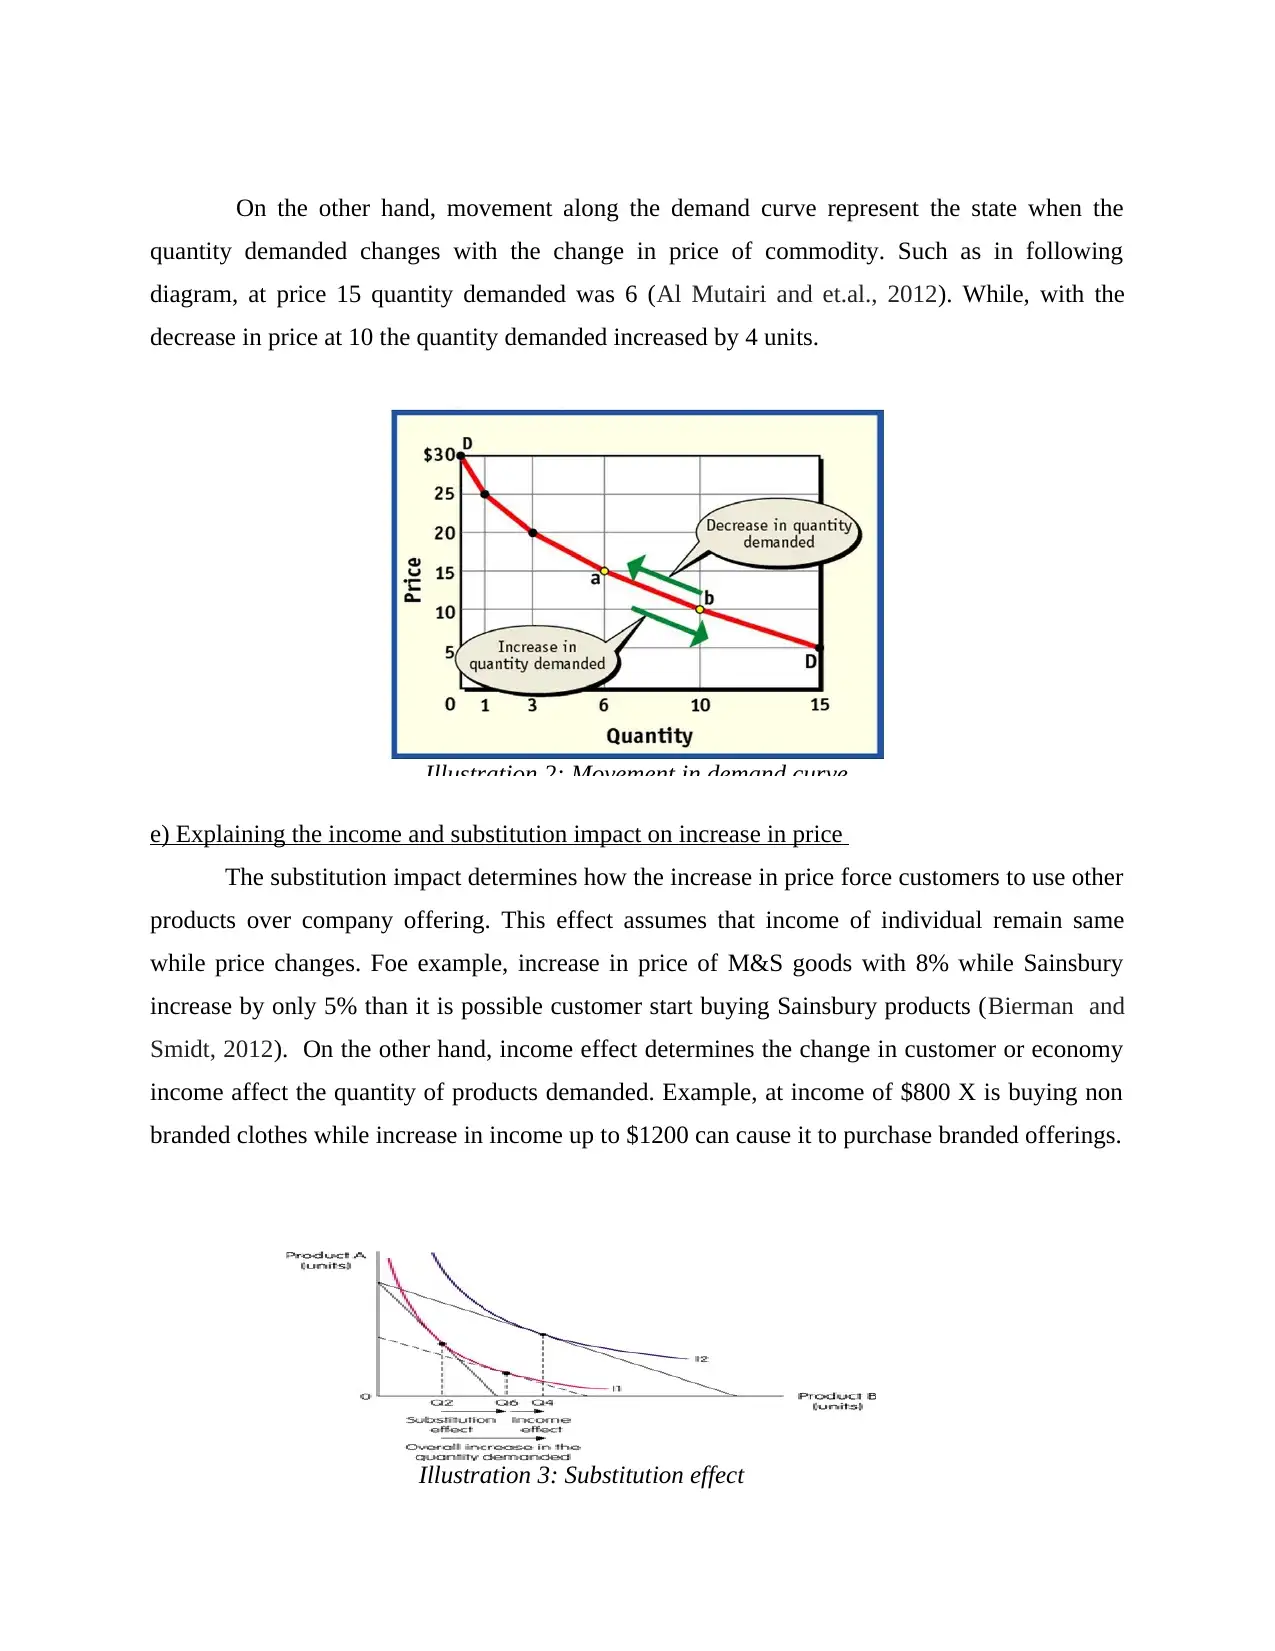
e) Explaining the income and substitution impact on increase in price
The substitution impact determines how the increase in price force customers to use other
products over company offering. This effect assumes that income of individual remain same
while price changes. Foe example, increase in price of M&S goods with 8% while Sainsbury
increase by only 5% than it is possible customer start buying Sainsbury products (Bierman and
Smidt, 2012). On the other hand, income effect determines the change in customer or economy
income affect the quantity of products demanded. Example, at income of $800 X is buying non
branded clothes while increase in income up to $1200 can cause it to purchase branded offerings.
5
Illustration 2: Movement in demand curve
Illustration 3: Substitution effect
quantity demanded changes with the change in price of commodity. Such as in following
diagram, at price 15 quantity demanded was 6 (Al Mutairi and et.al., 2012). While, with the
decrease in price at 10 the quantity demanded increased by 4 units.
e) Explaining the income and substitution impact on increase in price
The substitution impact determines how the increase in price force customers to use other
products over company offering. This effect assumes that income of individual remain same
while price changes. Foe example, increase in price of M&S goods with 8% while Sainsbury
increase by only 5% than it is possible customer start buying Sainsbury products (Bierman and
Smidt, 2012). On the other hand, income effect determines the change in customer or economy
income affect the quantity of products demanded. Example, at income of $800 X is buying non
branded clothes while increase in income up to $1200 can cause it to purchase branded offerings.
5
Illustration 2: Movement in demand curve
Illustration 3: Substitution effect
QUESTION 2
a) The types of market along with examples
Broadly, there are two types of market which are described as follows:
Perfect Competition: It is kind of market situation where there are large number of
sellers offering homogeneous products to wide audience. In this type of market, firms
face tough competition due to free entry and exit process. The customers have proper
knowledge of prevailing prices (Bennouna, Meredith and Marchant, 2010). Hence
increase in price by entity can stimulate them use rivals products. For example, grocery
market where many vendors gather to offer fruits and vegetables.
Monopoly Market: In this market situation there are one seller that provide unique
product. The company further enjoy right to charge high price by exercising control over
supply. The different barriers to entry restrict the firm to enter the competition (Monopoly
market. 2016). Such as before 2006 there was monopoly of Royal mail group in UK
regarding postal services.
b) The public good and its example.
The public good represents those commodities that have features like non excludable and
non rivalrous. Here non excludable goods are those which can be used by everybody irrespective
of their paying capacity. Example, atmosphere, national defence, service of police and fire
department, flood control system etc (Healy and Palepu, 2012). Further, the factor non rivalrous
relates to the fact that consumption of a product does not minimize its significance to others.
Such as, street lights, public beach, road or parks.
c) Explaining the ways in which government intervene in the market.
The government interfere in the economy through various ways. The government
intervene to maintain its control over the operation of company, individuals etc. To address the
issues of inefficiency, the government have to interfere in market. Such as, it can make
modification in economic and other policies, make new laws etc (Lehavy, Li and Merkley,
2011). Increase in bank rate to reduce demand of public borrowings is method through which
government reduce chances of inflationary situation.
d)Explaining the four key macro economic policy objectives
The four major types of macro economic policy objective are as follows:
6
⊘ This is a preview!⊘
Do you want full access?
Subscribe today to unlock all pages.
Trusted by 1+ million students worldwide
Full employment: It is situation where economy aims at providing full employment in
productive work to all labour force.
Price stability: It means that average price must not increase more than 2% in a year.
This will help in keeping low inflation (Humpherys and et.al., 2011).
Economic growth: The objective of macro economic policy is to grow sustainably so
that national income enhance in real terms so as to sustain in future without causing
economic issues (Macro economic policy. 2016).
Payment stability: It means stability in balance of payment so that country is able to pay
off its debt in the global market.
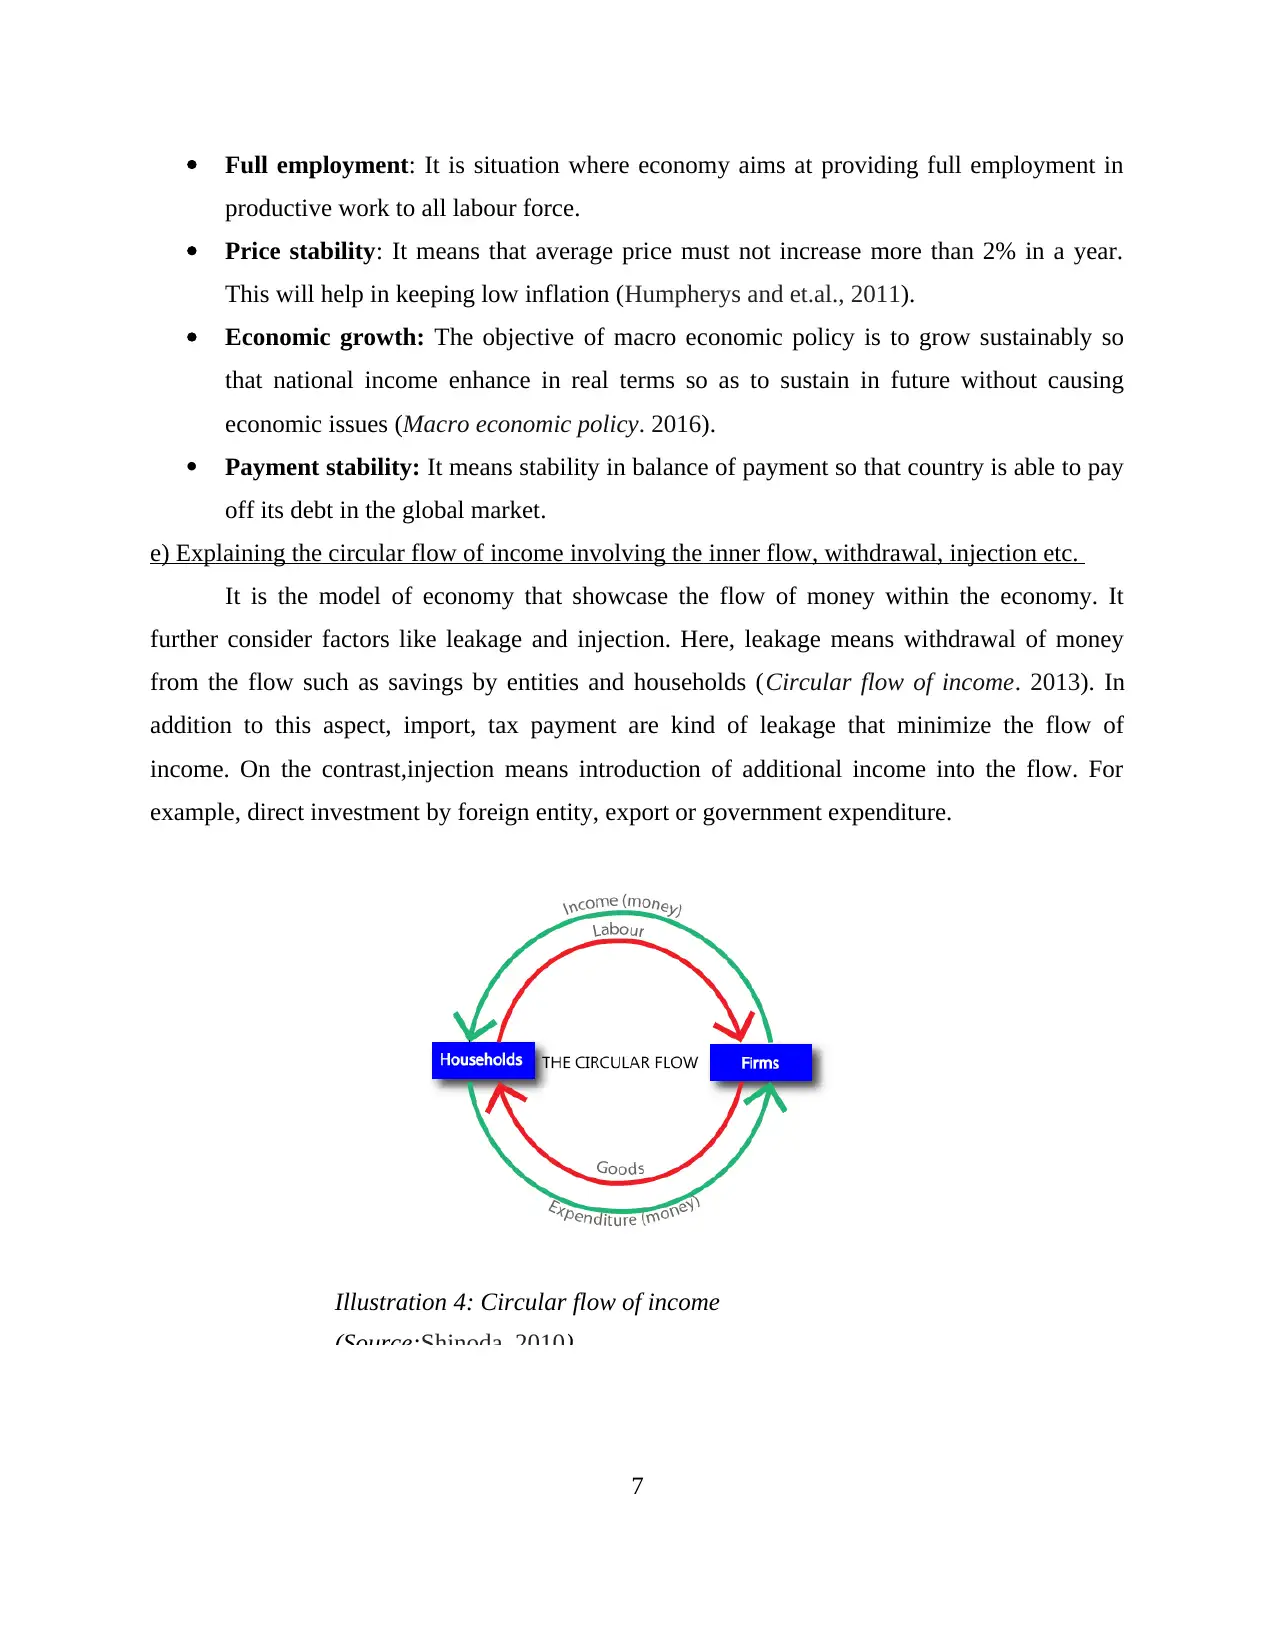
e) Explaining the circular flow of income involving the inner flow, withdrawal, injection etc.
It is the model of economy that showcase the flow of money within the economy. It
further consider factors like leakage and injection. Here, leakage means withdrawal of money
from the flow such as savings by entities and households (Circular flow of income. 2013). In
addition to this aspect, import, tax payment are kind of leakage that minimize the flow of
income. On the contrast,injection means introduction of additional income into the flow. For
example, direct investment by foreign entity, export or government expenditure.
7
Illustration 4: Circular flow of income
(Source:Shinoda, 2010)
productive work to all labour force.
Price stability: It means that average price must not increase more than 2% in a year.
This will help in keeping low inflation (Humpherys and et.al., 2011).
Economic growth: The objective of macro economic policy is to grow sustainably so
that national income enhance in real terms so as to sustain in future without causing
economic issues (Macro economic policy. 2016).
Payment stability: It means stability in balance of payment so that country is able to pay
off its debt in the global market.
e) Explaining the circular flow of income involving the inner flow, withdrawal, injection etc.
It is the model of economy that showcase the flow of money within the economy. It
further consider factors like leakage and injection. Here, leakage means withdrawal of money
from the flow such as savings by entities and households (Circular flow of income. 2013). In
addition to this aspect, import, tax payment are kind of leakage that minimize the flow of
income. On the contrast,injection means introduction of additional income into the flow. For
example, direct investment by foreign entity, export or government expenditure.
7
Illustration 4: Circular flow of income
(Source:Shinoda, 2010)
Paraphrase This Document
Need a fresh take? Get an instant paraphrase of this document with our AI Paraphraser
QUESTION 3
a) Defining the four major areas of finance with examples
The main area of finance are as follows:
Corporate Finance: It refers to capital structure, source of funding used by business
entities to enhance the value of firm to the shareholders. Example, funds obtained from
the sale of stock.
Investment: It means purchase of monetary asset with the objective of appreciation in
future so that it can be sold at a higher price. Such as, buying of land.
Financial institutions: It refers to short and long term borrowings obtained from
financial institutes such as commercial bank, investment bank, investment companies,
brokerage houses and insurance companies etc (Humpherys and et.al., 2011).
International finance: It is field of financial economies that deals with monetary
systems and economies over the nations frontiers.
b) The determinants of market interest rate with different types of risk premium.
The rate of interest is amount due in particular period. The market interest rate means the
rate at which interest is paid by borrower to lender for the borrowed amount. The interest rate is
determined by following factors:
Supply and demand: The interest rate changes with the increase in supply or demand of money
in economy. Such as with more in the economy the government may increase the bank rate to
reduce the excess of money in the economy (MacNeilage, 2012).
Liquidity premium: It refers to rate charged by lenders to show the concept that some
securities cannot be changed into cash on short notice at fair market prices. Example, treasury
bills.
Default risk premium: It represent the chance that the borrower may fail to pay interest or
principal amount at the declared time and in the stated amount.
c) Explaining the four basic financial statements
The four major financial statements are as follows:
8
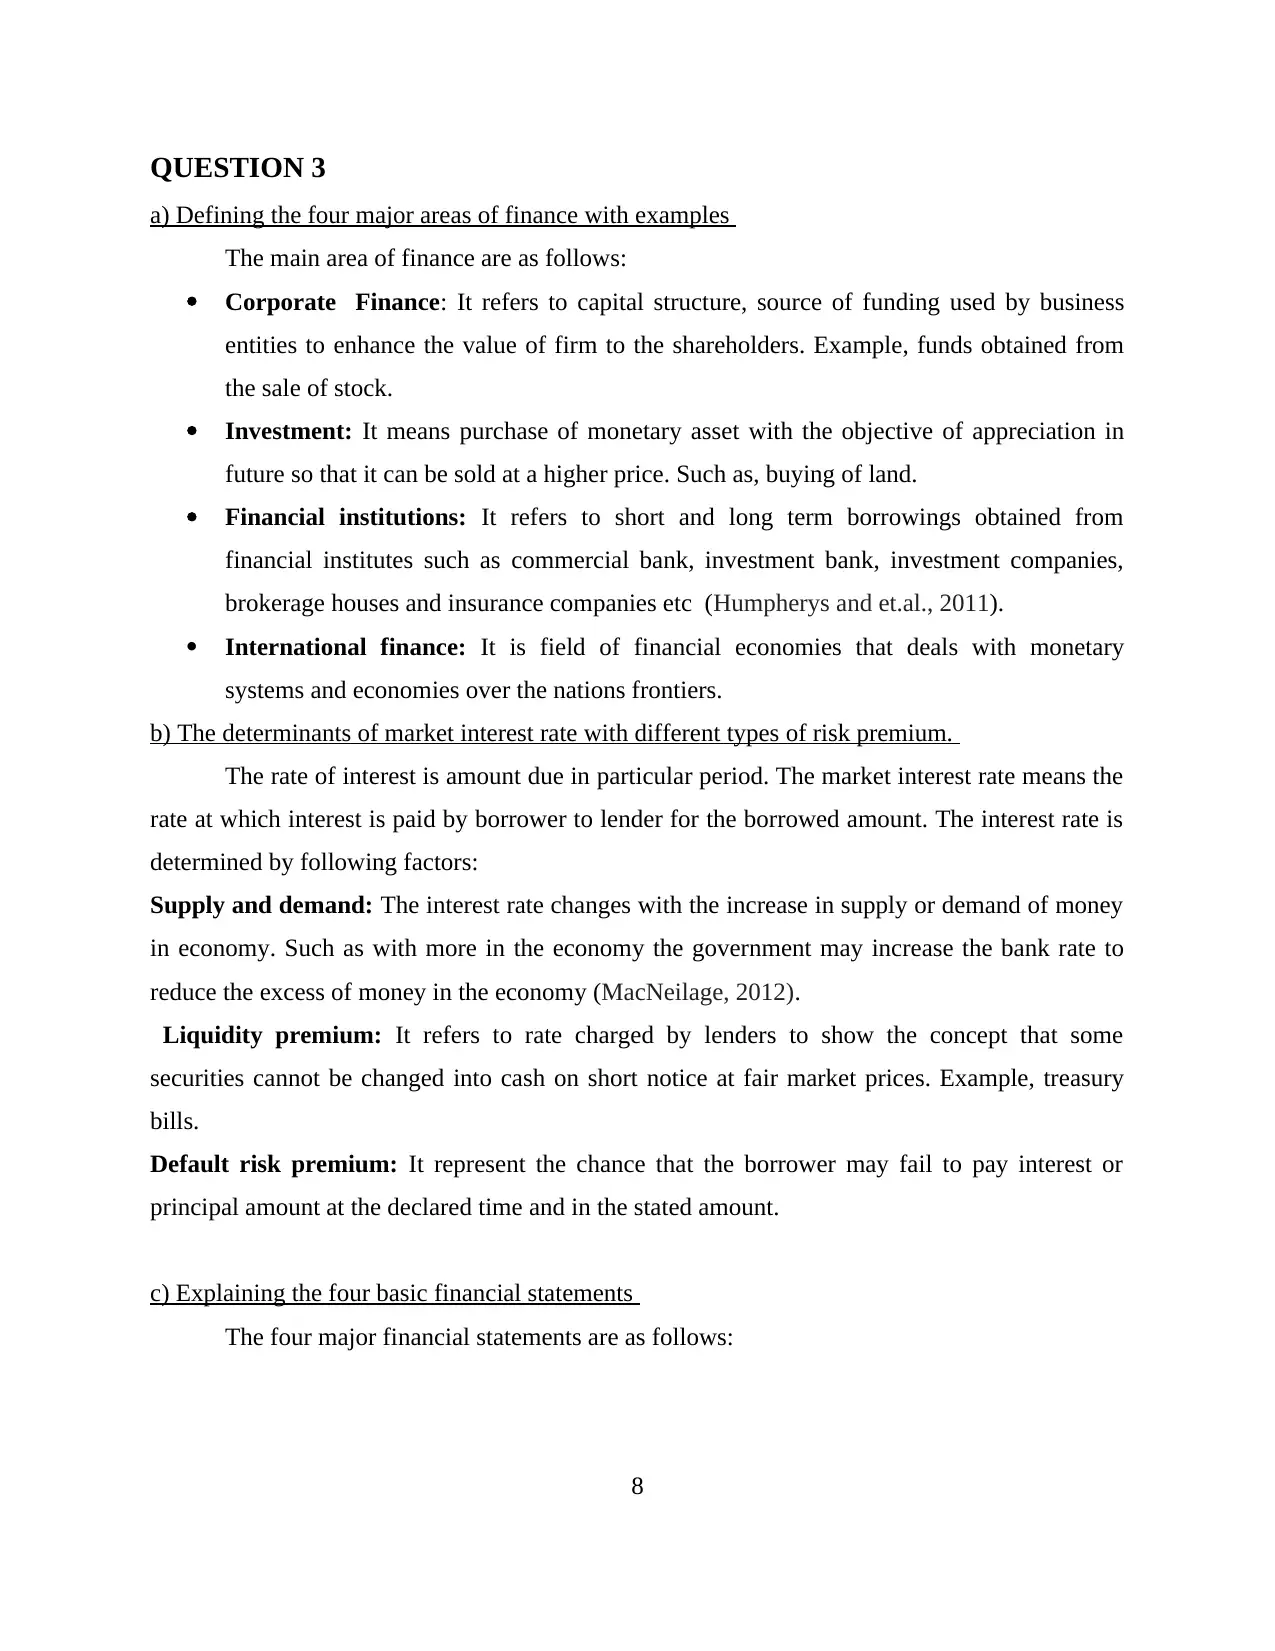
Balance sheet: It is statement of asset, liabilities and capital of company at specific time
period. It help in understanding the financial position and worth of business in market at
particular time period. The formal of balance sheet is
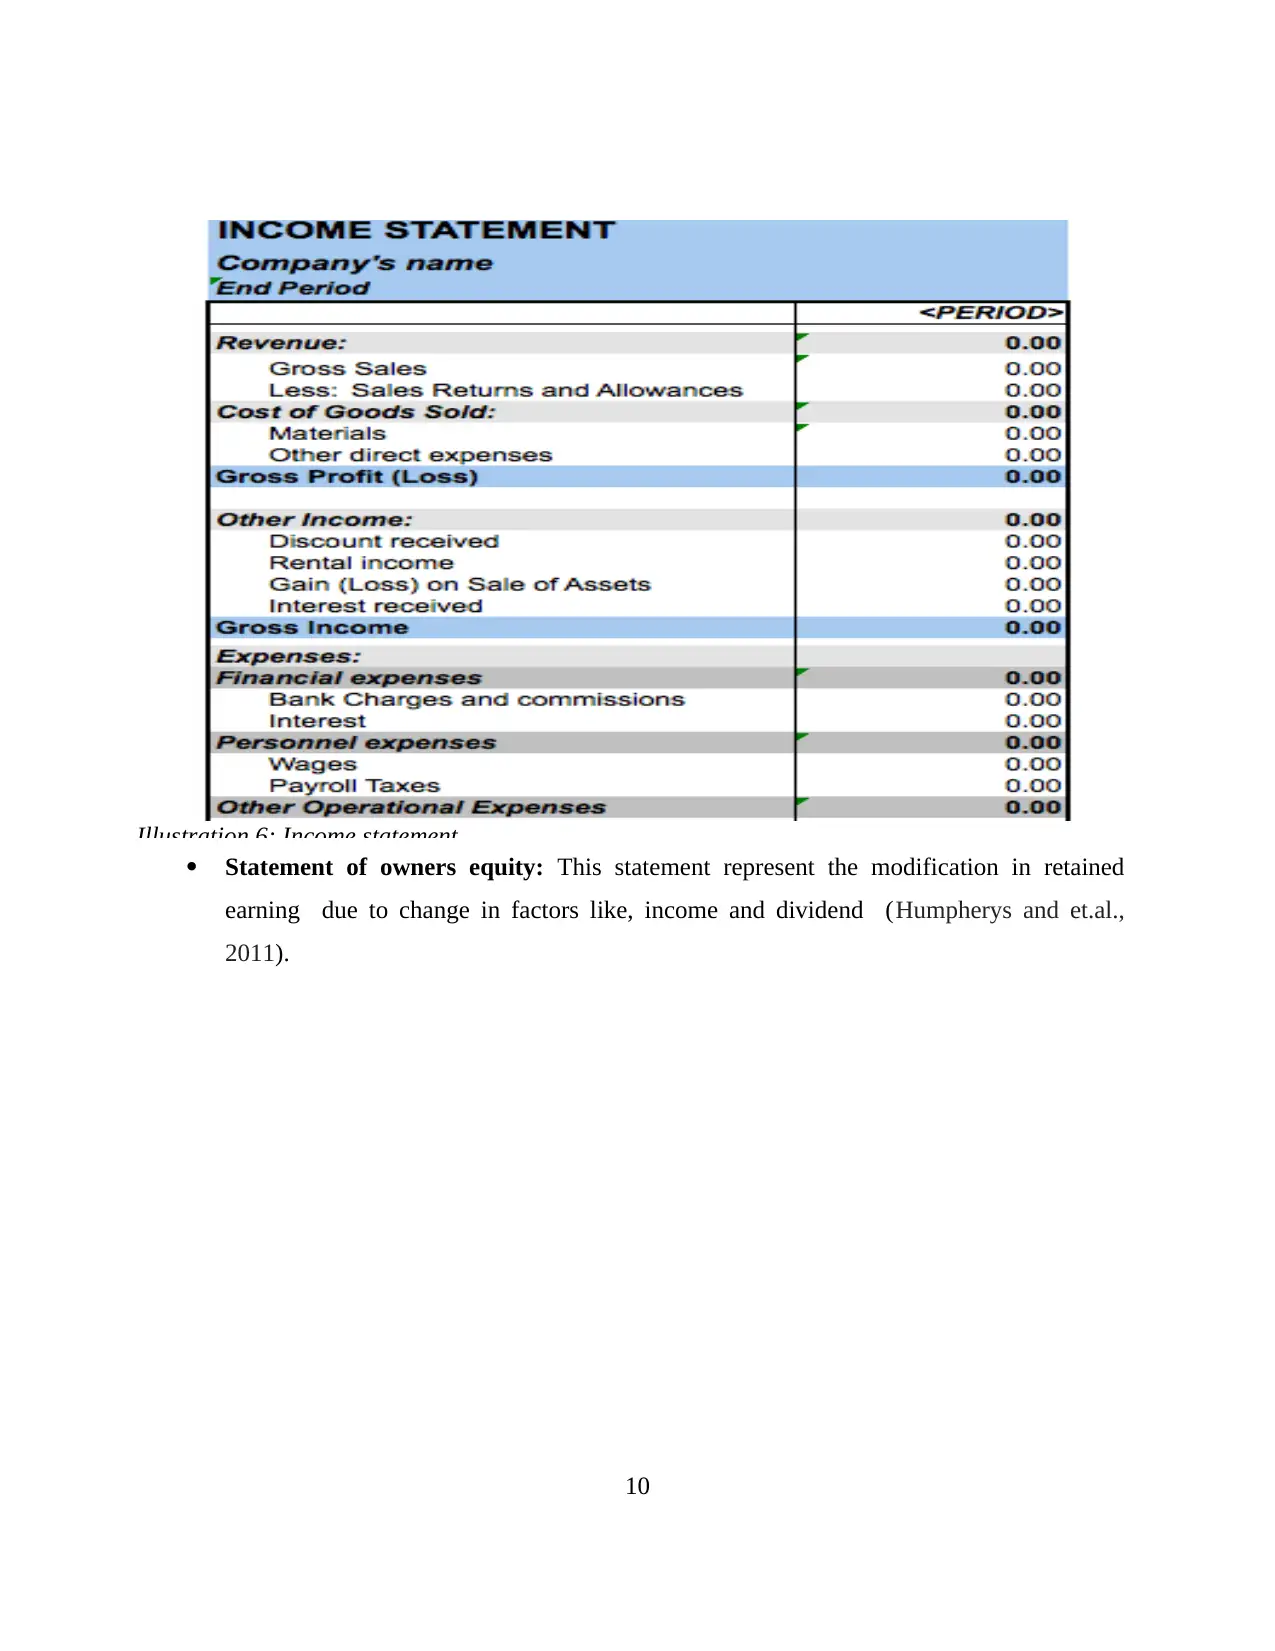
Income statement: It is statement that represent profit after subtracting expenses for
provided time period closing at particular date. The main purpose of preparing income
statement is to check the profitability of business.
9
Illustration 5: Balance sheet
(Source: Types of financial statement. 2010)
period. It help in understanding the financial position and worth of business in market at
particular time period. The formal of balance sheet is
Income statement: It is statement that represent profit after subtracting expenses for
provided time period closing at particular date. The main purpose of preparing income
statement is to check the profitability of business.
9
Illustration 5: Balance sheet
(Source: Types of financial statement. 2010)
⊘ This is a preview!⊘
Do you want full access?
Subscribe today to unlock all pages.
Trusted by 1+ million students worldwide
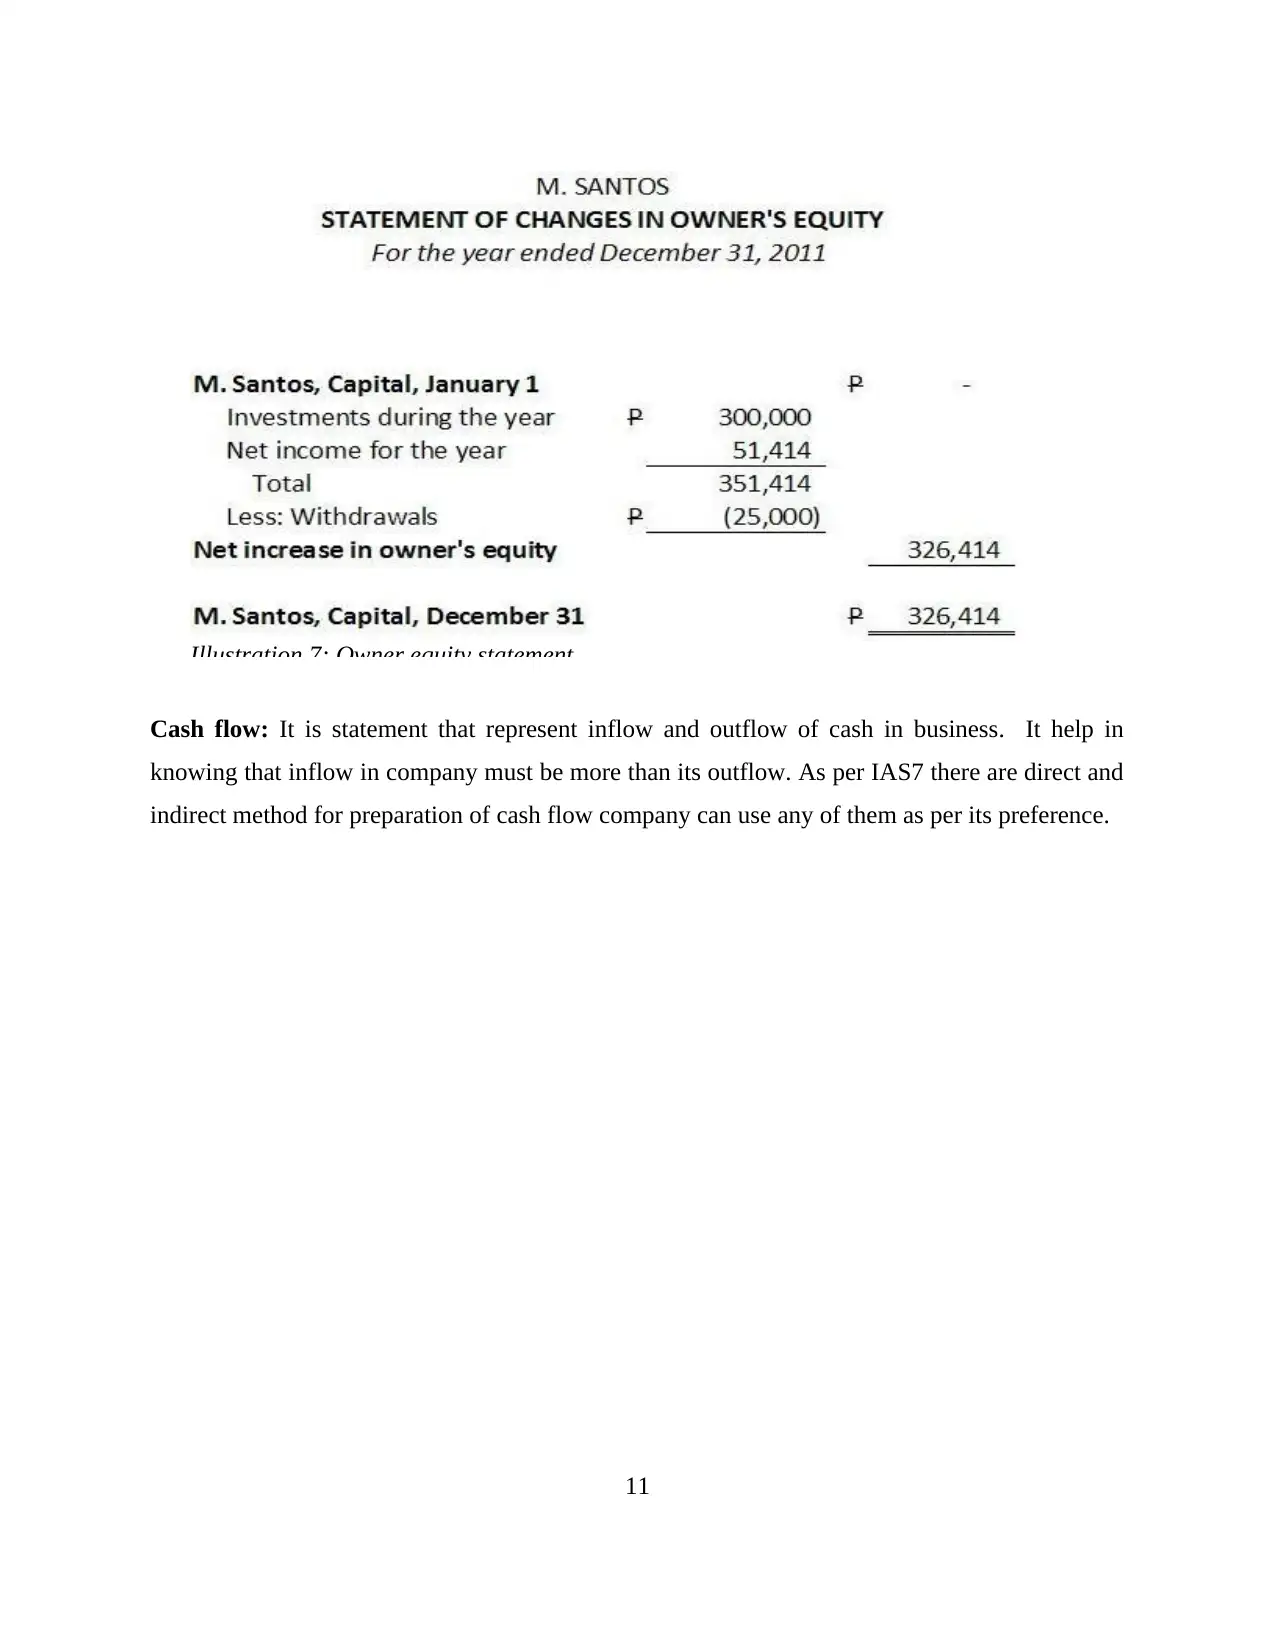
Statement of owners equity: This statement represent the modification in retained
earning due to change in factors like, income and dividend (Humpherys and et.al.,
2011).
10
Illustration 6: Income statement
earning due to change in factors like, income and dividend (Humpherys and et.al.,
2011).
10
Illustration 6: Income statement
Paraphrase This Document
Need a fresh take? Get an instant paraphrase of this document with our AI Paraphraser
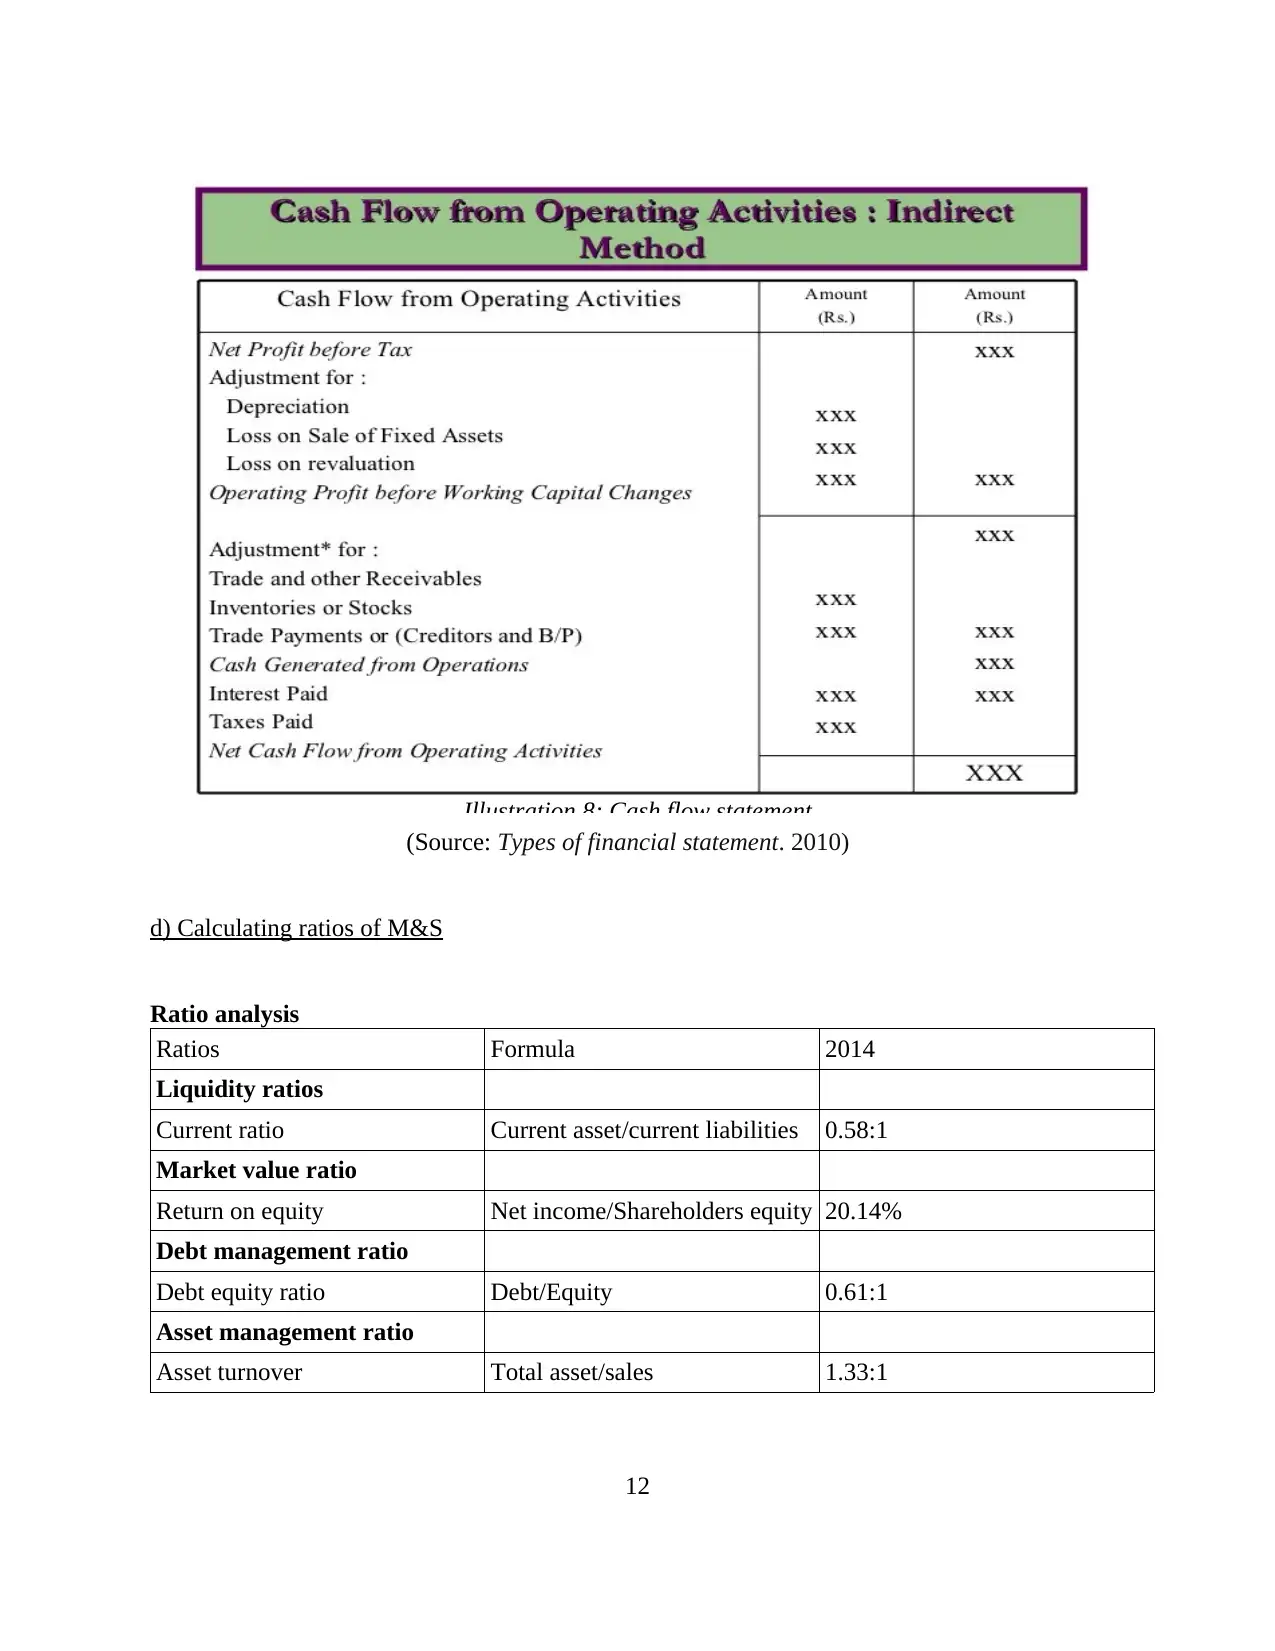
Cash flow: It is statement that represent inflow and outflow of cash in business. It help in
knowing that inflow in company must be more than its outflow. As per IAS7 there are direct and
indirect method for preparation of cash flow company can use any of them as per its preference.
11
Illustration 7: Owner equity statement
knowing that inflow in company must be more than its outflow. As per IAS7 there are direct and
indirect method for preparation of cash flow company can use any of them as per its preference.
11
Illustration 7: Owner equity statement
(Source: Types of financial statement. 2010)
d) Calculating ratios of M&S
Ratio analysis
Ratios Formula 2014
Liquidity ratios
Current ratio Current asset/current liabilities 0.58:1
Market value ratio
Return on equity Net income/Shareholders equity 20.14%
Debt management ratio
Debt equity ratio Debt/Equity 0.61:1
Asset management ratio
Asset turnover Total asset/sales 1.33:1
12
Illustration 8: Cash flow statement
⊘ This is a preview!⊘
Do you want full access?
Subscribe today to unlock all pages.
Trusted by 1+ million students worldwide
1 out of 16
Related Documents


Your All-in-One AI-Powered Toolkit for Academic Success.
+13062052269
info@desklib.com
Available 24*7 on WhatsApp / Email
![[object Object]](/_next/static/media/star-bottom.7253800d.svg)
Unlock your academic potential
Copyright © 2020–2026 A2Z Services. All Rights Reserved. Developed and managed by ZUCOL.