Coursework: FELM4026 Financial and Economic Literacy for Managers
VerifiedAdded on 2023/06/14
|22
|4317
|110
Report
AI Summary
This report provides an analysis of financial and economic literacy for managers, focusing on the UK economy. It examines the growth strategy of Iceland, a UK supermarket chain, highlighting product differentiation, innovation, advertising, convenience, and value. The report also delves into the determinants of housing demand and supply in the UK, discussing the impact of interest rates, mortgage availability, economic growth, and the role of the Bank of England's monetary policy. Furthermore, it assesses key macroeconomic indicators such as Gross Domestic Product (GDP), inflation, and unemployment in the UK, providing insights into the country's economic performance over recent years. The report concludes with answers to specific financial and economic questions, offering a comprehensive overview of the subject matter.
Running Head: FINANCIAL AND ECONOMIC LITERACY FOR MANAGERS
Financial and Economic Literacy for Managers
Name of the Student
Name of the University
Author note
Financial and Economic Literacy for Managers
Name of the Student
Name of the University
Author note
Paraphrase This Document
Need a fresh take? Get an instant paraphrase of this document with our AI Paraphraser
1FINANCIAL AND ECONOMIC LITERACY FOR MANAGERS
Table of Contents
Answer 1....................................................................................................................................2
Introduction............................................................................................................................2
Iceland; supermarket chain....................................................................................................2
Growth strategy of Iceland.....................................................................................................2
Conclusion..............................................................................................................................5
Answer 2....................................................................................................................................5
Introduction............................................................................................................................5
Determinants of housing demand...........................................................................................5
Determinants of housing supply.............................................................................................6
Monetary policy of Bank of England.....................................................................................7
Conclusion..............................................................................................................................7
Answer 3....................................................................................................................................8
Introduction............................................................................................................................8
Gross Domestic Product.........................................................................................................8
Inflation................................................................................................................................10
Unemployment.....................................................................................................................11
Conclusion............................................................................................................................11
Answer 4..................................................................................................................................11
Answer 5:.................................................................................................................................13
Answer A:............................................................................................................................13
Answer B:.............................................................................................................................15
Answer C:.............................................................................................................................16
References................................................................................................................................17

2FINANCIAL AND ECONOMIC LITERACY FOR MANAGERS
⊘ This is a preview!⊘
Do you want full access?
Subscribe today to unlock all pages.
Trusted by 1+ million students worldwide
3FINANCIAL AND ECONOMIC LITERACY FOR MANAGERS
Answer 1
Introduction
In the UK economy, along with big enterprises small and medium sized enterprise
hold an important position. These sectors have significant contribution in enhancing
economic growth and provide several Job opportunities. The small and medium sized
business are motivated to invest in innovation to match the level of competition
(smallbusiness.co.uk 2018). Iceland, operating in UK’s supermarket chain though has a
comparatively small share in value chain but has interesting strategies to maintain its unique
place in the supermarket chain. The report analyzes the growth strategy of one of the UK’s
grocery retailer, Iceland.
Iceland; supermarket chain
The Iceland Food Ltd, known by the name Iceland operates in supermarket chain in
UK. The company puts emphasis on selling of frozen food, prepared vegetable and meal.
Apart from this, the company also engages in selling grocery items like meat, dairy and dry
goods. In the supermarket chain of UK, Iceland captures a market share of 2.2%
(iceland.co.uk 2018).
Growth strategy of Iceland
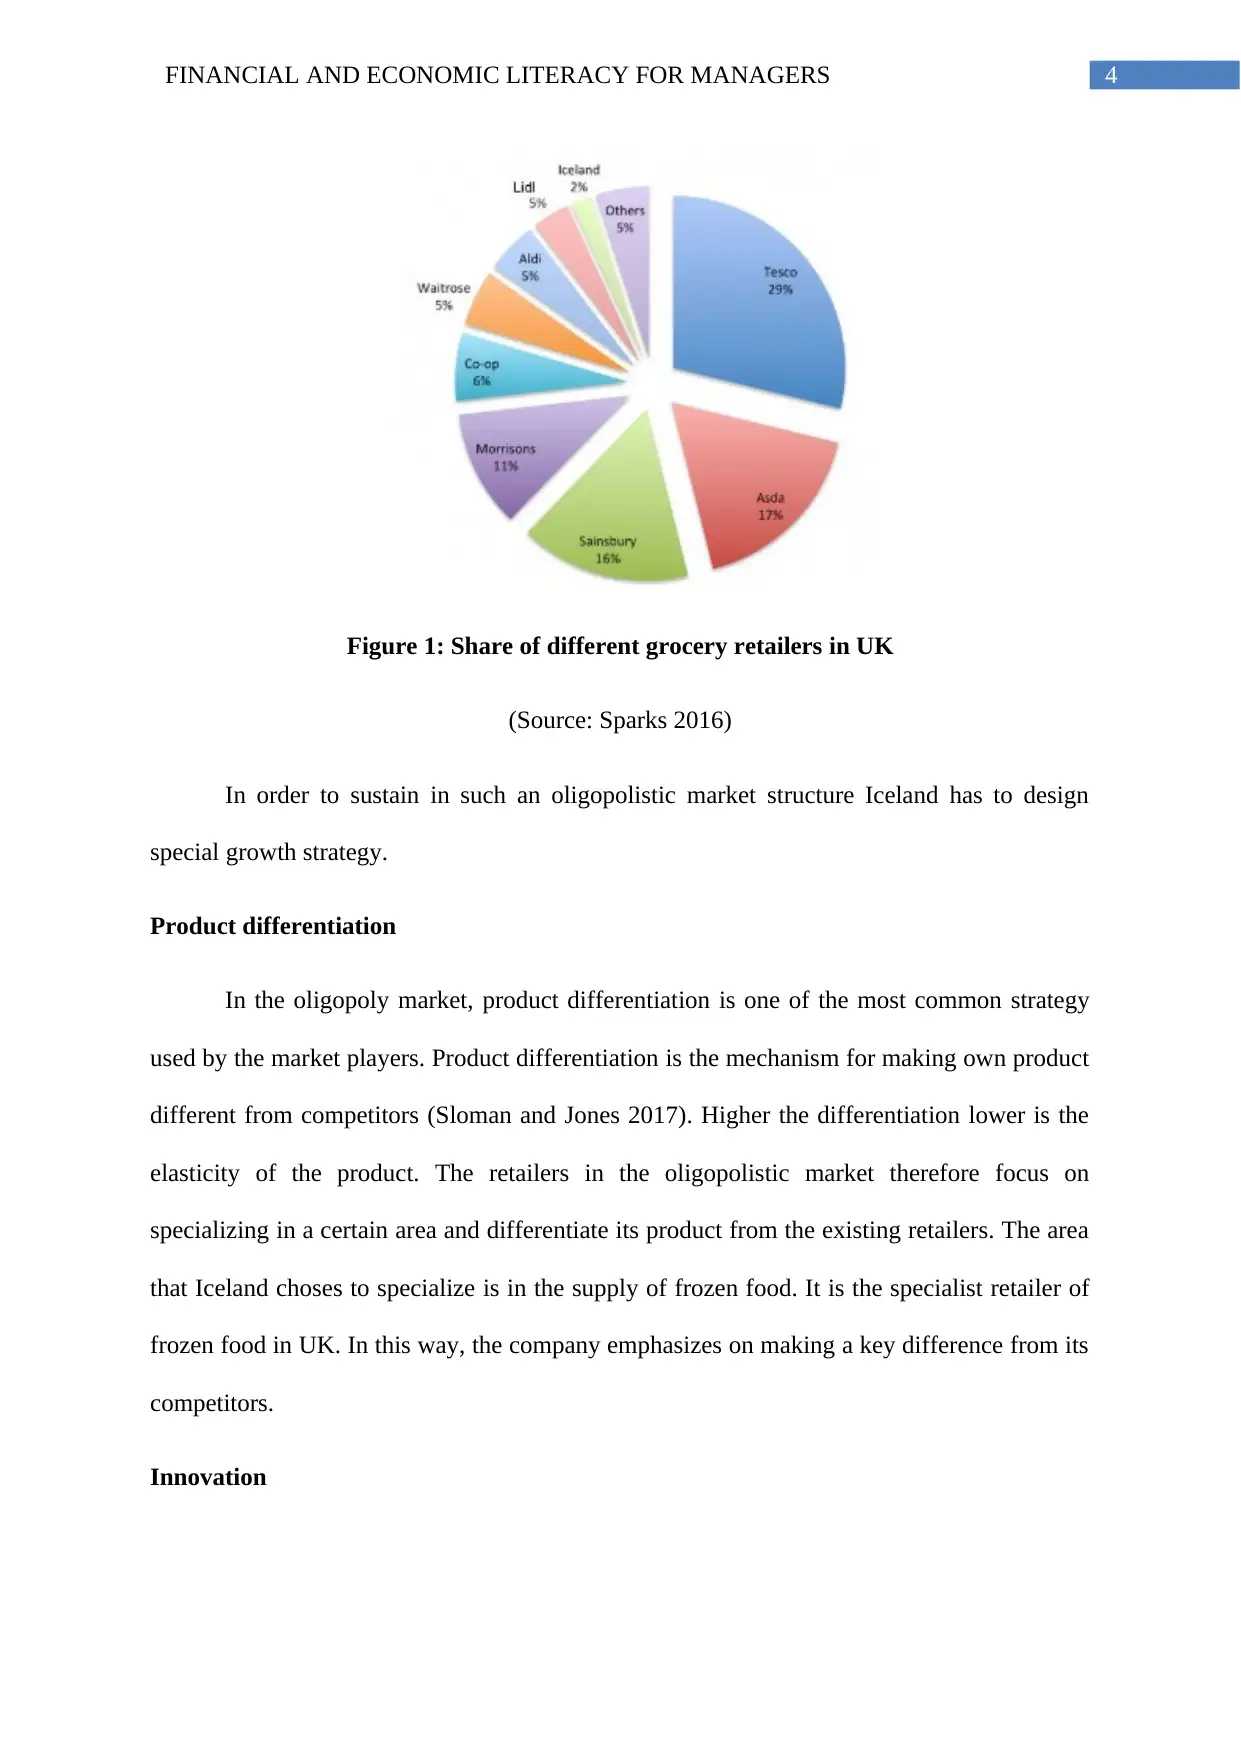
The grocery supermarket in UK has characteristics similar to that of an oligopoly
market. Oligopoly is a market that has few large market players capturing a major share in
the market The four major players in UK supermarkets are Tesco, Morrison, Sainsbury and
Asda (Sparks 2016).
Answer 1
Introduction
In the UK economy, along with big enterprises small and medium sized enterprise
hold an important position. These sectors have significant contribution in enhancing
economic growth and provide several Job opportunities. The small and medium sized
business are motivated to invest in innovation to match the level of competition
(smallbusiness.co.uk 2018). Iceland, operating in UK’s supermarket chain though has a
comparatively small share in value chain but has interesting strategies to maintain its unique
place in the supermarket chain. The report analyzes the growth strategy of one of the UK’s
grocery retailer, Iceland.
Iceland; supermarket chain
The Iceland Food Ltd, known by the name Iceland operates in supermarket chain in
UK. The company puts emphasis on selling of frozen food, prepared vegetable and meal.
Apart from this, the company also engages in selling grocery items like meat, dairy and dry
goods. In the supermarket chain of UK, Iceland captures a market share of 2.2%
(iceland.co.uk 2018).
Growth strategy of Iceland
The grocery supermarket in UK has characteristics similar to that of an oligopoly
market. Oligopoly is a market that has few large market players capturing a major share in
the market The four major players in UK supermarkets are Tesco, Morrison, Sainsbury and
Asda (Sparks 2016).
Paraphrase This Document
Need a fresh take? Get an instant paraphrase of this document with our AI Paraphraser
4FINANCIAL AND ECONOMIC LITERACY FOR MANAGERS
Figure 1: Share of different grocery retailers in UK
(Source: Sparks 2016)
In order to sustain in such an oligopolistic market structure Iceland has to design
special growth strategy.
Product differentiation
In the oligopoly market, product differentiation is one of the most common strategy
used by the market players. Product differentiation is the mechanism for making own product
different from competitors (Sloman and Jones 2017). Higher the differentiation lower is the
elasticity of the product. The retailers in the oligopolistic market therefore focus on
specializing in a certain area and differentiate its product from the existing retailers. The area
that Iceland choses to specialize is in the supply of frozen food. It is the specialist retailer of
frozen food in UK. In this way, the company emphasizes on making a key difference from its
competitors.
Innovation
5FINANCIAL AND ECONOMIC LITERACY FOR MANAGERS
In order to differentiate product, company needs to invest in innovation. Innovation
helps to improve existing product by adding new features to the product. For several years.
Iceland has remained a leading brand in frozen food through extensive investment in
innovation. The company invests in innovation in new product line to satisfy its customers.
Advertising
Advertising is one of important marketing strategy in the oligopoly market. The
customers come to know about new product, specific feature of the product, price offers and
other attractive features of the product. When more and more people have information about
the competitors’ product, the market concentration reduces (Smit and Trigeorgis 2015). In
order to promote it product, Iceland designs marketing campaign. The marketing campaign
known as Power of Frozen to uplift shoppers’ view about frozen food. Overtime the company
has changed its advertising pattern to attract attention of more and more customers. From
initial store based campaign, the company gradually shifts to advertise in TV and in other
social media.
Convenience
Iceland provides a convenient means of shopping to its customers. The frozen food
offered in the stores is easy to cook and involve minimal waste. Customers can easily shop
from the local stores of Iceland whenever needed. The retailers also provide home delivery
service for purchasing above an amount of £20 (iceland.co.uk 2018). Customers can shop
online as per their convenience.
Value
The brand price of Iceland is benchmarked to ensure that it can offer same quality
product at a lower price or offer a combination of a better quality and a relatively low price.
⊘ This is a preview!⊘
Do you want full access?
Subscribe today to unlock all pages.
Trusted by 1+ million students worldwide

6FINANCIAL AND ECONOMIC LITERACY FOR MANAGERS
Paraphrase This Document
Need a fresh take? Get an instant paraphrase of this document with our AI Paraphraser

7FINANCIAL AND ECONOMIC LITERACY FOR MANAGERS
Conclusion
Iceland is one of the leading frozen food seller of the UK grocery supermarket. The
company though has a comparatively small share in value chain but has interesting strategies
to maintain its unique place in the supermarket chain. Product differentiation, innovation,
convenience, advertising and value are the focus areas of the concerned company.
Answer 2
Introduction
Real estate market is an integral part of any economy. Price in the housing market is
determined from the interplay of demand and supply side factors. Since 1990s, the UK
housing market has undergone drastic changes (Wilcox and Perry 2014). A major change is
observed in the ownership status of houses, which gradually shifted towards public
ownership through because of intervention of Bank of England and local authorities. The
report briefly discusses demand and supply side factors in UK housing market and the
associated monetary policy of Bank of England.
Determinants of housing demand
Interest rate
One primary determinant of housing demand is the rate of interest for mortgage
repayment. Lower interest rate encourages people to take loan because of a lower cost of
interest. Conversely, during tight monetary policy people have a lower demand for loan. This
intron determines affordability of housing. In 1992, the prevailing interest rate in UK was as
high as 15% (Campbell and Roskelley 2018). In response to high interest rate, the housing
demand declined significantly. However, BOE took a policy of monetary easing during 1990s
and 2000s. This encouraged people to buy more houses.

8FINANCIAL AND ECONOMIC LITERACY FOR MANAGERS
Availability of mortgage
Associated with interest rate, another determinant of housing demand is the
availability of mortgages that is bank’s willingness to lend deposits as mortgage. When bank
offers mortgages with multiple of bigger income then this increases effective demand of
housing. The availability of mortgage varies with interbank strength of the financial sector
(Oliner 2016). During global financial crisis, the economy has experienced a sharp increase
in cost of lending which lead to a decrease in available funds for lending mortgages. This
interrupted housing demand.
Economic growth
In times of economic expansion, people experience a rise in their real income. This
increases housing affordability and hence, housing demand.
Renting cost
If renting cost rises continuously then people have a higher tendency to buy own
house. The mortgage payment might seem cheaper than the renting cost. In housing market of
UK, renting cost if comparatively higher encouraging people to buy new house and thus
boosting demand for housing (Campbell and Roskelley 2018).
Population
The strength of population helps to determine housing demand. Along with
population, the size of household is also important in determining housing demand.
Determinants of housing supply
The effective supply of housing depend on construction of new houses in the
economy. In UK, the number of new house construction varied in different years. During
⊘ This is a preview!⊘
Do you want full access?
Subscribe today to unlock all pages.
Trusted by 1+ million students worldwide
9FINANCIAL AND ECONOMIC LITERACY FOR MANAGERS
1960s, the housing market had more than 400,000 new houses per year. This number has
declined to 150,000 in the late 1990s and 2000s (Wilcox and Perry 2014).
One factor contributing to a decline in construction of new houses is restriction placed
on housing planning in land identified as green-belt land. Builders are interested in
constructing new houses only when it seems profitable to them (Oliner 2016). During boom
in housing market, supply of new house increases while in phase of declining housing price,
housing supply declines.
Monetary policy of Bank of England
Bank of England uses monetary policy tools to stabilize housing market and tries to
prevent any crash to occur in the housing market. The BOE regulates banks and interest rate
to control mortgage loan in the property market. In the last few years, the housing price in
UK has risen sharply in response to a higher demand. To restrict housing demand BOE has
imposed a cap on the borrowing. The objective of this cap is to control flow of credit once
housing price rises above expectation (McCrone and Stephens 2017). Banks in UK suffer
severe loss when borrowers are unable to repay loans once the value of the house fell below
the repayment amount. To prevent this, BOE lends money depending on the proportion of
borrowed money to the value of houses. Restriction has also been placed in relation to
income.
Conclusion
The major factors determining housing demand in UK include interest rate,
availability of mortgage, Cost of renting, population, economic growth and income. On the
supply side, the main determining factors are construction of new houses, profitability and
restriction on housing planning. The Bank of England has imposed restriction on borrowing
to control housing demand and housing price.
Paraphrase This Document
Need a fresh take? Get an instant paraphrase of this document with our AI Paraphraser

10FINANCIAL AND ECONOMIC LITERACY FOR MANAGERS

11FINANCIAL AND ECONOMIC LITERACY FOR MANAGERS
Answer 3
Introduction
The key macroeconomic indicators of an economy are Gross Domestic product and
associated growth rate, inflation rate, unemployment rate, interest rate and such others. All
these together determine macroeconomic state of a nation. The report focuses on performance
of key macroeconomic indicators of United Kingdom for the past few years.
Gross Domestic Product
Gross Domestic Product is an overall measure of nations’ output. It indicates the total
monetary values of all goods and services in the economy. There are two approaches to
compute GDP of a nation. One is to use market value of the current year. This is known as
nominal GDP. One better measure is to use market price of a stable base year. This is known
as real GDP (Bernanke, Antonovics and Frank 2015). The real GDP is a more accurate
measure of output performance as it is adjusted for inflation.
Figure 2: Trend in Real GDP in UK
(Source: fred.stlouisfed.org 2018)
As seen from the above graph, real GDP in UK has constituted a sharp increase in
GDP for the last two decades. A break is observed in 2008 when GDP fell the following
⊘ This is a preview!⊘
Do you want full access?
Subscribe today to unlock all pages.
Trusted by 1+ million students worldwide
1 out of 22
Related Documents


Your All-in-One AI-Powered Toolkit for Academic Success.
+13062052269
info@desklib.com
Available 24*7 on WhatsApp / Email
![[object Object]](/_next/static/media/star-bottom.7253800d.svg)
Unlock your academic potential
Copyright © 2020–2026 A2Z Services. All Rights Reserved. Developed and managed by ZUCOL.