Financial and Economic Literacy Report: Economics & Finance Overview
VerifiedAdded on 2020/01/28
|15
|3771
|88
Report
AI Summary
This report provides a comprehensive overview of financial and economic literacy, covering essential concepts for managers. It begins with an introduction to production classifications (job, batch, and mass), opportunity cost, and the UK standard industrial classification. The report then delves into microeconomic principles, including demand curves, substitution and income effects, and market types (oligopoly and perfect markets). Public goods, government interventions, and macroeconomic objectives such as full employment and price stability are also discussed. Furthermore, the report explores finance, including corporate finance, investment, financial markets, and corporate accounting. It examines market interest rates, risk premiums, and the analysis of financial statements. Capital budgeting, including NPV analysis and the yield curve, is also covered. The report concludes with a project evaluation, providing a practical application of the concepts discussed.

FINANCIAL AND ECONOMIC
LITERACY FOR MANAGERS
LITERACY FOR MANAGERS
Paraphrase This Document
Need a fresh take? Get an instant paraphrase of this document with our AI Paraphraser
TABLE OF CONTENTS
INTRODUCTION...........................................................................................................................3
Question 1........................................................................................................................................3
(a) Explain three classification of production and example of same..........................................3
(b) Explain opportunity cost and give example .........................................................................3
(c) Purpose and evaluation of UK standard industrial classification since 1948........................4
(d) Explanation on demand curve and shift in same...................................................................4
(e) Explain income and substitution effect on increase in price.................................................5
Question 2........................................................................................................................................5
(a) Explain two types of market and give example of each........................................................5
(b) Define public goods and give examples................................................................................5
(c) Three ways in which government intervene in the market with example.............................6
(d) Four macroeconomic policy objectives that are pursued by the government.......................6
(e) Explain circular flow of income ...........................................................................................7
Question 3........................................................................................................................................7
(a) Define and give examples on four major areas of finance....................................................7
(b) Determinants of market interest rates and types of risk premium.........................................7
(c) Explanation on four basic financial statements including formats and purpose...................8
(d) Ratio analysis of Mark & Spencer.........................................................................................8
Question 4........................................................................................................................................9
(a) Importance of capital budgeting and process of making capital investment decisions........9
(b) How NPV is used to make investment decisions................................................................10
(c) Define yield curve reasons why same differ .......................................................................10
(e) Project evaluation................................................................................................................10
CONCLUSION..............................................................................................................................11
INDEX OF TABLES
Table 1: Ratio analysis...................................................................................................................10
LIST OF FIGURES
Figure 1 Normal demand curve.......................................................................................................5
Figure 2: Shift in demand curve......................................................................................................5
Figure 3: Capital budgeting process..............................................................................................11
Figure 4: Yield curve.....................................................................................................................12
⊘ This is a preview!⊘
Do you want full access?
Subscribe today to unlock all pages.
Trusted by 1+ million students worldwide
INTRODUCTION
This report is prepared on economics and under this various topics that comes under
microeconomics and macroeconomics are discussed in detail in the report. Apart from this
project evaluation methods are also described and applied to select most viable project.
Question 1
(a) Explain three classification of production and example of same
Three classification of production systems are job production, batch production and mass
or flow production. Job production refers to the production of goods according to the
specifications provided by the customer (Schumacher, 2011). In this production system there is
no specific standard that is followed for producing goods in facility. Batch production is another
manufacturing system under which goods are repeatedly produced which are identical in nature.
On the basis of expected demand similar product is produced again and again in order to meet
demand of the people. Third and important production system is mass production under which
on large scale good are produced by the manufacturer in his plant. Under this system goods are
produced by following specific standards on regular basis (Jones, E and Sloman, J., 2014). Three
of above discussed production system are different from each other.
(b) Explain opportunity cost and give example
In business number of assets are used and some of them can be used to perform multiple
activities. Use of specific asset generate economic benefit for the firm in terms of cash inflow or
cost curtailment. Some times in business situation comes when it is not possible to make multiple
use of the asset in single time period (Becker, 2010). In that case the economic benefit that firm
is not able to receive by making other use of asset is assumed as cost which comes in existence
because firm is not able to reap full benefit of same. For example there is building on the firm
and its some part is vacant. Firm have two options either it can make investment in equity or it
can invest money on mutual funds. If it will invest in shares then it is expected that return of 10%
will be ROI (Etzioni, 2010). Similarly, if investment will be made in mutual fund then return of
15% can be earned on investment. Concern invest in equity and it earn return of 9%. Whereas,
mutual fund give a return of 13%. This means that opportunity cost for the firm was (13-9= 4%).
If it will make investment in mutual fund then it can earn 4% more return but it loose this
opportunity. Hence, 4% is opportunity cost for the firm.
Paraphrase This Document
Need a fresh take? Get an instant paraphrase of this document with our AI Paraphraser
(c) Purpose and evaluation of UK standard industrial classification since 1948
In order differentiate business activities according to economic activities, UKSIC was
launched in 1998. Its main objective is to identify the business activities of concerns that operate
in different sectors like manufacturing, mining and agriculture etc (Atkinson and Stiglitz, 2015).
Present version is UKSIC 2007 and it applied to each and every business firm that operate in the
UK.
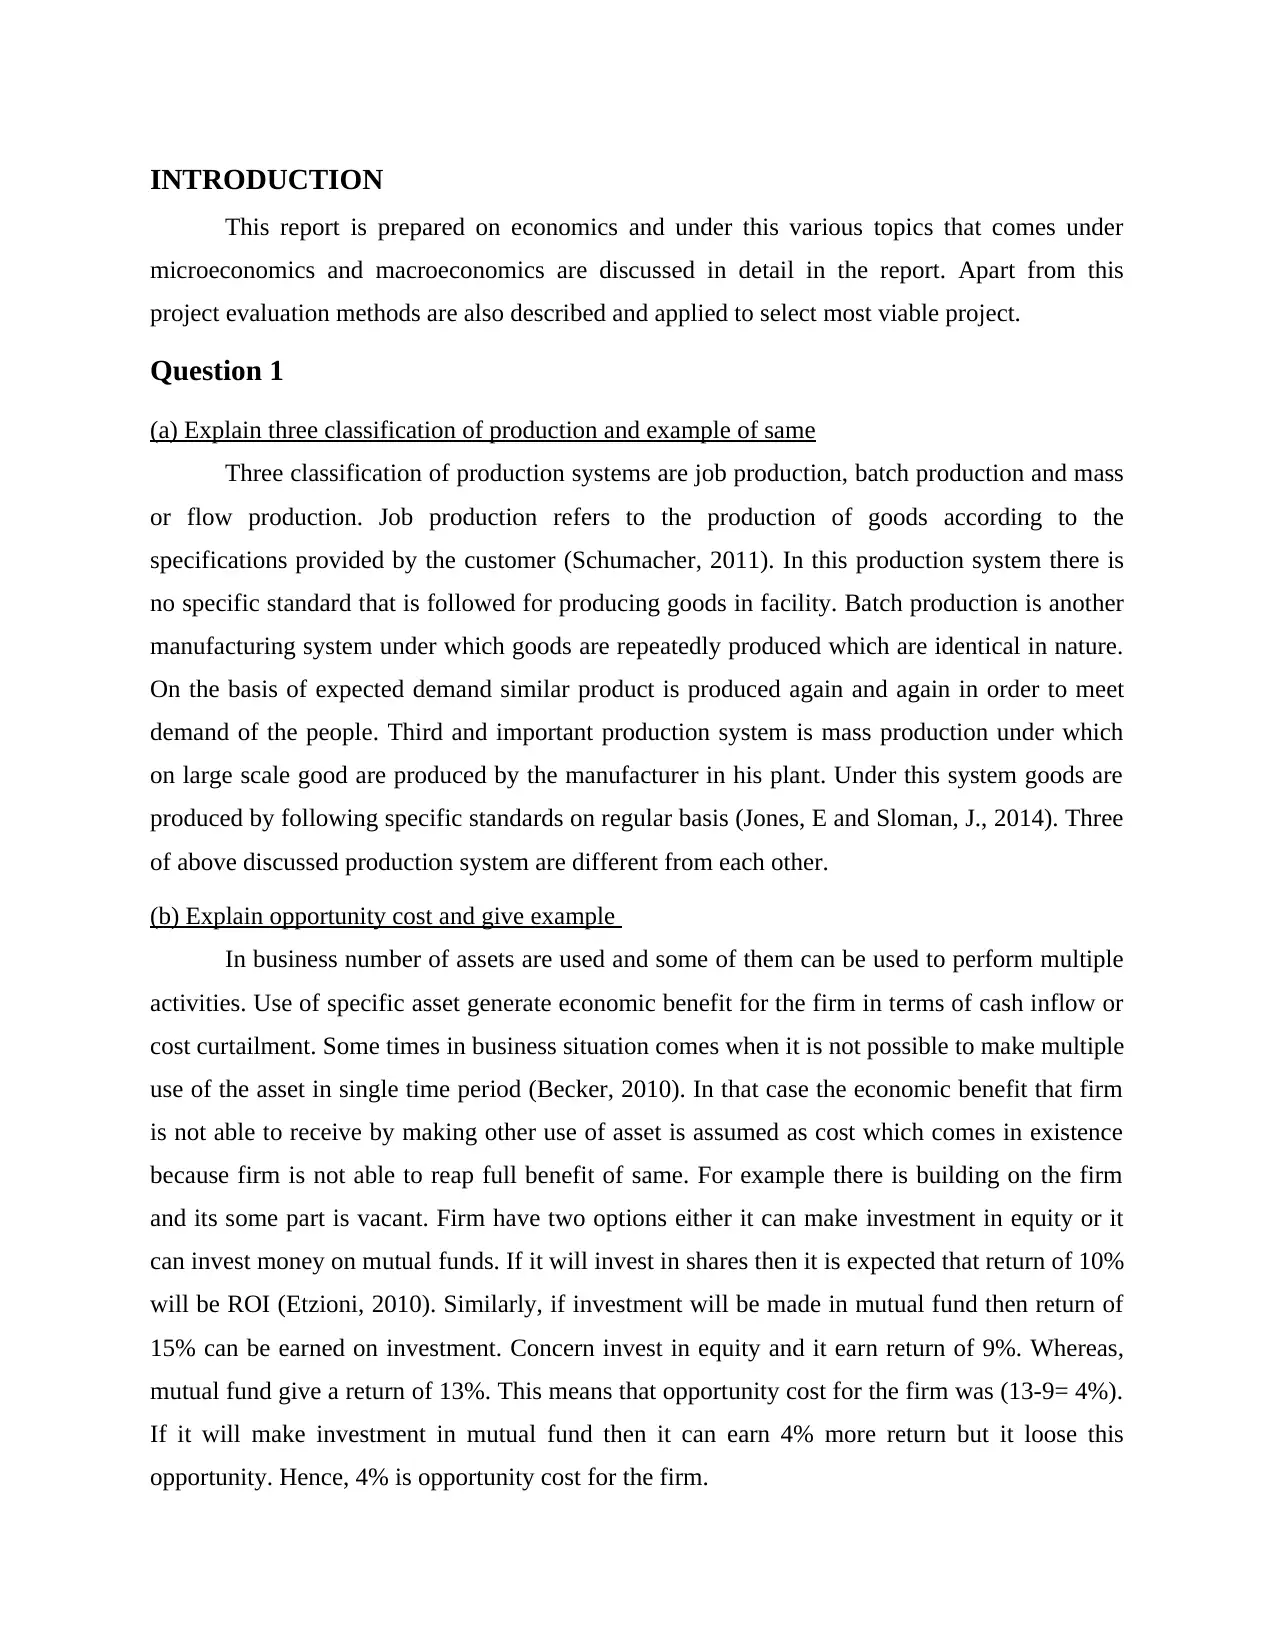
(d) Explanation on demand curve and shift in same
Figure 1 Normal demand curve
(Source: Fortin, Lemieux and Firpo, 2011)
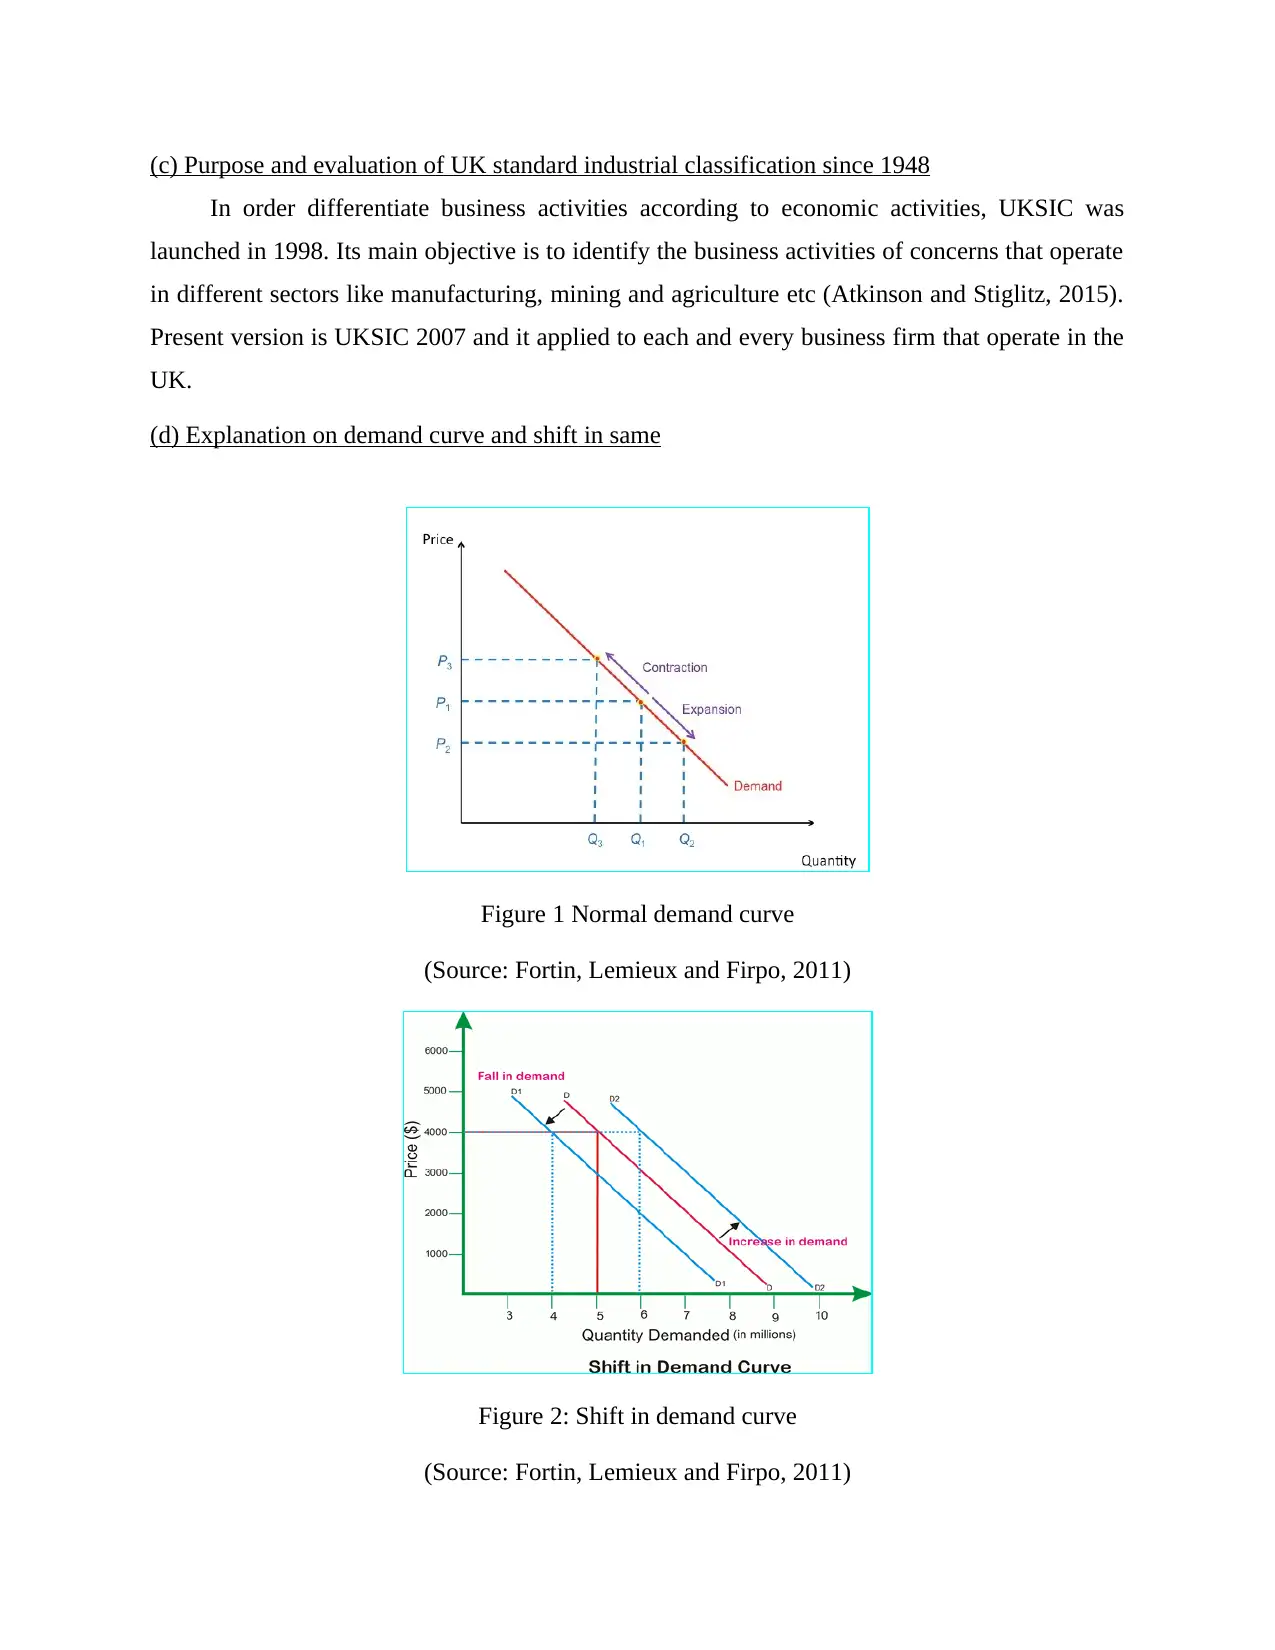
Figure 2: Shift in demand curve
(Source: Fortin, Lemieux and Firpo, 2011)
In order differentiate business activities according to economic activities, UKSIC was
launched in 1998. Its main objective is to identify the business activities of concerns that operate
in different sectors like manufacturing, mining and agriculture etc (Atkinson and Stiglitz, 2015).
Present version is UKSIC 2007 and it applied to each and every business firm that operate in the
UK.
(d) Explanation on demand curve and shift in same
Figure 1 Normal demand curve
(Source: Fortin, Lemieux and Firpo, 2011)
Figure 2: Shift in demand curve
(Source: Fortin, Lemieux and Firpo, 2011)
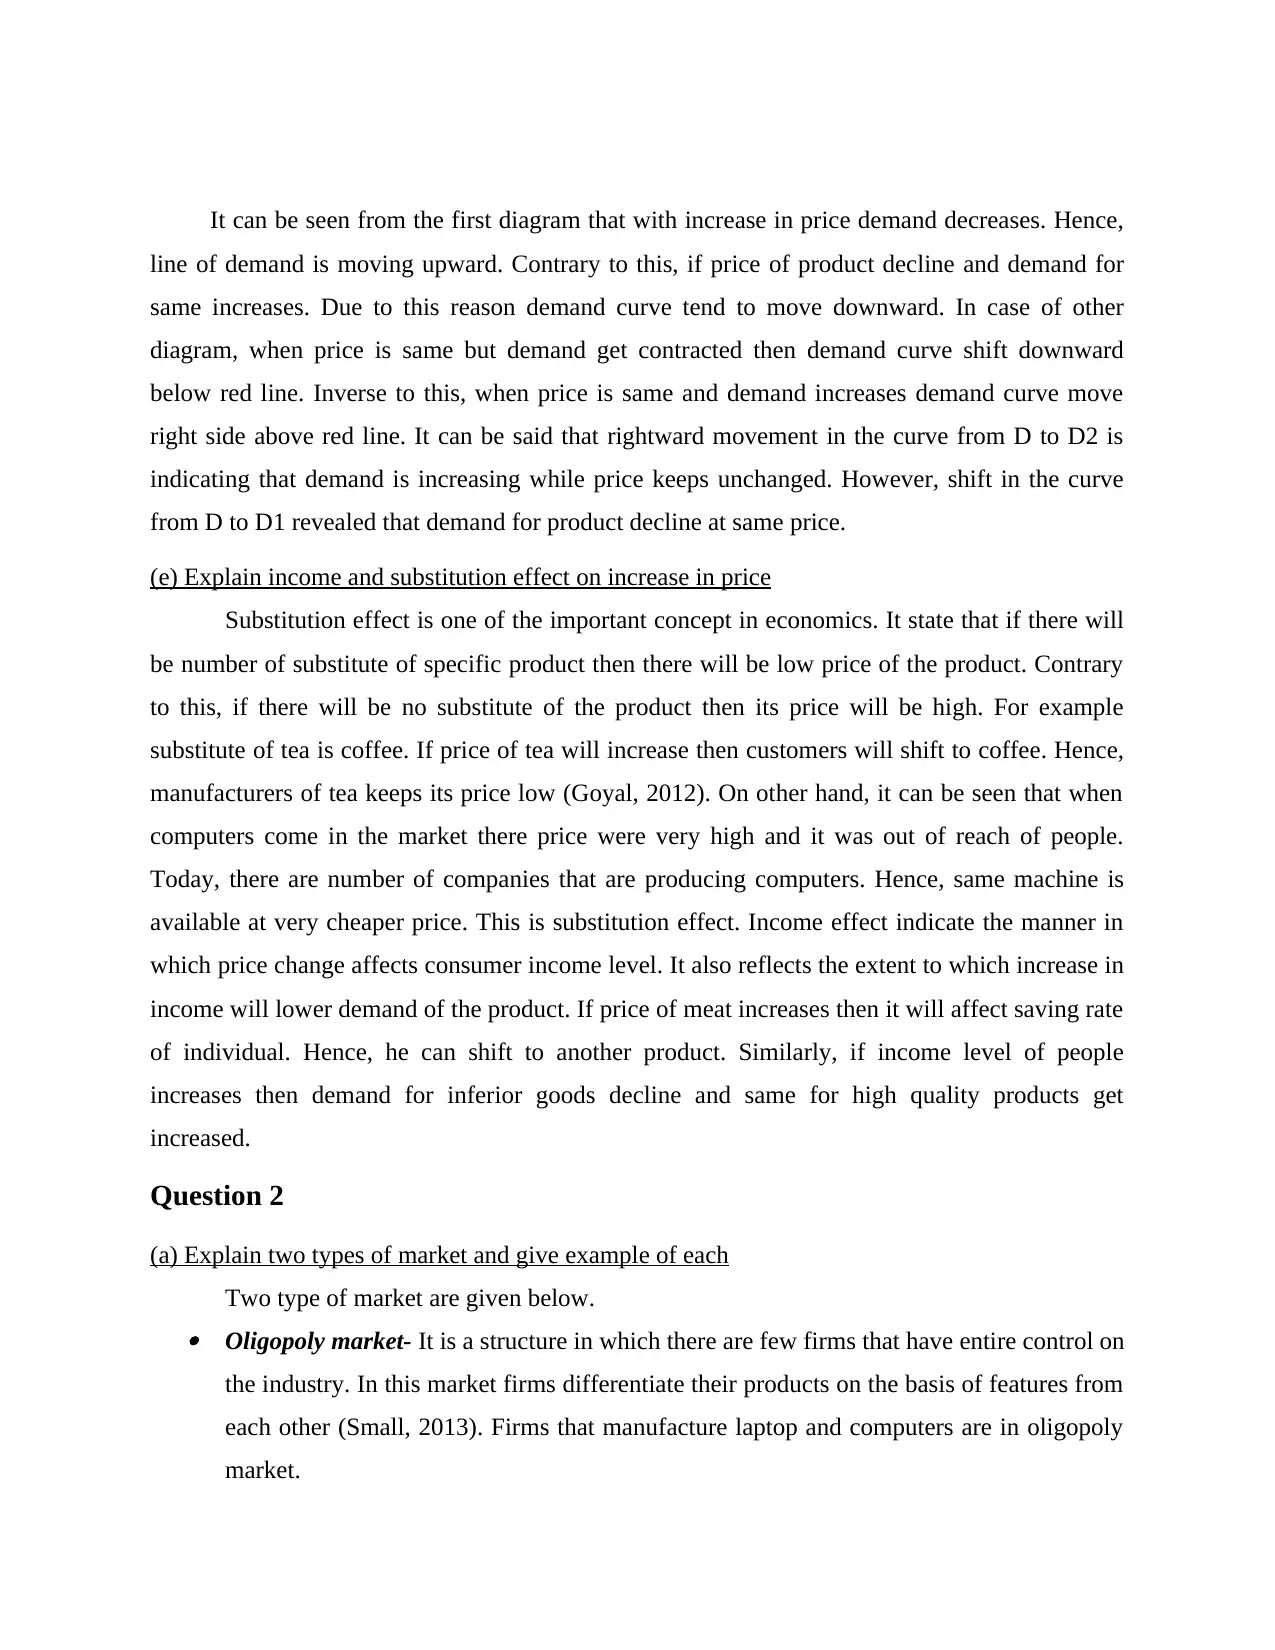
It can be seen from the first diagram that with increase in price demand decreases. Hence,
line of demand is moving upward. Contrary to this, if price of product decline and demand for
same increases. Due to this reason demand curve tend to move downward. In case of other
diagram, when price is same but demand get contracted then demand curve shift downward
below red line. Inverse to this, when price is same and demand increases demand curve move
right side above red line. It can be said that rightward movement in the curve from D to D2 is
indicating that demand is increasing while price keeps unchanged. However, shift in the curve
from D to D1 revealed that demand for product decline at same price.
(e) Explain income and substitution effect on increase in price
Substitution effect is one of the important concept in economics. It state that if there will
be number of substitute of specific product then there will be low price of the product. Contrary
to this, if there will be no substitute of the product then its price will be high. For example
substitute of tea is coffee. If price of tea will increase then customers will shift to coffee. Hence,
manufacturers of tea keeps its price low (Goyal, 2012). On other hand, it can be seen that when
computers come in the market there price were very high and it was out of reach of people.
Today, there are number of companies that are producing computers. Hence, same machine is
available at very cheaper price. This is substitution effect. Income effect indicate the manner in
which price change affects consumer income level. It also reflects the extent to which increase in
income will lower demand of the product. If price of meat increases then it will affect saving rate
of individual. Hence, he can shift to another product. Similarly, if income level of people
increases then demand for inferior goods decline and same for high quality products get
increased.
Question 2
(a) Explain two types of market and give example of each
Two type of market are given below. Oligopoly market- It is a structure in which there are few firms that have entire control on
the industry. In this market firms differentiate their products on the basis of features from
each other (Small, 2013). Firms that manufacture laptop and computers are in oligopoly
market.
⊘ This is a preview!⊘
Do you want full access?
Subscribe today to unlock all pages.
Trusted by 1+ million students worldwide
Perfect market- In this type of market there are number of sellers and they offer similar
products to the customers. Hence, it is very difficult for firms to retain customers.
Company's operating in FMCG sector are in perfect market.
(b) Define public goods and give examples
Public goods refers to all those commodities that are provided to the people by the
government or local authorities. Public fireworks and light houses are the example of public
goods. Government time to time by making use of amount that is kept aside under public
expenditure makes heavy investment on developing infrastructure which will provide number of
facilities to the people (Fortin, Lemieux and Firpo, 2011). Public expenditure is heavily made
when economy is recession and struggling for growth. In countries like India government spend
heavy amount on public goods.
(c) Three ways in which government intervene in the market with example
Three ways in which government interfere in the market are given below. Formation of rules and regulations- By preparing rules and regulations government
intervene in the market. Government of the nation prepare new rules and regulations
related to the industry that govern business operations of the firm. In this mentioned
entity enter in the market (Black, Hashimzade and Myles, 2012). Monetary policy- When there is less money in the market government enter in to market.
It is a policy by using which liquidity is controlled in the market. By increasing or
reducing cash reserve ratio central bank reduce or increase money supply in the economy.
By making changes in these rates central bank bring economy on track and in this way it
interfere in the market.
Fiscal policy- By implementing fiscal policy government reduce tax and promote public
expenditure in the economy (Kneese, Ayres andArge, 2015). Under this under PPP model
public private partnership government and private firms in collaboration carry out
projects. This is third way in which government enter in to market.
Paraphrase This Document
Need a fresh take? Get an instant paraphrase of this document with our AI Paraphraser
(d) Four macroeconomic policy objectives that are pursued by the government
Four macroeconomic policy objectives that are pursued by the government are given
below. Full employment- Increasing employment opportunity is the one of the main objective of
macroeconomic policies. By using same government increase availability of loan and
promote people to open there business (Stiglitz and et.al., 2013). If required public
expenditure is also done to elevate employment level. Price stability- By making changes in interest rates government try to control inflation
rate. By reducing mentioned rate and maintaining same at specific level central bank
bring stability in product prices. Balance of payment- By bringing changes in macroeconomic policies government
increase export relative to import. By doing so it bring BOP in surplus and increase
foreign exchange reserved.
Fair distribution of income- This is another main objective of central bank and by using
policies income is distributed fairly among different groups.
(e) Explain circular flow of income
There are three components of circular flow of income which are inner flow, withdrawal
and injections. Inner flow refers to the exchange of money internally in economy. There must be
balance between withdraw and injection (Benería, Berik and Floro, 2015). If there will not be
balance then downturn is observed in the economy. Withdraw refers to the taking out savings
from bank and taxation payment to the government etc. Injection refers to elevation in
investment and high governmental etc. If there will be excessive injection then money supply
increase which lead to inflation in economy. Similarly, if there will be excessive withdrawal the
saving will reduce and deflation will come in existence in economy. Both situations are not good
for economy. Hence, there must be balance in circular floe of economy.
Question 3
(a) Define and give examples on four major areas of finance Corporate finance- It is a part of finance in which concepts related to long term source of
finance are included like share and bonds etc. By using corporate finance various
decisions related to shares and bonds are taken by the firms.
Investment- It is a domain of finance in which concepts related to investment in different
securities are included (Doyle, 2013). Knowledge of these concepts helps investors in
making wise investment decisions. Financial market- This domain of finance help investors in enhancing knowledge about
various types of financial markets like stock market, mutual funds and debt market.
Corporate accounting- In this area which includes various things like forecasting and
preparation of annual accounts etc. It can be said that results produced by corporate
accounting helps in making business decisions.
(b) Determinants of market interest rates and types of risk premium
Market interest rates depend on the rate at which central bank is lending money to banks
and change it made in its cash reserve ratios. It can be said that these are two determinants of the
market interest rates. There are mainly two types of risk premiums namely equity and credit risk
premium (Munda, 2012). Equity risk premium refers to return that an investor can earn after
deducting risk free rate of return from expected return on stock. Contrary to this, credit risk
premium refers to the premium that is paid to investors for making investment in US treasury
bonds (Lehrich, 2016).
(c) Explanation on four basic financial statements including formats and purpose Income statement- It is a statement and main purpose is to compute income earned and
expenses made by the firm in its business. It finally reveal the net profit that is earned by
the firm in its business. Balance sheet- It is a statement and main purpose of preparing it is to measure the
financial position of the firm at end of the year. By using balance sheet ratios are
computed and performance of firm is measured. Cash flow statement- It is a financial statement that reflect the cash inflow and outflow
that is happening in the operating, investing and financing activity of the business Mark
& Spencer (King, 2016). On the basis of these activities finally this statement reflect
value of cash and its equivalents that remain at end of the year.
Fund flow statement- It is statement whose main purpose is to indicate sources from
which funds are raised and places where same is invested. Hence, it is one of important
financial statement used by business firms.
⊘ This is a preview!⊘
Do you want full access?
Subscribe today to unlock all pages.
Trusted by 1+ million students worldwide
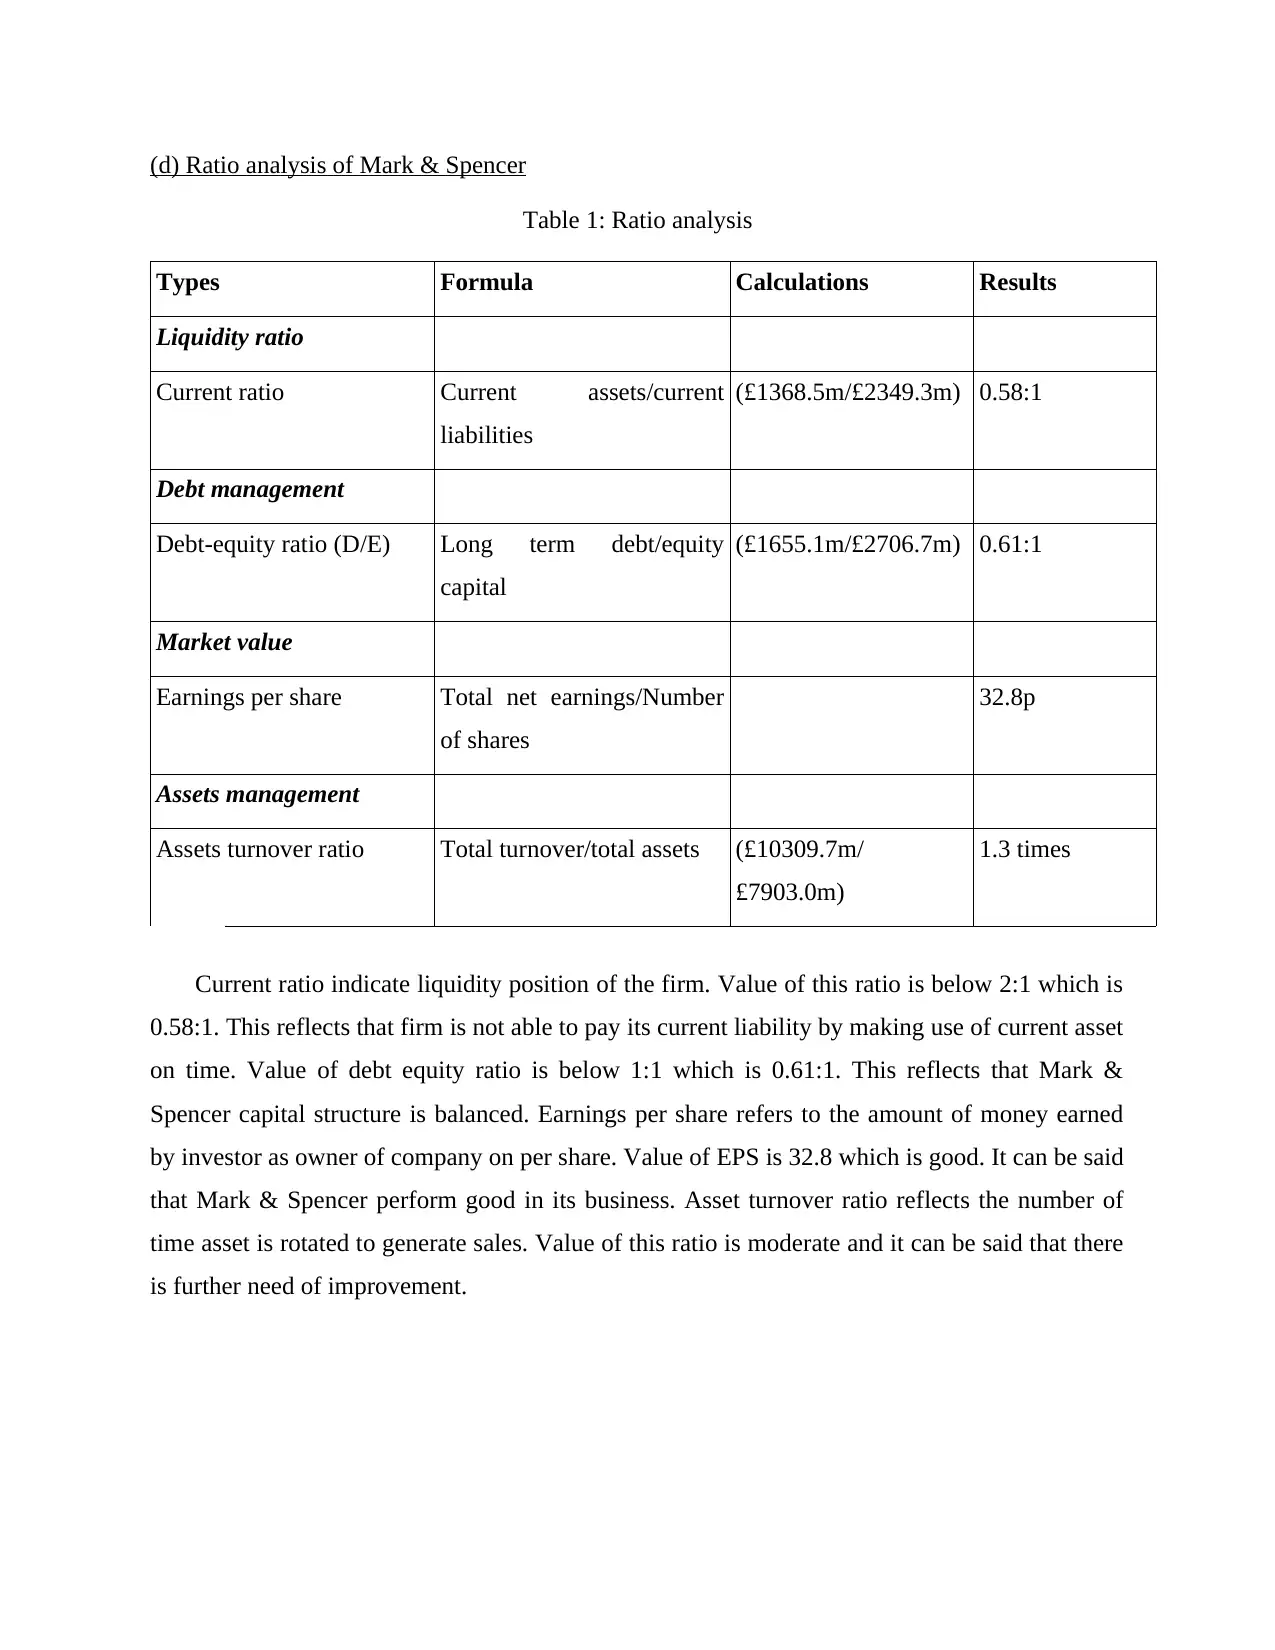
(d) Ratio analysis of Mark & Spencer
Table 1: Ratio analysis
Types Formula Calculations Results
Liquidity ratio
Current ratio Current assets/current
liabilities
(£1368.5m/£2349.3m) 0.58:1
Debt management
Debt-equity ratio (D/E) Long term debt/equity
capital
(£1655.1m/£2706.7m) 0.61:1
Market value
Earnings per share Total net earnings/Number
of shares
32.8p
Assets management
Assets turnover ratio Total turnover/total assets (£10309.7m/
£7903.0m)
1.3 times
Current ratio indicate liquidity position of the firm. Value of this ratio is below 2:1 which is
0.58:1. This reflects that firm is not able to pay its current liability by making use of current asset
on time. Value of debt equity ratio is below 1:1 which is 0.61:1. This reflects that Mark &
Spencer capital structure is balanced. Earnings per share refers to the amount of money earned
by investor as owner of company on per share. Value of EPS is 32.8 which is good. It can be said
that Mark & Spencer perform good in its business. Asset turnover ratio reflects the number of
time asset is rotated to generate sales. Value of this ratio is moderate and it can be said that there
is further need of improvement.
Paraphrase This Document
Need a fresh take? Get an instant paraphrase of this document with our AI Paraphraser
Question 4
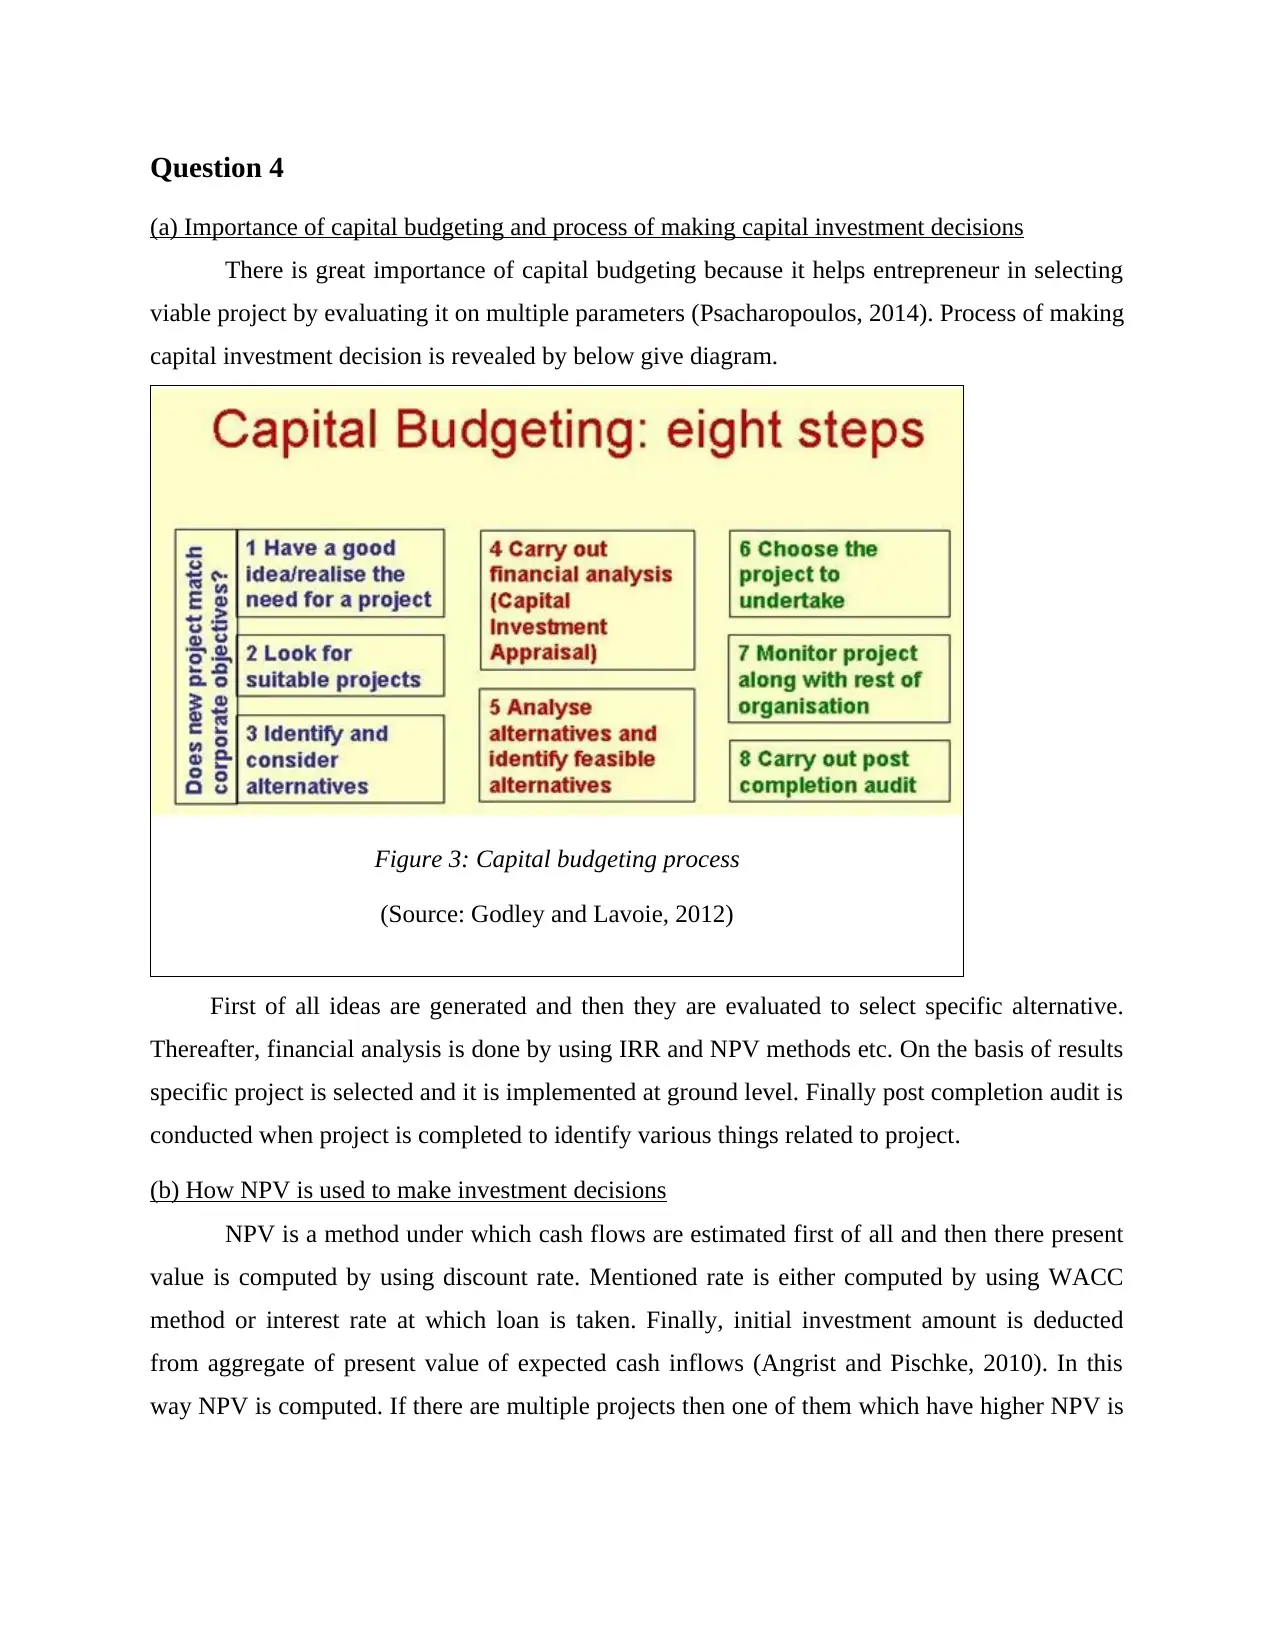
(a) Importance of capital budgeting and process of making capital investment decisions
There is great importance of capital budgeting because it helps entrepreneur in selecting
viable project by evaluating it on multiple parameters (Psacharopoulos, 2014). Process of making
capital investment decision is revealed by below give diagram.
Figure 3: Capital budgeting process
(Source: Godley and Lavoie, 2012)
First of all ideas are generated and then they are evaluated to select specific alternative.
Thereafter, financial analysis is done by using IRR and NPV methods etc. On the basis of results
specific project is selected and it is implemented at ground level. Finally post completion audit is
conducted when project is completed to identify various things related to project.
(b) How NPV is used to make investment decisions
NPV is a method under which cash flows are estimated first of all and then there present
value is computed by using discount rate. Mentioned rate is either computed by using WACC
method or interest rate at which loan is taken. Finally, initial investment amount is deducted
from aggregate of present value of expected cash inflows (Angrist and Pischke, 2010). In this
way NPV is computed. If there are multiple projects then one of them which have higher NPV is
picked by the Mark & Spencer. Contrary to this, if there is single project then by comparing its
NPV with standard value investment related decisions are taken by the firm.
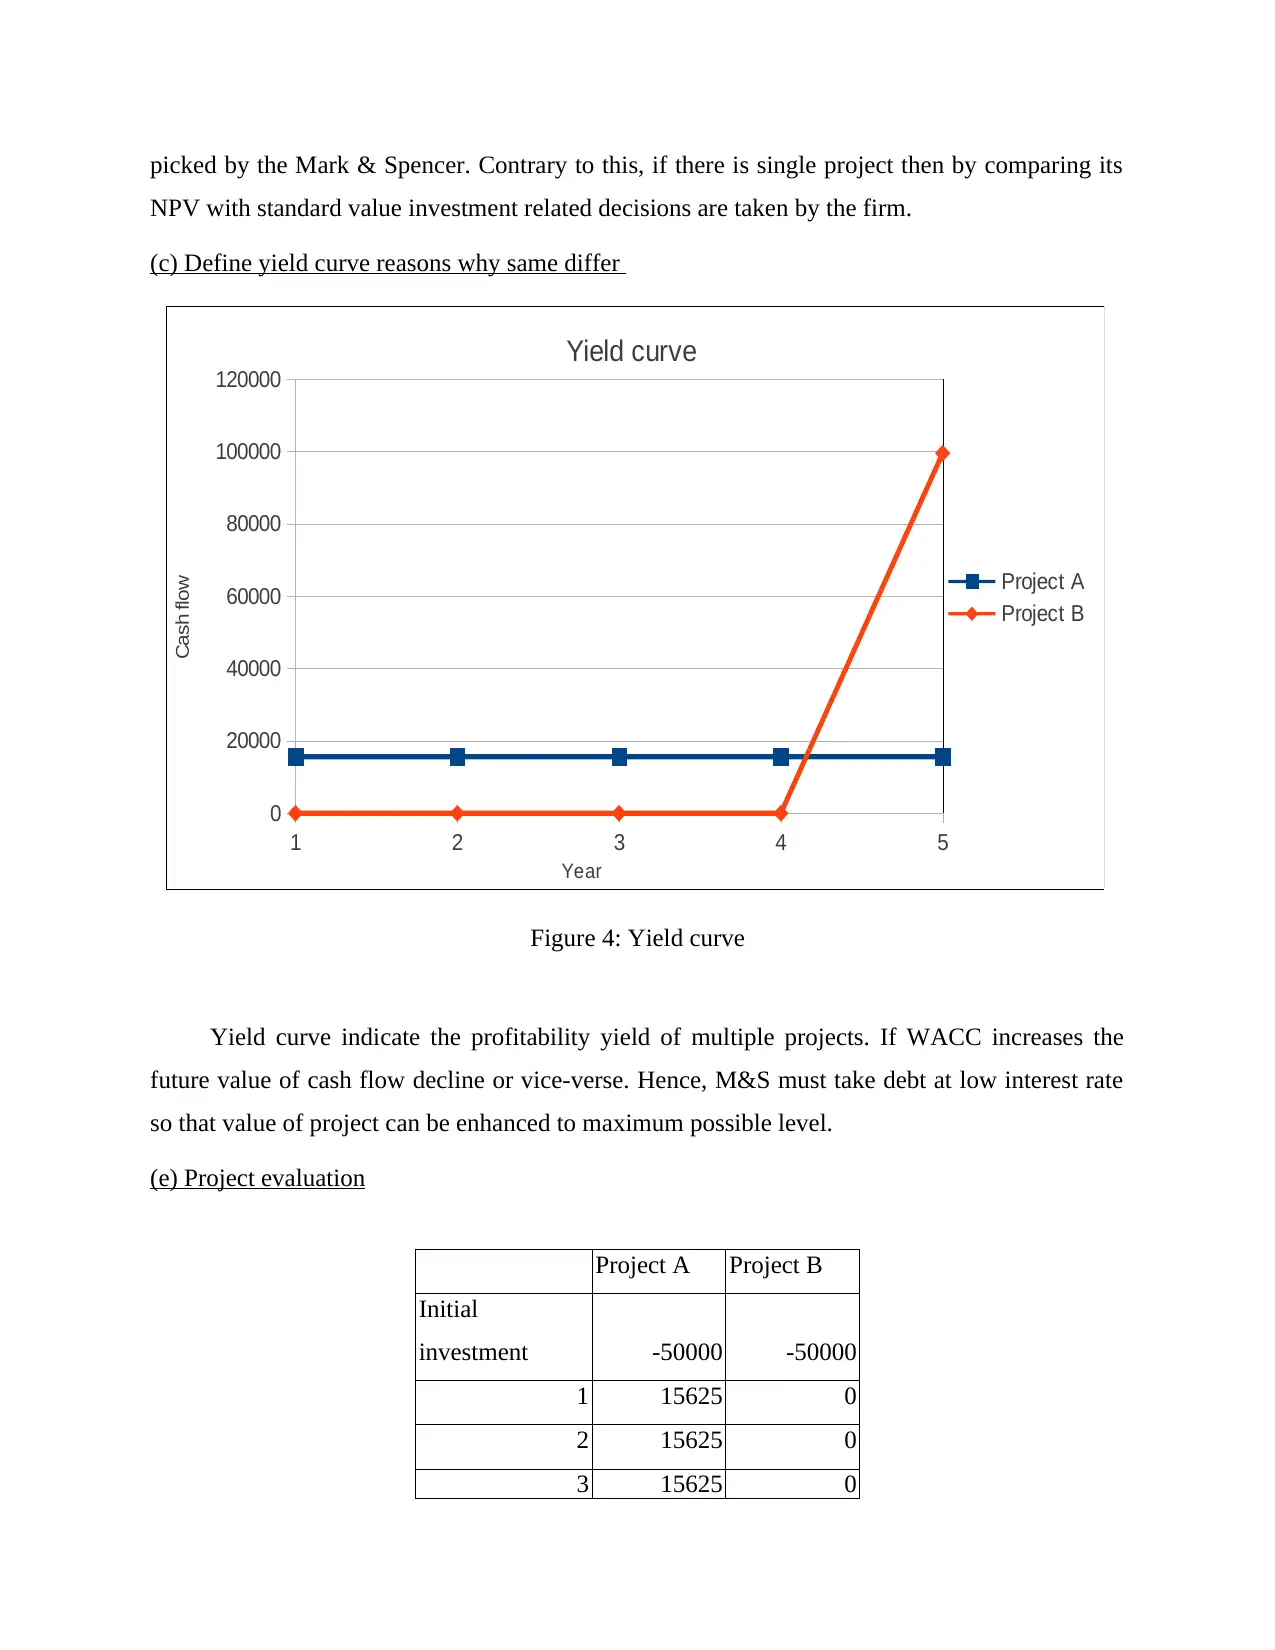
(c) Define yield curve reasons why same differ
Yield curve indicate the profitability yield of multiple projects. If WACC increases the
future value of cash flow decline or vice-verse. Hence, M&S must take debt at low interest rate
so that value of project can be enhanced to maximum possible level.
(e) Project evaluation
Project A Project B
Initial
investment -50000 -50000
1 15625 0
2 15625 0
3 15625 0
1 2 3 4 5
0
20000
40000
60000
80000
100000
120000
Yield curve
Project A
Project B
Year
Cash flow
Figure 4: Yield curve
NPV with standard value investment related decisions are taken by the firm.
(c) Define yield curve reasons why same differ
Yield curve indicate the profitability yield of multiple projects. If WACC increases the
future value of cash flow decline or vice-verse. Hence, M&S must take debt at low interest rate
so that value of project can be enhanced to maximum possible level.
(e) Project evaluation
Project A Project B
Initial
investment -50000 -50000
1 15625 0
2 15625 0
3 15625 0
1 2 3 4 5
0
20000
40000
60000
80000
100000
120000
Yield curve
Project A
Project B
Year
Cash flow
Figure 4: Yield curve
⊘ This is a preview!⊘
Do you want full access?
Subscribe today to unlock all pages.
Trusted by 1+ million students worldwide
1 out of 15
Related Documents


Your All-in-One AI-Powered Toolkit for Academic Success.
+13062052269
info@desklib.com
Available 24*7 on WhatsApp / Email
![[object Object]](/_next/static/media/star-bottom.7253800d.svg)
Unlock your academic potential
Copyright © 2020–2026 A2Z Services. All Rights Reserved. Developed and managed by ZUCOL.