Financial Analysis and Management Enterprise Report - Analysis
VerifiedAdded on 2021/02/19
|22
|5808
|21
Report
AI Summary
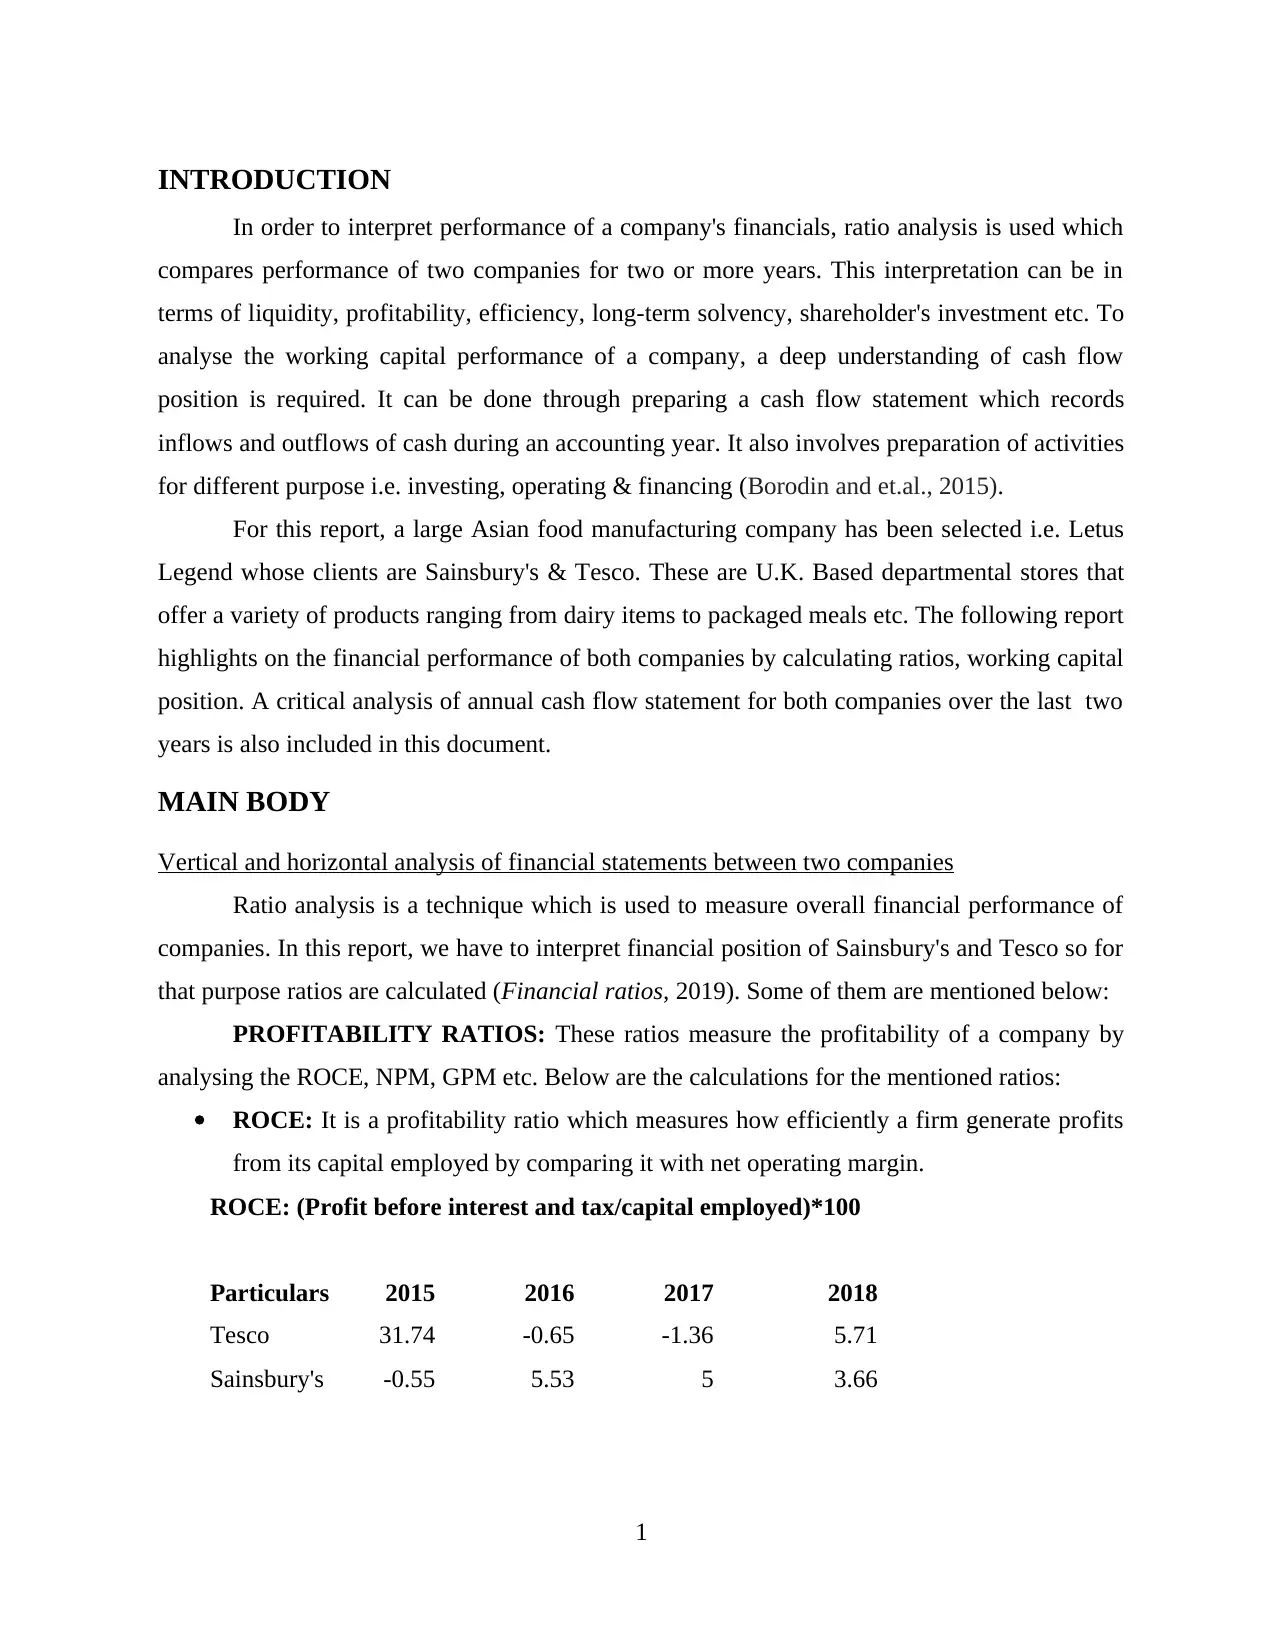
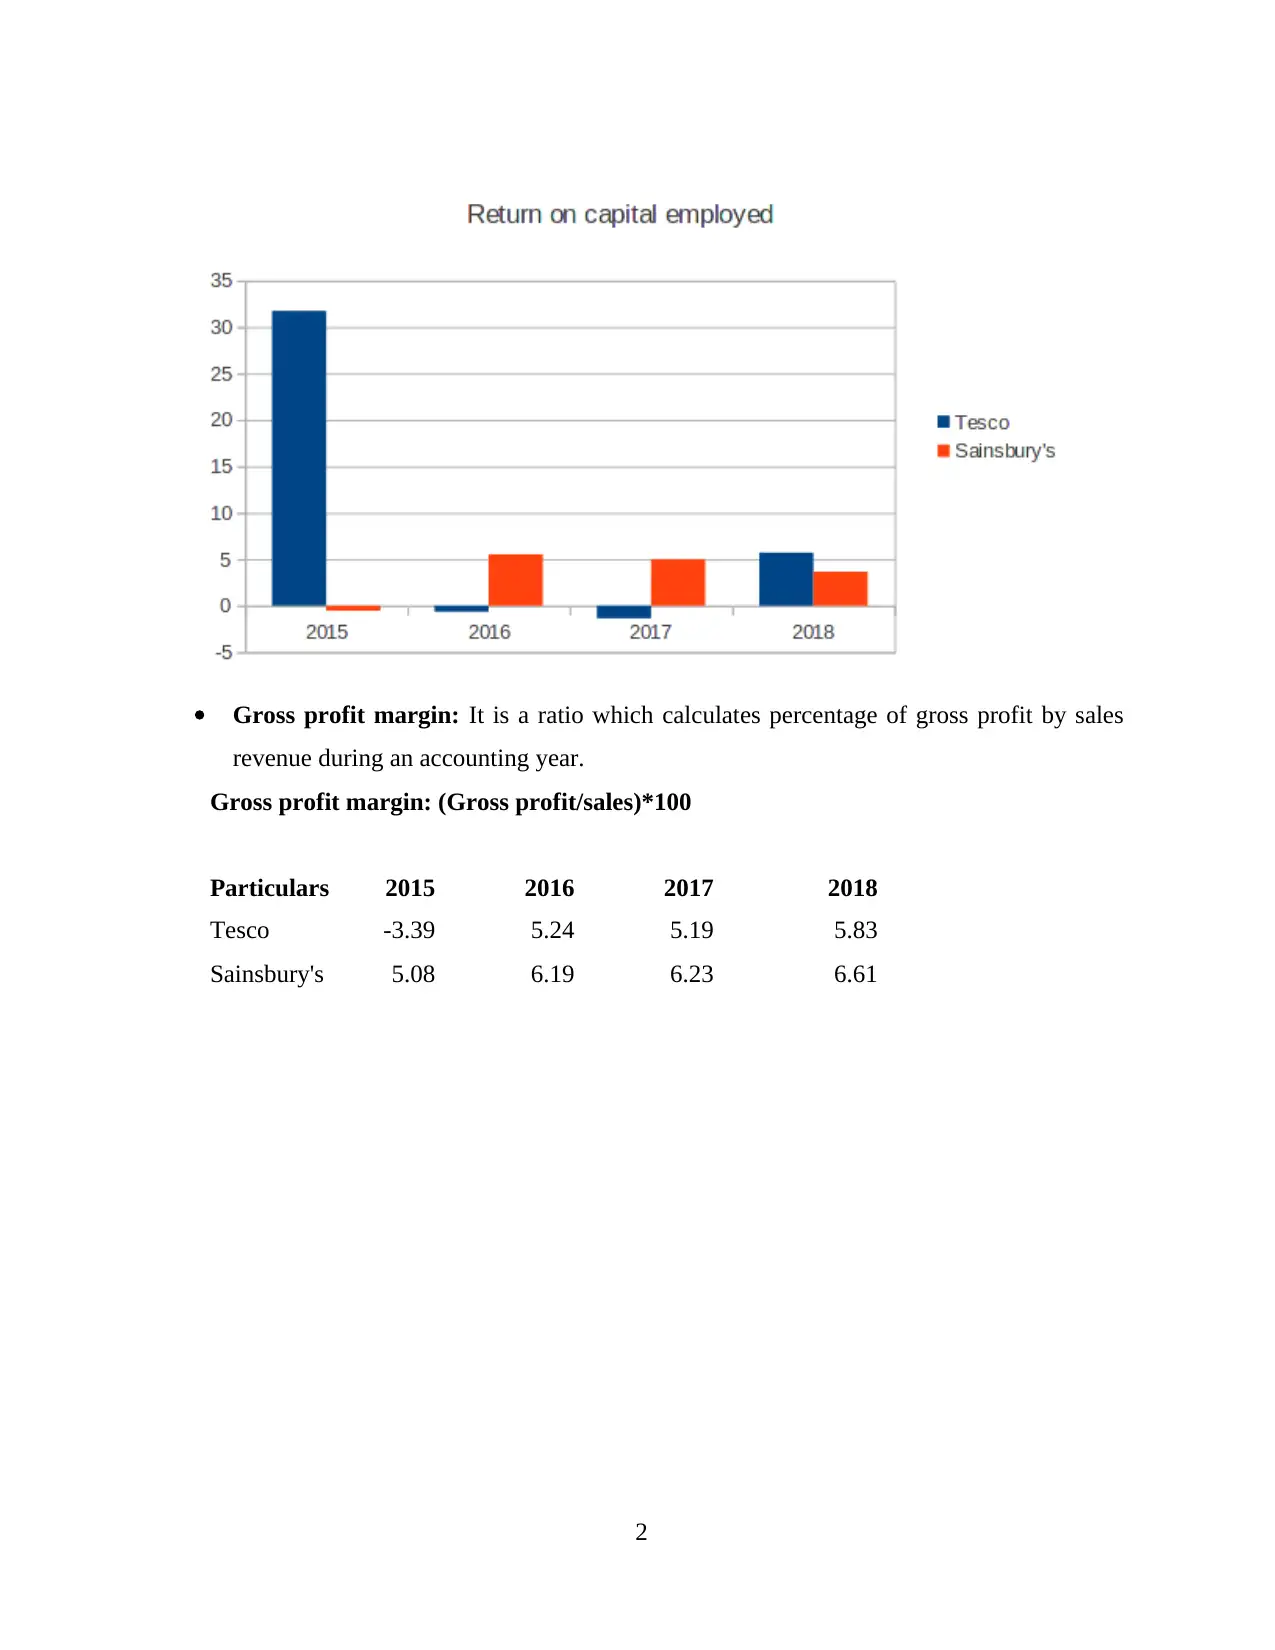
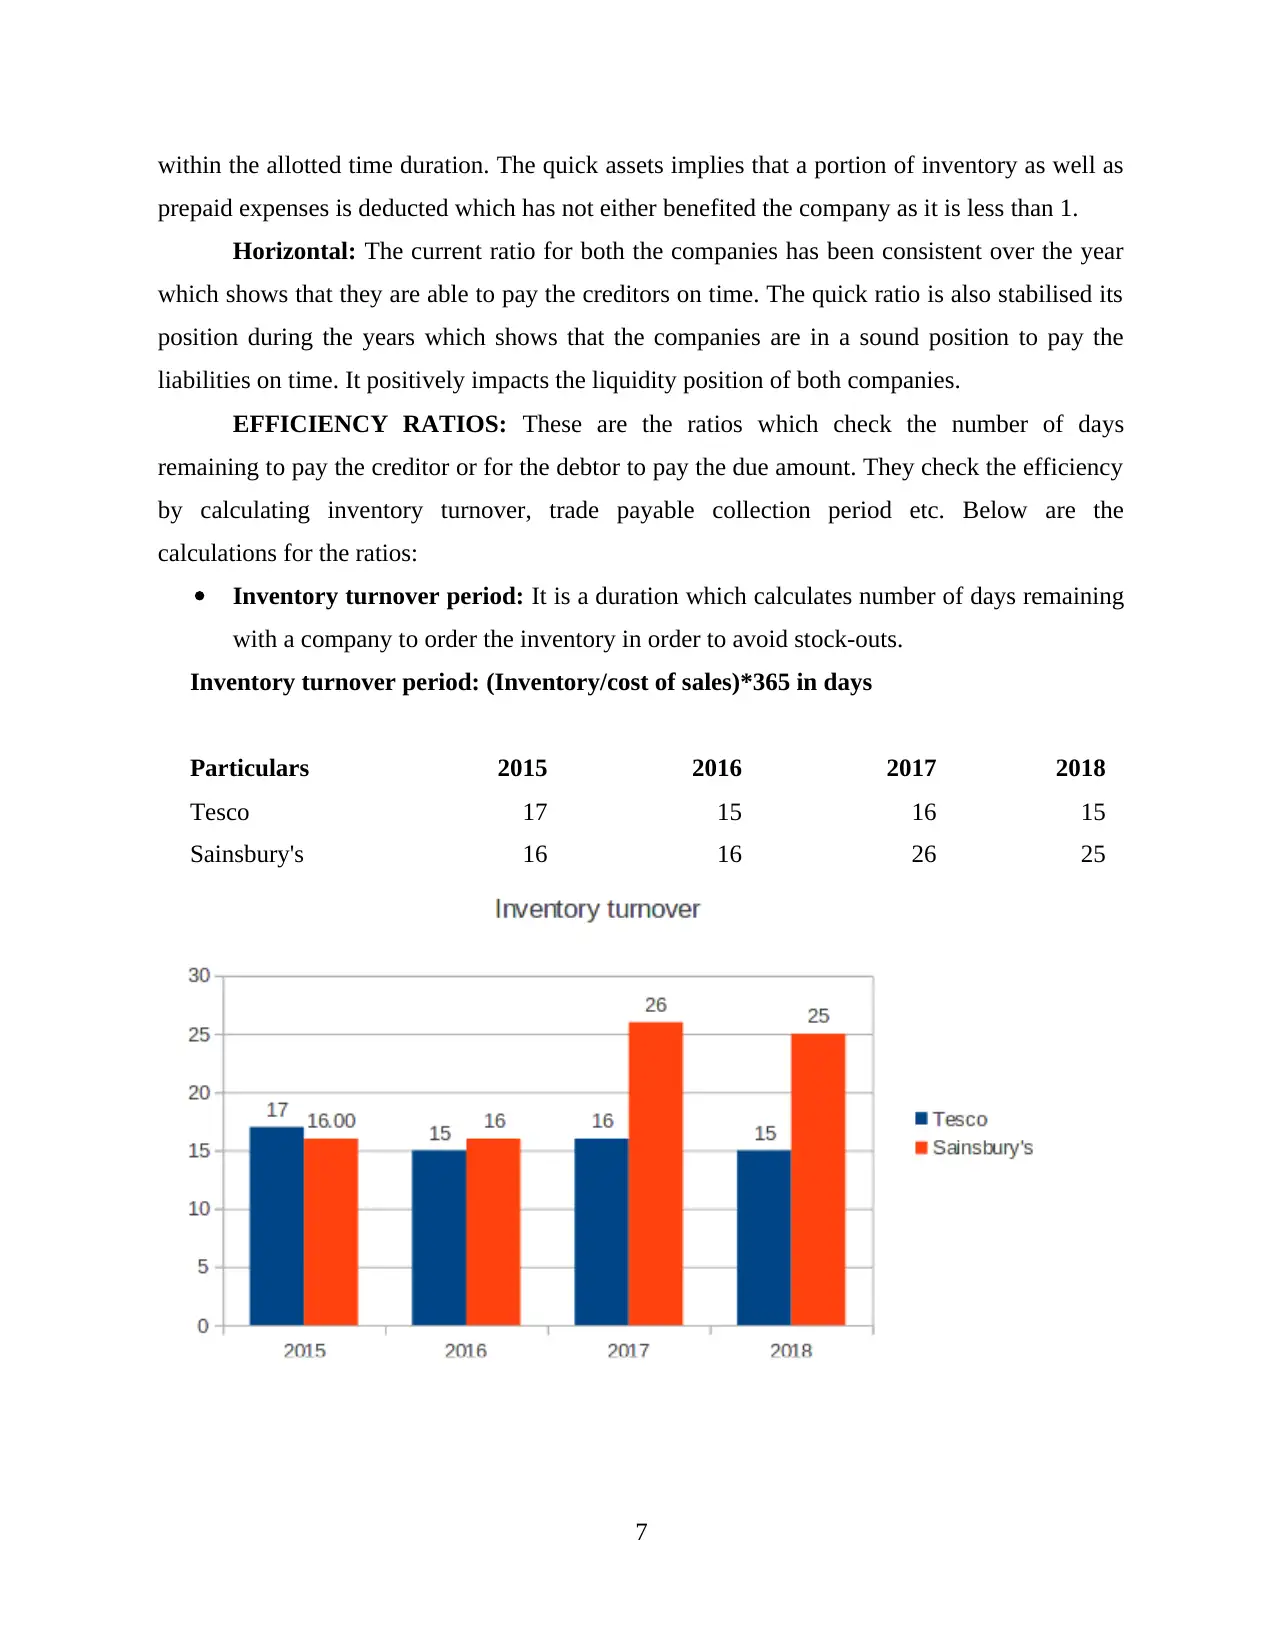
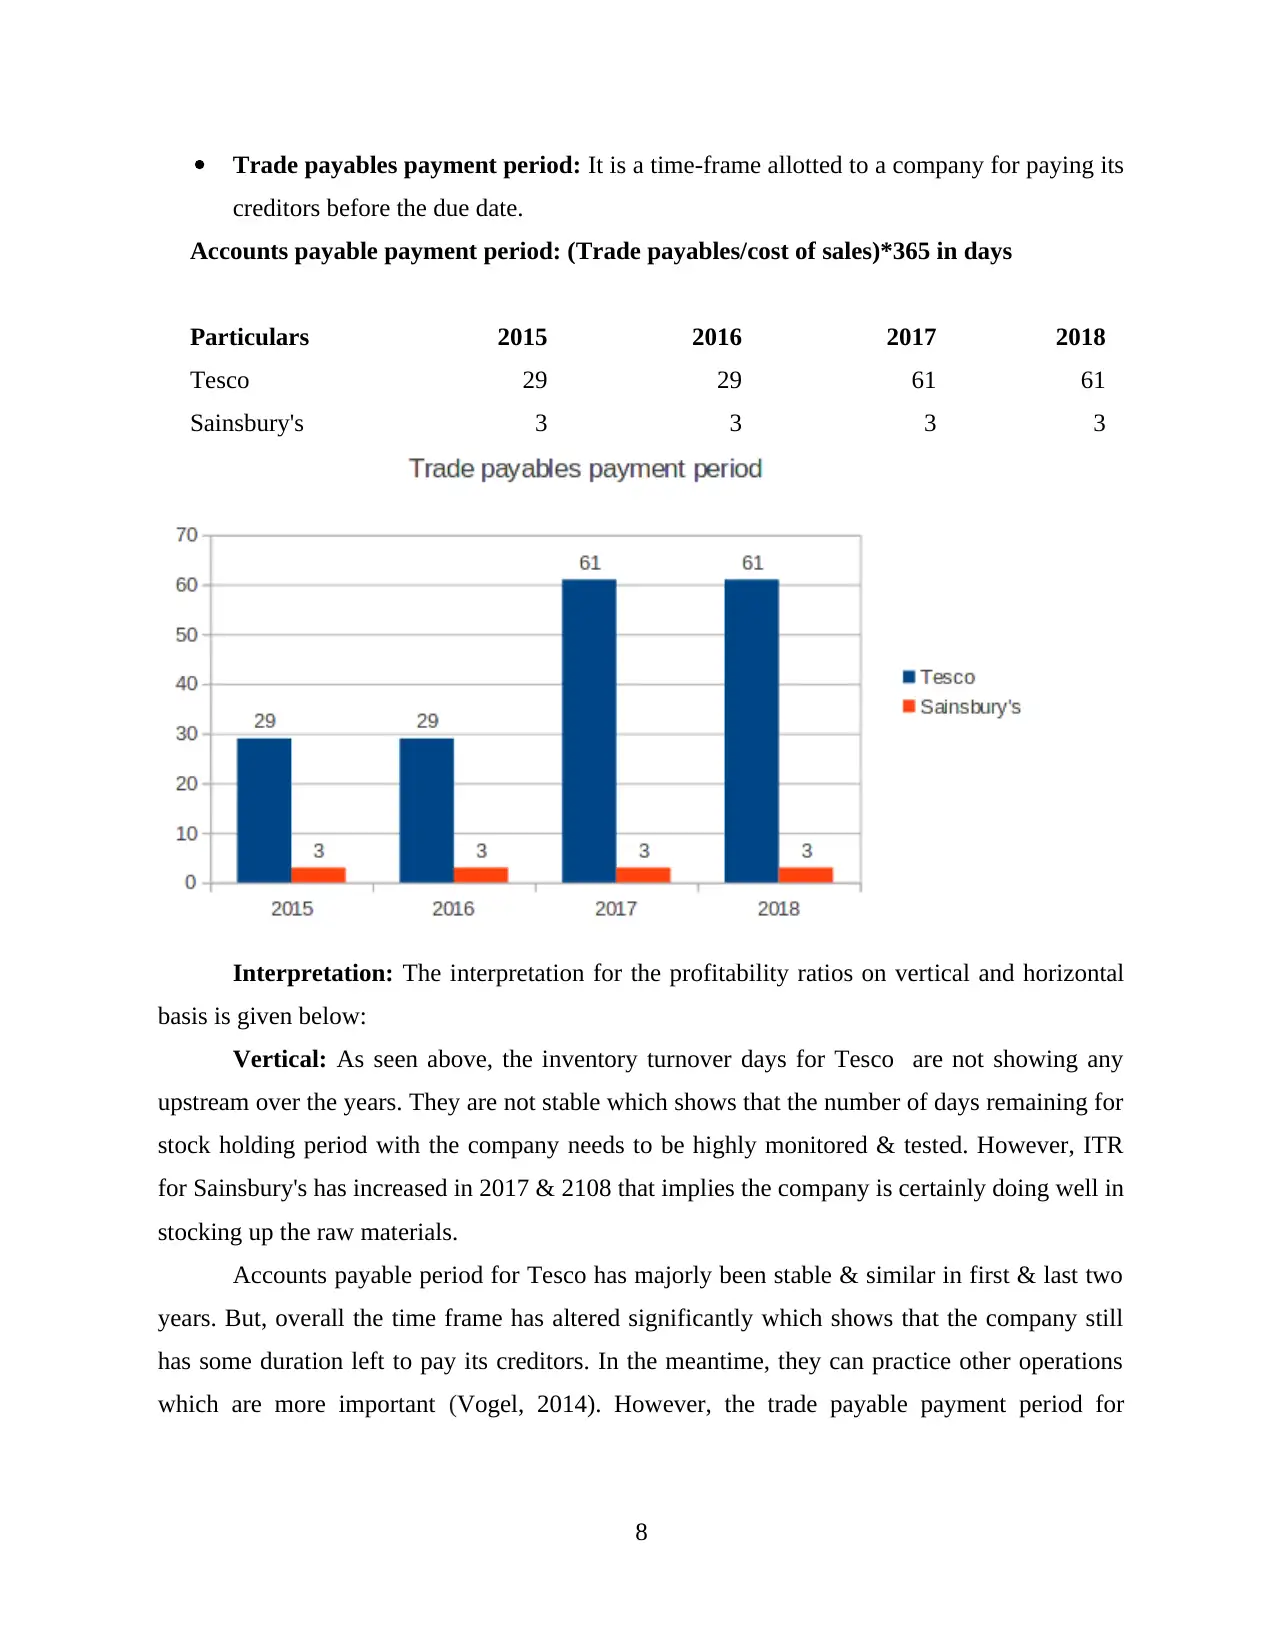
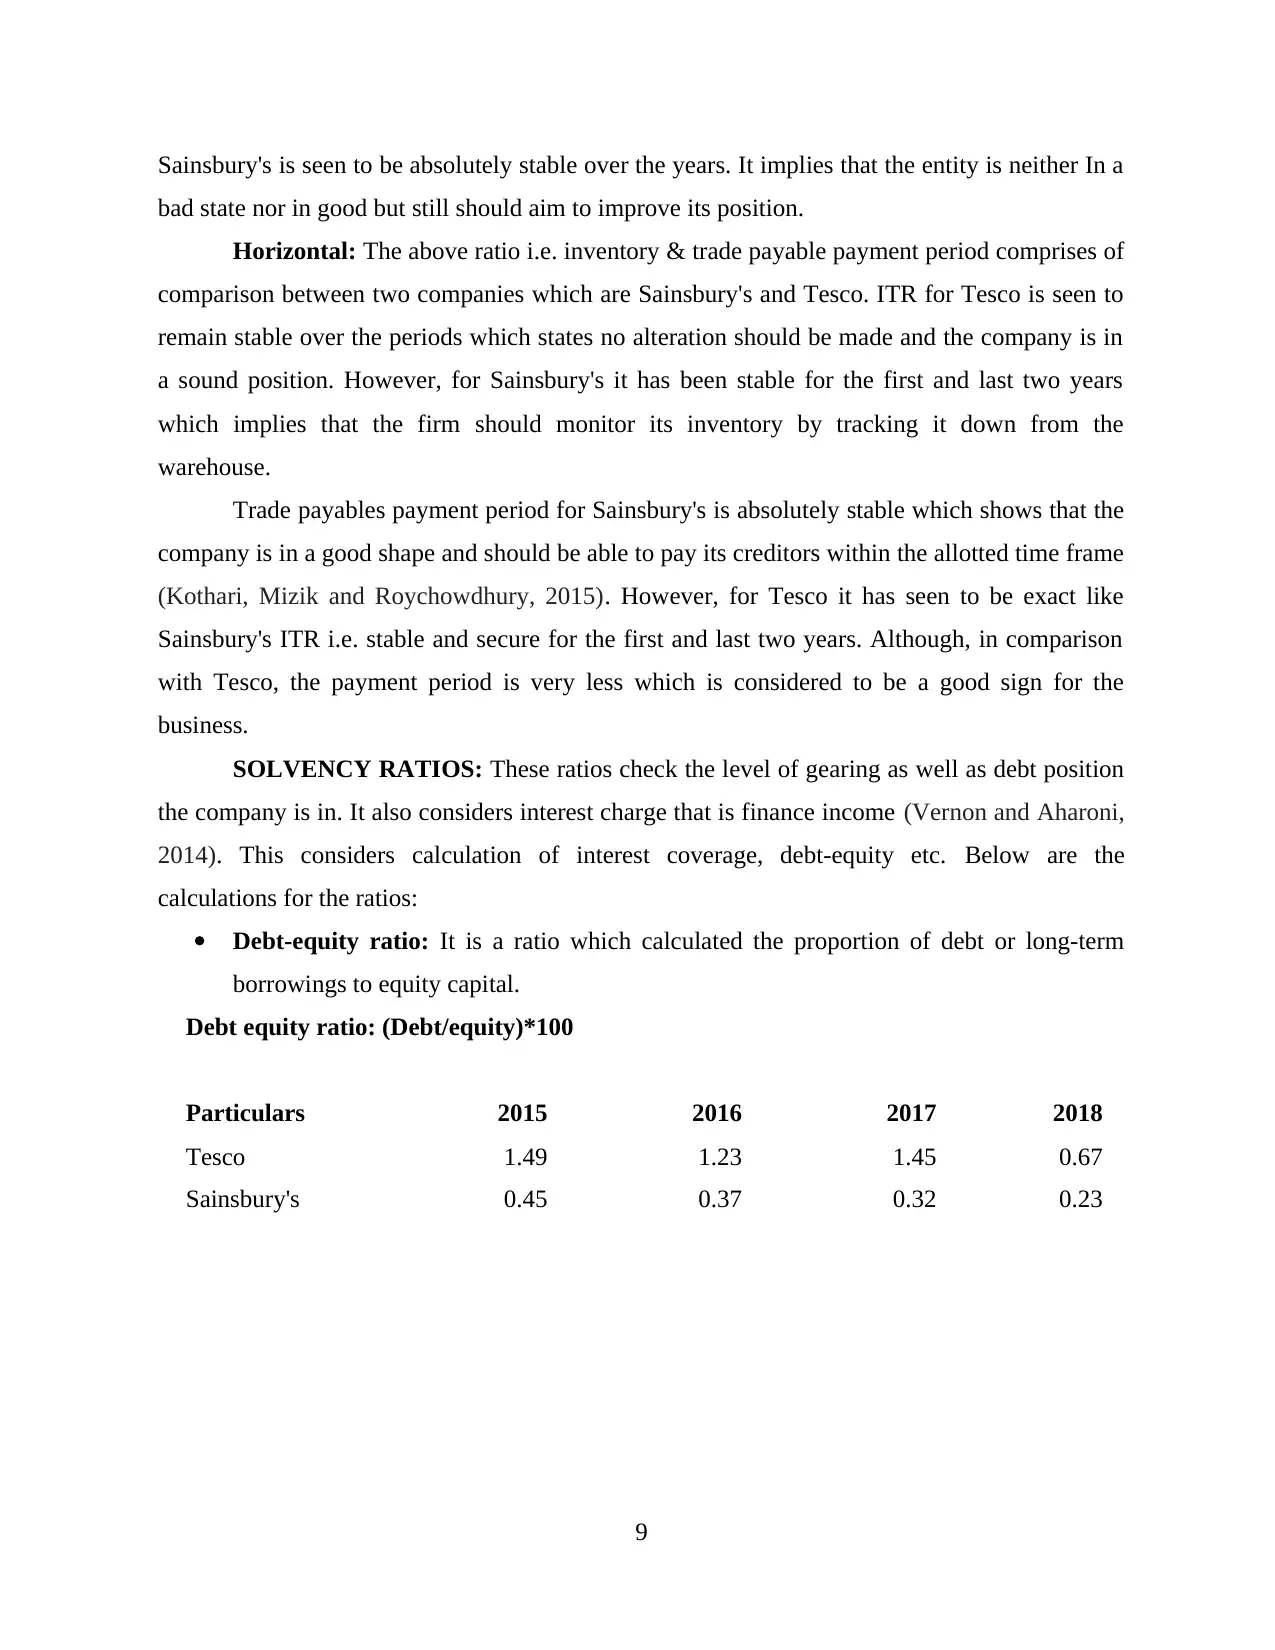
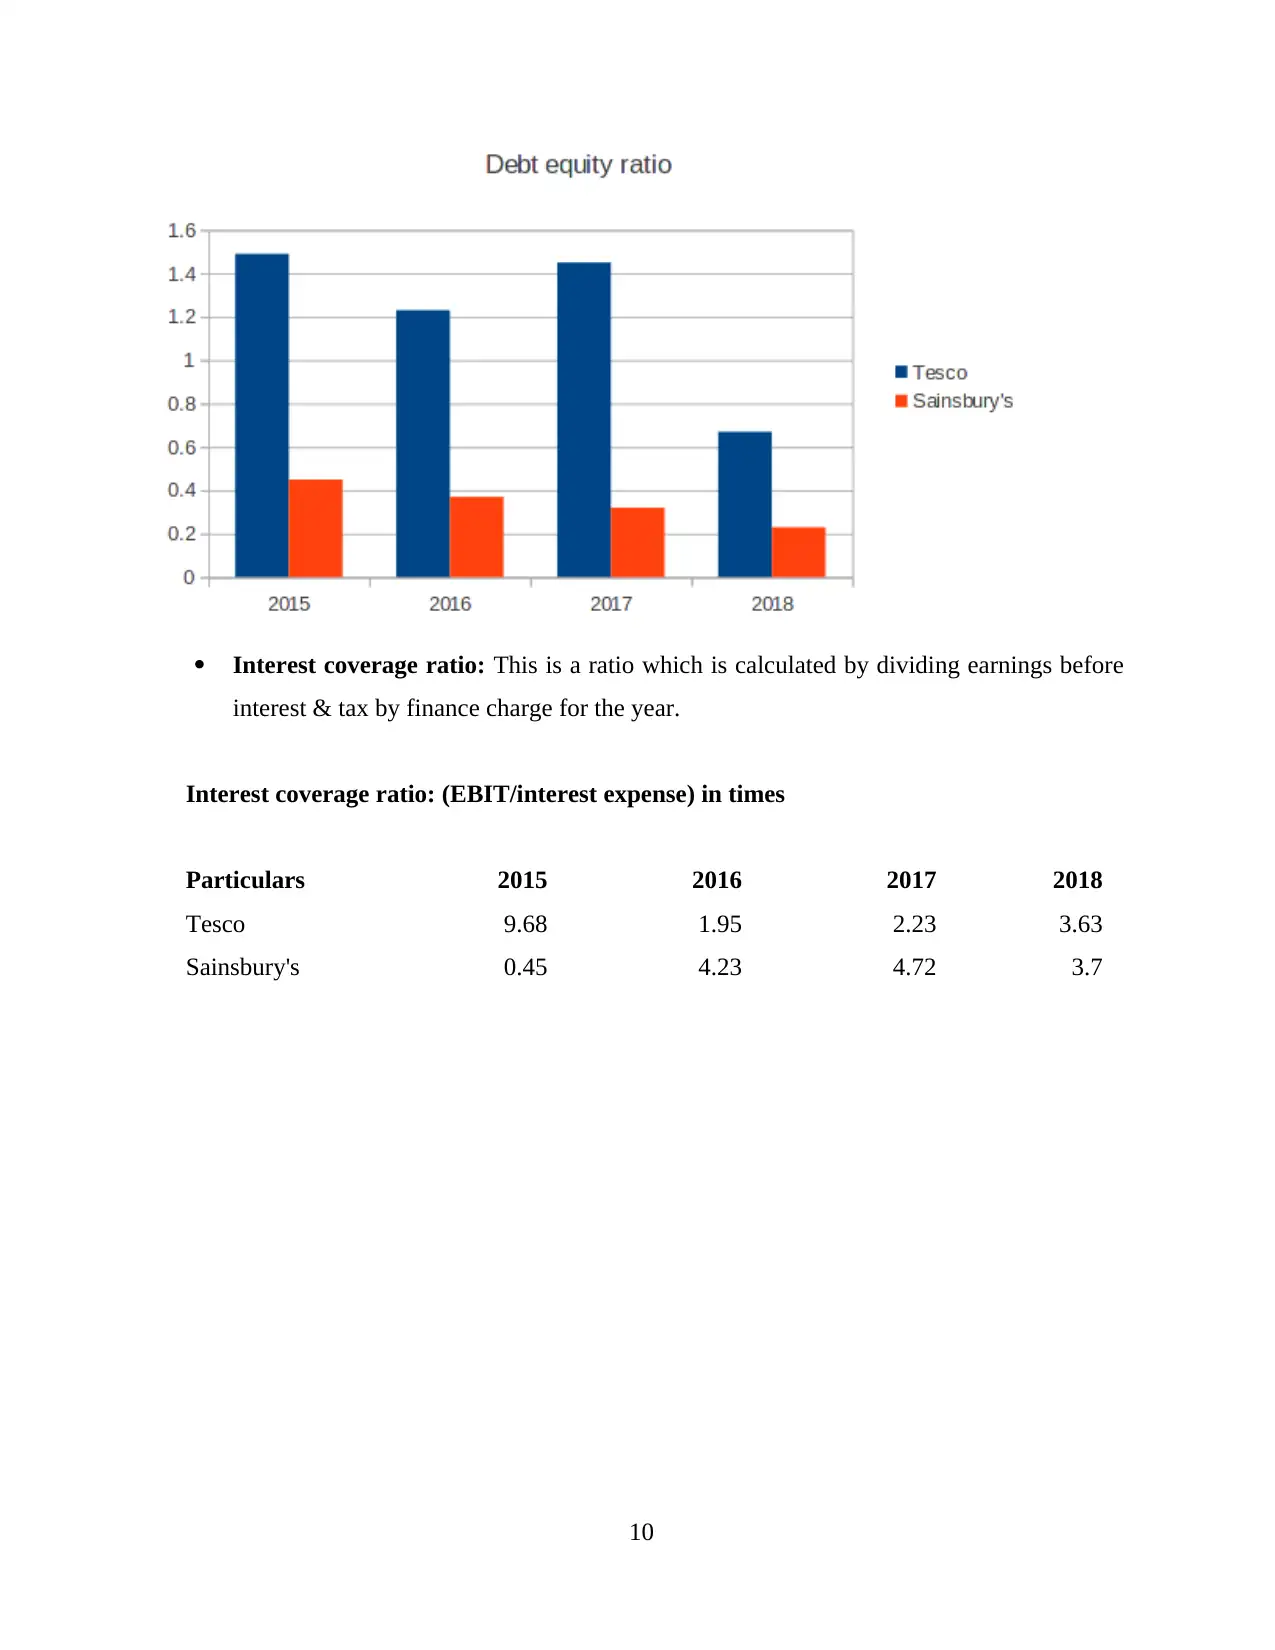
This report presents a financial analysis and management enterprise report, focusing on the comparison of two companies, Tesco and Sainsbury's, through the use of ratio analysis and working capital analysis. The report delves into profitability ratios (ROCE, GPM, NPM), liquidity ratios (current and quick ratios), efficiency ratios (inventory turnover and trade payables payment period), and solvency ratios (debt-equity and interest coverage ratios) to evaluate their financial performance over several years. The analysis includes a vertical and horizontal interpretation of the financial statements, highlighting key trends and providing insights into the companies' financial health. Additionally, the report includes a critical analysis of the cash flow statement, examining the inflows and outflows of cash related to operating, investing, and financing activities. The analysis aims to provide a comprehensive understanding of the companies' financial positions, strengths, and weaknesses, offering valuable information for stakeholders and decision-makers.

Financial analysis and
management enterprise
Paraphrase This Document
Need a fresh take? Get an instant paraphrase of this document with our AI Paraphraser

Table of Contents
INTRODUCTION...........................................................................................................................1
MAIN BODY...................................................................................................................................1
Vertical and horizontal analysis of financial statements between two companies......................1
Importance of working capital analysis.....................................................................................11
Critical analysis of cash flow statement.....................................................................................12
CONCLUSION..............................................................................................................................13
REFERENCES..............................................................................................................................14
APPENDIX....................................................................................................................................15

INTRODUCTION
In order to interpret performance of a company's financials, ratio analysis is used which
compares performance of two companies for two or more years. This interpretation can be in
terms of liquidity, profitability, efficiency, long-term solvency, shareholder's investment etc. To
analyse the working capital performance of a company, a deep understanding of cash flow
position is required. It can be done through preparing a cash flow statement which records
inflows and outflows of cash during an accounting year. It also involves preparation of activities
for different purpose i.e. investing, operating & financing (Borodin and et.al., 2015).
For this report, a large Asian food manufacturing company has been selected i.e. Letus
Legend whose clients are Sainsbury's & Tesco. These are U.K. Based departmental stores that
offer a variety of products ranging from dairy items to packaged meals etc. The following report
highlights on the financial performance of both companies by calculating ratios, working capital
position. A critical analysis of annual cash flow statement for both companies over the last two
years is also included in this document.
MAIN BODY
Vertical and horizontal analysis of financial statements between two companies
Ratio analysis is a technique which is used to measure overall financial performance of
companies. In this report, we have to interpret financial position of Sainsbury's and Tesco so for
that purpose ratios are calculated (Financial ratios, 2019). Some of them are mentioned below:
PROFITABILITY RATIOS: These ratios measure the profitability of a company by
analysing the ROCE, NPM, GPM etc. Below are the calculations for the mentioned ratios:
ROCE: It is a profitability ratio which measures how efficiently a firm generate profits
from its capital employed by comparing it with net operating margin.
ROCE: (Profit before interest and tax/capital employed)*100
Particulars 2015 2016 2017 2018
Tesco 31.74 -0.65 -1.36 5.71
Sainsbury's -0.55 5.53 5 3.66
1
⊘ This is a preview!⊘
Do you want full access?
Subscribe today to unlock all pages.

Trusted by 1+ million students worldwide

Gross profit margin: It is a ratio which calculates percentage of gross profit by sales
revenue during an accounting year.
Gross profit margin: (Gross profit/sales)*100
Particulars 2015 2016 2017 2018
Tesco -3.39 5.24 5.19 5.83
Sainsbury's 5.08 6.19 6.23 6.61
2
revenue during an accounting year.
Gross profit margin: (Gross profit/sales)*100
Particulars 2015 2016 2017 2018
Tesco -3.39 5.24 5.19 5.83
Sainsbury's 5.08 6.19 6.23 6.61
2
Paraphrase This Document
Need a fresh take? Get an instant paraphrase of this document with our AI Paraphraser

Net profit margin: It is a ratio which calculates percentage of new profit by sales
revenue during an accounting year.
Net profit margin: (Net
profit/sales)*100
Particulars 2015 2016 2017 2018
Tesco -10.24 0.3 0.26 2.26
Sainsbury's -0.3 2.33 1.91 1.43
3
revenue during an accounting year.
Net profit margin: (Net
profit/sales)*100
Particulars 2015 2016 2017 2018
Tesco -10.24 0.3 0.26 2.26
Sainsbury's -0.3 2.33 1.91 1.43
3

Interpretation: The interpretation for the profitability ratios on vertical and horizontal
basis is given below:
Vertical: As seen above, the return on capital employed ratio for Tesco has seen quite a
downfall from 2015 to 2018. This is because PBIT is stepping down during the years. However,
if seen at the ROCE of Sainsbury's it has suddenly increased from -0.55 to 5.53 during 2015 &
16. Although, for the further years it has again declined immensely but still better than the result
of 2015. This shows that the profitability situation for both the companies is not going too well
and they should try to sell more goods to the customer in order to stabilize their profit margin.
The gross profit & net profit margin for Tesco is quite progressive and is continuously
increasing during the years (Grace and et.al., 2015). This shows that the company is able to
manage its inventory & purchases properly as well as is able to grow in terms of revenue within
the years. Although, NPM for Sainsbury's is not very impressive as it has severely declined
within the years which shows that the profit stability is not going well. But, GPM for the
company is working in favour of it which shows that the company is utilising its resources in an
efficient manner along with low production cost.
Horizontal: The result of profitability for both Tesco and Sainsbury's has initially
increased but during the years it has immensely taken a downfall which reflects that both
organisations are not able to sell their products & services to the customers in an effective
manner. To maintain track of earnings, Tesco & Sainsbury's should mitigate some strategies so
that they are able to maintain their brand image.
4
⊘ This is a preview!⊘
Do you want full access?
Subscribe today to unlock all pages.

Trusted by 1+ million students worldwide

The gross profit for both the companies is more in the current year which shows that the
business is effective maintaining over its operating expenses. However, Sainsbury's is in a more
stabilize situation as compared to Tesco as there was a loss in the previous year. Although, it has
retained from that position but since the other company has a clear image so Sainsbury's has a
better GPM. NPM for both the companies is appeared to grow from the previous year which is
beneficial for them as they have control over their cost of production (Wu, Chen and Olson,
2014).
LIQUIDITY RATIOS: These ratios measure the cash flow position of a company by
calculating current & quick ratio. Below are the calculations for both ratios:
Current ratio: It is a ratio which calculates the ability of a firm to pay its liabilities. The
ideal current ratio is 2:1.
Current ratio: Current assets/current liabilities
Particulars 2015 2016 2017 2018
Tesco 0.6 0.75 0.79 0.71
Sainsbury's 0.65 0.66 0.74 0.76
5
Paraphrase This Document
Need a fresh take? Get an instant paraphrase of this document with our AI Paraphraser

Quick ratio: This is a ratio which is calculated by dividing quick assets with current
liabilities. Also known as liquid assets, it deducts a portion of inventory and prepaid
expenses from current assets. The ideal ratio is supposed to be 1:1.
Quick ratio: Liquid assets/current
liabilities
Particulars 2015 2016 2017 2018
Tesco 0.44 0.61 0.68 0.6
Sainsbury's 0.51 0.52 0.53 0.59
Interpretation: The interpretation for the profitability ratios on vertical and horizontal
basis is given below:
Vertical: From the above calculations of current ratio for Sainsbury's, it can be stated
that the company is not able to pay its liabilities on time. The ideal CR should be 2:1 which is
not the case here. Also, the quick ratio for the company is quite stable and not increasing which
shows that it is not able to meet its short term liabilities with the allotted funds.
Although, current ratio for Tesco is increasing during the years but since it does not meet
the criteria of having an ideal ratio so that shows the company's liquidity position is not very
stable (Khan, Hussain and Mehmood, 2016). It is having difficulties in paying the liabilities
6

within the allotted time duration. The quick assets implies that a portion of inventory as well as
prepaid expenses is deducted which has not either benefited the company as it is less than 1.
Horizontal: The current ratio for both the companies has been consistent over the year
which shows that they are able to pay the creditors on time. The quick ratio is also stabilised its
position during the years which shows that the companies are in a sound position to pay the
liabilities on time. It positively impacts the liquidity position of both companies.
EFFICIENCY RATIOS: These are the ratios which check the number of days
remaining to pay the creditor or for the debtor to pay the due amount. They check the efficiency
by calculating inventory turnover, trade payable collection period etc. Below are the
calculations for the ratios:
Inventory turnover period: It is a duration which calculates number of days remaining
with a company to order the inventory in order to avoid stock-outs.
Inventory turnover period: (Inventory/cost of sales)*365 in days
Particulars 2015 2016 2017 2018
Tesco 17 15 16 15
Sainsbury's 16 16 26 25
7
⊘ This is a preview!⊘
Do you want full access?
Subscribe today to unlock all pages.

Trusted by 1+ million students worldwide

Trade payables payment period: It is a time-frame allotted to a company for paying its
creditors before the due date.
Accounts payable payment period: (Trade payables/cost of sales)*365 in days
Particulars 2015 2016 2017 2018
Tesco 29 29 61 61
Sainsbury's 3 3 3 3
Interpretation: The interpretation for the profitability ratios on vertical and horizontal
basis is given below:
Vertical: As seen above, the inventory turnover days for Tesco are not showing any
upstream over the years. They are not stable which shows that the number of days remaining for
stock holding period with the company needs to be highly monitored & tested. However, ITR
for Sainsbury's has increased in 2017 & 2108 that implies the company is certainly doing well in
stocking up the raw materials.
Accounts payable period for Tesco has majorly been stable & similar in first & last two
years. But, overall the time frame has altered significantly which shows that the company still
has some duration left to pay its creditors. In the meantime, they can practice other operations
which are more important (Vogel, 2014). However, the trade payable payment period for
8
Paraphrase This Document
Need a fresh take? Get an instant paraphrase of this document with our AI Paraphraser

Sainsbury's is seen to be absolutely stable over the years. It implies that the entity is neither In a
bad state nor in good but still should aim to improve its position.
Horizontal: The above ratio i.e. inventory & trade payable payment period comprises of
comparison between two companies which are Sainsbury's and Tesco. ITR for Tesco is seen to
remain stable over the periods which states no alteration should be made and the company is in
a sound position. However, for Sainsbury's it has been stable for the first and last two years
which implies that the firm should monitor its inventory by tracking it down from the
warehouse.
Trade payables payment period for Sainsbury's is absolutely stable which shows that the
company is in a good shape and should be able to pay its creditors within the allotted time frame
(Kothari, Mizik and Roychowdhury, 2015). However, for Tesco it has seen to be exact like
Sainsbury's ITR i.e. stable and secure for the first and last two years. Although, in comparison
with Tesco, the payment period is very less which is considered to be a good sign for the
business.
SOLVENCY RATIOS: These ratios check the level of gearing as well as debt position
the company is in. It also considers interest charge that is finance income (Vernon and Aharoni,
2014). This considers calculation of interest coverage, debt-equity etc. Below are the
calculations for the ratios:
Debt-equity ratio: It is a ratio which calculated the proportion of debt or long-term
borrowings to equity capital.
Debt equity ratio: (Debt/equity)*100
Particulars 2015 2016 2017 2018
Tesco 1.49 1.23 1.45 0.67
Sainsbury's 0.45 0.37 0.32 0.23
9

Interest coverage ratio: This is a ratio which is calculated by dividing earnings before
interest & tax by finance charge for the year.
Interest coverage ratio: (EBIT/interest expense) in times
Particulars 2015 2016 2017 2018
Tesco 9.68 1.95 2.23 3.63
Sainsbury's 0.45 4.23 4.72 3.7
10
interest & tax by finance charge for the year.
Interest coverage ratio: (EBIT/interest expense) in times
Particulars 2015 2016 2017 2018
Tesco 9.68 1.95 2.23 3.63
Sainsbury's 0.45 4.23 4.72 3.7
10
⊘ This is a preview!⊘
Do you want full access?
Subscribe today to unlock all pages.

Trusted by 1+ million students worldwide
1 out of 22
Related Documents
Your All-in-One AI-Powered Toolkit for Academic Success.
+13062052269
info@desklib.com
Available 24*7 on WhatsApp / Email
Unlock your academic potential
Copyright © 2020–2025 A2Z Services. All Rights Reserved. Developed and managed by ZUCOL.


