Financial Feasibility Report: ALLCURE Inc - FIN20014, OUA, SP4 2018
VerifiedAdded on 2023/04/22
|20
|3721
|255
Report
AI Summary
This report provides a financial feasibility analysis for ALLCURE Inc., focusing on the production of the P-REC drug and evaluating an alternative, T-REC. The analysis utilizes NPV, IRR, and payback period calculations to determine project viability. Results indicate a positive NPV and acceptable IRR for both P-REC and T-REC. The report recommends considering qualitative factors alongside quantitative results before making a final decision. A detailed comparison of P-REC and T-REC is presented, considering different weighted average costs of capital (WACC) to provide comprehensive recommendations. Ultimately, the report advises ALLCURE Inc. on the financial implications of proceeding with either drug manufacturing project.

Report on Financial Feasibility for ALLCURE Inc.
1
1
Paraphrase This Document
Need a fresh take? Get an instant paraphrase of this document with our AI Paraphraser
Executive Summary
The report presented here provides an analysis of financial feasibility for ALLCURE Inc.
ALLCURE Inc has a project under consideration. It is considering setting up a manufacturing
facility for manufacturing P-REC drug. The financial results show positive NPV of $932,255.18
and high IRR of 26.71%. Further, the payback period (3.68 years) of the project is also within
the risk appetite of the management. Thus, the project of P-REC manufacture becomes
acceptable for the company. Further, the company can also go for alternative product called T-
REC. This product also has positive outcomes in terms of NPV ($952,662.18), IRR (29.86%),
and payback period (4.06 years). However, when comparing the payback period of two products
at WACC of 24%, it is found that P-REC is better than T-REC.
2
Contents
Introduction.................................................................................................................................................4
Findings.......................................................................................................................................................4
Quantitative.............................................................................................................................................4
Qualitative...............................................................................................................................................5
Recommendations and Justifications...........................................................................................................6
Detailed Comparison of P-REC and T-REC and Further Recommendations..............................................6
Conclusion...................................................................................................................................................8
References...................................................................................................................................................9
Appendix...................................................................................................................................................10
3
⊘ This is a preview!⊘
Do you want full access?
Subscribe today to unlock all pages.
Trusted by 1+ million students worldwide
Introduction
Assessing the financial feasibility is essential to ensure that the project under
consideration would be profitable for the company. With this aim, the firms conduct financial
feasibility of a project which involves evaluating project’s NPV, IRR, and payback period
(Rossi, 2015). The NPV evaluation among all is considered to be the most significant and thus,
the decision to accept or reject the project revolves around the result of NPV. As a thumb rule, if
the NPV is positive, the project is considered for implementation else it is rejected and the
proposal is turned down. In the current case, ALLCURE Inc is considering implementing a
project which involves developing a drug prototype called P-REC. Further, the company also
wishes to check the financial feasibility of an alternative of the prototype called T-REC. In this
connection, this report has been prepared with a view to assess the financial feasibility of P-REC
and T-REC by applying the tools such as NPV, IRR, payback period, and cross rate analysis.
Findings
Quantitative
Quantitative analysis is conducted applying mathematical tools and techniques. The
capital budgeting tools are applied to conduct quantitative analysis which involves application of
NPV, IRR, and payback period (Vecchi and Casalini, 2018). ALLCURE Inc is considering
setting up a production line for manufacturing of P-REC drug. This project involves huge capital
investments so it becomes essential for the company to evaluate that whether the project would
provide adequate returns or not.
Net Present Value of the Project
The net present value is computed by deducting the present value of all future cash
inflows expected from the project over its life time from the initial investment. The present
values of the cash inflows of the project are computed by discounting the cash inflows at an
appropriate discount rate. The appropriate discount rate is taken at weighted average cost of
capital of the firm. However, the estimation of weighted average cost of capital quite tricky and
it involves consideration of several factors (Goyat and Nain, 2016).
The net present value of P-REC is worked out to be $932,255.45 which indicates that the
project is financially viable. This net present value has been worked out by deducting present
4
Assessing the financial feasibility is essential to ensure that the project under
consideration would be profitable for the company. With this aim, the firms conduct financial
feasibility of a project which involves evaluating project’s NPV, IRR, and payback period
(Rossi, 2015). The NPV evaluation among all is considered to be the most significant and thus,
the decision to accept or reject the project revolves around the result of NPV. As a thumb rule, if
the NPV is positive, the project is considered for implementation else it is rejected and the
proposal is turned down. In the current case, ALLCURE Inc is considering implementing a
project which involves developing a drug prototype called P-REC. Further, the company also
wishes to check the financial feasibility of an alternative of the prototype called T-REC. In this
connection, this report has been prepared with a view to assess the financial feasibility of P-REC
and T-REC by applying the tools such as NPV, IRR, payback period, and cross rate analysis.
Findings
Quantitative
Quantitative analysis is conducted applying mathematical tools and techniques. The
capital budgeting tools are applied to conduct quantitative analysis which involves application of
NPV, IRR, and payback period (Vecchi and Casalini, 2018). ALLCURE Inc is considering
setting up a production line for manufacturing of P-REC drug. This project involves huge capital
investments so it becomes essential for the company to evaluate that whether the project would
provide adequate returns or not.
Net Present Value of the Project
The net present value is computed by deducting the present value of all future cash
inflows expected from the project over its life time from the initial investment. The present
values of the cash inflows of the project are computed by discounting the cash inflows at an
appropriate discount rate. The appropriate discount rate is taken at weighted average cost of
capital of the firm. However, the estimation of weighted average cost of capital quite tricky and
it involves consideration of several factors (Goyat and Nain, 2016).
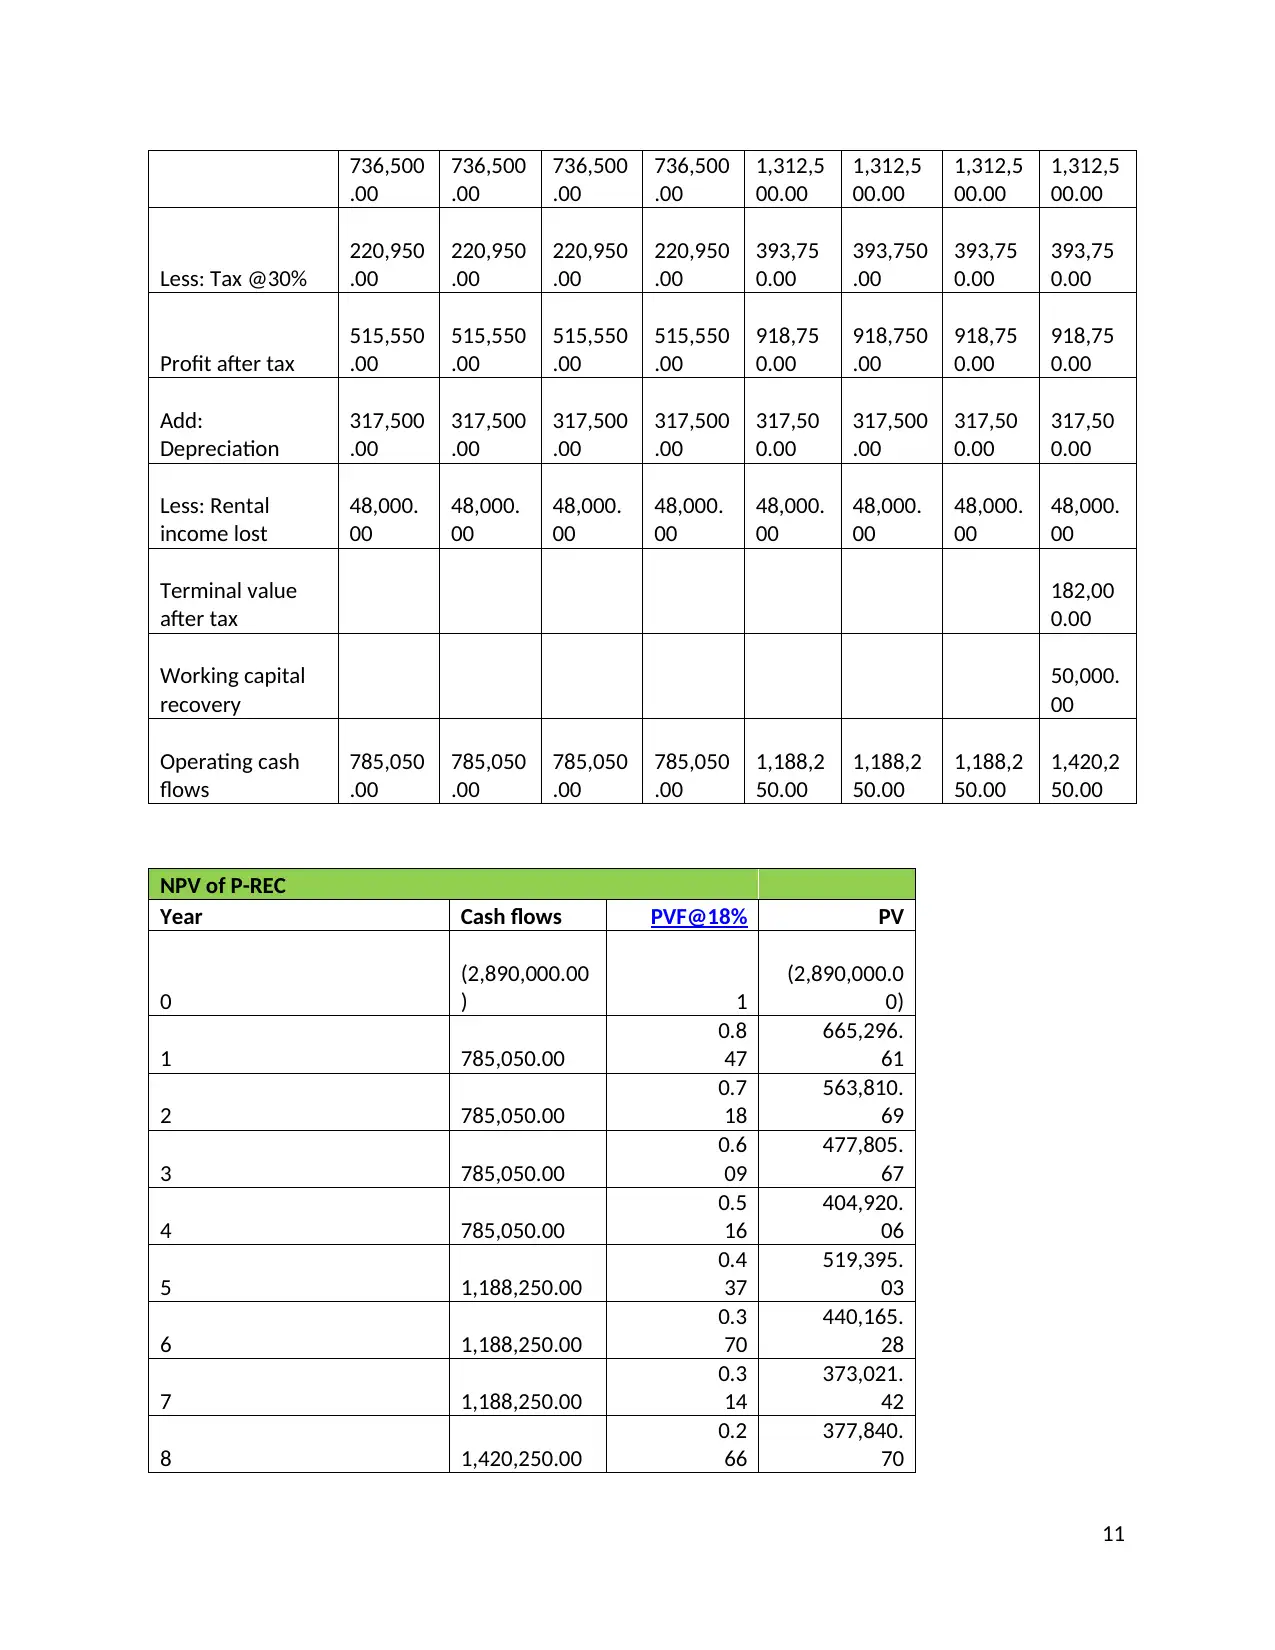
The net present value of P-REC is worked out to be $932,255.45 which indicates that the
project is financially viable. This net present value has been worked out by deducting present
4
Paraphrase This Document
Need a fresh take? Get an instant paraphrase of this document with our AI Paraphraser
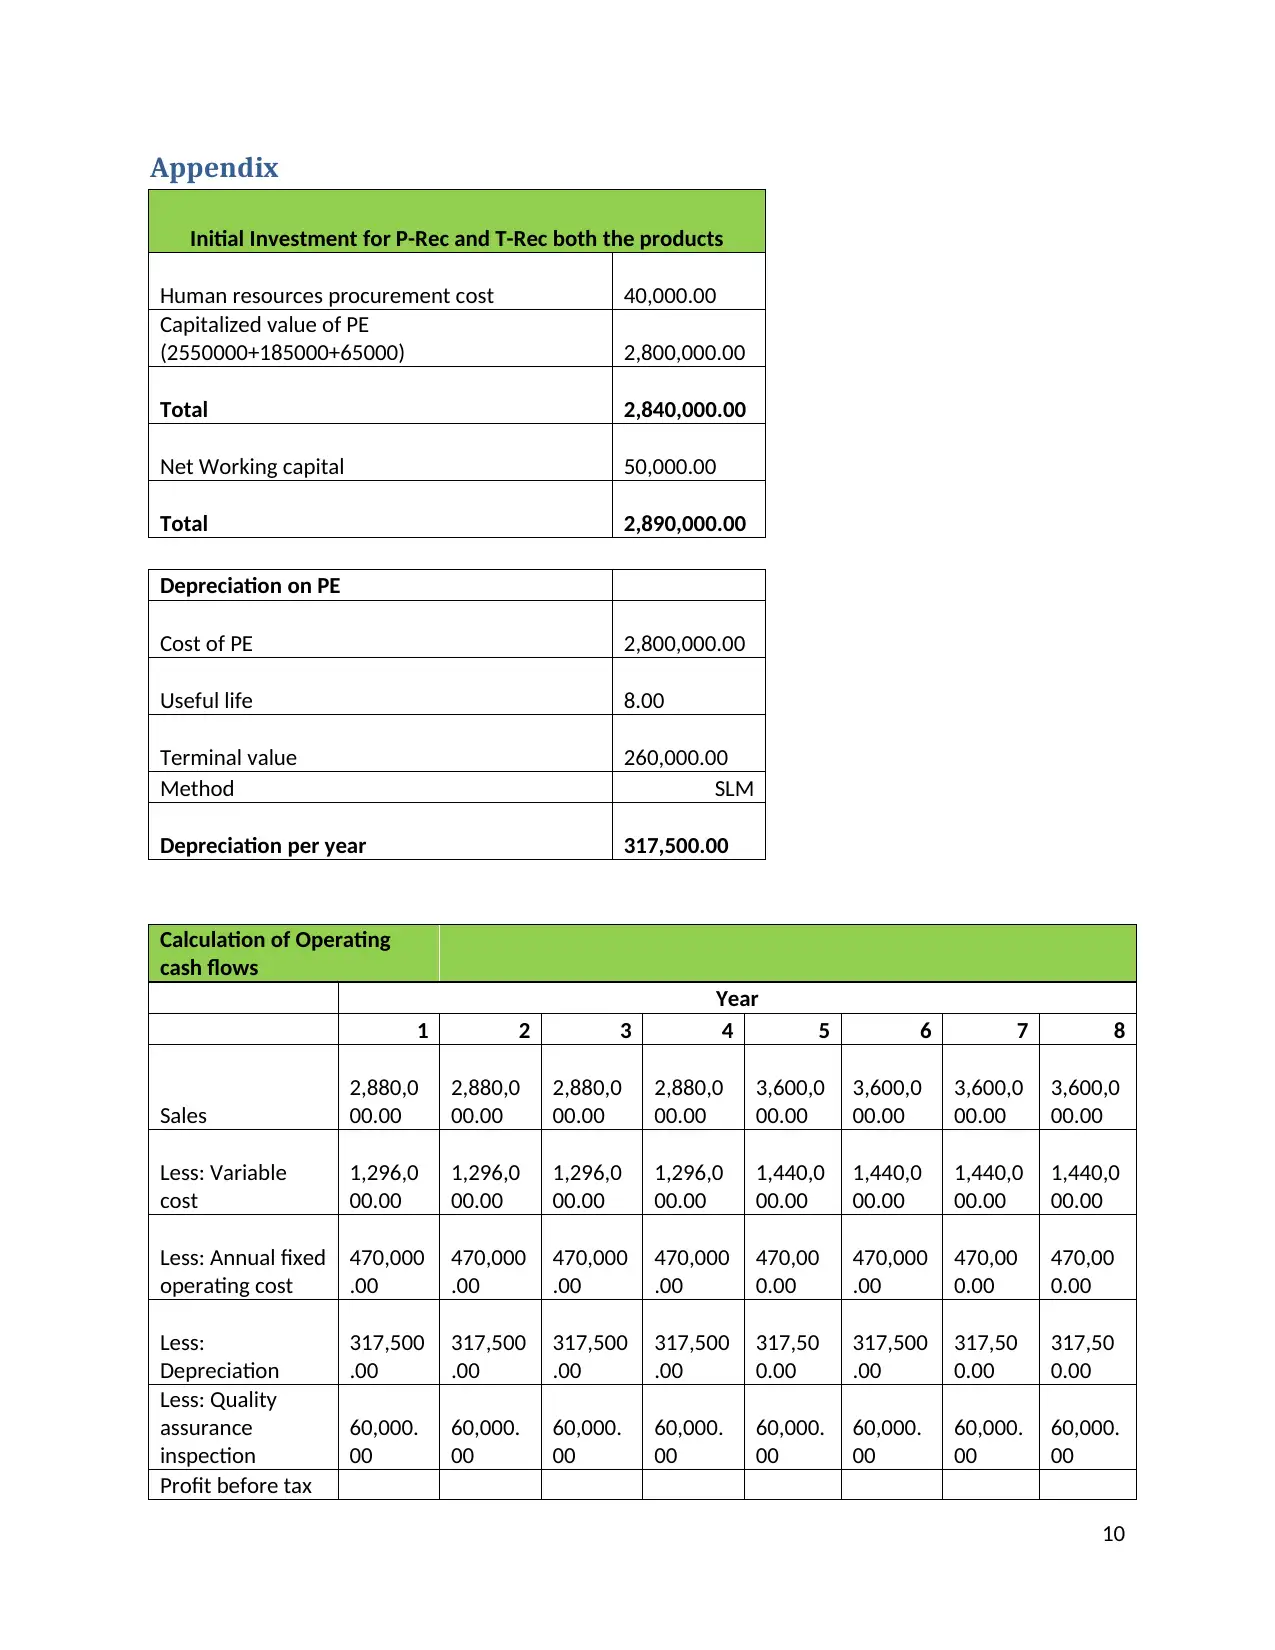
value of cash inflows of 8 years from the initial investment amount. The amount of initial
investment is worked out to be $2,890,000. The amount of present value of net cash inflows over
the period of 8 years is worked out to be $8,125,200. It could be observed that the cash inflows
for the first 4 years are lesser as compared to the cash inflows of last 4 years. The company
would be operating at 100% capacity from the 5th year onward which will cause the cash inflows
to increase substantially.
Internal Rate of Return (IRR)
Internal rate of return plays a crucial role in analyzing a project’s financial feasibility.
Internal rate of return is the cut off rate at which the project neither earns positive NPV nor
incurs loss (Kerzner and Kerzner, 2017). So, the NPV is zero at internal rate of return. This
implies that the project’s IRR should be higher than the discount rate to make it a feasible choice
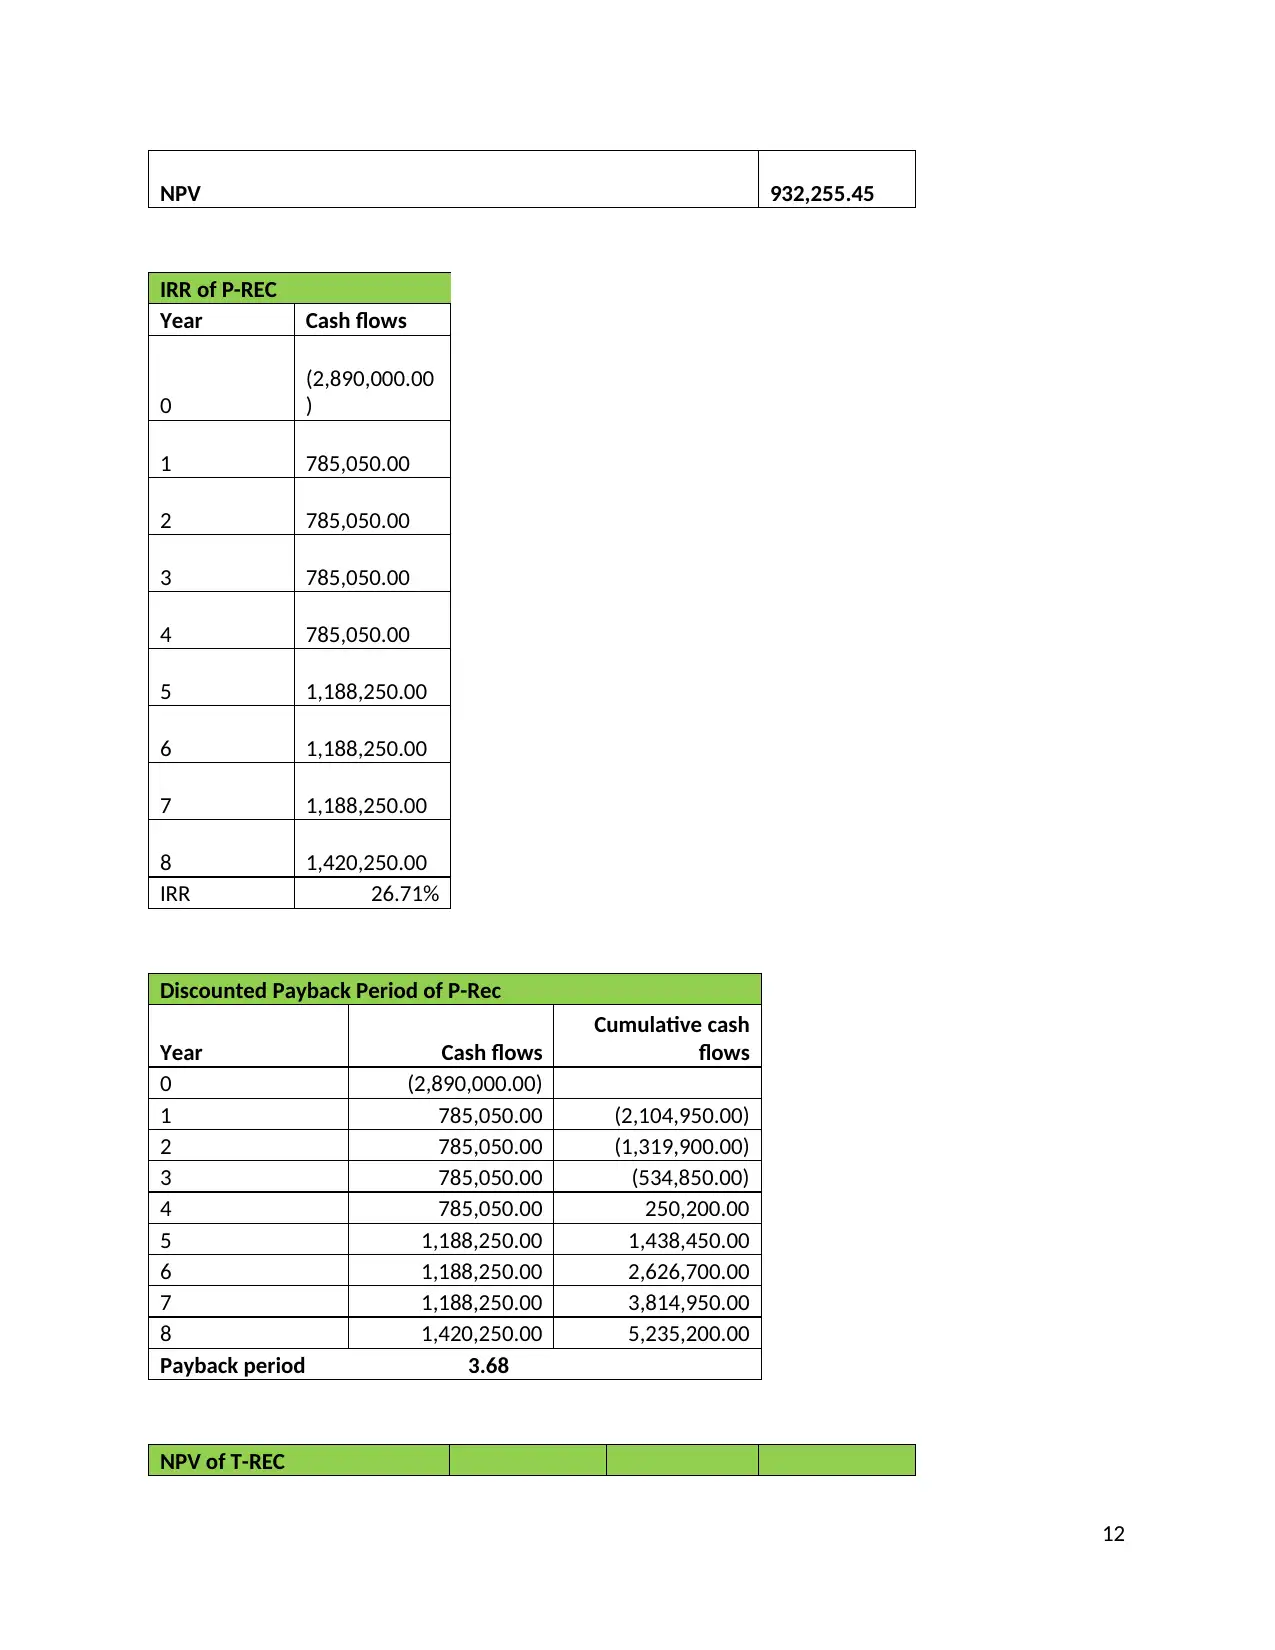
for the company. In the case of P-REC, the IRR of the project has been worked out to be 26.71%
which is higher than the discount rate of 18%. This indicates that the project is financially viable.
Payback Period
Apart from the above discussed two capital budgeting tools, payback period is another
important tool. Payback period is calculated to know the time period to be taken in the recovery
of the initial investment amount. The company would accept a project with lower payback
period. In the current case, the management of ALLCURE Inc apprehends that the payback
period of the project should be 5 years or less. The payback period of P-REC is worked out to be
3.68 years which is lower than what the management apprehends. So, the project becomes
acceptable for ALLCURE Inc.
Qualitative
It could be seen the quantitative analysis discussed above shows that the project of P-
REC is financially viable. However, it is pertinent to note here that the decision to accept the
proposal and move forward with its implementation does not only depend upon the quantitative
analysis, a qualitative analysis of the project is also necessary. The qualitative analysis entails
analysis of the project’s implementation effects on operational aspects of the firm (Hartas, 2015).
In the case of ALLCURE Inc, the management should consider the effect of implementation of
P-REC project on the sale of its existing products also. It is quite possible that the sale of P-REC
5
investment is worked out to be $2,890,000. The amount of present value of net cash inflows over
the period of 8 years is worked out to be $8,125,200. It could be observed that the cash inflows
for the first 4 years are lesser as compared to the cash inflows of last 4 years. The company
would be operating at 100% capacity from the 5th year onward which will cause the cash inflows
to increase substantially.
Internal Rate of Return (IRR)
Internal rate of return plays a crucial role in analyzing a project’s financial feasibility.
Internal rate of return is the cut off rate at which the project neither earns positive NPV nor
incurs loss (Kerzner and Kerzner, 2017). So, the NPV is zero at internal rate of return. This
implies that the project’s IRR should be higher than the discount rate to make it a feasible choice
for the company. In the case of P-REC, the IRR of the project has been worked out to be 26.71%
which is higher than the discount rate of 18%. This indicates that the project is financially viable.
Payback Period
Apart from the above discussed two capital budgeting tools, payback period is another
important tool. Payback period is calculated to know the time period to be taken in the recovery
of the initial investment amount. The company would accept a project with lower payback
period. In the current case, the management of ALLCURE Inc apprehends that the payback
period of the project should be 5 years or less. The payback period of P-REC is worked out to be
3.68 years which is lower than what the management apprehends. So, the project becomes
acceptable for ALLCURE Inc.
Qualitative
It could be seen the quantitative analysis discussed above shows that the project of P-
REC is financially viable. However, it is pertinent to note here that the decision to accept the
proposal and move forward with its implementation does not only depend upon the quantitative
analysis, a qualitative analysis of the project is also necessary. The qualitative analysis entails
analysis of the project’s implementation effects on operational aspects of the firm (Hartas, 2015).
In the case of ALLCURE Inc, the management should consider the effect of implementation of
P-REC project on the sale of its existing products also. It is quite possible that the sale of P-REC
5
would affect the existing customers of the company. Further, the company should also consider
the ethical aspects also. For instance, it would be advisable for the company to consider that if
the use of P-REC would be advantageous to its customers or not. If the use of P-REC is expected
to put the health and life of its users in danger, the company should refrain from implementing
the project (Hartas, 2015).
Recommendations and Justifications
On the basis of analysis conducted above, it could be recommended that the project is
financially viable therefore the company can go ahead with its implementation. However, there
are several qualitative concerns also that the management should take into account before taking
the final decision. The project is absolutely acceptable if decision is based purely on financial
grounds.
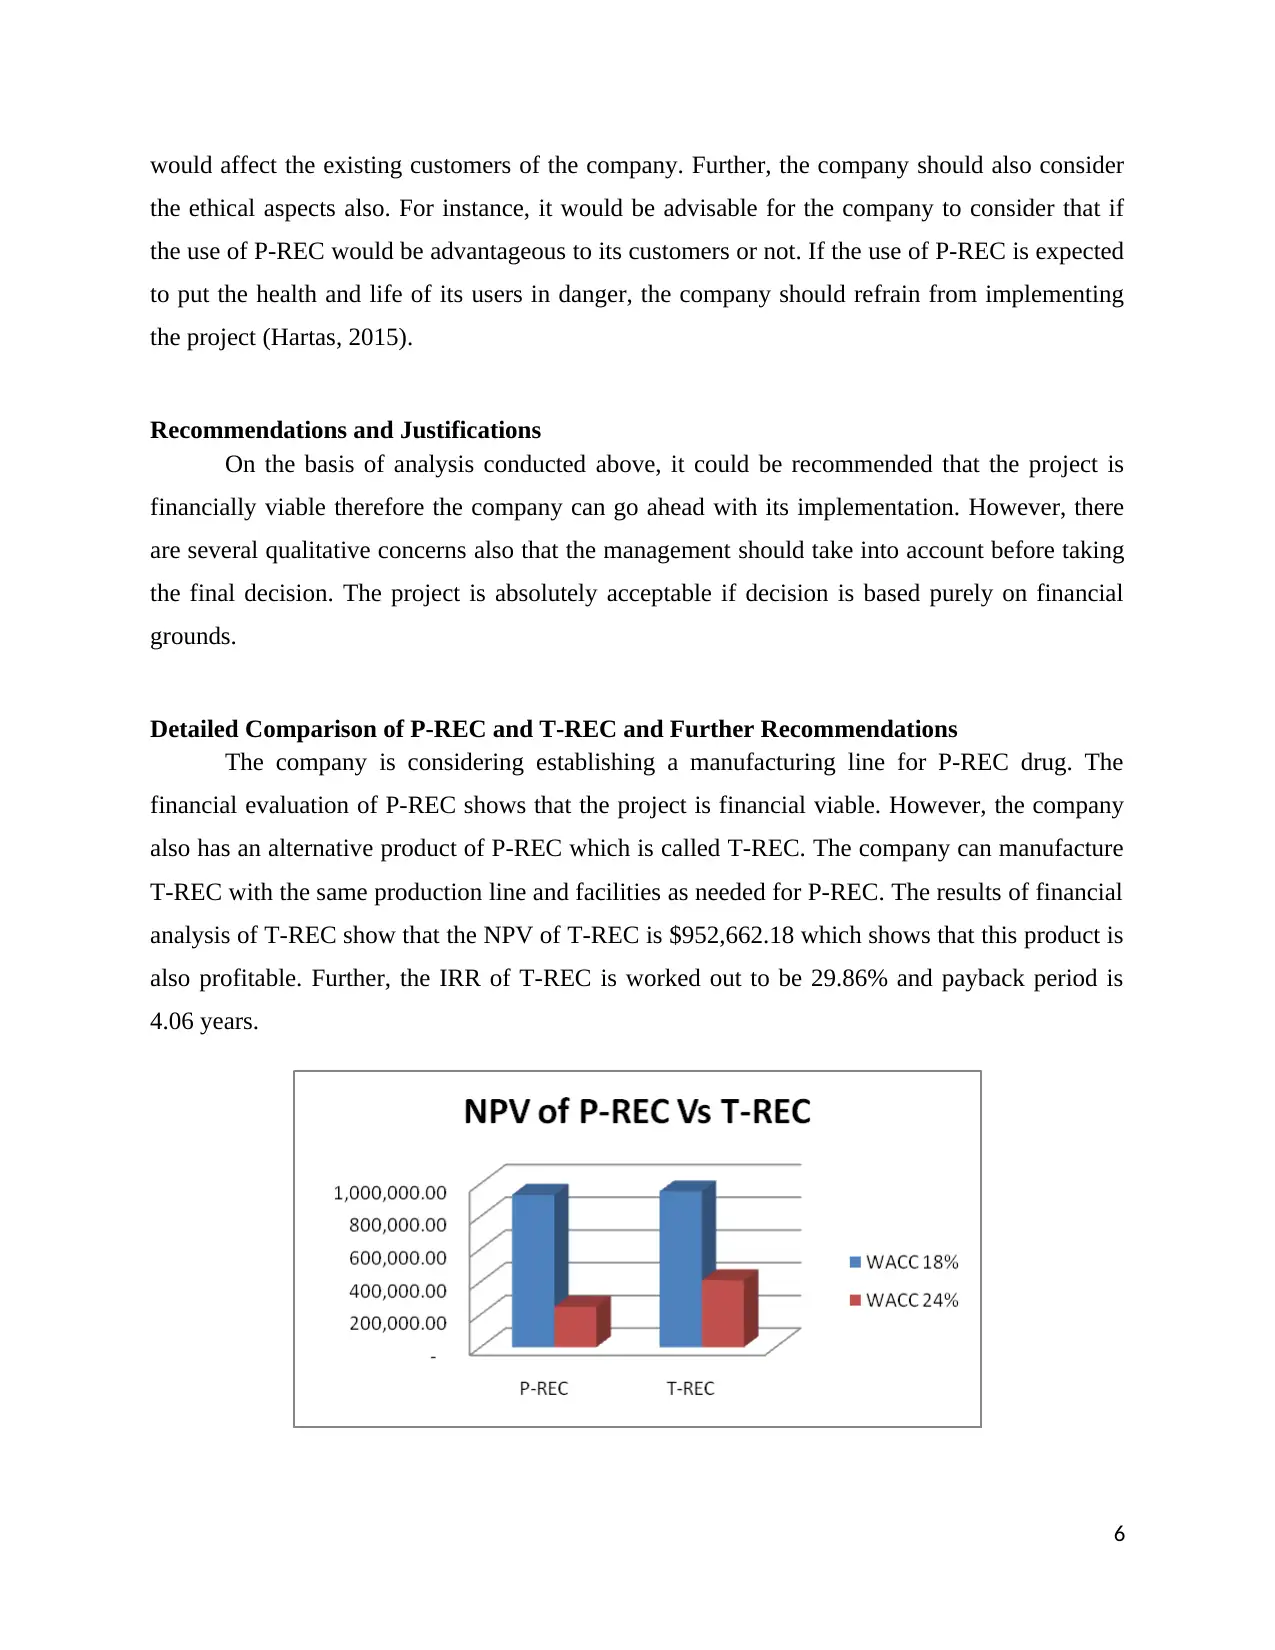
Detailed Comparison of P-REC and T-REC and Further Recommendations
The company is considering establishing a manufacturing line for P-REC drug. The
financial evaluation of P-REC shows that the project is financial viable. However, the company
also has an alternative product of P-REC which is called T-REC. The company can manufacture
T-REC with the same production line and facilities as needed for P-REC. The results of financial
analysis of T-REC show that the NPV of T-REC is $952,662.18 which shows that this product is
also profitable. Further, the IRR of T-REC is worked out to be 29.86% and payback period is
4.06 years.
6
the ethical aspects also. For instance, it would be advisable for the company to consider that if
the use of P-REC would be advantageous to its customers or not. If the use of P-REC is expected
to put the health and life of its users in danger, the company should refrain from implementing
the project (Hartas, 2015).
Recommendations and Justifications
On the basis of analysis conducted above, it could be recommended that the project is
financially viable therefore the company can go ahead with its implementation. However, there
are several qualitative concerns also that the management should take into account before taking
the final decision. The project is absolutely acceptable if decision is based purely on financial
grounds.
Detailed Comparison of P-REC and T-REC and Further Recommendations
The company is considering establishing a manufacturing line for P-REC drug. The
financial evaluation of P-REC shows that the project is financial viable. However, the company
also has an alternative product of P-REC which is called T-REC. The company can manufacture
T-REC with the same production line and facilities as needed for P-REC. The results of financial
analysis of T-REC show that the NPV of T-REC is $952,662.18 which shows that this product is
also profitable. Further, the IRR of T-REC is worked out to be 29.86% and payback period is
4.06 years.
6
⊘ This is a preview!⊘
Do you want full access?
Subscribe today to unlock all pages.
Trusted by 1+ million students worldwide
The chart above shows a comparison of NPV of P-REC and T-REC. It could be observed
that the NPV of P-REC is $932,255.45 which is lower than the NPV of T-REC of $952,662.18.
However, the difference in NPV is not significant but T-REC is more profitable than P-REC.
The NPV of T-REC is better due to its cash inflows being higher as compared to P-REC. A
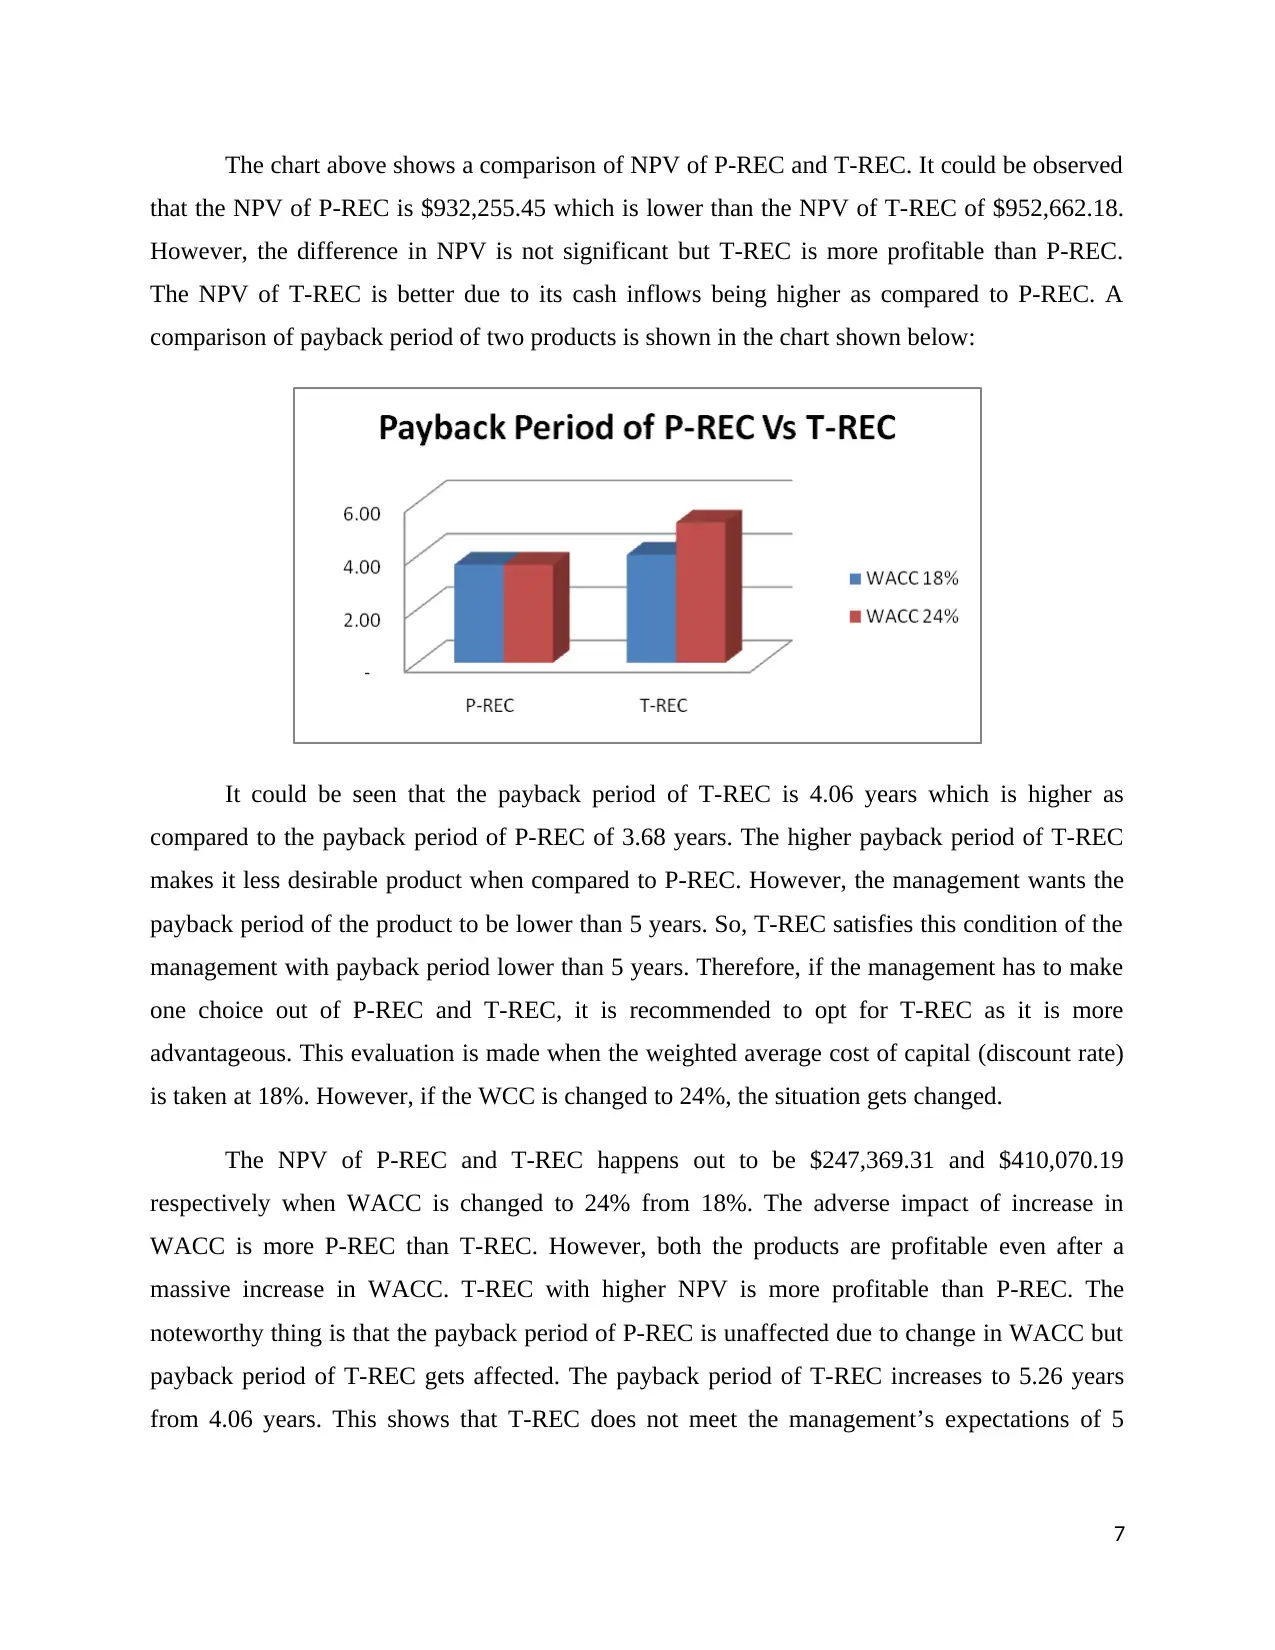
comparison of payback period of two products is shown in the chart shown below:
It could be seen that the payback period of T-REC is 4.06 years which is higher as
compared to the payback period of P-REC of 3.68 years. The higher payback period of T-REC
makes it less desirable product when compared to P-REC. However, the management wants the
payback period of the product to be lower than 5 years. So, T-REC satisfies this condition of the
management with payback period lower than 5 years. Therefore, if the management has to make
one choice out of P-REC and T-REC, it is recommended to opt for T-REC as it is more
advantageous. This evaluation is made when the weighted average cost of capital (discount rate)
is taken at 18%. However, if the WCC is changed to 24%, the situation gets changed.
The NPV of P-REC and T-REC happens out to be $247,369.31 and $410,070.19
respectively when WACC is changed to 24% from 18%. The adverse impact of increase in
WACC is more P-REC than T-REC. However, both the products are profitable even after a
massive increase in WACC. T-REC with higher NPV is more profitable than P-REC. The
noteworthy thing is that the payback period of P-REC is unaffected due to change in WACC but
payback period of T-REC gets affected. The payback period of T-REC increases to 5.26 years
from 4.06 years. This shows that T-REC does not meet the management’s expectations of 5
7
that the NPV of P-REC is $932,255.45 which is lower than the NPV of T-REC of $952,662.18.
However, the difference in NPV is not significant but T-REC is more profitable than P-REC.
The NPV of T-REC is better due to its cash inflows being higher as compared to P-REC. A
comparison of payback period of two products is shown in the chart shown below:
It could be seen that the payback period of T-REC is 4.06 years which is higher as
compared to the payback period of P-REC of 3.68 years. The higher payback period of T-REC
makes it less desirable product when compared to P-REC. However, the management wants the
payback period of the product to be lower than 5 years. So, T-REC satisfies this condition of the
management with payback period lower than 5 years. Therefore, if the management has to make
one choice out of P-REC and T-REC, it is recommended to opt for T-REC as it is more
advantageous. This evaluation is made when the weighted average cost of capital (discount rate)
is taken at 18%. However, if the WCC is changed to 24%, the situation gets changed.
The NPV of P-REC and T-REC happens out to be $247,369.31 and $410,070.19
respectively when WACC is changed to 24% from 18%. The adverse impact of increase in
WACC is more P-REC than T-REC. However, both the products are profitable even after a
massive increase in WACC. T-REC with higher NPV is more profitable than P-REC. The
noteworthy thing is that the payback period of P-REC is unaffected due to change in WACC but
payback period of T-REC gets affected. The payback period of T-REC increases to 5.26 years
from 4.06 years. This shows that T-REC does not meet the management’s expectations of 5
7
Paraphrase This Document
Need a fresh take? Get an instant paraphrase of this document with our AI Paraphraser
years payback period at 24% WACC. Therefore, if the WACC is 24%, it is recommended to the
management to opt for P-REC.
Conclusion
It is essential to conduct the quantitative as well as qualitative analysis of the project
before locking into a decision of investment. In this report the quantitative and qualitative
analysis has been conducted for ALLCURE Inc which is considering implementing a project for
manufacturing of drugs. The results of analysis show that P-REC product is profitable and hence
the company can go ahead with its production plan. However, there is another good option
available in the name of T-REC which is also equally good but when compared at 24% WACC;
it becomes less desirable due to higher payback period of 5.26 years.
8
References
Goyat, S. and Nain, A., 2016. Methods of Evaluating Investment Proposals. International
Journal of Engineering and Management Research (IJEMR), 6(5), pp.278-280.
Hartas, D. ed., 2015. Educational research and inquiry: Qualitative and quantitative
approaches. Bloomsbury Publishing.
Kerzner, H. and Kerzner, H.R., 2017. Project management: a systems approach to planning,
scheduling, and controlling. John Wiley & Sons.
Rossi, M., 2015. The use of capital budgeting techniques: an outlook from Italy. International
Journal of Management Practice, 8(1), pp.43-56.
Vecchi, V. and Casalini, F., 2018. Principles of Capital Budgeting for the Assessment of PPP
Projects. In Public-Private Partnerships in Health (pp. 65-84). Palgrave Macmillan, Cham.
9
⊘ This is a preview!⊘
Do you want full access?
Subscribe today to unlock all pages.
Trusted by 1+ million students worldwide
Appendix
Initial Investment for P-Rec and T-Rec both the products
Human resources procurement cost 40,000.00
Capitalized value of PE
(2550000+185000+65000) 2,800,000.00
Total 2,840,000.00
Net Working capital 50,000.00
Total 2,890,000.00
Depreciation on PE
Cost of PE 2,800,000.00
Useful life 8.00
Terminal value 260,000.00
Method SLM
Depreciation per year 317,500.00
Calculation of Operating
cash flows
Year
1 2 3 4 5 6 7 8
Sales
2,880,0
00.00
2,880,0
00.00
2,880,0
00.00
2,880,0
00.00
3,600,0
00.00
3,600,0
00.00
3,600,0
00.00
3,600,0
00.00
Less: Variable
cost
1,296,0
00.00
1,296,0
00.00
1,296,0
00.00
1,296,0
00.00
1,440,0
00.00
1,440,0
00.00
1,440,0
00.00
1,440,0
00.00
Less: Annual fixed
operating cost
470,000
.00
470,000
.00
470,000
.00
470,000
.00
470,00
0.00
470,000
.00
470,00
0.00
470,00
0.00
Less:
Depreciation
317,500
.00
317,500
.00
317,500
.00
317,500
.00
317,50
0.00
317,500
.00
317,50
0.00
317,50
0.00
Less: Quality
assurance
inspection
60,000.
00
60,000.
00
60,000.
00
60,000.
00
60,000.
00
60,000.
00
60,000.
00
60,000.
00
Profit before tax
10
Paraphrase This Document
Need a fresh take? Get an instant paraphrase of this document with our AI Paraphraser
736,500
.00
736,500
.00
736,500
.00
736,500
.00
1,312,5
00.00
1,312,5
00.00
1,312,5
00.00
1,312,5
00.00
Less: Tax @30%
220,950
.00
220,950
.00
220,950
.00
220,950
.00
393,75
0.00
393,750
.00
393,75
0.00
393,75
0.00
Profit after tax
515,550
.00
515,550
.00
515,550
.00
515,550
.00
918,75
0.00
918,750
.00
918,75
0.00
918,75
0.00
Add:
Depreciation
317,500
.00
317,500
.00
317,500
.00
317,500
.00
317,50
0.00
317,500
.00
317,50
0.00
317,50
0.00
Less: Rental
income lost
48,000.
00
48,000.
00
48,000.
00
48,000.
00
48,000.
00
48,000.
00
48,000.
00
48,000.
00
Terminal value
after tax
182,00
0.00
Working capital
recovery
50,000.
00
Operating cash
flows
785,050
.00
785,050
.00
785,050
.00
785,050
.00
1,188,2
50.00
1,188,2
50.00
1,188,2
50.00
1,420,2
50.00
NPV of P-REC
Year Cash flows PVF@18% PV
0
(2,890,000.00
) 1
(2,890,000.0
0)
1 785,050.00
0.8
47
665,296.
61
2 785,050.00
0.7
18
563,810.
69
3 785,050.00
0.6
09
477,805.
67
4 785,050.00
0.5
16
404,920.
06
5 1,188,250.00
0.4
37
519,395.
03
6 1,188,250.00
0.3
70
440,165.
28
7 1,188,250.00
0.3
14
373,021.
42
8 1,420,250.00
0.2
66
377,840.
70
11
.00
736,500
.00
736,500
.00
736,500
.00
1,312,5
00.00
1,312,5
00.00
1,312,5
00.00
1,312,5
00.00
Less: Tax @30%
220,950
.00
220,950
.00
220,950
.00
220,950
.00
393,75
0.00
393,750
.00
393,75
0.00
393,75
0.00
Profit after tax
515,550
.00
515,550
.00
515,550
.00
515,550
.00
918,75
0.00
918,750
.00
918,75
0.00
918,75
0.00
Add:
Depreciation
317,500
.00
317,500
.00
317,500
.00
317,500
.00
317,50
0.00
317,500
.00
317,50
0.00
317,50
0.00
Less: Rental
income lost
48,000.
00
48,000.
00
48,000.
00
48,000.
00
48,000.
00
48,000.
00
48,000.
00
48,000.
00
Terminal value
after tax
182,00
0.00
Working capital
recovery
50,000.
00
Operating cash
flows
785,050
.00
785,050
.00
785,050
.00
785,050
.00
1,188,2
50.00
1,188,2
50.00
1,188,2
50.00
1,420,2
50.00
NPV of P-REC
Year Cash flows PVF@18% PV
0
(2,890,000.00
) 1
(2,890,000.0
0)
1 785,050.00
0.8
47
665,296.
61
2 785,050.00
0.7
18
563,810.
69
3 785,050.00
0.6
09
477,805.
67
4 785,050.00
0.5
16
404,920.
06
5 1,188,250.00
0.4
37
519,395.
03
6 1,188,250.00
0.3
70
440,165.
28
7 1,188,250.00
0.3
14
373,021.
42
8 1,420,250.00
0.2
66
377,840.
70
11
NPV 932,255.45
IRR of P-REC
Year Cash flows
0
(2,890,000.00
)
1 785,050.00
2 785,050.00
3 785,050.00
4 785,050.00
5 1,188,250.00
6 1,188,250.00
7 1,188,250.00
8 1,420,250.00
IRR 26.71%
Discounted Payback Period of P-Rec
Year Cash flows
Cumulative cash
flows
0 (2,890,000.00)
1 785,050.00 (2,104,950.00)
2 785,050.00 (1,319,900.00)
3 785,050.00 (534,850.00)
4 785,050.00 250,200.00
5 1,188,250.00 1,438,450.00
6 1,188,250.00 2,626,700.00
7 1,188,250.00 3,814,950.00
8 1,420,250.00 5,235,200.00
Payback period 3.68
NPV of T-REC
12
⊘ This is a preview!⊘
Do you want full access?
Subscribe today to unlock all pages.
Trusted by 1+ million students worldwide
1 out of 20
Related Documents


Your All-in-One AI-Powered Toolkit for Academic Success.
+13062052269
info@desklib.com
Available 24*7 on WhatsApp / Email
![[object Object]](/_next/static/media/star-bottom.7253800d.svg)
Unlock your academic potential
Copyright © 2020–2026 A2Z Services. All Rights Reserved. Developed and managed by ZUCOL.