Costing Assignment: Financial Analysis and Forecasting

Verified

Added on  2020/02/24

|12
|1997
|54
Homework Assignment
AI Summary
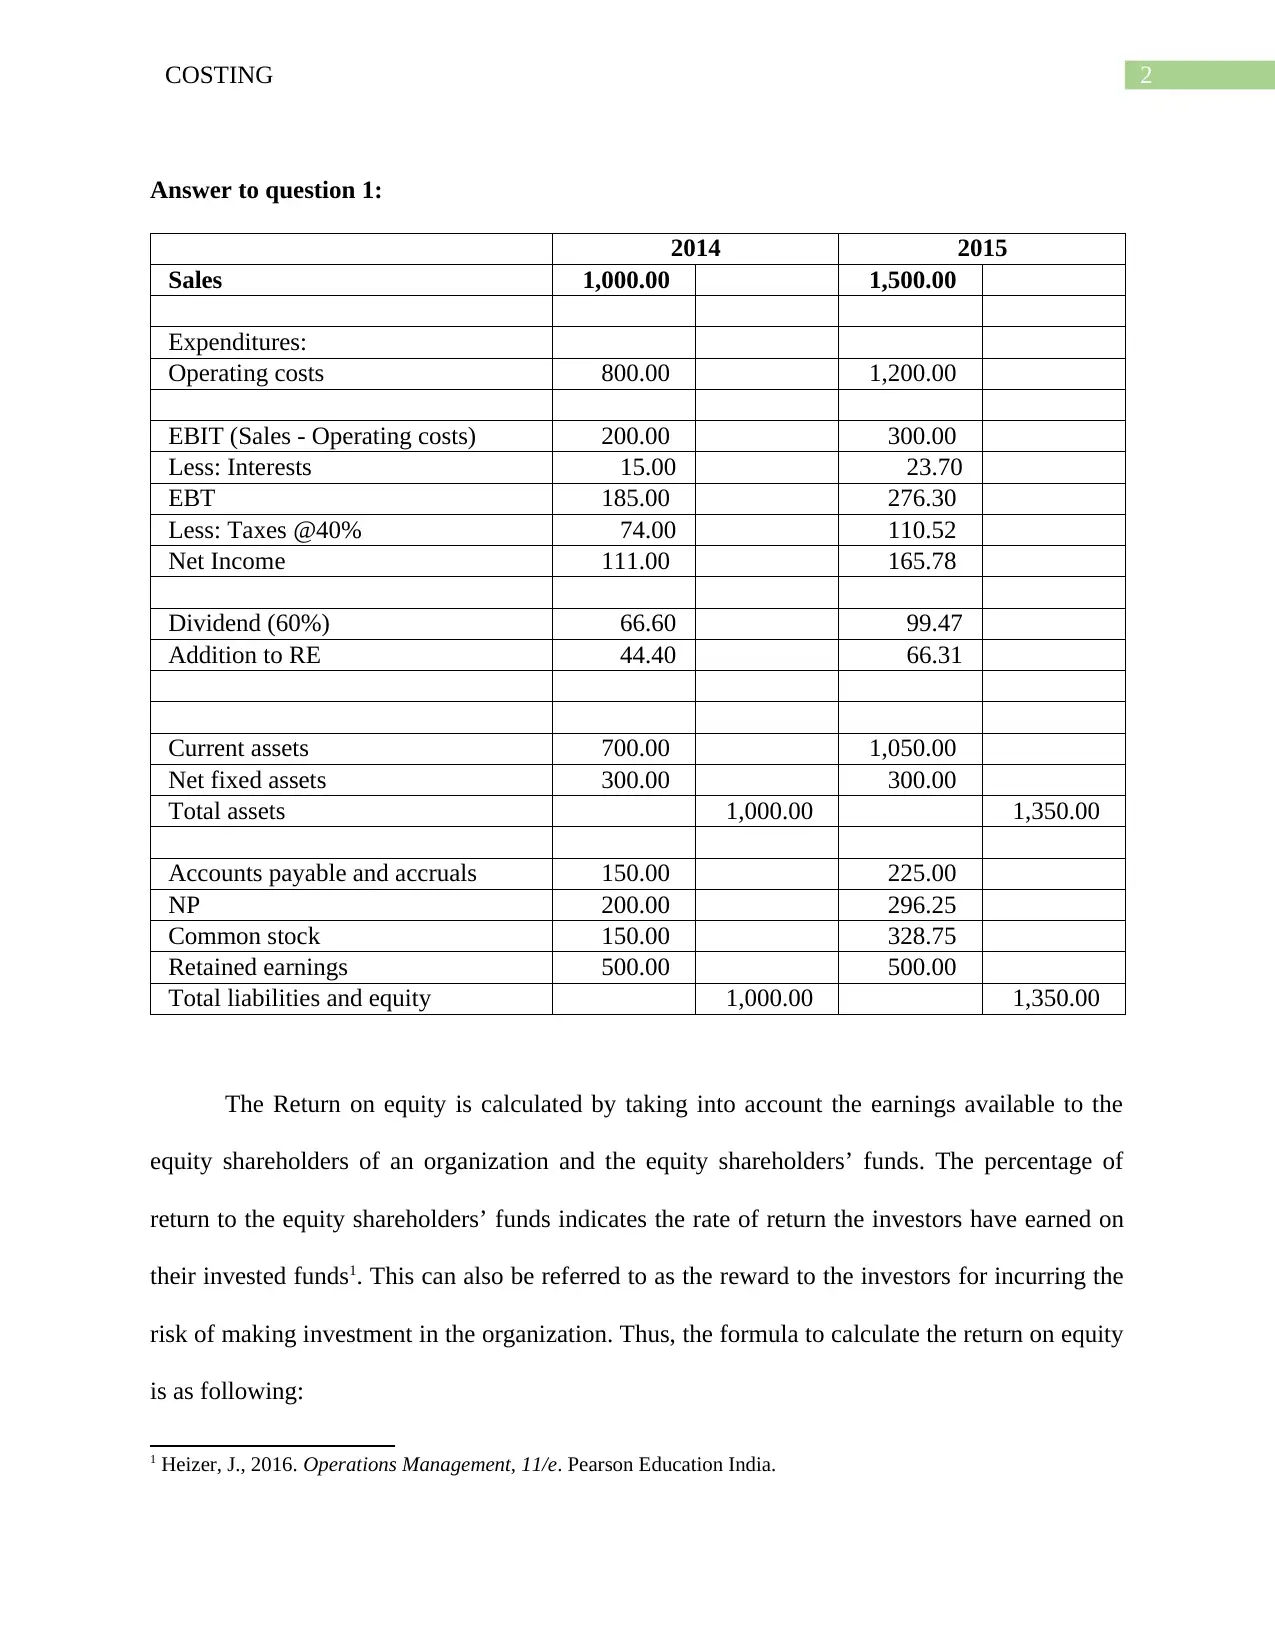
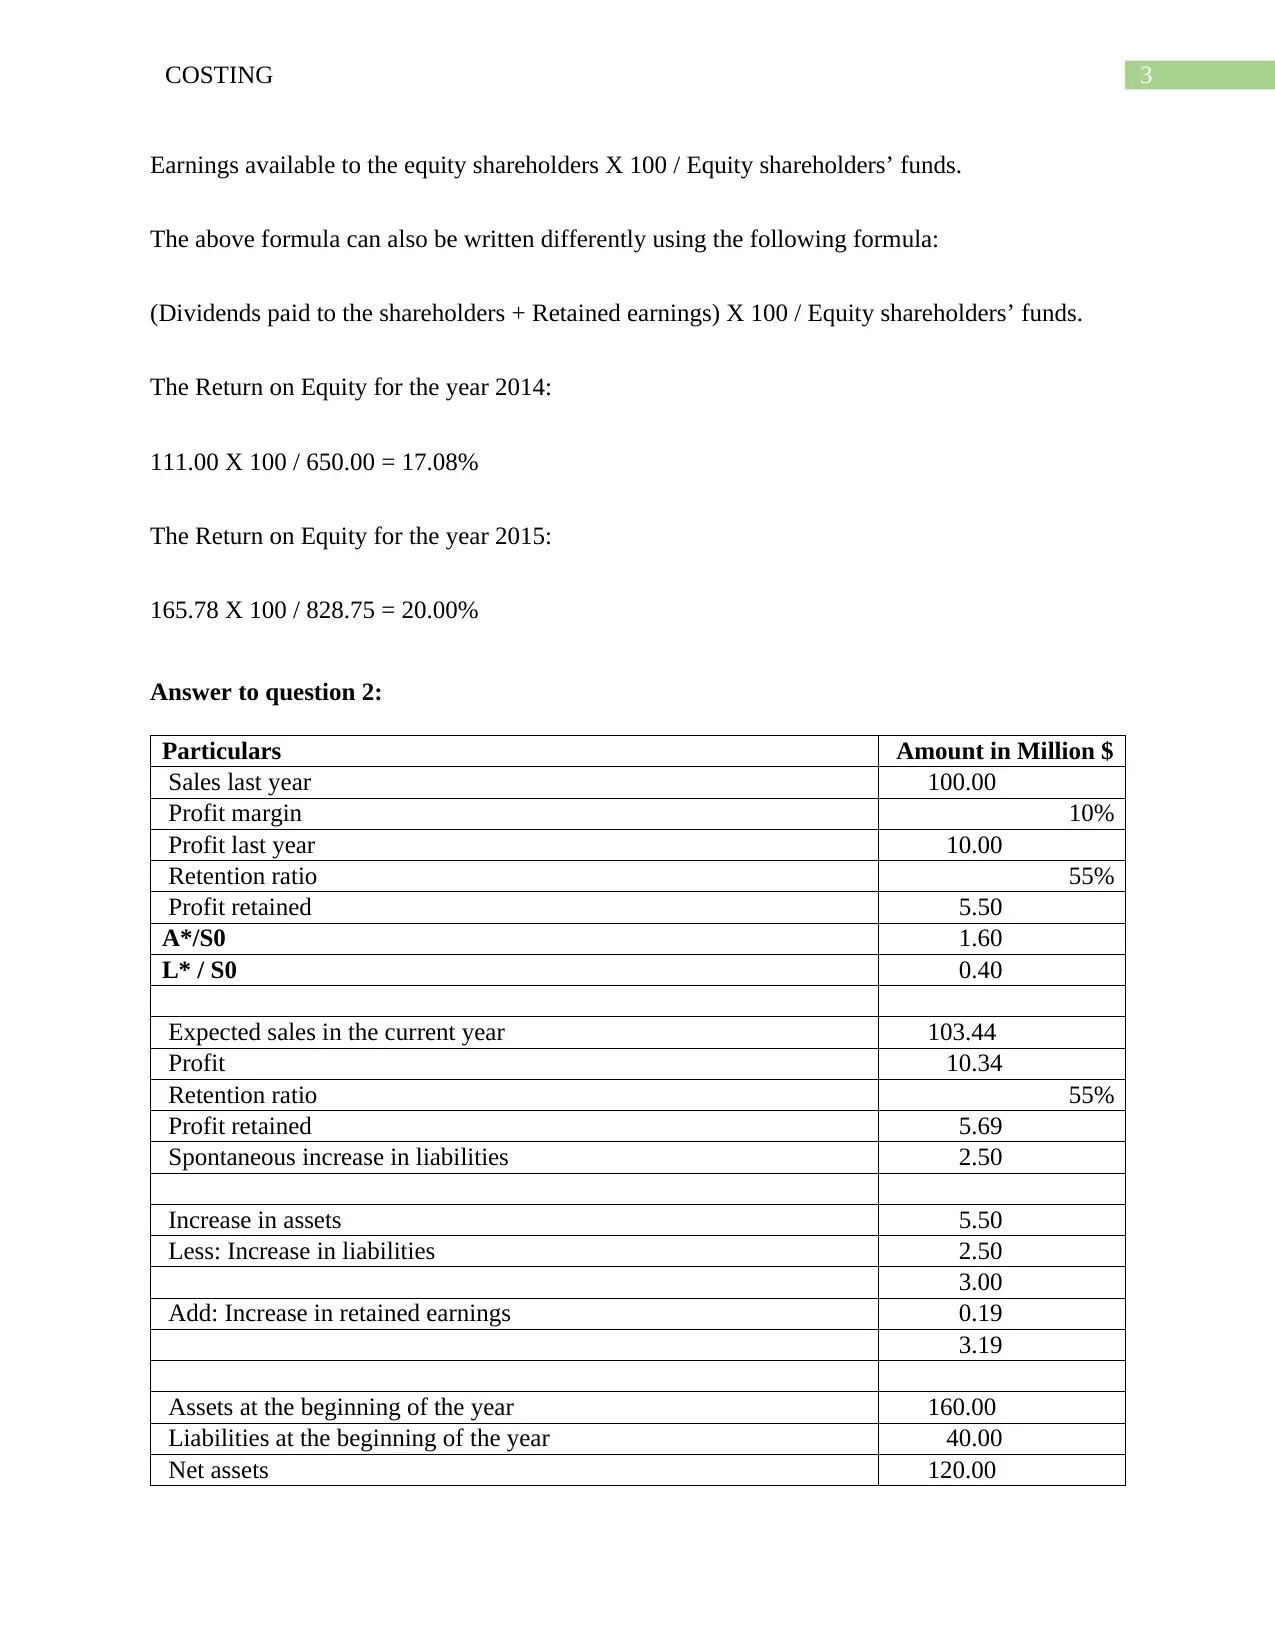
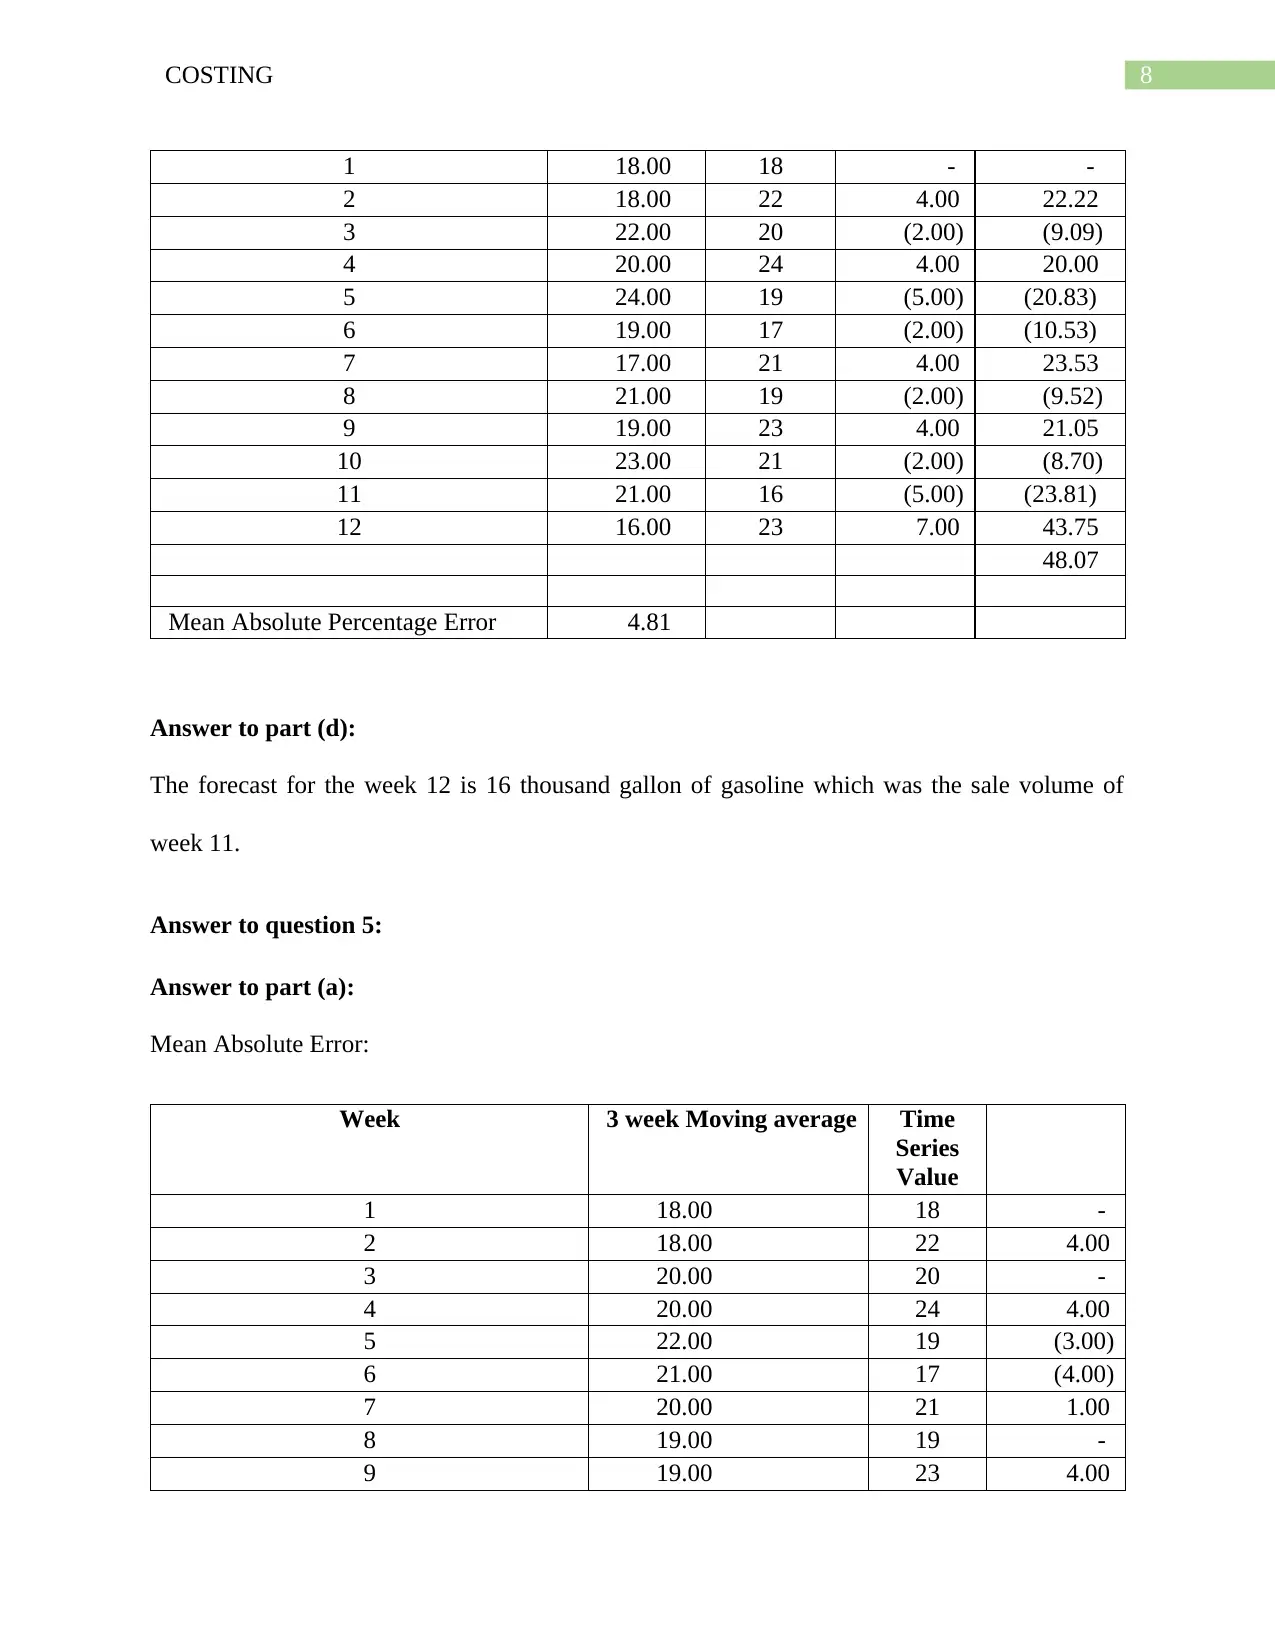
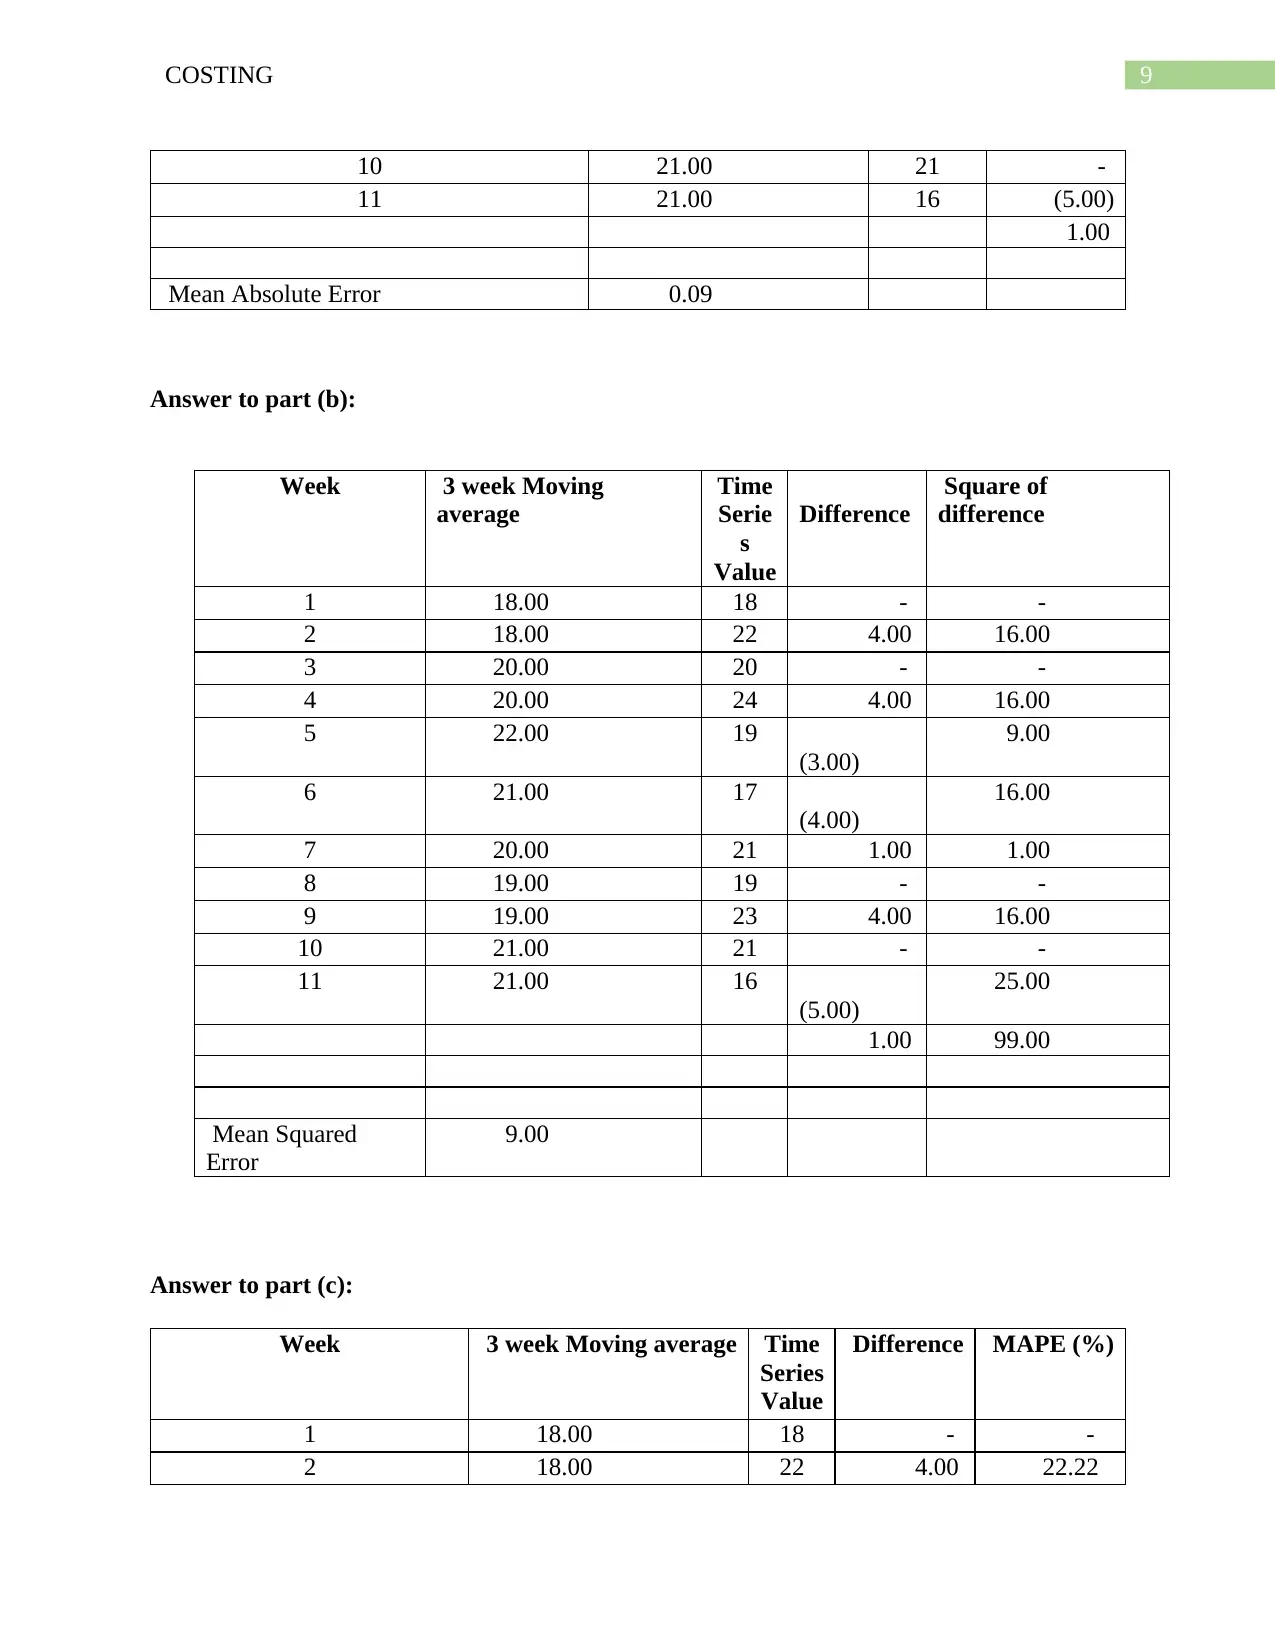
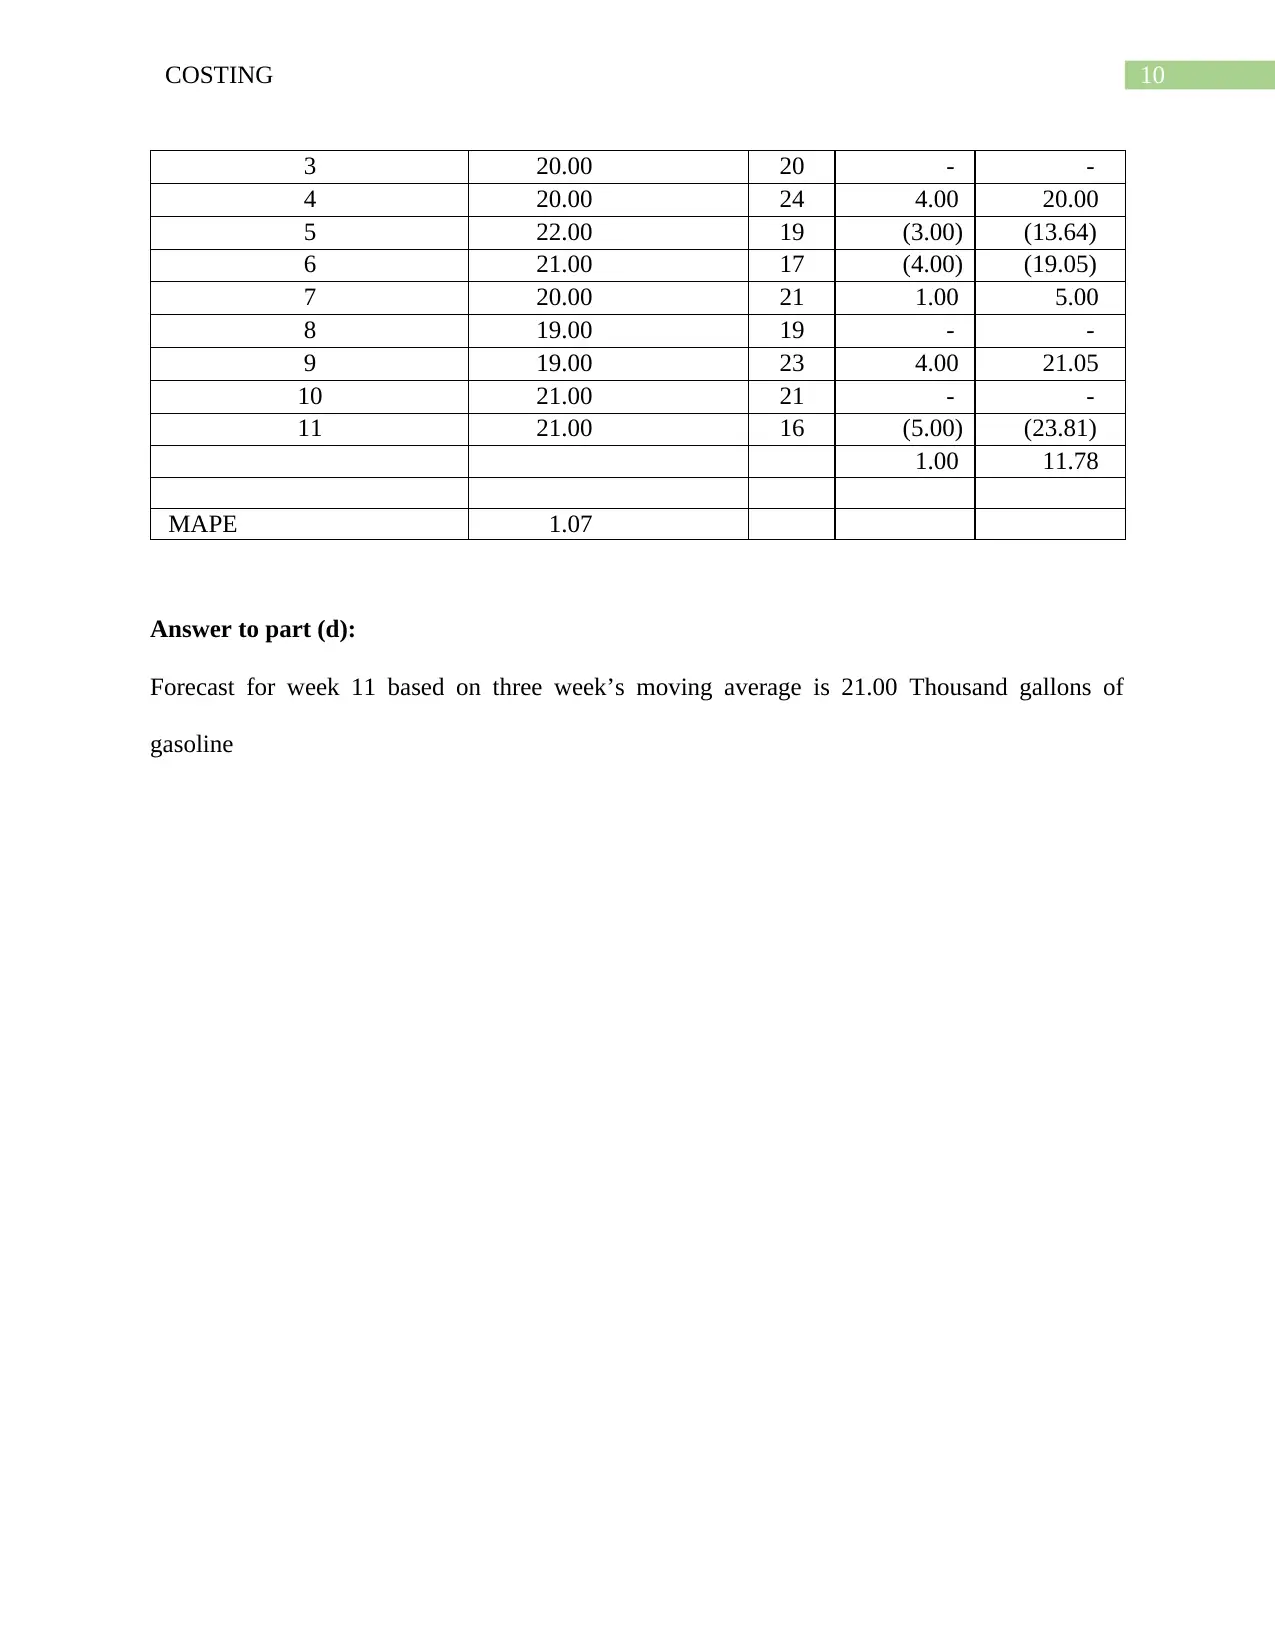
This costing assignment delves into financial analysis, forecasting, and performance evaluation. The solution begins with calculating Return on Equity (ROE) for two years, analyzing sales, expenditures, and net income. It then proceeds to a forecasting problem, estimating future sales, profits, and achievable growth based on given ratios and retention rates. The assignment further explores time series analysis, calculating Mean Absolute Error (MAE), Mean Squared Error (MSE), and Mean Absolute Percentage Error (MAPE) to assess forecast accuracy. Finally, it applies a three-week moving average to forecast gasoline sales and calculates the relevant error metrics. The document provides detailed calculations and interpretations of the results, demonstrating a comprehensive understanding of financial and statistical techniques. The assignment covers financial ratio analysis, forecasting, and error calculations.
tabler-icon-diamond-filled.svg

Contribute Materials

Your contribution can guide someone’s learning journey. Share your documents today.
Document Page
Running head: COSTING
Costing
Name of the Student:
Name of the University:
Authors Note:
tabler-icon-diamond-filled.svg

Secure Best Marks with AI Grader

Need help grading? Try our AI Grader for instant feedback on your assignments.
Document Page
1COSTING
Table of Contents
Answer to question 1:......................................................................................................................2
Answer to question 2:......................................................................................................................3
Answer to question 3:......................................................................................................................5
Answer to question 4:......................................................................................................................6
Answer to part (a):.......................................................................................................................6
Answer to part (b):.......................................................................................................................7
Answer to part (c):.......................................................................................................................8
Answer to part (d):.......................................................................................................................8
Answer to question 5:......................................................................................................................8
Answer to part (a):.......................................................................................................................8
Answer to part (b):.......................................................................................................................9
Answer to part (c):.....................................................................................................................10
Answer to part (d):.....................................................................................................................10
References:....................................................................................................................................11
Document Page
2COSTING
Answer to question 1:
2014 2015
Sales 1,000.00 1,500.00
Expenditures:
Operating costs 800.00 1,200.00
EBIT (Sales - Operating costs) 200.00 300.00
Less: Interests 15.00 23.70
EBT 185.00 276.30
Less: Taxes @40% 74.00 110.52
Net Income 111.00 165.78
Dividend (60%) 66.60 99.47
Addition to RE 44.40 66.31
Current assets 700.00 1,050.00
Net fixed assets 300.00 300.00
Total assets 1,000.00 1,350.00
Accounts payable and accruals 150.00 225.00
NP 200.00 296.25
Common stock 150.00 328.75
Retained earnings 500.00 500.00
Total liabilities and equity 1,000.00 1,350.00
The Return on equity is calculated by taking into account the earnings available to the
equity shareholders of an organization and the equity shareholders’ funds. The percentage of
return to the equity shareholders’ funds indicates the rate of return the investors have earned on
their invested funds1. This can also be referred to as the reward to the investors for incurring the
risk of making investment in the organization. Thus, the formula to calculate the return on equity
is as following:
1 Heizer, J., 2016. Operations Management, 11/e. Pearson Education India.
Document Page
3COSTING
Earnings available to the equity shareholders X 100 / Equity shareholders’ funds.
The above formula can also be written differently using the following formula:
(Dividends paid to the shareholders + Retained earnings) X 100 / Equity shareholders’ funds.
The Return on Equity for the year 2014:
111.00 X 100 / 650.00 = 17.08%
The Return on Equity for the year 2015:
165.78 X 100 / 828.75 = 20.00%
Answer to question 2:
Particulars Amount in Million $
Sales last year 100.00
Profit margin 10%
Profit last year 10.00
Retention ratio 55%
Profit retained 5.50
A*/S0 1.60
L* / S0 0.40
Expected sales in the current year 103.44
Profit 10.34
Retention ratio 55%
Profit retained 5.69
Spontaneous increase in liabilities 2.50
Increase in assets 5.50
Less: Increase in liabilities 2.50
3.00
Add: Increase in retained earnings 0.19
3.19
Assets at the beginning of the year 160.00
Liabilities at the beginning of the year 40.00
Net assets 120.00
tabler-icon-diamond-filled.svg

Secure Best Marks with AI Grader

Need help grading? Try our AI Grader for instant feedback on your assignments.
Document Page
4COSTING
Growth possible to achieve (%) 2.66
According to the information provided the expected ratios would remain constant in the future.
Thus, the profitability ratio, retention ratios as well as assets to sales and liabilities to sales ratios
all are expected to remain constant in the future2. Since the organization in the past has earned a
profit of 10% on sales as the ratio suggests the expected profit in the coming years will also
remain at 10%. The sales in the last year was $100.00 Million. The Profit on the sales of $100.00
Million that the organization earned in the last year was = 100.00 Million X 10% = $10.00
Million. The organization has a retention ratio of 55% which suggests that the organization uses
55% of the earnings to expand its operations. Thus, out of the profit of $10.00 Million that the
organization has earned in the last year, the management will use 55% of the profit to expand its
operations. Since the expected increase in assets due to increase in sales is 1.6 times thus, the
additional funds, i.e. retained earnings of $5.50 Million will also enhance the sales in the future;
thus, the expected sales in the coming year will be as follows:
Sales last year = $100.00 Million
Add: Increase due to retention (5.50 Million / 1.60) = $3.44 Million
Thus, the expected sales in the coming year will be $103.44 Million.
Accordingly, the profits and retained earnings have been calculated to ascertain the achievable
growth of the organization (Johansson et al. 2014).
The maximum growth the organization achieve is 2.66% as can be seen from the above
calculation.
2 Brigham, E.F., 2014. Financial management theory and practice. Atlantic Publishers & Distri.
Document Page
5COSTING
Answer to question 3:
Particulars 2001 2002
Amount
(Million $) Amou
nt
(Millio
n $)
Amount
(Million $) Amou
nt
(Millio
n $)
Sales 7,000.00 7,700.00
Less: Operating costs 3,000.00 3,300.00
EBIT 4,000.00 4,400.00
Less: Interests 200.00 200.00
EBT 3,800.00 4,200.00
Less: Tax @40% 1,520.00 1,680.00
Net income Available to shareholders
2,280.
00
2,520.
00
Dividends to be paid in
2002 1,260.
00
Expected additions to retained earnings
1,260.
00
The sales for the year 2002 is expected to increase by 10% from the year 2001. The sales
in the year 2001 was $7000 Million. The operating costs are also expected increase in proportion
to the sales. Thus, the sales for the year 2002 is expected to reach $7700 Million and accordingly
the operating costs will also increase proportionately3. The interest expenses expected to remain
same at $200 Million thus, there will be no addition or subtraction of interest expenses to
calculate the Earnings before Tax of the organization. As can be seen in the above table that after
deducting operating expenses the EBIT of the organization in the year 2002 is expected to touch
$4400.00 Million as compared to $4000.00 Million for the year 2001. Deducting the interest
3 Galliers, R.D. and Leidner, D.E. eds., 2014. Strategic information management: challenges and strategies in
managing information systems. Routledge.
Document Page
6COSTING
expenses of $200.00 Million the EBT will be $4200.00 Million. Since the organization expects
the tax rate to remain constant at 40% of the incomes of the organization the net income after
making provision for taxation at the rate of 40% of the profit will be $2520.00 Million. The
organization will retain 50% of the net income available to the equity shareholders of the
organization after making provision for taxation at the rate of 40% and the rest 50% will be
distributed as dividend to the equity shareholders4. The question has asked us to ascertain and
calculate the expected addition to the retained earnings. If the conditions and assumptions of the
management hold good in the future then the expected addition to the retained earnings will be
$1260.00 Million as can be seen in the calculation provided in the above table
Answer to question 4:
Answer to part (a):
Mean Absolute Error.
Mean absolute error is calculated by using the following formula:
Aggregate of absolute difference, whether negative or positive with appropriate sign / n
Accordingly, the mean absolute error for the above data is calculated in the following table:
Week Prediction Time Series
Value
1 18.00 18 -
2 18.00 22 4.00
3 22.00 20 (2.00)
4 20.00 24 4.00
5 24.00 19 (5.00)
6 19.00 17 (2.00)
7 17.00 21 4.00
4 Johansson, O., Pearce, D. and Maddison, D., 2014. Blueprint 5: True costs of road transport (Vol. 5). Routledge.
tabler-icon-diamond-filled.svg

Paraphrase This Document

Need a fresh take? Get an instant paraphrase of this document with our AI Paraphraser
Document Page
7COSTING
8 21.00 19 (2.00)
9 19.00 23 4.00
10 23.00 21 (2.00)
11 21.00 16 (5.00)
12 16.00 23 7.00
5.00
Mean Absolute Error 0.42
Answer to part (b):
Mean Squared Error:
Week Prediction Time
Series
Value
Squared
1 18.00 18 - -
2 18.00 22 4.00 16.00
3 22.00 20 (2.00) 4.00
4 20.00 24 4.00 16.00
5 24.00 19 (5.00) 25.00
6 19.00 17 (2.00) 4.00
7 17.00 21 4.00 16.00
8 21.00 19 (2.00) 4.00
9 19.00 23 4.00 16.00
10 23.00 21 (2.00) 4.00
11 21.00 16 (5.00) 25.00
12 16.00 23 7.00 49.00
5.00 179.00
Mean squared Error 14.92
Answer to part (c):
Mean Absolute Percentage Error:
Week Prediction Time
Series
Value
MAPE (%)
Document Page
8COSTING
1 18.00 18 - -
2 18.00 22 4.00 22.22
3 22.00 20 (2.00) (9.09)
4 20.00 24 4.00 20.00
5 24.00 19 (5.00) (20.83)
6 19.00 17 (2.00) (10.53)
7 17.00 21 4.00 23.53
8 21.00 19 (2.00) (9.52)
9 19.00 23 4.00 21.05
10 23.00 21 (2.00) (8.70)
11 21.00 16 (5.00) (23.81)
12 16.00 23 7.00 43.75
48.07
Mean Absolute Percentage Error 4.81
Answer to part (d):
The forecast for the week 12 is 16 thousand gallon of gasoline which was the sale volume of
week 11.
Answer to question 5:
Answer to part (a):
Mean Absolute Error:
Week 3 week Moving average Time
Series
Value
1 18.00 18 -
2 18.00 22 4.00
3 20.00 20 -
4 20.00 24 4.00
5 22.00 19 (3.00)
6 21.00 17 (4.00)
7 20.00 21 1.00
8 19.00 19 -
9 19.00 23 4.00
Document Page
9COSTING
10 21.00 21 -
11 21.00 16 (5.00)
1.00
Mean Absolute Error 0.09
Answer to part (b):
Answer to part (c):
Week 3 week Moving average Time
Series
Value
Difference MAPE (%)
1 18.00 18 - -
2 18.00 22 4.00 22.22
Week 3 week Moving
average
Time
Serie
s
Value
Difference
Square of
difference
1 18.00 18 - -
2 18.00 22 4.00 16.00
3 20.00 20 - -
4 20.00 24 4.00 16.00
5 22.00 19
(3.00)
9.00
6 21.00 17
(4.00)
16.00
7 20.00 21 1.00 1.00
8 19.00 19 - -
9 19.00 23 4.00 16.00
10 21.00 21 - -
11 21.00 16
(5.00)
25.00
1.00 99.00
Mean Squared
Error
9.00
tabler-icon-diamond-filled.svg

Secure Best Marks with AI Grader

Need help grading? Try our AI Grader for instant feedback on your assignments.
Document Page
10COSTING
3 20.00 20 - -
4 20.00 24 4.00 20.00
5 22.00 19 (3.00) (13.64)
6 21.00 17 (4.00) (19.05)
7 20.00 21 1.00 5.00
8 19.00 19 - -
9 19.00 23 4.00 21.05
10 21.00 21 - -
11 21.00 16 (5.00) (23.81)
1.00 11.78
MAPE 1.07
Answer to part (d):
Forecast for week 11 based on three week’s moving average is 21.00 Thousand gallons of
gasoline
Document Page
11COSTING
References:
Brigham, E.F., 2014. Financial management theory and practice. Atlantic Publishers & Distri.
Galliers, R.D. and Leidner, D.E. eds., 2014. Strategic information management: challenges and
strategies in managing information systems. Routledge.
Heizer, J., 2016. Operations Management, 11/e. Pearson Education India.
Johansson, O., Pearce, D. and Maddison, D., 2014. Blueprint 5: True costs of road
transport (Vol. 5). Routledge.
Laudon, K.C. and Laudon, J.P., 2016. Management information system. Pearson Education
India.
McKinney, J.B., 2015. Effective financial management in public and nonprofit agencies. ABC-
CLIO.
Nilsson, N.J., 2014. Principles of artificial intelligence. Morgan Kaufmann.
Peppard, J. and Ward, J., 2016. The strategic management of information systems: Building a
digital strategy. John Wiley & Sons.
Renz, D.O., 2016. The Jossey-Bass handbook of nonprofit leadership and management. John
Wiley & Sons.
chevron_up_icon
1 out of 12
circle_padding
hide_on_mobile
zoom_out_icon
logo.png

Your All-in-One AI-Powered Toolkit for Academic Success.

Available 24*7 on WhatsApp / Email

[object Object]