Financial Decision Making and Performance of Go-Ahead Group Plc Report
VerifiedAdded on 2021/01/02
|18
|4313
|402
Report
AI Summary
This report provides a comprehensive financial analysis of Go-Ahead Group Plc, a leading UK public transport company. It begins with an overview of the company, its vision, and strategic goals, followed by an in-depth examination of its financial performance. The analysis covers profitability measures (gross profit margin and net profit margin), liquidity measures (current ratio and quick ratio), and dividend ratios. The report compares Go-Ahead's performance with its competitor, First Group Plc, highlighting key trends and insights. It also includes a critical reflection on Genus plc's portrayal in the news and an evaluation of corporate governance at Go-Ahead plc. Furthermore, the report assesses investment appropriateness in the context of Go-Ahead Group Plc, drawing conclusions based on the financial data and industry context. The analysis uses financial ratios to assess the company's ability to generate profits, manage its short-term obligations, and provide returns to shareholders, providing a well-rounded view of Go-Ahead's financial health and decision-making processes.

Financial Decision
Making
Making
Paraphrase This Document
Need a fresh take? Get an instant paraphrase of this document with our AI Paraphraser
Table of Contents
INTRODUCTION...........................................................................................................................3
Overview of Company.....................................................................................................................3
Vision...............................................................................................................................................4
Strategic Goals.................................................................................................................................4
Financial Performance of Go-Ahead Group Plc:.............................................................................5
A. Profitability Measurement:................................................................................................5
B. Liquidity Measures:...........................................................................................................6
C. Dividend Ratios Analysis:.................................................................................................7
Critical Reflection on Genus plc's portrayal in the news
..........................................................................................................................................................9
Evaluation of Corporate Governance at Go-Ahead plc:..................................................................9
Investment Appropriateness in context of Go-Ahead Group Plc:.................................................10
CONCLUSION..............................................................................................................................12
REFERENCES..............................................................................................................................13
APPENDIX....................................................................................................................................14
INTRODUCTION
To achieve sustainable growth and enhance business performance, financial decision-
making plays a major role. Financial decision making is a systematic process which starts with
identification and analysis of opportunities. Further this process requires consideration of
financial performance indicators and other financial and non-financial factors that affects
business performance. These factors acts a early warning system for business organisation.
Evaluation and analysis of these factors helps to develop a framework for financial decision
making (Agarwal and Mazumder, 2013). This report provides an analysis of performance and
different operations of Go Ahead Group Plc. It is UK's one of the top listed company in public
transport sector and engaged in providing of passenger transport services in UK. Analysis of
financial performance helps to asses the actual performance of company. It also helps the various
internal and external stakeholders to take important decisions about whether to hold or sell the
securities of company. Various stakeholder of company have great impact on decisions of
company.
Overview of Company
Go Ahead is the leading public transport service in united kingdom with more than one
billion journeys every year. Company's headquarter is situated at Newcastle upon Tyne, United
Kingdom. On the London Stock Exchange it is listed on a FTSE 250 Index group. It started in
February 1987 as a GO-Ahead Northern Limited on the privatisation of the National Bus
Company, In North East England it started acquiring some certain small bus operator, in the
same time it also became the National Express sub-contractor operating service in Midlands,
North East, North West, and South West England (Ambuehl, Bernheim and Lusardi, 2014). In
1993 it began its first major acquisition of Brighton & Hove, in 1994 it acquired Oxford Bus
Company and Wycombe bus company in march. In 1999 a large operator of London, Surrey and
Sussex, Metrobus was acquired. During the privatisation of London Buses company purchased
London Central in 1994, in the same year the company was listed on the London Stock
Exchange. The second London Bus operator, London general was also acquired in 1996, during
the same year company entered the rail market operating the Thames Trains franchise. Director
⊘ This is a preview!⊘
Do you want full access?
Subscribe today to unlock all pages.
Trusted by 1+ million students worldwide
of Passenger Rail Franchising awarded Thames train franchise to Victory Rail Holdings. 65%
shares in the Victory Rail Holding was owned by Go-Ahead, in 1998 remaining shares which
they did not owned were bought by the company. VIA-GTI entered into a joint venture with Go-
Ahead, taking 65% stake in Govia.
Further the company diversified into Airport Services in 1998 after acquiring Gatwick
Handling international, which provided the ground handling services at UK airport. The product
and services offered by the company are the transport service including regional bus, London bus
and rail services. In the South of England the commercial bus businesses is operated by the
company's regional bus which they own 100% of the business. For the London bus, the company
operate on a tendered contract basis for the Transport of London. It operate in around 167 routes
from 17 depots, 85% of these depots are freehold. For the Department of Transport they operate
rail franchises currently UK's two rail franchises GTR and South-eastern are operated by Go-
Ahead with joint venture with Keolis. Currently Go-Ahead has the employed 28,000 employees
having a 11.3% employee turnover, its employee engagement is 65% for bus and 67% for rail, in
the past year they spent approx £21.1m for the training and development of the employees. In
2018 company has reported revenue amounting GBP 3462 millions and net profit of GBP 89
millions. Company's overall net profit margin is 2.57% (Annual Report of Go-Ahead Group Plc,
2018).
Vision
Go-Ahead vision is clear, company want to reach in FTSE 100 companies' list. Company
also has a vision to expand their business outside the UK. For this, company is continuously
working on creation of brand value in stock exchange and trying to improve their services to
knock the doors of global market.
Strategic Goals
Company is presently struggling with local issues like strikes of staff, decreasing rail
routes, dealing with tenders and regulatory changes. So first priority of company is to resolve
them by developing a dynamic strategy. Beside these company is facing competition by
multinational companies in same sector like First Group Plc to gain competitive advantages
company is following sustainability strategy while improving their services. So main strategic
Paraphrase This Document
Need a fresh take? Get an instant paraphrase of this document with our AI Paraphraser
goal of company in present scenario is to overcome these local threats and make expansion to
reduce competition by improving quality of services.
Financial Performance of Go-Ahead Group Plc:
Financial performance refers to critical analysis of an organisation's profitability,
liquidity, and dividend policy. Such analysis is generally done through accounting ratios which
assist to assess financial performance and health of organisation (Lusardi, 2012). Accounting
ratios are classified as profitability, liquidity and valuation. By performance analysis Go-Ahead
can identify variance in their current performance level and expectations of consumers. In this
context in Go-Ahead Plc during the last year overall revenue and net income has been decreased.
In year 2018 company has reported turnover of USD 3462 millions which was USD 3481
millions in 2017, indicating a downward trend of approx 0.55% in revenue. This decrease in
revenue is due to dispute and strike of railway staff but this is temporary. Company has earned a
net income of approx USD 89 millions in year 2018 and 2017 which showing null or 0% growth
in Net Profit. However from the year 2014 to 2017 company has reported remarkable growth
every year. Company is following sustainability strategy under which company improves its
exercisers to sustain their growth. Performance analysis focuses on gap between the consumers
expectation on the importance and judgement on performance of specific attribute of service
consumed. For comparison First Group Plc which is competitor of Go-Ahead Plc, is taken for
performance analysis.
A. Profitability Measurement:
Profitability measurement defines the ability of an organization to generate its profits as
well as helps in measuring the performance of an organization. There are various ratios such as
gross profit margin, net profit margin which helps in measuring the profitability.
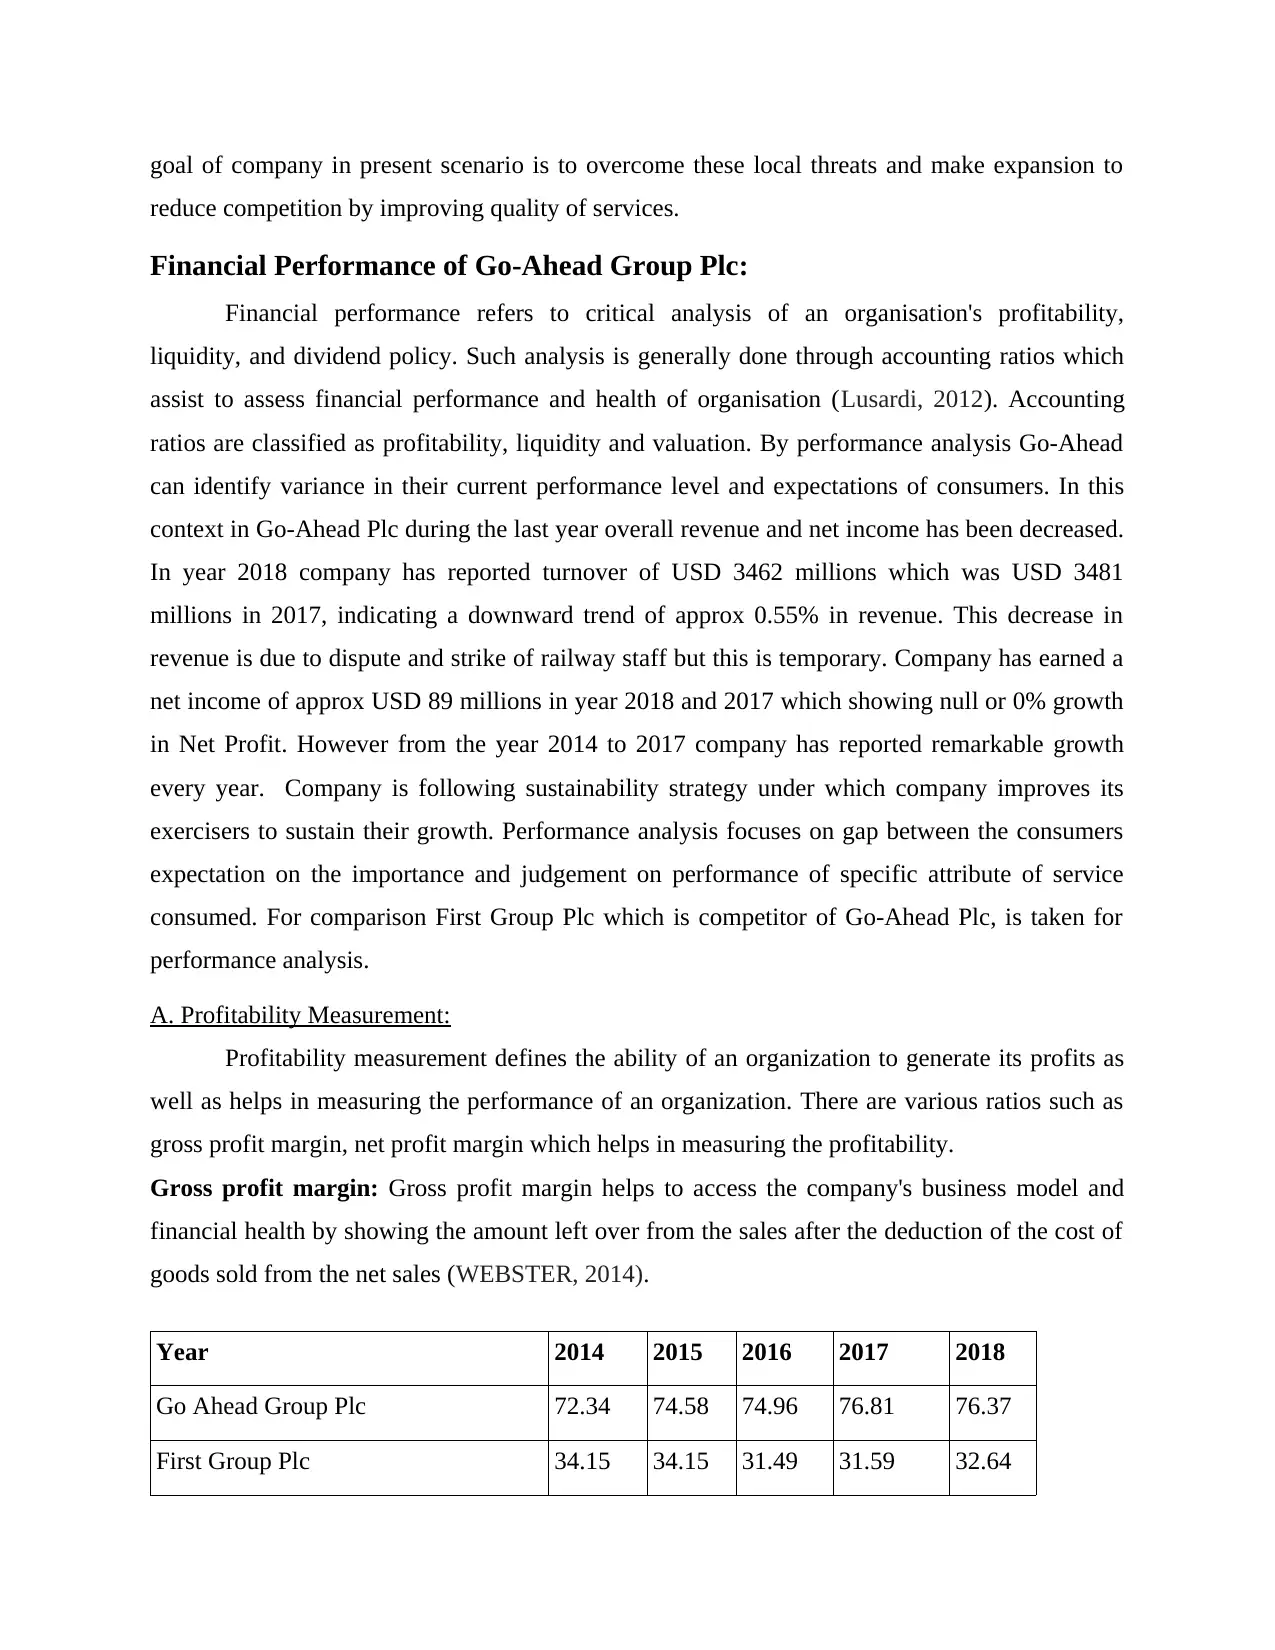
Gross profit margin: Gross profit margin helps to access the company's business model and
financial health by showing the amount left over from the sales after the deduction of the cost of
goods sold from the net sales (WEBSTER, 2014).
Year 2014 2015 2016 2017 2018
Go Ahead Group Plc 72.34 74.58 74.96 76.81 76.37
First Group Plc 34.15 34.15 31.49 31.59 32.64
reduce competition by improving quality of services.
Financial Performance of Go-Ahead Group Plc:
Financial performance refers to critical analysis of an organisation's profitability,
liquidity, and dividend policy. Such analysis is generally done through accounting ratios which
assist to assess financial performance and health of organisation (Lusardi, 2012). Accounting
ratios are classified as profitability, liquidity and valuation. By performance analysis Go-Ahead
can identify variance in their current performance level and expectations of consumers. In this
context in Go-Ahead Plc during the last year overall revenue and net income has been decreased.
In year 2018 company has reported turnover of USD 3462 millions which was USD 3481
millions in 2017, indicating a downward trend of approx 0.55% in revenue. This decrease in
revenue is due to dispute and strike of railway staff but this is temporary. Company has earned a
net income of approx USD 89 millions in year 2018 and 2017 which showing null or 0% growth
in Net Profit. However from the year 2014 to 2017 company has reported remarkable growth
every year. Company is following sustainability strategy under which company improves its
exercisers to sustain their growth. Performance analysis focuses on gap between the consumers
expectation on the importance and judgement on performance of specific attribute of service
consumed. For comparison First Group Plc which is competitor of Go-Ahead Plc, is taken for
performance analysis.
A. Profitability Measurement:
Profitability measurement defines the ability of an organization to generate its profits as
well as helps in measuring the performance of an organization. There are various ratios such as
gross profit margin, net profit margin which helps in measuring the profitability.
Gross profit margin: Gross profit margin helps to access the company's business model and
financial health by showing the amount left over from the sales after the deduction of the cost of
goods sold from the net sales (WEBSTER, 2014).
Year 2014 2015 2016 2017 2018
Go Ahead Group Plc 72.34 74.58 74.96 76.81 76.37
First Group Plc 34.15 34.15 31.49 31.59 32.64
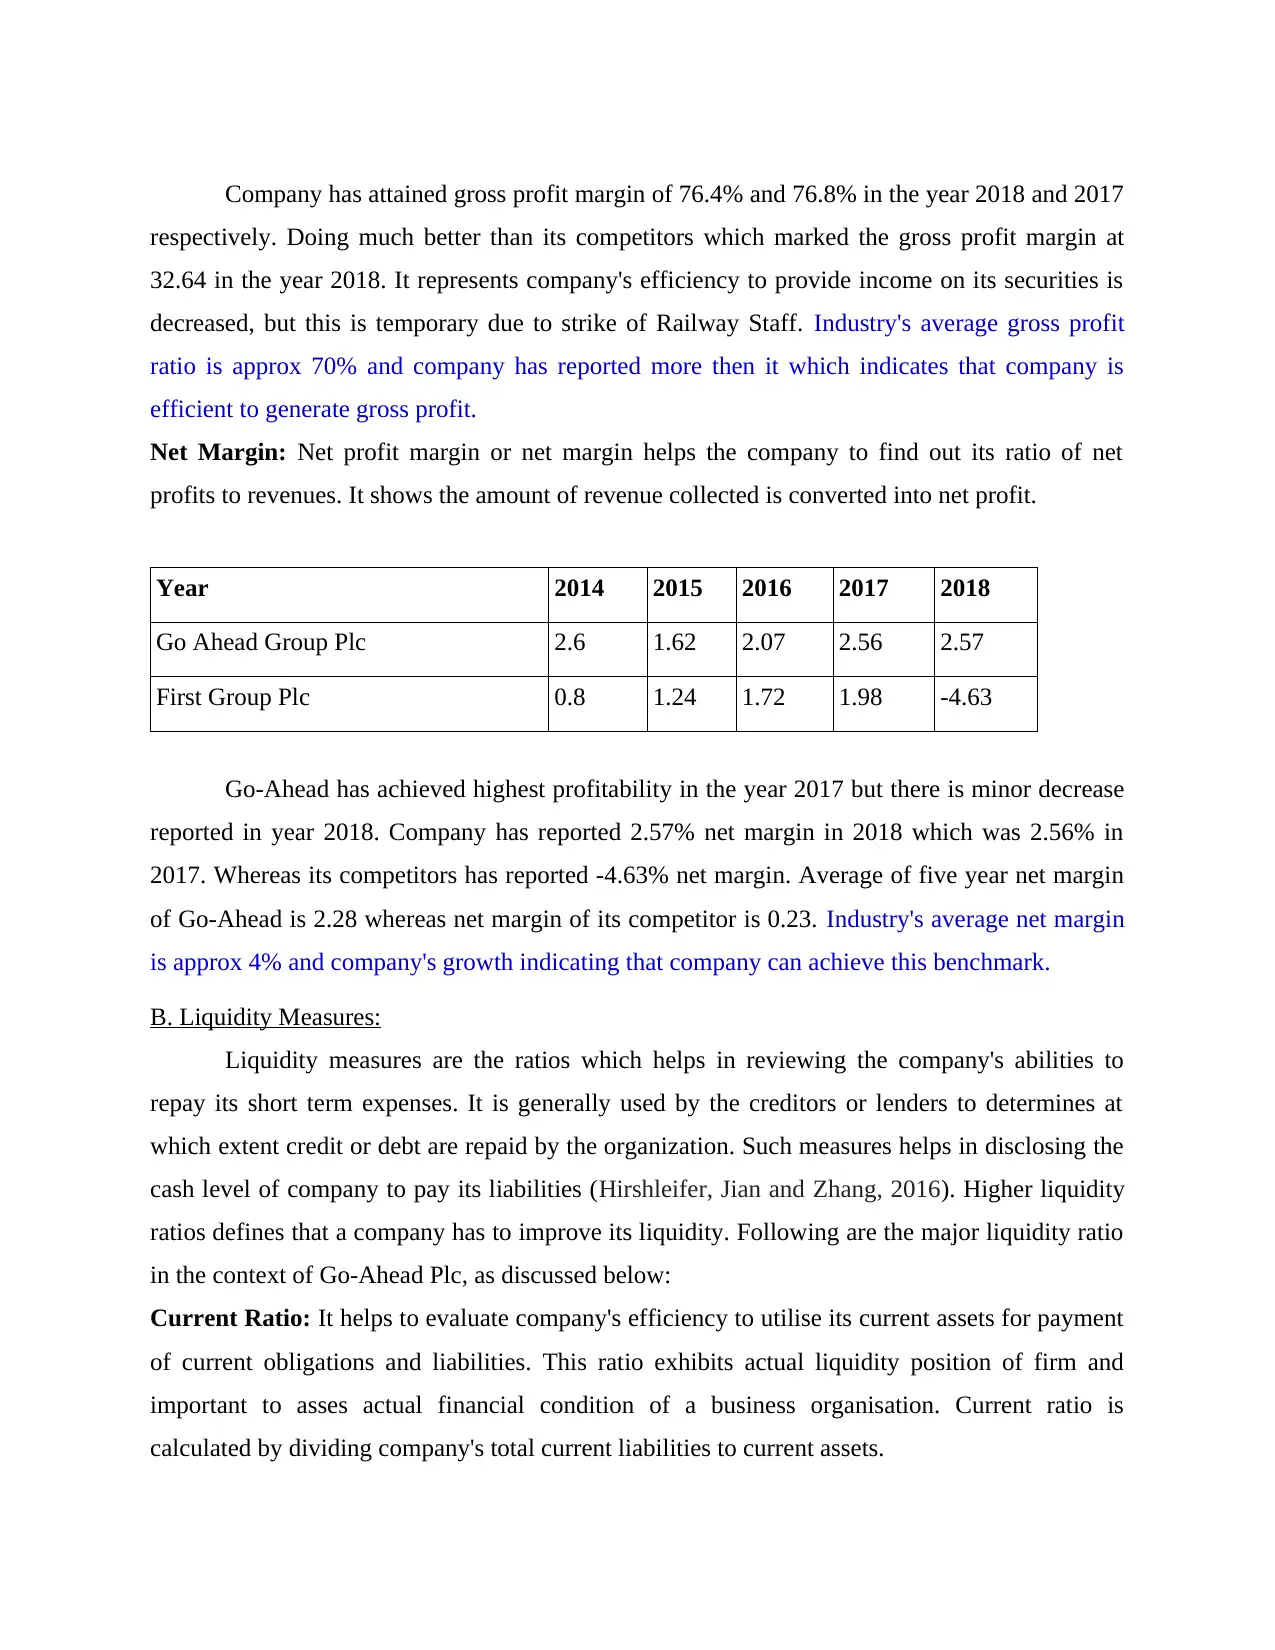
Company has attained gross profit margin of 76.4% and 76.8% in the year 2018 and 2017
respectively. Doing much better than its competitors which marked the gross profit margin at
32.64 in the year 2018. It represents company's efficiency to provide income on its securities is
decreased, but this is temporary due to strike of Railway Staff. Industry's average gross profit
ratio is approx 70% and company has reported more then it which indicates that company is
efficient to generate gross profit.
Net Margin: Net profit margin or net margin helps the company to find out its ratio of net
profits to revenues. It shows the amount of revenue collected is converted into net profit.
Year 2014 2015 2016 2017 2018
Go Ahead Group Plc 2.6 1.62 2.07 2.56 2.57
First Group Plc 0.8 1.24 1.72 1.98 -4.63
Go-Ahead has achieved highest profitability in the year 2017 but there is minor decrease
reported in year 2018. Company has reported 2.57% net margin in 2018 which was 2.56% in
2017. Whereas its competitors has reported -4.63% net margin. Average of five year net margin
of Go-Ahead is 2.28 whereas net margin of its competitor is 0.23. Industry's average net margin
is approx 4% and company's growth indicating that company can achieve this benchmark.
B. Liquidity Measures:
Liquidity measures are the ratios which helps in reviewing the company's abilities to
repay its short term expenses. It is generally used by the creditors or lenders to determines at
which extent credit or debt are repaid by the organization. Such measures helps in disclosing the
cash level of company to pay its liabilities (Hirshleifer, Jian and Zhang, 2016). Higher liquidity
ratios defines that a company has to improve its liquidity. Following are the major liquidity ratio
in the context of Go-Ahead Plc, as discussed below:
Current Ratio: It helps to evaluate company's efficiency to utilise its current assets for payment
of current obligations and liabilities. This ratio exhibits actual liquidity position of firm and
important to asses actual financial condition of a business organisation. Current ratio is
calculated by dividing company's total current liabilities to current assets.
⊘ This is a preview!⊘
Do you want full access?
Subscribe today to unlock all pages.
Trusted by 1+ million students worldwide
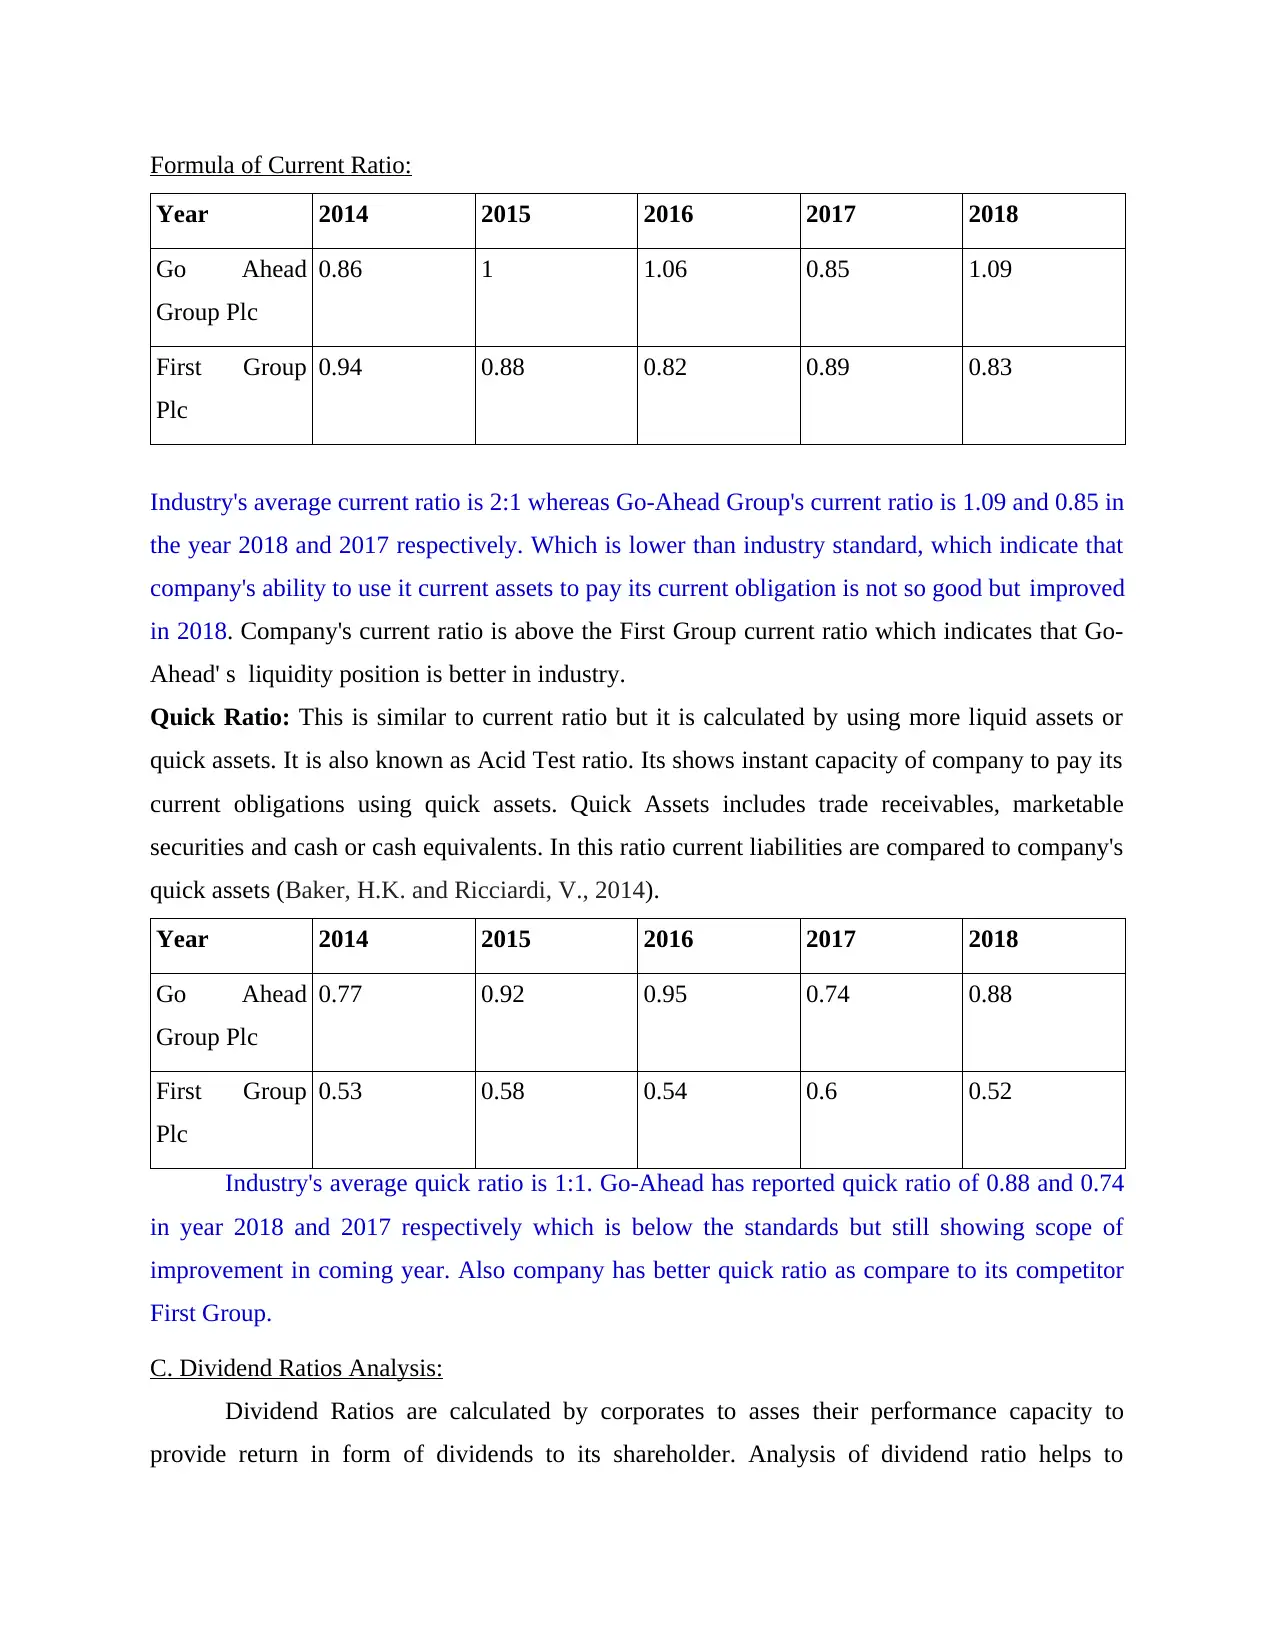
Formula of Current Ratio:
Year 2014 2015 2016 2017 2018
Go Ahead
Group Plc
0.86 1 1.06 0.85 1.09
First Group
Plc
0.94 0.88 0.82 0.89 0.83
Industry's average current ratio is 2:1 whereas Go-Ahead Group's current ratio is 1.09 and 0.85 in
the year 2018 and 2017 respectively. Which is lower than industry standard, which indicate that
company's ability to use it current assets to pay its current obligation is not so good but improved
in 2018. Company's current ratio is above the First Group current ratio which indicates that Go-
Ahead' s liquidity position is better in industry.
Quick Ratio: This is similar to current ratio but it is calculated by using more liquid assets or
quick assets. It is also known as Acid Test ratio. Its shows instant capacity of company to pay its
current obligations using quick assets. Quick Assets includes trade receivables, marketable
securities and cash or cash equivalents. In this ratio current liabilities are compared to company's
quick assets (Baker, H.K. and Ricciardi, V., 2014).
Year 2014 2015 2016 2017 2018
Go Ahead
Group Plc
0.77 0.92 0.95 0.74 0.88
First Group
Plc
0.53 0.58 0.54 0.6 0.52
Industry's average quick ratio is 1:1. Go-Ahead has reported quick ratio of 0.88 and 0.74
in year 2018 and 2017 respectively which is below the standards but still showing scope of
improvement in coming year. Also company has better quick ratio as compare to its competitor
First Group.
C. Dividend Ratios Analysis:
Dividend Ratios are calculated by corporates to asses their performance capacity to
provide return in form of dividends to its shareholder. Analysis of dividend ratio helps to
Year 2014 2015 2016 2017 2018
Go Ahead
Group Plc
0.86 1 1.06 0.85 1.09
First Group
Plc
0.94 0.88 0.82 0.89 0.83
Industry's average current ratio is 2:1 whereas Go-Ahead Group's current ratio is 1.09 and 0.85 in
the year 2018 and 2017 respectively. Which is lower than industry standard, which indicate that
company's ability to use it current assets to pay its current obligation is not so good but improved
in 2018. Company's current ratio is above the First Group current ratio which indicates that Go-
Ahead' s liquidity position is better in industry.
Quick Ratio: This is similar to current ratio but it is calculated by using more liquid assets or
quick assets. It is also known as Acid Test ratio. Its shows instant capacity of company to pay its
current obligations using quick assets. Quick Assets includes trade receivables, marketable
securities and cash or cash equivalents. In this ratio current liabilities are compared to company's
quick assets (Baker, H.K. and Ricciardi, V., 2014).
Year 2014 2015 2016 2017 2018
Go Ahead
Group Plc
0.77 0.92 0.95 0.74 0.88
First Group
Plc
0.53 0.58 0.54 0.6 0.52
Industry's average quick ratio is 1:1. Go-Ahead has reported quick ratio of 0.88 and 0.74
in year 2018 and 2017 respectively which is below the standards but still showing scope of
improvement in coming year. Also company has better quick ratio as compare to its competitor
First Group.
C. Dividend Ratios Analysis:
Dividend Ratios are calculated by corporates to asses their performance capacity to
provide return in form of dividends to its shareholder. Analysis of dividend ratio helps to
Paraphrase This Document
Need a fresh take? Get an instant paraphrase of this document with our AI Paraphraser
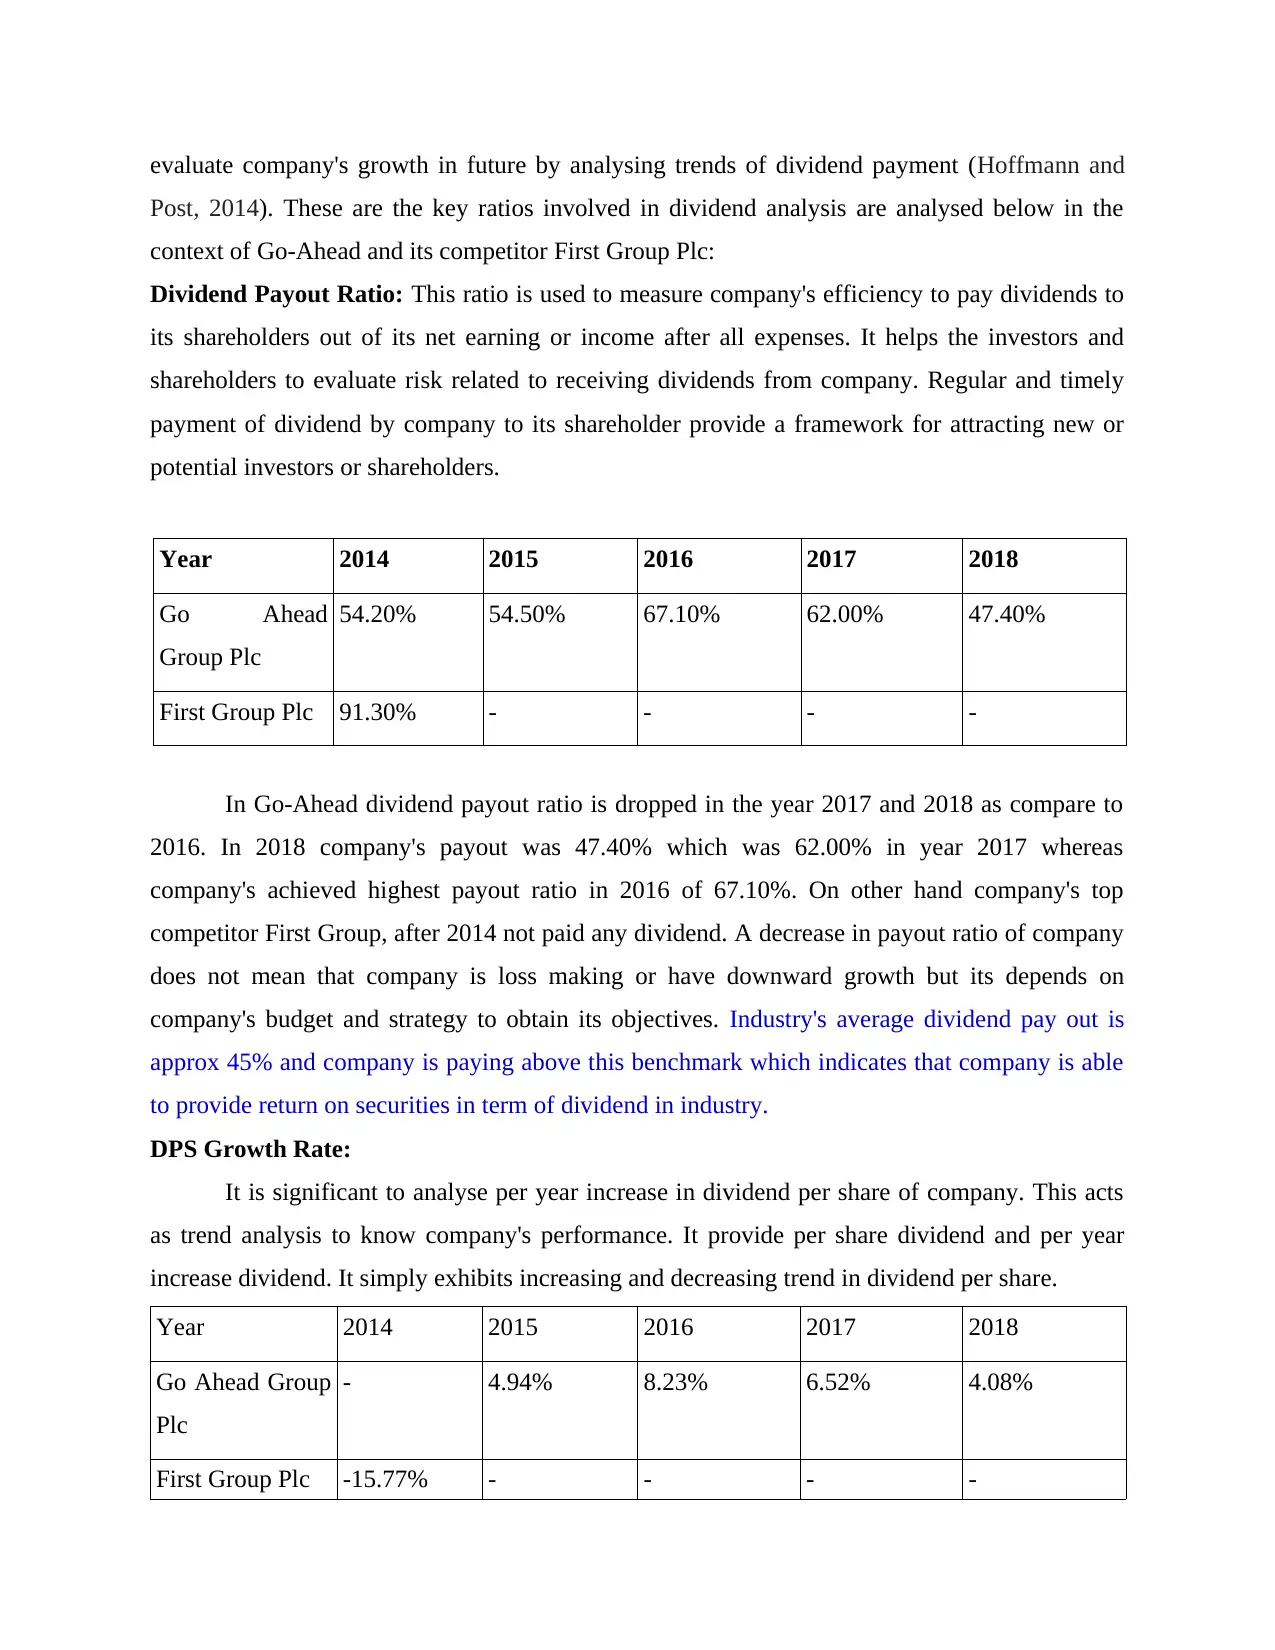
evaluate company's growth in future by analysing trends of dividend payment (Hoffmann and
Post, 2014). These are the key ratios involved in dividend analysis are analysed below in the
context of Go-Ahead and its competitor First Group Plc:
Dividend Payout Ratio: This ratio is used to measure company's efficiency to pay dividends to
its shareholders out of its net earning or income after all expenses. It helps the investors and
shareholders to evaluate risk related to receiving dividends from company. Regular and timely
payment of dividend by company to its shareholder provide a framework for attracting new or
potential investors or shareholders.
Year 2014 2015 2016 2017 2018
Go Ahead
Group Plc
54.20% 54.50% 67.10% 62.00% 47.40%
First Group Plc 91.30% - - - -
In Go-Ahead dividend payout ratio is dropped in the year 2017 and 2018 as compare to
2016. In 2018 company's payout was 47.40% which was 62.00% in year 2017 whereas
company's achieved highest payout ratio in 2016 of 67.10%. On other hand company's top
competitor First Group, after 2014 not paid any dividend. A decrease in payout ratio of company
does not mean that company is loss making or have downward growth but its depends on
company's budget and strategy to obtain its objectives. Industry's average dividend pay out is
approx 45% and company is paying above this benchmark which indicates that company is able
to provide return on securities in term of dividend in industry.
DPS Growth Rate:
It is significant to analyse per year increase in dividend per share of company. This acts
as trend analysis to know company's performance. It provide per share dividend and per year
increase dividend. It simply exhibits increasing and decreasing trend in dividend per share.
Year 2014 2015 2016 2017 2018
Go Ahead Group
Plc
- 4.94% 8.23% 6.52% 4.08%
First Group Plc -15.77% - - - -
There is positive growth in DPS of Go-Ahead, however in year 2018 and 2017 growth
rate is decreased but DPS in increased in both year as compare to previous years. Whereas in
First Group there was a negative growth reported by company in year 2014. Industry's average
DPS growth rate is approx 5% and company's rate is decreased below industry's average in 2018
but it is temporary.
⊘ This is a preview!⊘
Do you want full access?
Subscribe today to unlock all pages.
Trusted by 1+ million students worldwide

Critical Reflection on Genus plc's portrayal in the news
Paraphrase This Document
Need a fresh take? Get an instant paraphrase of this document with our AI Paraphraser
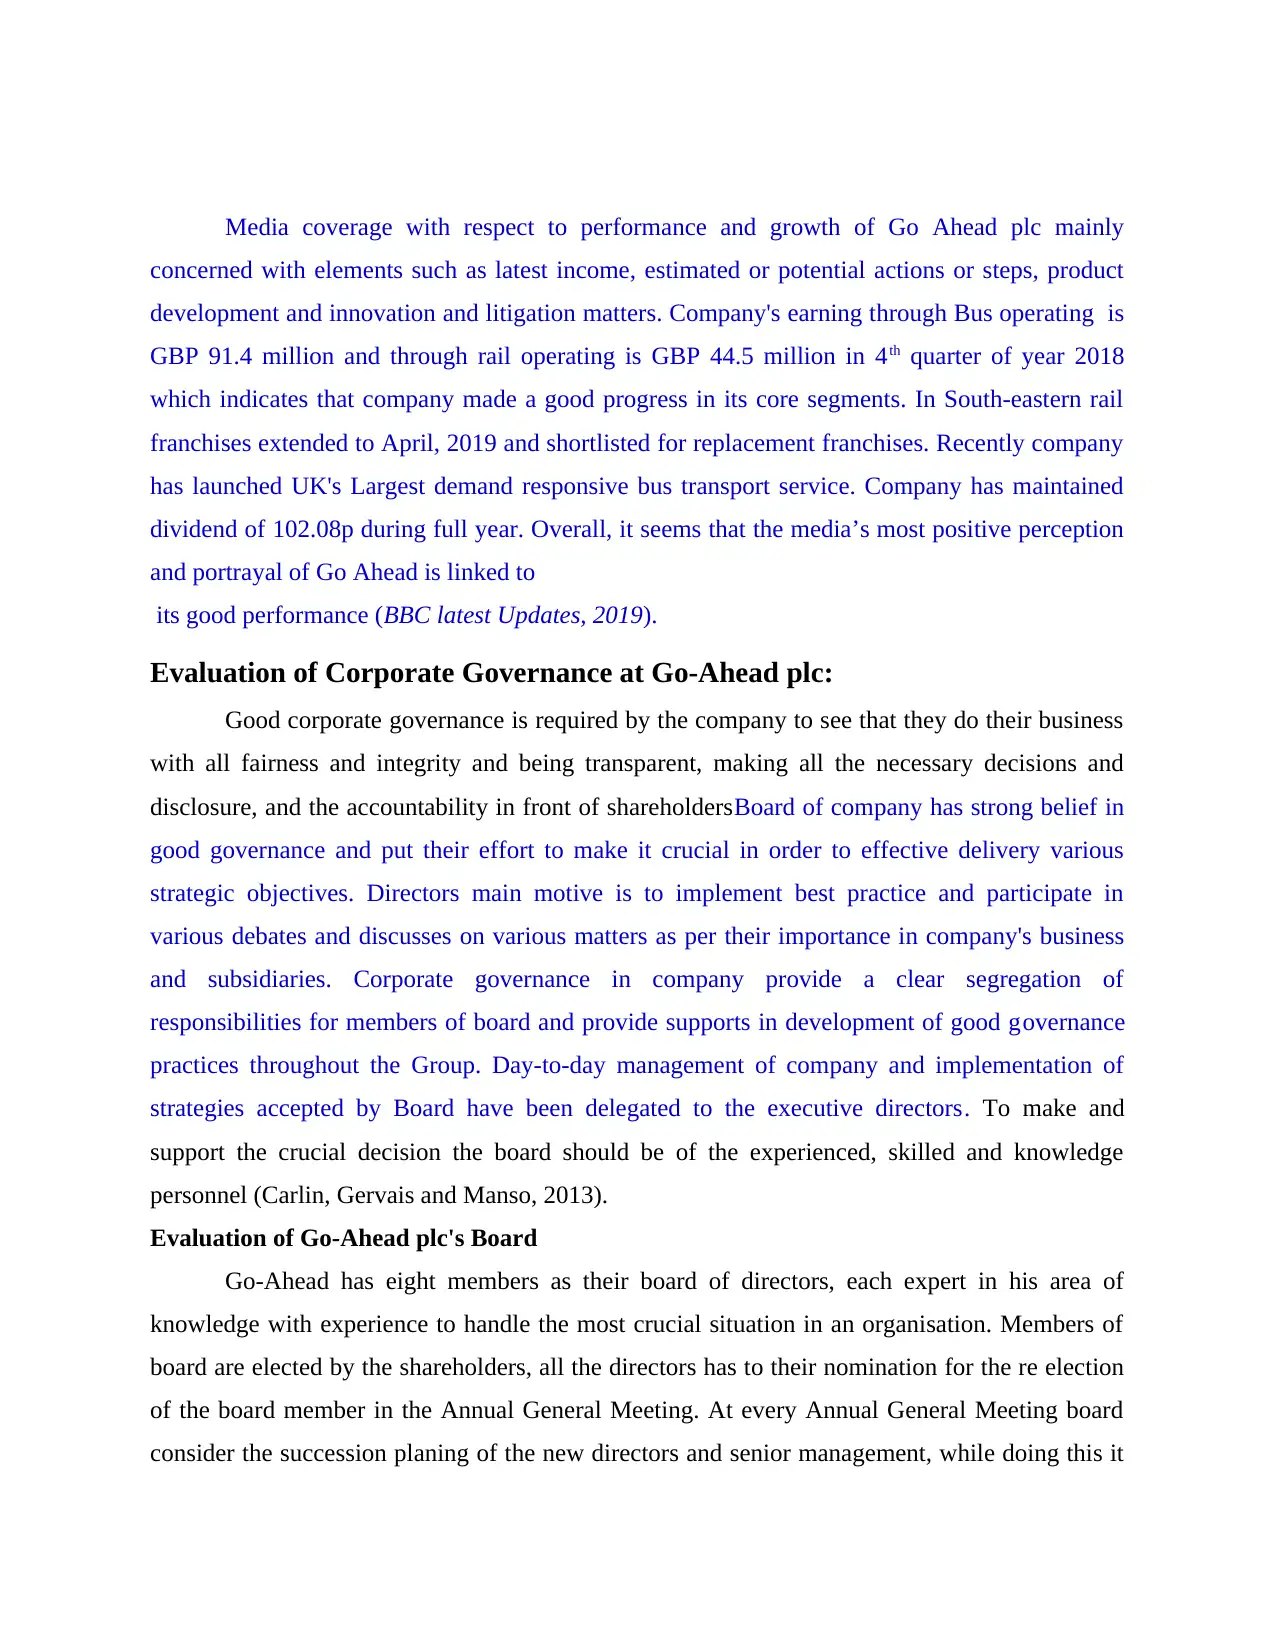
Media coverage with respect to performance and growth of Go Ahead plc mainly
concerned with elements such as latest income, estimated or potential actions or steps, product
development and innovation and litigation matters. Company's earning through Bus operating is
GBP 91.4 million and through rail operating is GBP 44.5 million in 4th quarter of year 2018
which indicates that company made a good progress in its core segments. In South-eastern rail
franchises extended to April, 2019 and shortlisted for replacement franchises. Recently company
has launched UK's Largest demand responsive bus transport service. Company has maintained
dividend of 102.08p during full year. Overall, it seems that the media’s most positive perception
and portrayal of Go Ahead is linked to
its good performance (BBC latest Updates, 2019).
Evaluation of Corporate Governance at Go-Ahead plc:
Good corporate governance is required by the company to see that they do their business
with all fairness and integrity and being transparent, making all the necessary decisions and
disclosure, and the accountability in front of shareholdersBoard of company has strong belief in
good governance and put their effort to make it crucial in order to effective delivery various
strategic objectives. Directors main motive is to implement best practice and participate in
various debates and discusses on various matters as per their importance in company's business
and subsidiaries. Corporate governance in company provide a clear segregation of
responsibilities for members of board and provide supports in development of good governance
practices throughout the Group. Day-to-day management of company and implementation of
strategies accepted by Board have been delegated to the executive directors. To make and
support the crucial decision the board should be of the experienced, skilled and knowledge
personnel (Carlin, Gervais and Manso, 2013).
Evaluation of Go-Ahead plc's Board
Go-Ahead has eight members as their board of directors, each expert in his area of
knowledge with experience to handle the most crucial situation in an organisation. Members of
board are elected by the shareholders, all the directors has to their nomination for the re election
of the board member in the Annual General Meeting. At every Annual General Meeting board
consider the succession planing of the new directors and senior management, while doing this it
consider the opportunities and experience which is to be required by the board in the future. To
deal with the specific aspects of the Group's affair the board establishes the audit, nomination
and remuneration committees. To enhance the work of the board different remuneration are
given to the whole team so that they do their work with more efficiently with maximum
efficiency.
Board of directors have significance influence in the organisation which helps them to
grow and do well in this competitive environment. In a year the company hold nine scheduled
meeting, which includes the meeting which are held to review the group's strategy.
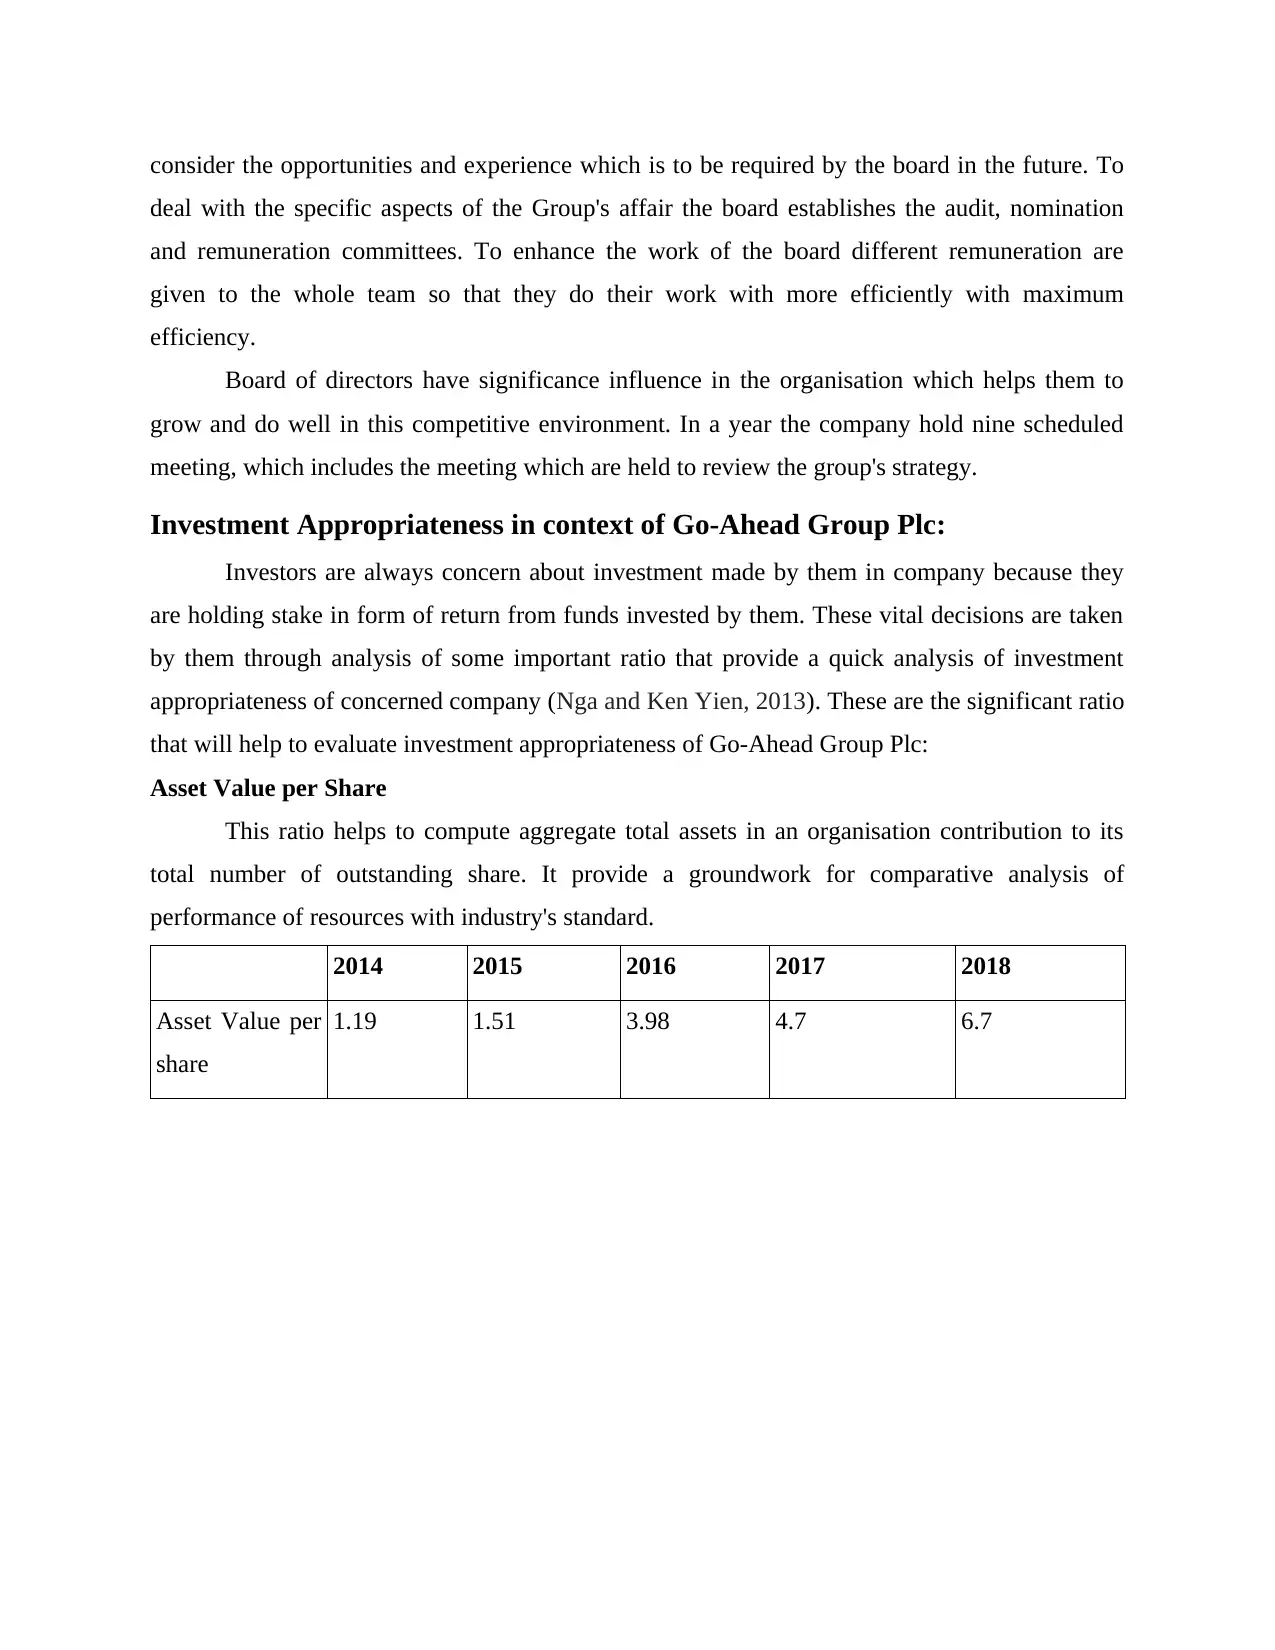
Investment Appropriateness in context of Go-Ahead Group Plc:
Investors are always concern about investment made by them in company because they
are holding stake in form of return from funds invested by them. These vital decisions are taken
by them through analysis of some important ratio that provide a quick analysis of investment
appropriateness of concerned company (Nga and Ken Yien, 2013). These are the significant ratio
that will help to evaluate investment appropriateness of Go-Ahead Group Plc:
Asset Value per Share
This ratio helps to compute aggregate total assets in an organisation contribution to its
total number of outstanding share. It provide a groundwork for comparative analysis of
performance of resources with industry's standard.
2014 2015 2016 2017 2018
Asset Value per
share
1.19 1.51 3.98 4.7 6.7
deal with the specific aspects of the Group's affair the board establishes the audit, nomination
and remuneration committees. To enhance the work of the board different remuneration are
given to the whole team so that they do their work with more efficiently with maximum
efficiency.
Board of directors have significance influence in the organisation which helps them to
grow and do well in this competitive environment. In a year the company hold nine scheduled
meeting, which includes the meeting which are held to review the group's strategy.
Investment Appropriateness in context of Go-Ahead Group Plc:
Investors are always concern about investment made by them in company because they
are holding stake in form of return from funds invested by them. These vital decisions are taken
by them through analysis of some important ratio that provide a quick analysis of investment
appropriateness of concerned company (Nga and Ken Yien, 2013). These are the significant ratio
that will help to evaluate investment appropriateness of Go-Ahead Group Plc:
Asset Value per Share
This ratio helps to compute aggregate total assets in an organisation contribution to its
total number of outstanding share. It provide a groundwork for comparative analysis of
performance of resources with industry's standard.
2014 2015 2016 2017 2018
Asset Value per
share
1.19 1.51 3.98 4.7 6.7
⊘ This is a preview!⊘
Do you want full access?
Subscribe today to unlock all pages.
Trusted by 1+ million students worldwide
1 out of 18


Your All-in-One AI-Powered Toolkit for Academic Success.
+13062052269
info@desklib.com
Available 24*7 on WhatsApp / Email
![[object Object]](/_next/static/media/star-bottom.7253800d.svg)
Unlock your academic potential
Copyright © 2020–2026 A2Z Services. All Rights Reserved. Developed and managed by ZUCOL.