QAA Level 7 Financial Decision Making: Harvey Homes Plc Case Study
VerifiedAdded on 2020/07/22
|16
|5699
|44
Report
AI Summary
This report presents a comprehensive financial analysis of Harvey Homes Plc, evaluating its business performance and financial position. The analysis includes a detailed examination of the company's statement of profit or loss, statement of financial position, and statement of cash flow, alongside the calculation and interpretation of various financial ratios such as profitability, liquidity, solvency, and efficiency ratios. Furthermore, the report delves into market segment analysis and investment appraisal techniques, including payback period, accounting rate of return, and net present value, to assess the viability of the Midland acquisition. The executive summary highlights key financial highlights, including revenue, gross profit, and net profit, along with an assessment of the company's strengths and weaknesses. Recommendations are provided for future expansion and financial management. The report concludes with a recommendation to undertake the Midland project and suggests strategies to maximize its performance.
Module name Financial Decision Making
QAA Level 7
Schedule Term One
Student Reference Number (SRN) BP0168166
Report/Assignment Title CASE STUDY – HARVEY HOMES plc
Date of Submission
(Please attach the confirmation of
any extension received)
QAA Level 7
Schedule Term One
Student Reference Number (SRN) BP0168166
Report/Assignment Title CASE STUDY – HARVEY HOMES plc
Date of Submission
(Please attach the confirmation of
any extension received)
Paraphrase This Document
Need a fresh take? Get an instant paraphrase of this document with our AI Paraphraser
FINANCIAL
DECISION MAKING
DECISION MAKING
Table of Contents
EXEUCTIVE SUMMARY.............................................................................................................1
PART 1: BUSINSS PERFORMANCE ANALYSIS......................................................................2
Statement of profit or loss............................................................................................................2
Statement of financial position....................................................................................................4
Liquidity & working capital.........................................................................................................4
Solvency ratios.............................................................................................................................6
Efficiency ratios...........................................................................................................................7
Statement of cash flow.................................................................................................................7
Market Segment analysis.............................................................................................................9
PART 2 INVESTMENT APPRAISALS.......................................................................................10
Management forecast.................................................................................................................10
Investment appraisal techniques................................................................................................11
Payback period...........................................................................................................................11
Accounting rate of return...........................................................................................................12
Net present value........................................................................................................................12
Sources of finance......................................................................................................................13
Non-Financial factors.................................................................................................................13
REFERENCES..............................................................................................................................15
APPENDIX....................................................................................................................................17
Appendix 1: Profitability ratios..................................................................................................17
Appendix 2: Absolute & percentage change in overhead..........................................................17
Appendix 3: Calculation of liquidity ratios................................................................................18
Appendix 4: Calculation of solvency ratios...............................................................................18
⊘ This is a preview!⊘
Do you want full access?
Subscribe today to unlock all pages.
Trusted by 1+ million students worldwide
Appendix 5: Calculation of efficiency ratios.............................................................................18
Appendix 6: Calculation of operating cash cycle or cash conversion cycle..............................19
Appendix 7: Market segmental analysis....................................................................................19
Appendix 6: Calculation of operating cash cycle or cash conversion cycle..............................19
Appendix 7: Market segmental analysis....................................................................................19
Paraphrase This Document
Need a fresh take? Get an instant paraphrase of this document with our AI Paraphraser
Index of Figures
Figure 1 Graph of Harvey Homes Plc's profitability ratios.............................................................2
Figure 2 Changes in operational cost from 2015 to 2016................................................................3
Figure 3 Current ratio and quick ratio of Harvey Homes Plc..........................................................5
Figure 4 Debt to equity and interest bearing ratio of Harvey Homes plc........................................6
Figure 5 Assets turnover ratio & inventory turnover ratio of Harvey Homes Plc...........................7
Figure 6 Segmental revenue and operating profit of Harvey Homes Plc........................................9
Figure 7 Managerial forecast of Midland Acquisition..................................................................10
Figure 8 Net-cash flow for Midland Acquisition..........................................................................11
Index of Tables
Table 1 Calculation of profitability ratios.....................................................................................17
Table 2 Calculation of absolute and percentage change in operational cost.................................17
Table 3 Calculation of liquidity ratios...........................................................................................18
Table 4 Calculation of solvency ratios..........................................................................................18
Table 5 Calculation of efficiency ratios.........................................................................................18
Table 6 Calculation of cash conversion cycle...............................................................................19
Table 7 Market segmental analysis................................................................................................19
EXEUCTIVE SUMMARY
In today’s uncertain and turbulent corporate environment, volatility in the market such as
high cost of interest, inability to access external borrowings and others are the factors responsible
for financial risk. The present report had analyzed the performance and financial position of
Harvey Homes Plc which aims at delivering high-quality housing facilities to the people with the
objective of getting maximum return for the shareholders. Segmental analysis reported that
southern region’s GM & OM is reported highest to 30% and 24.60% whilst the Northern &
Midland’s profit margin is comparatively less. The reasons behind change this is operational cost
of Midland have been increased by 20% whilst in Northern region, it shown highest growth of
25% and in Southern, it reflects modest growth of 14.81%.
Key financial highlights
Year\(£m) Revenue Gross
profit
Net profit GM NM ROCE
2015 1083 272 171 25.12% 15.79% 20.29%
2016 1297 332 194 25.60% 14.96% 18.34%
% change 19.76% 22.06% 13.45% - - -
Financial statement analysis through different ratios founded that net profitability shows
poor results, however, company has good liquidity strength. It had taken loan in current year to
finances its Midland acquisition so as to manage solvency position. More debt borrowings will
enable it to reach the idle solvency ratio of 0.50:1. Moreover, for the further expansion in France,
it has been recommended to choose a combination of equity & debt for monetary collection for
the sound solvency management. Besides this, for maximizing Midland’s performance, firm is
required to be recommended to control cost, hire experienced managerial team and make sound
pricing decision to boost market demand.
Investment appraisal viability
Initial outlay £500m
Payback period 4 years 6 months
ARR 6%
Page 1
⊘ This is a preview!⊘
Do you want full access?
Subscribe today to unlock all pages.
Trusted by 1+ million students worldwide
NPV £22,000 Favorable
It clearly depicted that Harvey Homes Plc must undertaken its Midland project as it
indicates the possibility of favorable return worth £22,000 and high ARR of 6% than targeted
rate of 5%.
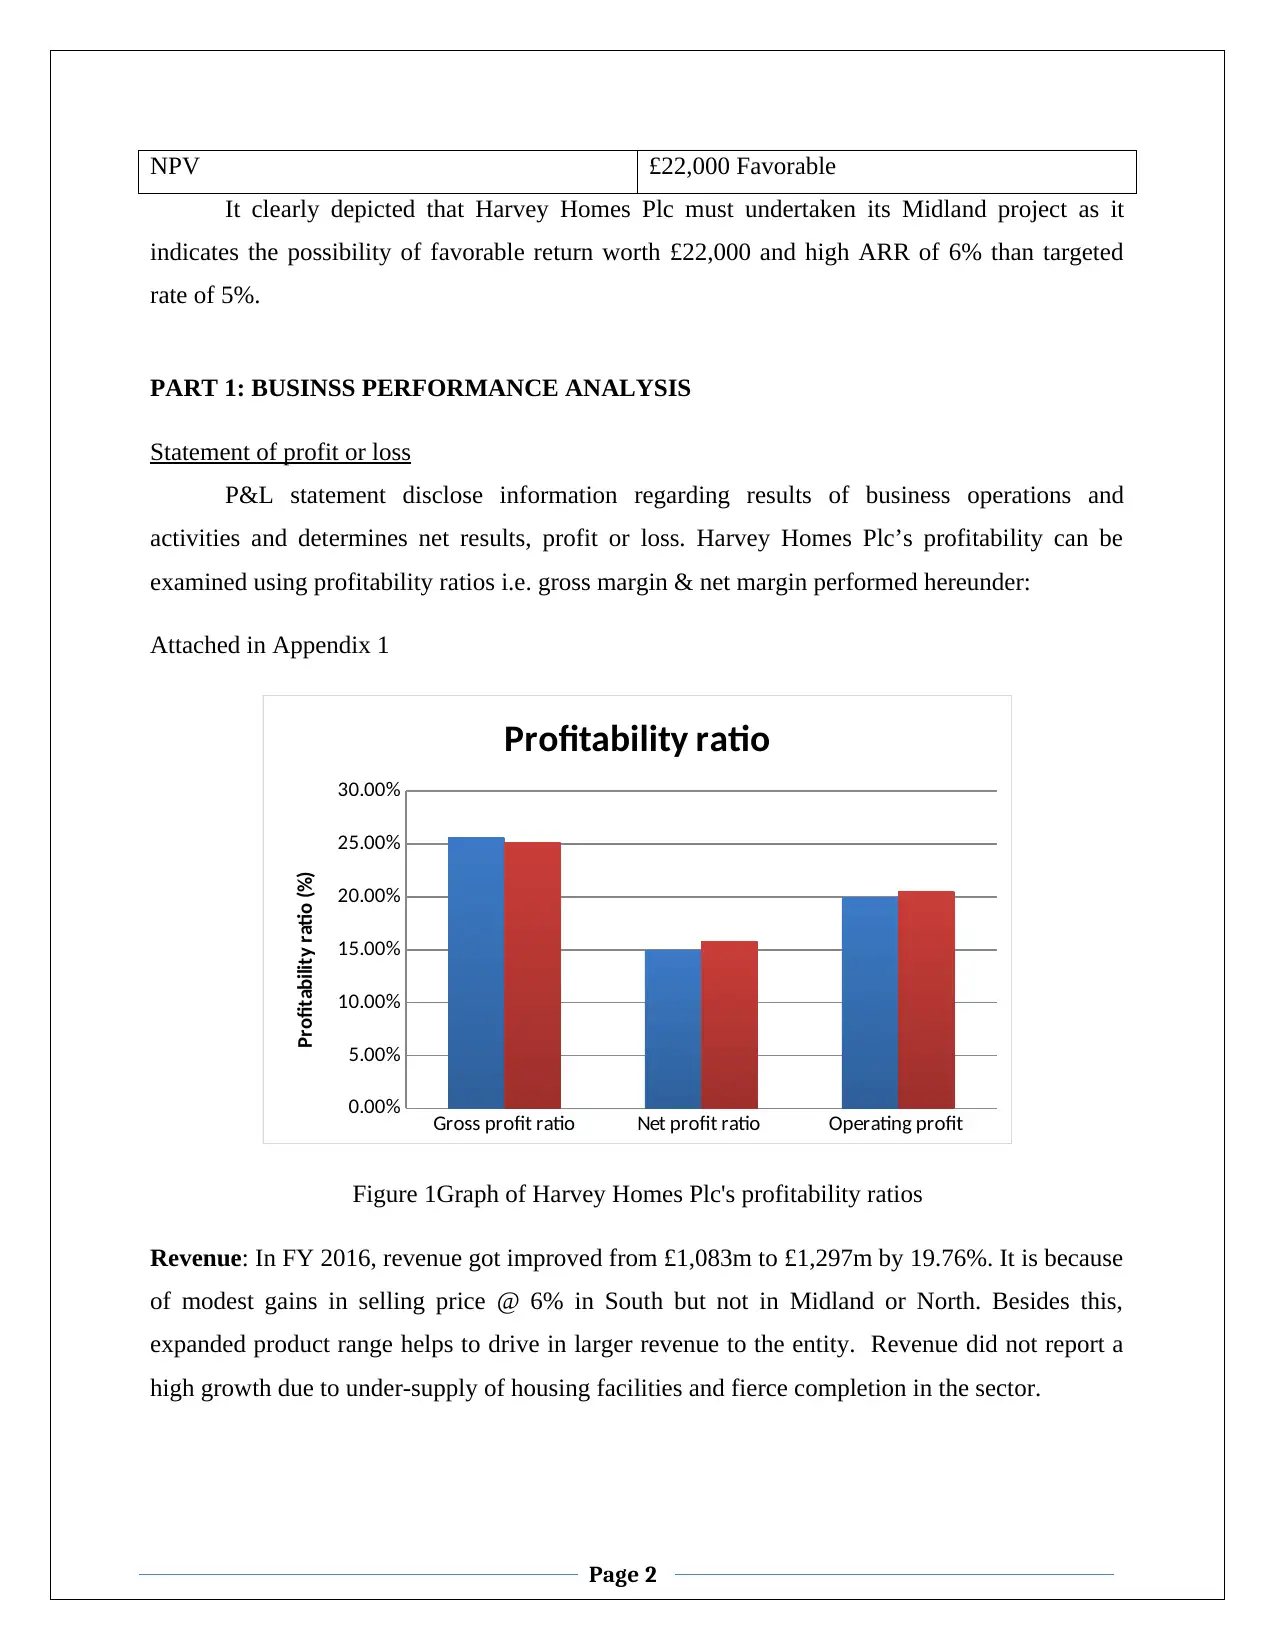
PART 1: BUSINSS PERFORMANCE ANALYSIS
Statement of profit or loss
P&L statement disclose information regarding results of business operations and
activities and determines net results, profit or loss. Harvey Homes Plc’s profitability can be
examined using profitability ratios i.e. gross margin & net margin performed hereunder:
Attached in Appendix 1
Gross profit ratio Net profit ratio Operating profit
0.00%
5.00%
10.00%
15.00%
20.00%
25.00%
30.00%
Profitability ratio
Profitability ratio (%)
Figure 1Graph of Harvey Homes Plc's profitability ratios
Revenue: In FY 2016, revenue got improved from £1,083m to £1,297m by 19.76%. It is because
of modest gains in selling price @ 6% in South but not in Midland or North. Besides this,
expanded product range helps to drive in larger revenue to the entity. Revenue did not report a
high growth due to under-supply of housing facilities and fierce completion in the sector.
Page 2
It clearly depicted that Harvey Homes Plc must undertaken its Midland project as it
indicates the possibility of favorable return worth £22,000 and high ARR of 6% than targeted
rate of 5%.
PART 1: BUSINSS PERFORMANCE ANALYSIS
Statement of profit or loss
P&L statement disclose information regarding results of business operations and
activities and determines net results, profit or loss. Harvey Homes Plc’s profitability can be
examined using profitability ratios i.e. gross margin & net margin performed hereunder:
Attached in Appendix 1
Gross profit ratio Net profit ratio Operating profit
0.00%
5.00%
10.00%
15.00%
20.00%
25.00%
30.00%
Profitability ratio
Profitability ratio (%)
Figure 1Graph of Harvey Homes Plc's profitability ratios
Revenue: In FY 2016, revenue got improved from £1,083m to £1,297m by 19.76%. It is because
of modest gains in selling price @ 6% in South but not in Midland or North. Besides this,
expanded product range helps to drive in larger revenue to the entity. Revenue did not report a
high growth due to under-supply of housing facilities and fierce completion in the sector.
Page 2
Paraphrase This Document
Need a fresh take? Get an instant paraphrase of this document with our AI Paraphraser
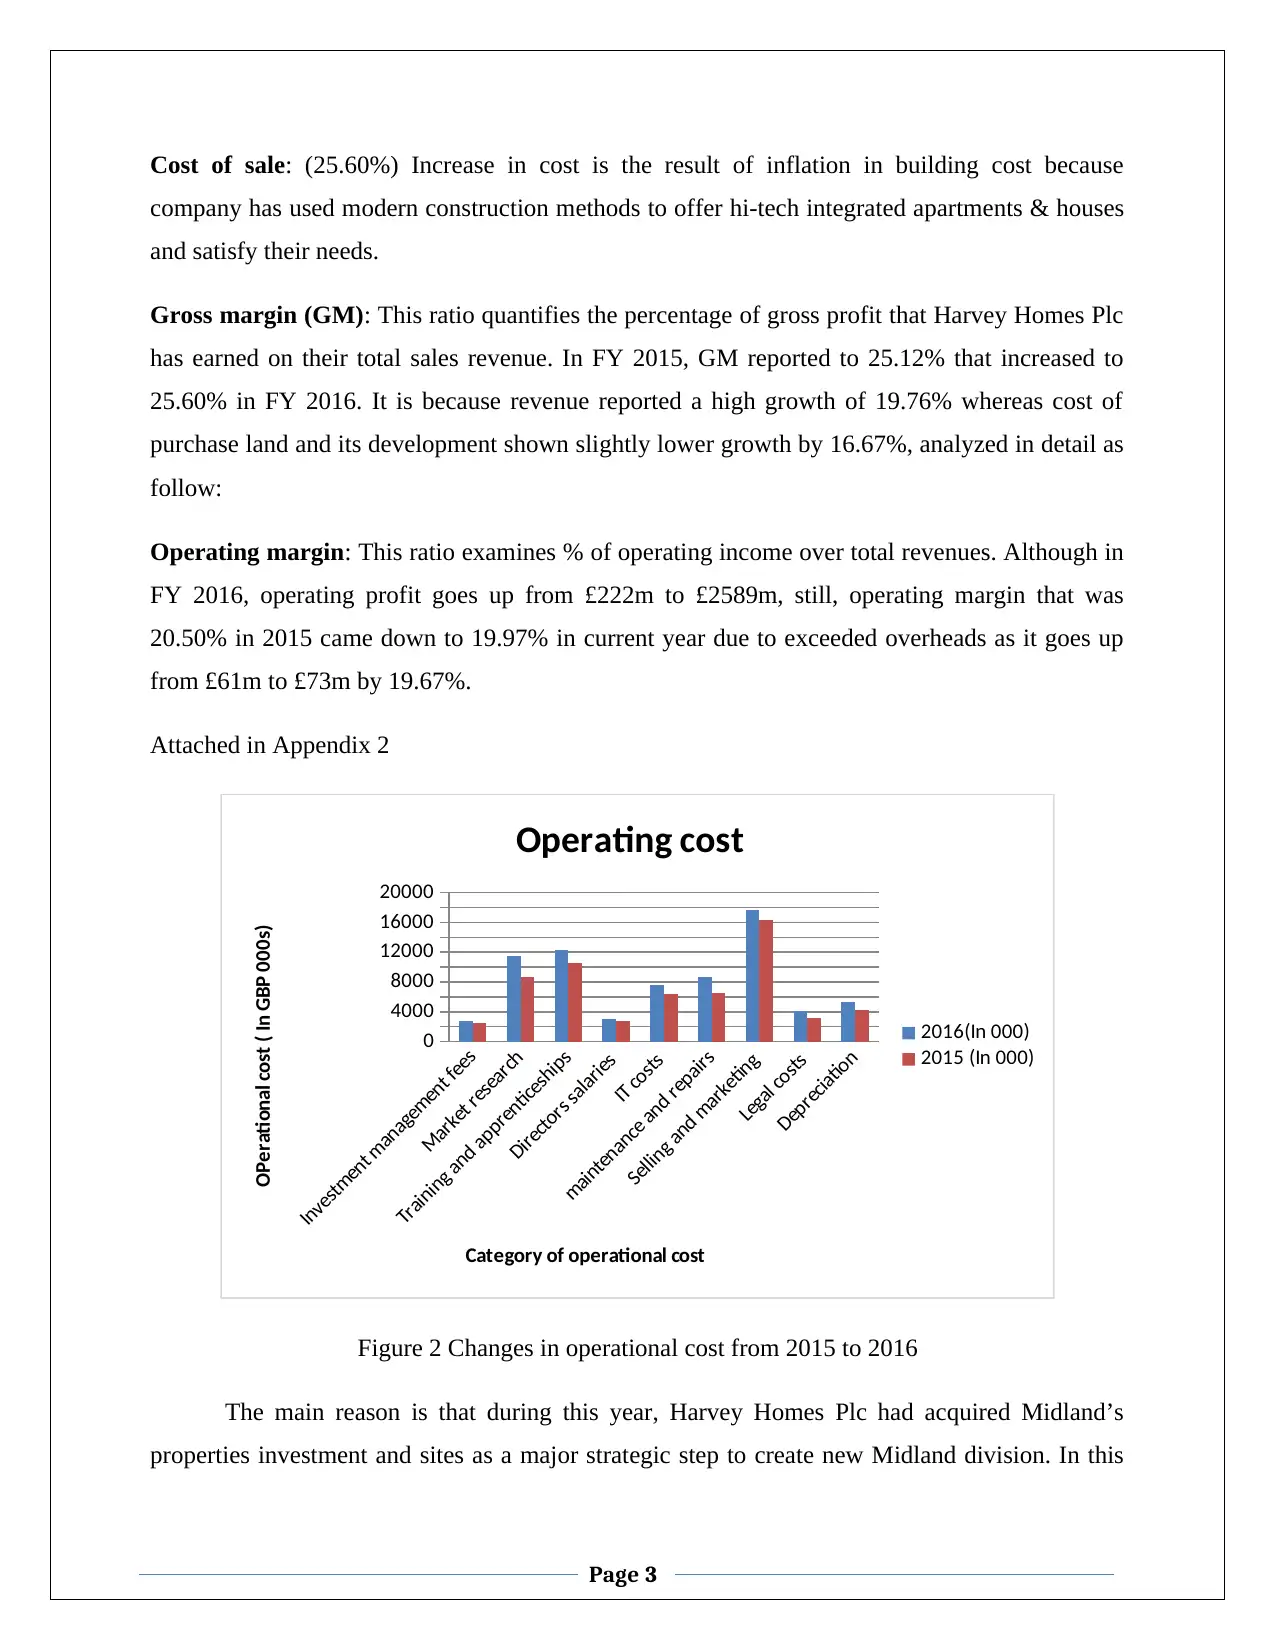
Cost of sale: (25.60%) Increase in cost is the result of inflation in building cost because
company has used modern construction methods to offer hi-tech integrated apartments & houses
and satisfy their needs.
Gross margin (GM): This ratio quantifies the percentage of gross profit that Harvey Homes Plc
has earned on their total sales revenue. In FY 2015, GM reported to 25.12% that increased to
25.60% in FY 2016. It is because revenue reported a high growth of 19.76% whereas cost of
purchase land and its development shown slightly lower growth by 16.67%, analyzed in detail as
follow:
Operating margin: This ratio examines % of operating income over total revenues. Although in
FY 2016, operating profit goes up from £222m to £2589m, still, operating margin that was
20.50% in 2015 came down to 19.97% in current year due to exceeded overheads as it goes up
from £61m to £73m by 19.67%.
Attached in Appendix 2
Investment management fees
Market research
Training and apprenticeships
Directors salaries
IT costs
maintenance and repairs
Selling and marketing
Legal costs
Depreciation
0
4000
8000
12000
16000
20000
Operating cost
2016(In 000)
2015 (In 000)
Category of operational cost
OPerational cost ( In GBP 000s)
Figure 2 Changes in operational cost from 2015 to 2016
The main reason is that during this year, Harvey Homes Plc had acquired Midland’s
properties investment and sites as a major strategic step to create new Midland division. In this
Page 3
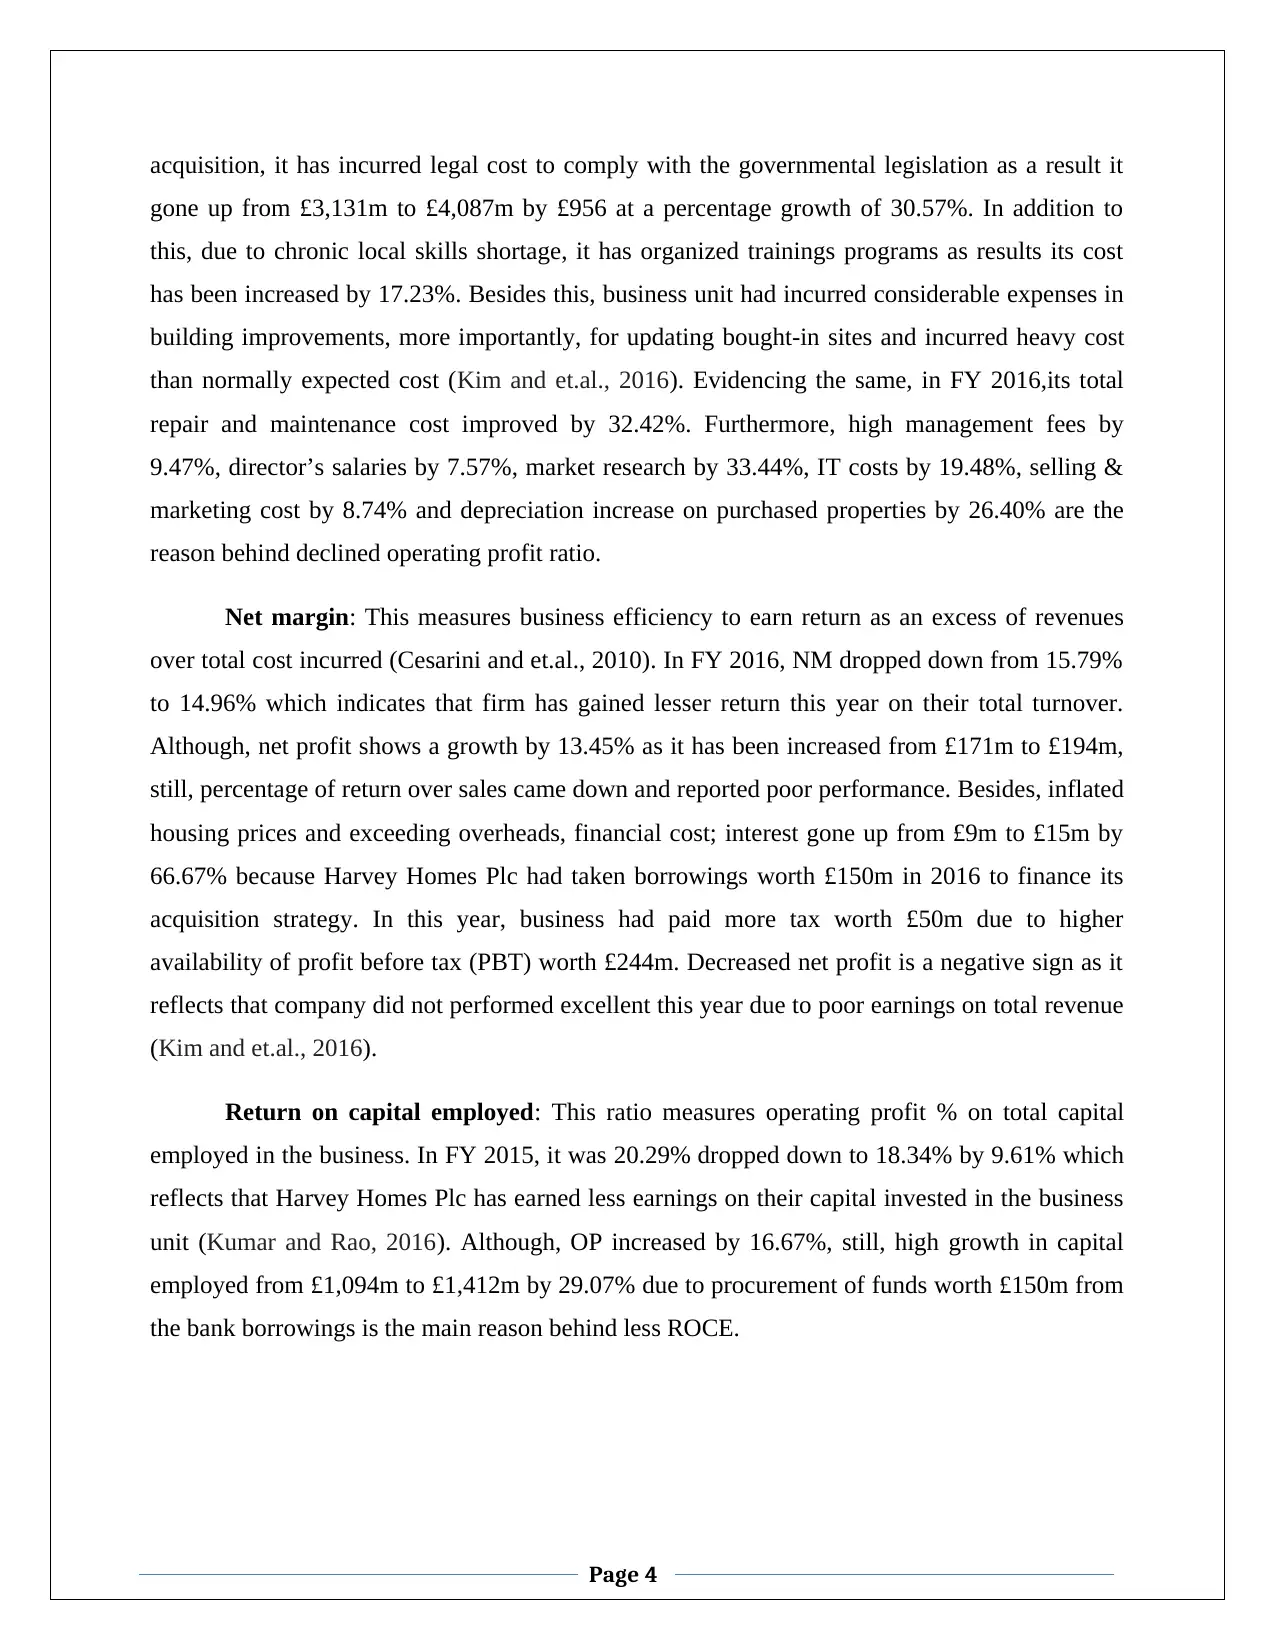
acquisition, it has incurred legal cost to comply with the governmental legislation as a result it
gone up from £3,131m to £4,087m by £956 at a percentage growth of 30.57%. In addition to
this, due to chronic local skills shortage, it has organized trainings programs as results its cost
has been increased by 17.23%. Besides this, business unit had incurred considerable expenses in
building improvements, more importantly, for updating bought-in sites and incurred heavy cost
than normally expected cost (Kim and et.al., 2016). Evidencing the same, in FY 2016,its total
repair and maintenance cost improved by 32.42%. Furthermore, high management fees by
9.47%, director’s salaries by 7.57%, market research by 33.44%, IT costs by 19.48%, selling &
marketing cost by 8.74% and depreciation increase on purchased properties by 26.40% are the
reason behind declined operating profit ratio.
Net margin: This measures business efficiency to earn return as an excess of revenues
over total cost incurred (Cesarini and et.al., 2010). In FY 2016, NM dropped down from 15.79%
to 14.96% which indicates that firm has gained lesser return this year on their total turnover.
Although, net profit shows a growth by 13.45% as it has been increased from £171m to £194m,
still, percentage of return over sales came down and reported poor performance. Besides, inflated
housing prices and exceeding overheads, financial cost; interest gone up from £9m to £15m by
66.67% because Harvey Homes Plc had taken borrowings worth £150m in 2016 to finance its
acquisition strategy. In this year, business had paid more tax worth £50m due to higher
availability of profit before tax (PBT) worth £244m. Decreased net profit is a negative sign as it
reflects that company did not performed excellent this year due to poor earnings on total revenue
(Kim and et.al., 2016).
Return on capital employed: This ratio measures operating profit % on total capital
employed in the business. In FY 2015, it was 20.29% dropped down to 18.34% by 9.61% which
reflects that Harvey Homes Plc has earned less earnings on their capital invested in the business
unit (Kumar and Rao, 2016). Although, OP increased by 16.67%, still, high growth in capital
employed from £1,094m to £1,412m by 29.07% due to procurement of funds worth £150m from
the bank borrowings is the main reason behind less ROCE.
Page 4
⊘ This is a preview!⊘
Do you want full access?
Subscribe today to unlock all pages.
Trusted by 1+ million students worldwide
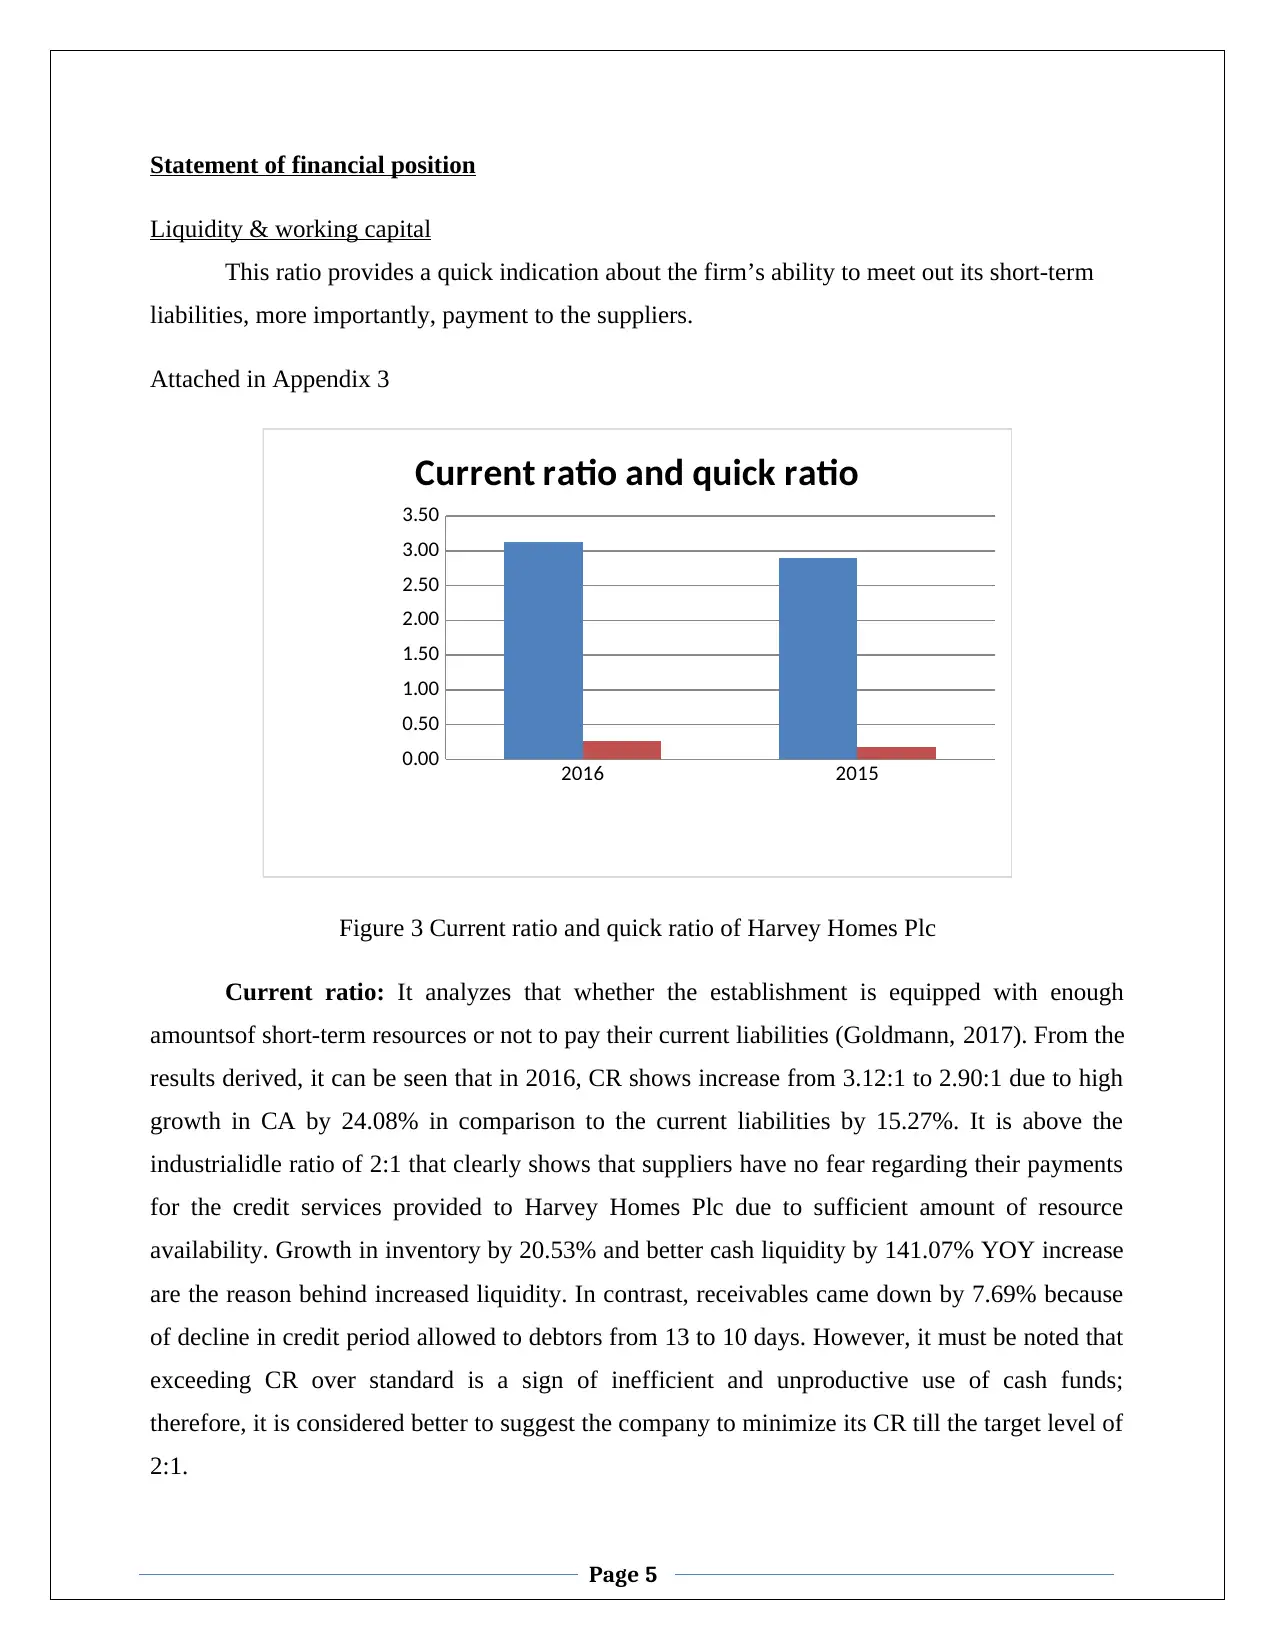
Statement of financial position
Liquidity & working capital
This ratio provides a quick indication about the firm’s ability to meet out its short-term
liabilities, more importantly, payment to the suppliers.
Attached in Appendix 3
2016 2015
0.00
0.50
1.00
1.50
2.00
2.50
3.00
3.50
Current ratio and quick ratio
Figure 3 Current ratio and quick ratio of Harvey Homes Plc
Current ratio: It analyzes that whether the establishment is equipped with enough
amountsof short-term resources or not to pay their current liabilities (Goldmann, 2017). From the
results derived, it can be seen that in 2016, CR shows increase from 3.12:1 to 2.90:1 due to high
growth in CA by 24.08% in comparison to the current liabilities by 15.27%. It is above the
industrialidle ratio of 2:1 that clearly shows that suppliers have no fear regarding their payments
for the credit services provided to Harvey Homes Plc due to sufficient amount of resource
availability. Growth in inventory by 20.53% and better cash liquidity by 141.07% YOY increase
are the reason behind increased liquidity. In contrast, receivables came down by 7.69% because
of decline in credit period allowed to debtors from 13 to 10 days. However, it must be noted that
exceeding CR over standard is a sign of inefficient and unproductive use of cash funds;
therefore, it is considered better to suggest the company to minimize its CR till the target level of
2:1.
Page 5
Paraphrase This Document
Need a fresh take? Get an instant paraphrase of this document with our AI Paraphraser
Quick ratio: It goes up from 0.17:1 to 0.27:1 which is not in line (below) with the
industrial benchmark of 1:1. It is far below that CR because high proportion of current assets
comprises inventory balance and in 2016, it goes up by 20.53% from £1,500m to £1,808m. Thus,
without having stock, Harvey Homes Plc will not be able to pay its deferred obligations on time
to their creditors and lack their trustworthiness.
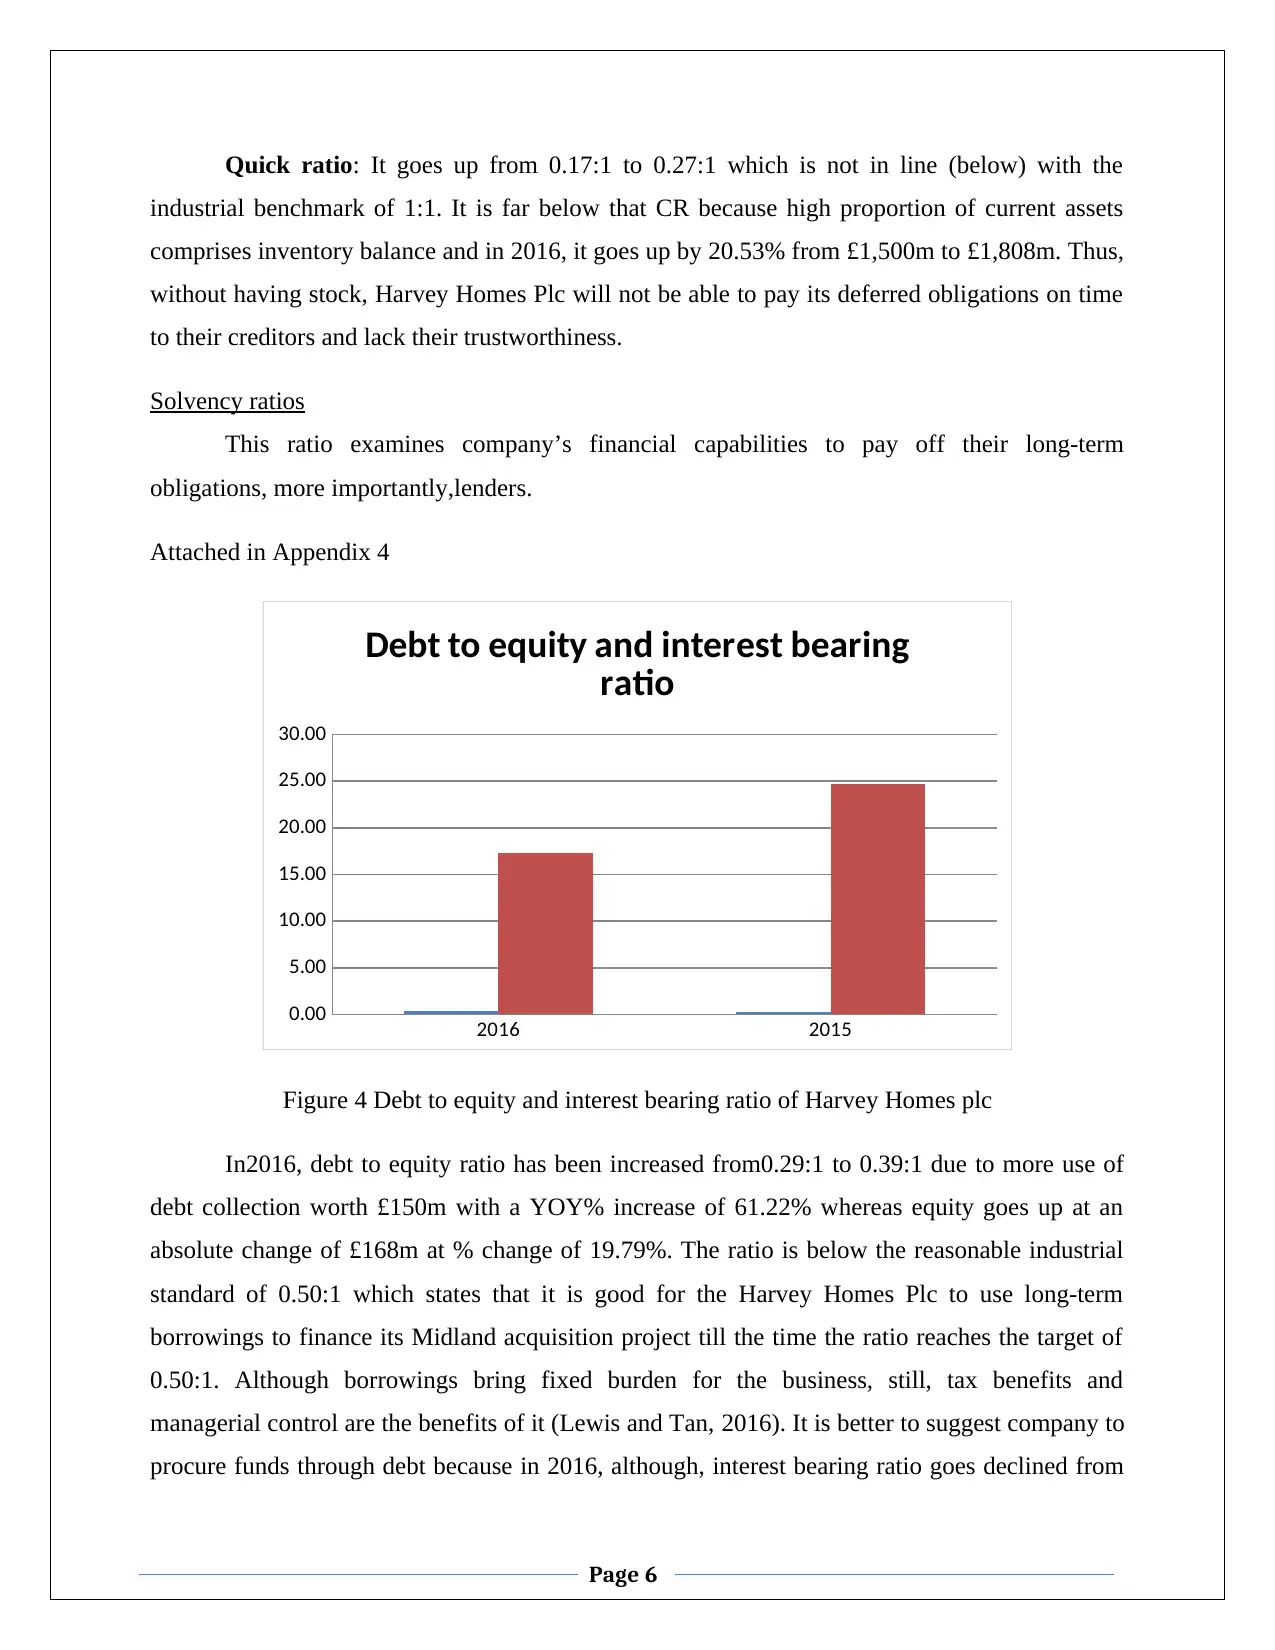
Solvency ratios
This ratio examines company’s financial capabilities to pay off their long-term
obligations, more importantly,lenders.
Attached in Appendix 4
2016 2015
0.00
5.00
10.00
15.00
20.00
25.00
30.00
Debt to equity and interest bearing
ratio
Figure 4 Debt to equity and interest bearing ratio of Harvey Homes plc
In2016, debt to equity ratio has been increased from0.29:1 to 0.39:1 due to more use of
debt collection worth £150m with a YOY% increase of 61.22% whereas equity goes up at an
absolute change of £168m at % change of 19.79%. The ratio is below the reasonable industrial
standard of 0.50:1 which states that it is good for the Harvey Homes Plc to use long-term
borrowings to finance its Midland acquisition project till the time the ratio reaches the target of
0.50:1. Although borrowings bring fixed burden for the business, still, tax benefits and
managerial control are the benefits of it (Lewis and Tan, 2016). It is better to suggest company to
procure funds through debt because in 2016, although, interest bearing ratio goes declined from
Page 6
industrial benchmark of 1:1. It is far below that CR because high proportion of current assets
comprises inventory balance and in 2016, it goes up by 20.53% from £1,500m to £1,808m. Thus,
without having stock, Harvey Homes Plc will not be able to pay its deferred obligations on time
to their creditors and lack their trustworthiness.
Solvency ratios
This ratio examines company’s financial capabilities to pay off their long-term
obligations, more importantly,lenders.
Attached in Appendix 4
2016 2015
0.00
5.00
10.00
15.00
20.00
25.00
30.00
Debt to equity and interest bearing
ratio
Figure 4 Debt to equity and interest bearing ratio of Harvey Homes plc
In2016, debt to equity ratio has been increased from0.29:1 to 0.39:1 due to more use of
debt collection worth £150m with a YOY% increase of 61.22% whereas equity goes up at an
absolute change of £168m at % change of 19.79%. The ratio is below the reasonable industrial
standard of 0.50:1 which states that it is good for the Harvey Homes Plc to use long-term
borrowings to finance its Midland acquisition project till the time the ratio reaches the target of
0.50:1. Although borrowings bring fixed burden for the business, still, tax benefits and
managerial control are the benefits of it (Lewis and Tan, 2016). It is better to suggest company to
procure funds through debt because in 2016, although, interest bearing ratio goes declined from
Page 6
24.67 times to 17.27 times 0.29 which indicates that it is not capable to bear more debt burden
due to increased financial cost. However, on the other side, the ratio is still above the minimum
safety limit of 3:1, therefore, managers must have ability to take additional bank borrowings and
finance their long-term capital requirement by paying debt interest from EBIT as per the loan
repayment scheduled. Designing a balanced capital structure is necessary to maintain financial
cost at minimum level with good solvency (Ucal and Oksay, 2011).
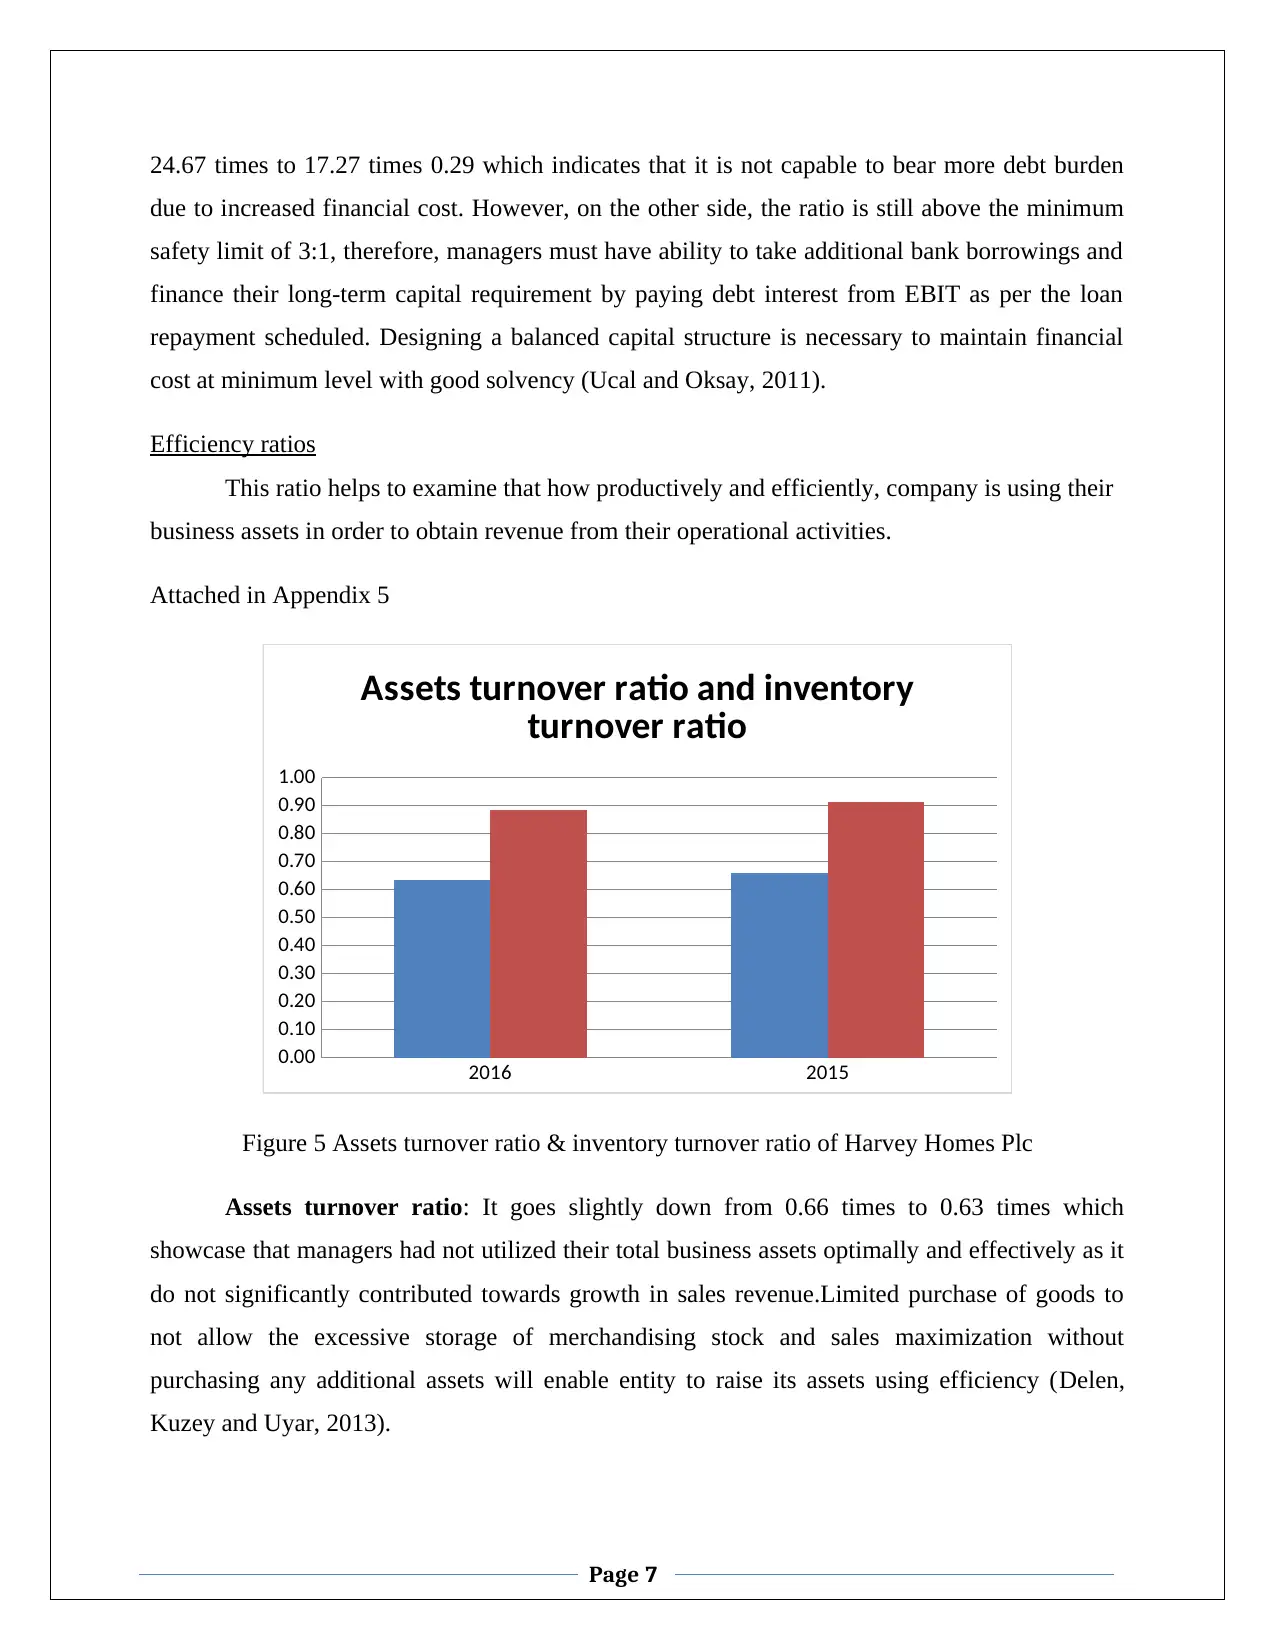
Efficiency ratios
This ratio helps to examine that how productively and efficiently, company is using their
business assets in order to obtain revenue from their operational activities.
Attached in Appendix 5
2016 2015
0.00
0.10
0.20
0.30
0.40
0.50
0.60
0.70
0.80
0.90
1.00
Assets turnover ratio and inventory
turnover ratio
Figure 5 Assets turnover ratio & inventory turnover ratio of Harvey Homes Plc
Assets turnover ratio: It goes slightly down from 0.66 times to 0.63 times which
showcase that managers had not utilized their total business assets optimally and effectively as it
do not significantly contributed towards growth in sales revenue.Limited purchase of goods to
not allow the excessive storage of merchandising stock and sales maximization without
purchasing any additional assets will enable entity to raise its assets using efficiency (Delen,
Kuzey and Uyar, 2013).
Page 7
due to increased financial cost. However, on the other side, the ratio is still above the minimum
safety limit of 3:1, therefore, managers must have ability to take additional bank borrowings and
finance their long-term capital requirement by paying debt interest from EBIT as per the loan
repayment scheduled. Designing a balanced capital structure is necessary to maintain financial
cost at minimum level with good solvency (Ucal and Oksay, 2011).
Efficiency ratios
This ratio helps to examine that how productively and efficiently, company is using their
business assets in order to obtain revenue from their operational activities.
Attached in Appendix 5
2016 2015
0.00
0.10
0.20
0.30
0.40
0.50
0.60
0.70
0.80
0.90
1.00
Assets turnover ratio and inventory
turnover ratio
Figure 5 Assets turnover ratio & inventory turnover ratio of Harvey Homes Plc
Assets turnover ratio: It goes slightly down from 0.66 times to 0.63 times which
showcase that managers had not utilized their total business assets optimally and effectively as it
do not significantly contributed towards growth in sales revenue.Limited purchase of goods to
not allow the excessive storage of merchandising stock and sales maximization without
purchasing any additional assets will enable entity to raise its assets using efficiency (Delen,
Kuzey and Uyar, 2013).
Page 7
⊘ This is a preview!⊘
Do you want full access?
Subscribe today to unlock all pages.
Trusted by 1+ million students worldwide
1 out of 16
Related Documents


Your All-in-One AI-Powered Toolkit for Academic Success.
+13062052269
info@desklib.com
Available 24*7 on WhatsApp / Email
![[object Object]](/_next/static/media/star-bottom.7253800d.svg)
Unlock your academic potential
Copyright © 2020–2026 A2Z Services. All Rights Reserved. Developed and managed by ZUCOL.