Accountancy and Finance: Hilton Hotels Financial Performance Analysis
VerifiedAdded on 2023/01/03
|20
|5141
|78
Report
AI Summary
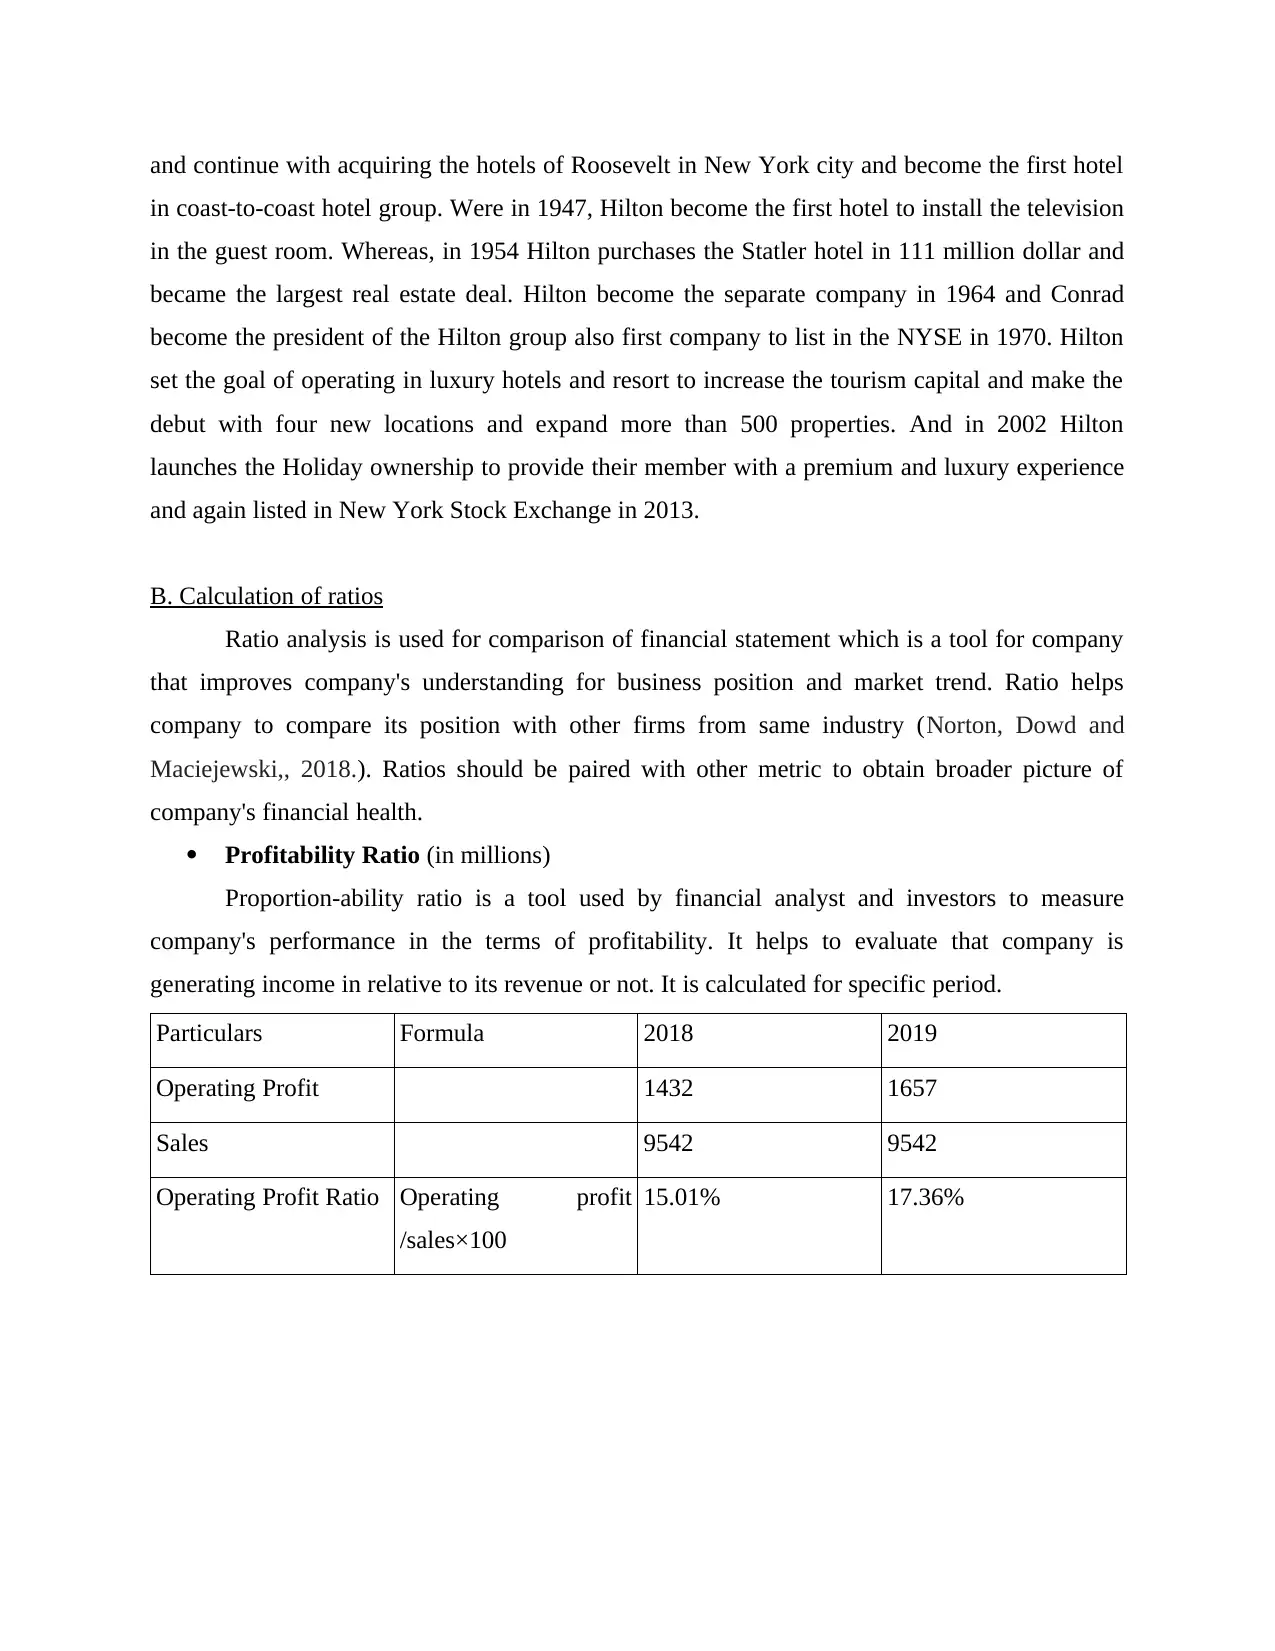
This report presents a comprehensive financial analysis of Hilton Hotels, examining its performance through various financial ratios including profitability, liquidity, efficiency, gearing, and investment ratios. The analysis covers the years 2018 and 2019, providing insights into the company's financial health and trends. Furthermore, the report delves into the strategic aspects of Hilton, incorporating SWOT and PESTLE analyses to evaluate its internal strengths and weaknesses, as well as external opportunities and threats. The report also discusses the strategic and financial rationale for potential investors, considering the company's performance and future prospects. The conclusion synthesizes the findings, offering a holistic view of Hilton's financial standing and strategic positioning in the hospitality industry, making this report valuable for students seeking to understand financial analysis and strategic management.

ACCOUNTANCY AND
FINANCE.
FINANCE.
Paraphrase This Document
Need a fresh take? Get an instant paraphrase of this document with our AI Paraphraser

Table of Contents
INTRODUCTION...........................................................................................................................3
MAIN BODY...................................................................................................................................3
A. Hilton Profile and sectors they are operating in......................................................................3
B. Calculation of ratios................................................................................................................4
C. Interpretation Of Ratio analysis............................................................................................11
D. SWOT and PESTLE strategies that should be adopted by the Hilton..................................14
E. Reasons based on strategic and financial analysis for the investor to invest in this Hilton.. 16
CONCLUSION..............................................................................................................................18
REFERENCES................................................................................................................................1

INTRODUCTION
International Accounting Standard (ISA) is an older accounting standard which is issued
by the International Accounting System Board (IFSB) which is based in London which is later
replaced by the International Financial Reporting Standard (IFRSs) in 2001. ISA was the first
international accounting standard that were issued by the IASC (International Accounting
Standard committee) formed in 1973 (Galli, 2017). the main aim was to increase the
transparency, trust in financial report and to make the business easier to compare with other.
Globally comparable accounting standards helps the business to promote the transparency,
efficiency of the financial market and accountability around the world. This help the market to
get more of the investor and participate to make the economic decision to know the investment
risk and opportunities to improve the capital allocation. Whereas, IFRSs sets the conman rule for
the countries to follow the financial statements that provide transparency and comparable. ISAB
gives the guideline to maintain the financial report and financial impacts. This reports shows the
financial statement of Hilton industry of two consecutive year financial year and analysis to
make the strategies. Whereas, this report also shows the SWOT/PESTLE analysis of the
company which affect the Hilton hotel industry and can overcome with those situations.
MAIN BODY
A. Hilton Profile and sectors they are operating in.
Hilton Hotels corporation, an American multinational Hospitality company that deals in
the hotels and resort founded by Conrad Hilton which id now lead by Christopher J. Nassetta.
Hilton had over 6215 properties all over the 118 countries and territories where 690 managed
and 5405 are the franchises of the Hilton hotels. It has ranked having 36th largest property
privately held company. The company also owned the other hotel companies like Waldorf
Astoria hotels and resort, Conrad hotels, Hampton etc. Hilton hotel is an international series
which have the most luxury hotels and resort in the world. In addition to their hotels and resort
they also offer the holiday ownership program by Hilton grand holiday program. Hilton have
more than 3 lac team members globally that work for the Hilton industry. It is one of the largest
fast growing hotel industries in the world. In 1919 Hilton buys the Mobley hotel situated in
Cisco, Texas and further purchases the Texas hotel. In 1925 aims to manage the best hotel in the
taxes with commitment and innovation in the industry. In 1927, Hilton expands to Waco, taxes
and open the first hotel providing the services with air condition and cold running water in public
⊘ This is a preview!⊘
Do you want full access?
Subscribe today to unlock all pages.

Trusted by 1+ million students worldwide

and continue with acquiring the hotels of Roosevelt in New York city and become the first hotel
in coast-to-coast hotel group. Were in 1947, Hilton become the first hotel to install the television
in the guest room. Whereas, in 1954 Hilton purchases the Statler hotel in 111 million dollar and
became the largest real estate deal. Hilton become the separate company in 1964 and Conrad
become the president of the Hilton group also first company to list in the NYSE in 1970. Hilton
set the goal of operating in luxury hotels and resort to increase the tourism capital and make the
debut with four new locations and expand more than 500 properties. And in 2002 Hilton
launches the Holiday ownership to provide their member with a premium and luxury experience
and again listed in New York Stock Exchange in 2013.
B. Calculation of ratios
Ratio analysis is used for comparison of financial statement which is a tool for company
that improves company's understanding for business position and market trend. Ratio helps
company to compare its position with other firms from same industry (Norton, Dowd and
Maciejewski,, 2018.). Ratios should be paired with other metric to obtain broader picture of
company's financial health.
Profitability Ratio (in millions)
Proportion-ability ratio is a tool used by financial analyst and investors to measure
company's performance in the terms of profitability. It helps to evaluate that company is
generating income in relative to its revenue or not. It is calculated for specific period.
Particulars Formula 2018 2019
Operating Profit 1432 1657
Sales 9542 9542
Operating Profit Ratio Operating profit
/sales×100
15.01% 17.36%
Paraphrase This Document
Need a fresh take? Get an instant paraphrase of this document with our AI Paraphraser

Particulars Formula 2018 2019
Net income 764 881
Sales 9542 9542
Net Profit Ratio Net income/ sales
*100
8.05% 9.23%
Operating Profit Ratio
0.135
0.14
0.145
0.15
0.155
0.16
0.165
0.17
0.175
0.18
15.01%
17.36%
2018
2019
Net Profit Ratio
0.074
0.076
0.078
0.08
0.082
0.084
0.086
0.088
0.09
0.092
0.094
8.05%
9.23%
2018
2019
Net income 764 881
Sales 9542 9542
Net Profit Ratio Net income/ sales
*100
8.05% 9.23%
Operating Profit Ratio
0.135
0.14
0.145
0.15
0.155
0.16
0.165
0.17
0.175
0.18
15.01%
17.36%
2018
2019
Net Profit Ratio
0.074
0.076
0.078
0.08
0.082
0.084
0.086
0.088
0.09
0.092
0.094
8.05%
9.23%
2018
2019

Liquidity Ratios
Liquidity Ratio is calculated to determine an organization's capability to pay its debt in time
manner. These ratios are used by creditors and lenders to have idea about creditworthiness of
borrowers or financial situation of their customers. It used to determine liquid assets to short
term liabilities.
Particulars Formula 2018 2019
Current Assets 1983 2093
Current Liability 2871 2871
Current ratio Current Assets
/Current Liability
0.69% 0.73%
Particulars Formula 2018 2019
Liquid Assets 1823 1963
Current Liability 2871 2871
Quick ratio Liquid Assets / current
liability
0.63% 0.68%
Current ratio
0.0066
0.0067
0.0068
0.0069
0.007
0.0071
0.0072
0.0073
0.0074
0.69%
0.73%
2018
2019
⊘ This is a preview!⊘
Do you want full access?
Subscribe today to unlock all pages.

Trusted by 1+ million students worldwide

Efficiency Ratios
An efficiency ratio is used by company to analyse that how well company is using its
assets and liabilities internally (Bitar, Pukthuanthong and Walker, 2018). These ratios can
calculate turnover of receivables, the quantity and usage of equity fund and repayments of
liability is used for comparison of company's expenses with its revenues earned. Efficiency ratios
are used by financial analysts.
Particulars Formula 2018 2019
Revenue 8906 9542
total Assets 13995 14957
Assets Turnover Revenue / total Assets 0.64% 0.64%
Quick ratio
0.006
0.0061
0.0062
0.0063
0.0064
0.0065
0.0066
0.0067
0.0068
0.0069
0.63%
0.68%
2018
2019
Paraphrase This Document
Need a fresh take? Get an instant paraphrase of this document with our AI Paraphraser

Particulars Formula 2018 2019
Credit sales 8906 9542
account receivable 1150 1261
Receivable Turnover
ratio
Credit sales/ account
receivable
7.74% 7.56%
( No credit sales was given so sales has been taken as credit sales)
Assets Turnover
0
0.001
0.002
0.003
0.004
0.005
0.006
0.007 0.64% 0.64%
2018
2019
Credit sales 8906 9542
account receivable 1150 1261
Receivable Turnover
ratio
Credit sales/ account
receivable
7.74% 7.56%
( No credit sales was given so sales has been taken as credit sales)
Assets Turnover
0
0.001
0.002
0.003
0.004
0.005
0.006
0.007 0.64% 0.64%
2018
2019

Gearing Ratio
A gearing ratio measures company's proportion of borrowed funds to its equity. It is related to
financial risk which is subjected to business. A higher debt ratio indicates high proportion of debt
to equity.
Particulars Formula 2018 2019
Total debt 7266 7956
total equity 558 -472
Gearing Ratio. Total debt /total equity 13.02% -16.82%
Receivable Turnover ratio
0.0745
0.075
0.0755
0.076
0.0765
0.077
0.0775
0.078
7.74%
7.56%
2018
2019
⊘ This is a preview!⊘
Do you want full access?
Subscribe today to unlock all pages.

Trusted by 1+ million students worldwide

Particulars Formula 2018 2019
EBITDA 1800 2048
Interest expenses -371 -414
Interest Coverage
Ratio
EBITDA/ Interest
expenses
-4.85% -4.94%
Gearing Ratio
-0.2
-0.15
-0.1
-0.05
0
0.05
0.1
0.15 13.02%
-16.82%
2018
2019
Interest Coverage Ratio
-0.0496
-0.0494
-0.0492
-0.049
-0.0488
-0.0486
-0.0484
-0.0482
-0.048 -4.85% -4.94%
2018
2019
Paraphrase This Document
Need a fresh take? Get an instant paraphrase of this document with our AI Paraphraser

Investment Ratio
Investment ratios are used to assess performance of company's share. Potential investors,
competitors and analyst uses this to assess performance and take their decision regarding
investment.
Return on equity
Particulars Formula 2018 2019
Net income 764 881
shareholders equity 558 -472
Return on equity Net income /
shareholders equity
*100
136.90% -186.60%
C. Interpretation Of Ratio analysis
Profitability Ratio
Having higher profitability ratio means your company is more competitive that over
companies (Linares-Mustarós, Coenders and Vives-Mestres,2018.). Operating Profit margin
informs business and investors how efficiently converting revenue into return on revenue.
Return on equity
-2.5
-2
-1.5
-1
-0.5
0
0.5
1
1.5
2
2018
2019

Operating profit ratio is more than 10 % for both the financial year 2018 and 2019 means Hilton
Company has good profitability ratio which is 15.01% and 17.36%respectively which is showing
good profitability of Hilton Hotel Company. As Operating profit ratio has increased from 2018
to 2019 for 2% which is showing that Hilton operation activities has risen as compared to
previous year. Hilton company can focus more on reduction of cost of production so it can
increase more operating profit for upcoming years.
Ideal Net profit ratios varies from company to company. A net profit margin helps the investors
to assess that company is gearing enough profit from its sales. An ideal net profit ratio is
considered to be average 10% and 20 % margin is considered as good profitability of company.
Hilton company earned 8.05% in the year 2018 and 9.23% in 2019 which low as compared to
ideal but as it is said it differs from industry to industry so it can be taken as good ratio as it is
increasing as compared to previous year. Company can increase more net profit by expanding
sales and reducing expenses.
Liquidity Ratio
Having good liquidity ratio indicates its Debt paying capacity. Current ratio is use to
measure the ability of company to meet firm's current obligation (Le and Viviani, 2018) A ideal
current ratio is between 1:2 to 2 which means firm has 2 times assets than its liabilities and if its
below 1 than company don't have enough liquid assets to meet its short term liability. In the year
2018 the Hilton company have current ratio is 0.69 which not a good sign for company and in
2019 it increased from 0.69 to 0.73 , Hilton company require more liquid assets to meet its short
term obligation.
Quick ratio refers to current assets than can be converted into cash within 90 days, it
excludes prepaid expense and inventory. An Ideal quick ratio is considered to be 1 if its less than
1 then company is not in position to pay its short term liability. Hilton company quick ratio in
2018 is 0.63 and in 2019 it is 0.68 which is increasing as compared to previous year. But the firm
is not in good position to pay its short term liability as it is less than 1.
Efficiency Ratio
Efficiency ratio includes assets turnover ratio and receivable turnover ratio which
measures that how well Hilton is using its assets and liability. Assets turnover ration is also
considered as total asset turnover ratio which measures the efficiency of company to use assets to
produce sales. An ideal ratio is 0.25 - 0.5, in 2018 the Hilton company's ratio is 0.64 and in 2019
⊘ This is a preview!⊘
Do you want full access?
Subscribe today to unlock all pages.

Trusted by 1+ million students worldwide
1 out of 20
Related Documents

Your All-in-One AI-Powered Toolkit for Academic Success.
+13062052269
info@desklib.com
Available 24*7 on WhatsApp / Email
Unlock your academic potential
Copyright © 2020–2025 A2Z Services. All Rights Reserved. Developed and managed by ZUCOL.