Comprehensive Financial Analysis Report: Client Investments

Verified

Added on  2022/11/30

|5
|535
|139
Report
AI Summary
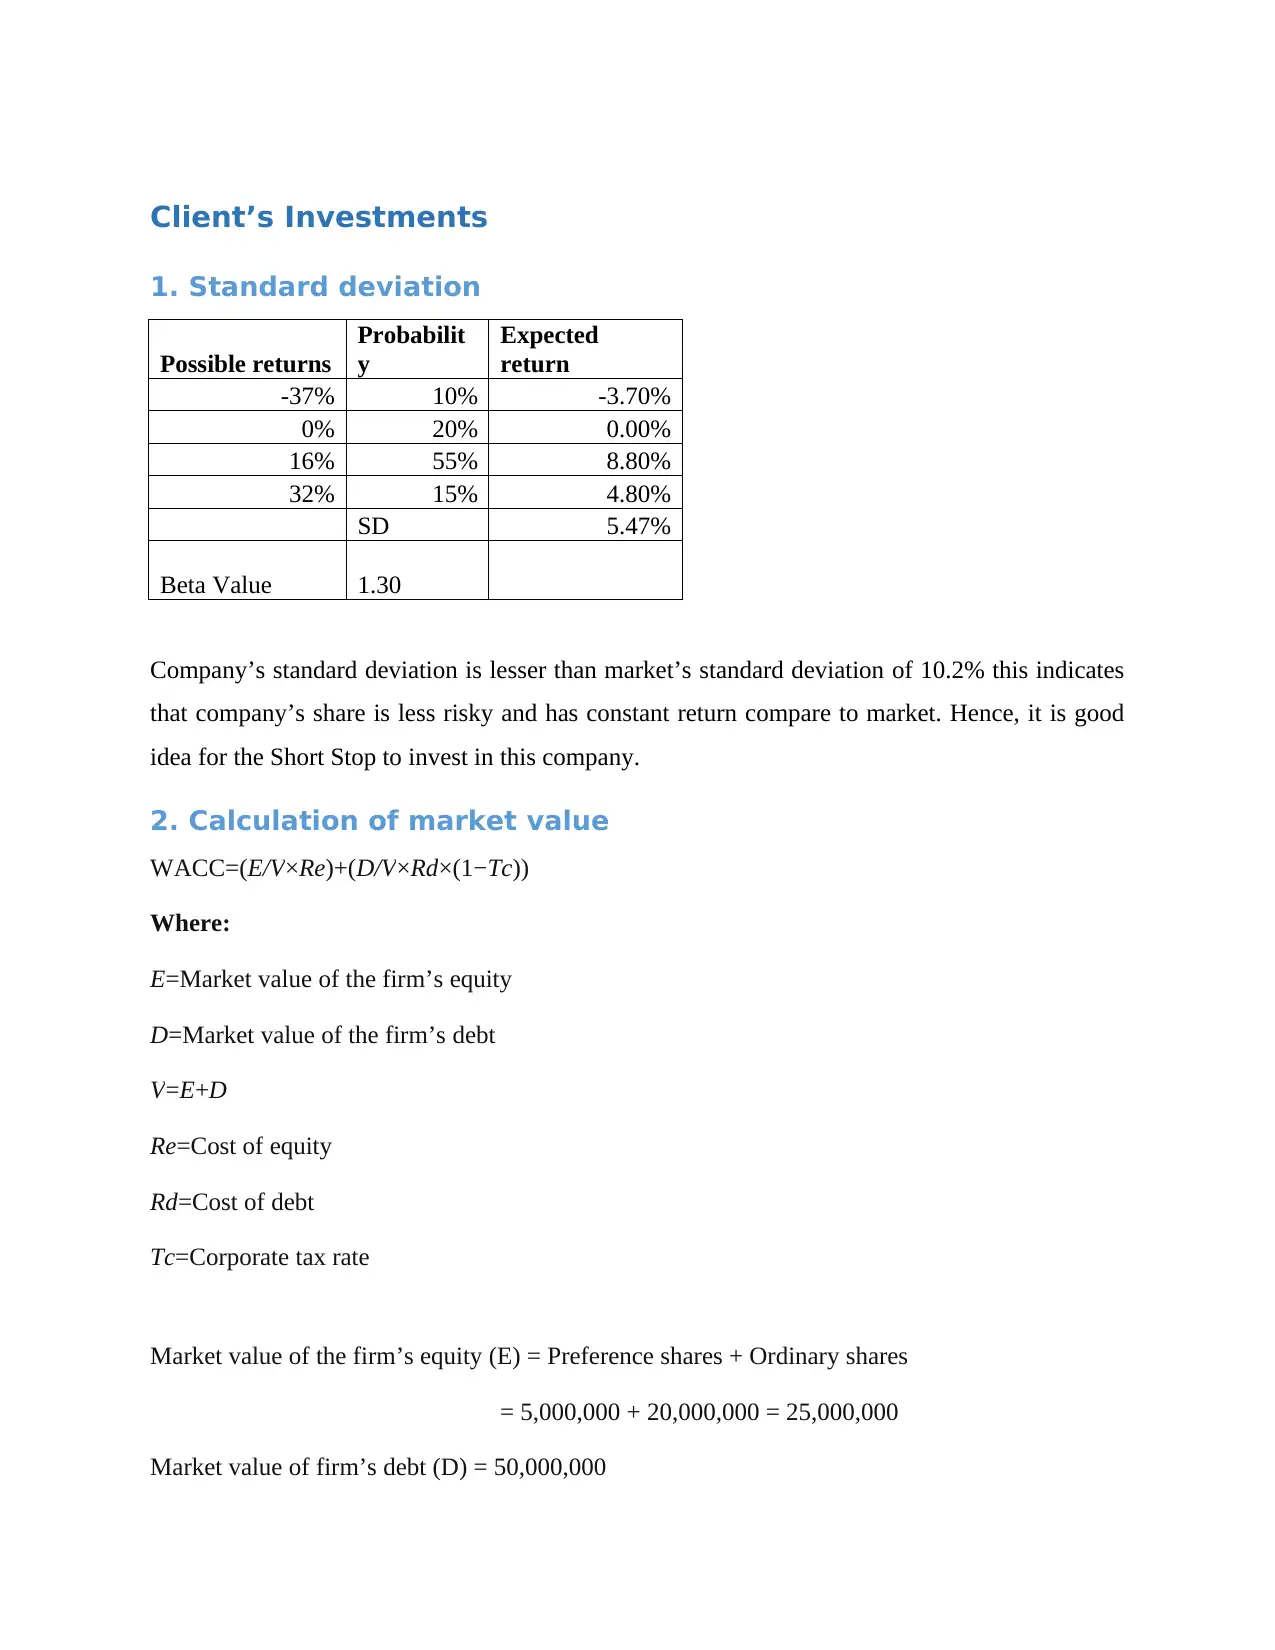
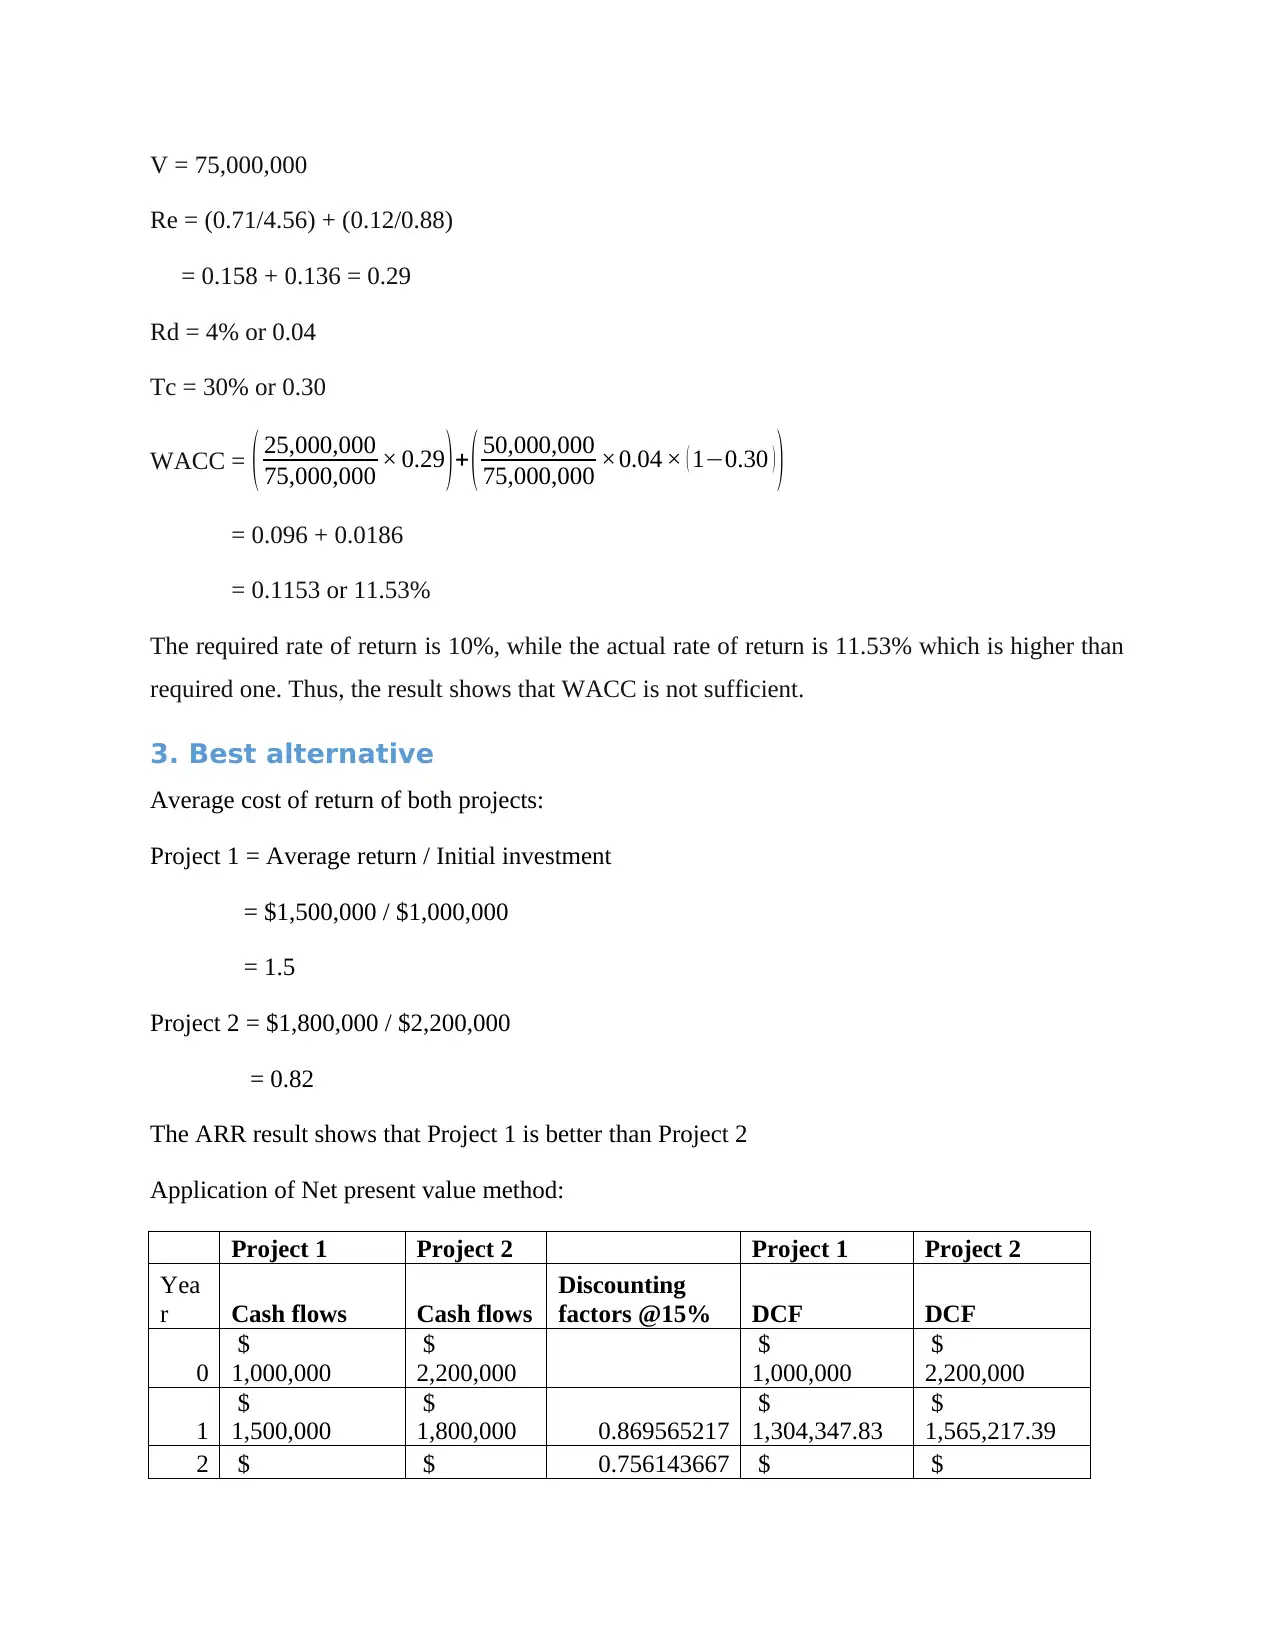
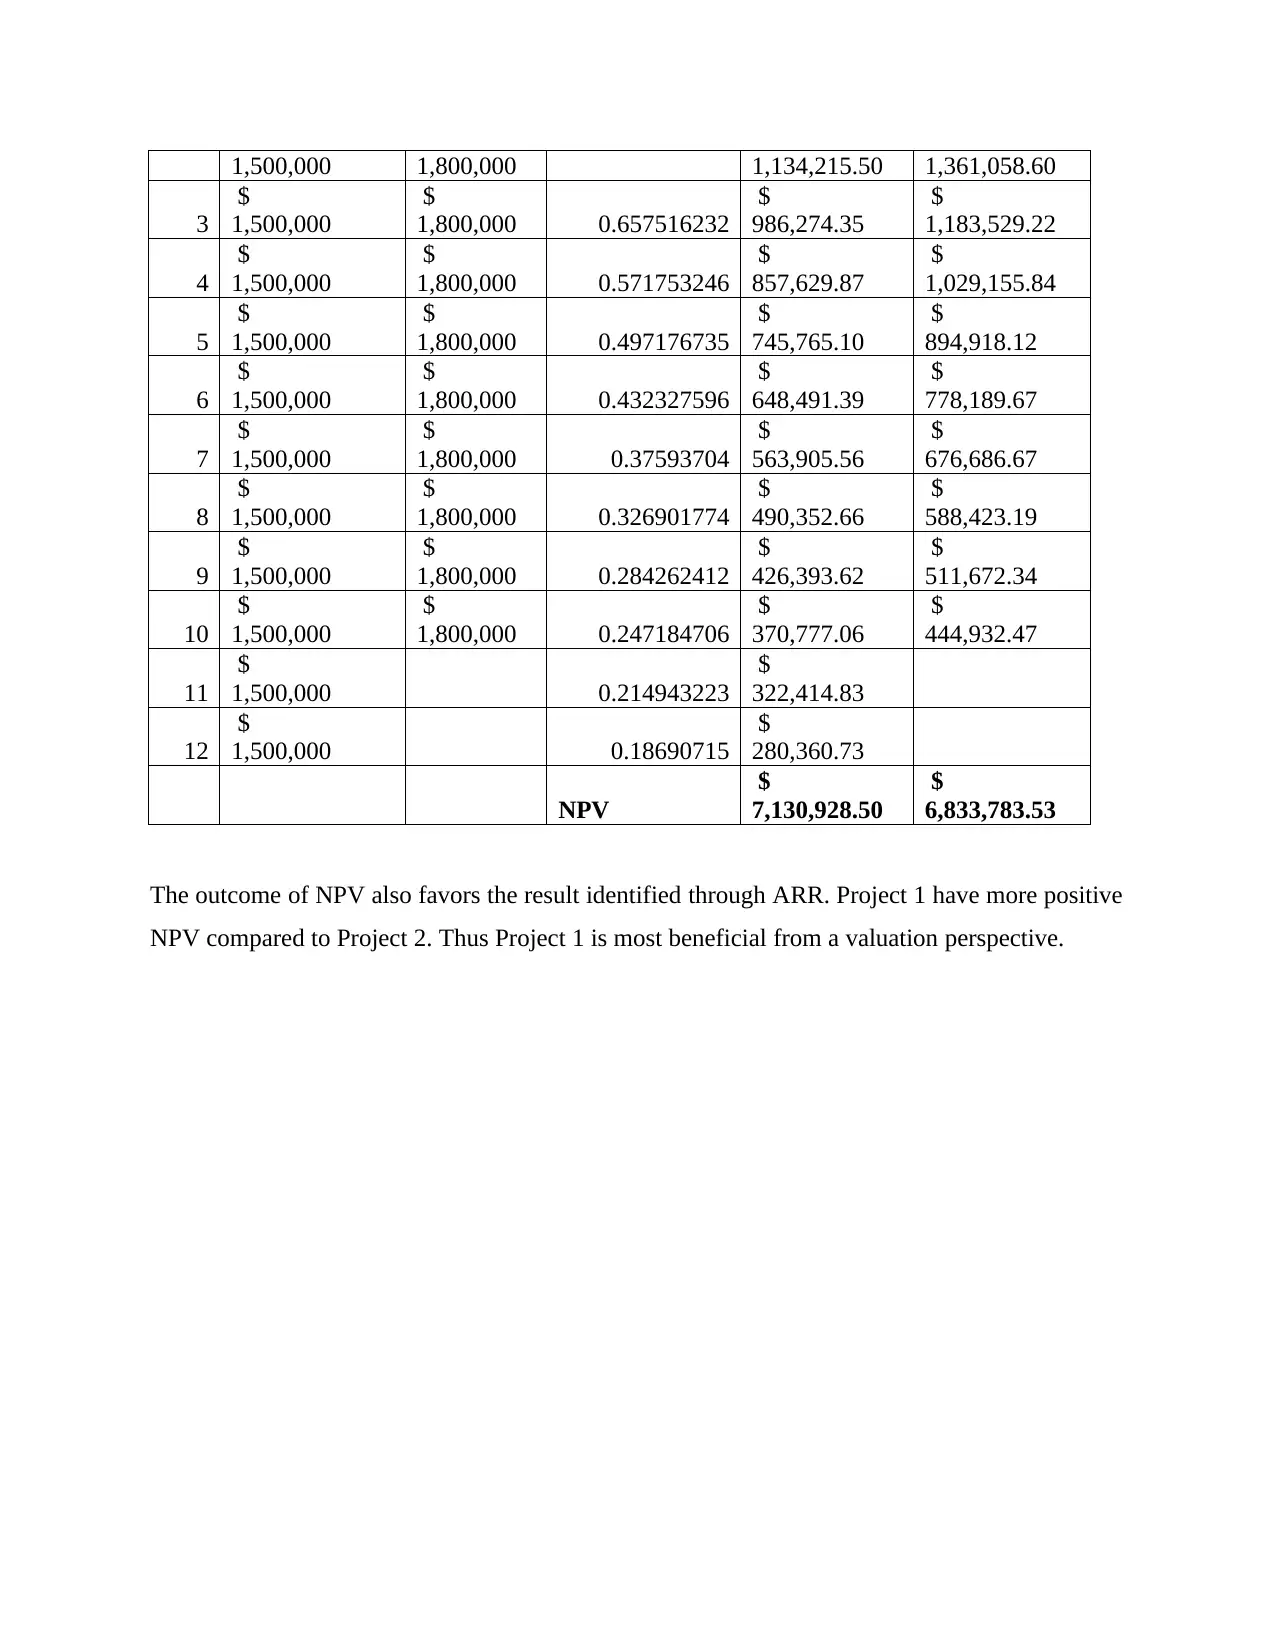
This report provides a financial analysis of a client's investments, focusing on standard deviation, market value calculation, and the evaluation of investment alternatives. The analysis begins with a calculation of standard deviation to assess the risk associated with a company's shares, comparing it to the market's standard deviation to determine its suitability for investment. It then calculates the weighted average cost of capital (WACC) to assess the financial viability of the investment, concluding that the WACC is not sufficient based on the required and actual rates of return. Finally, the report compares two potential projects using the average rate of return (ARR) and net present value (NPV) methods. The ARR analysis suggests Project 1 is superior, a conclusion reinforced by the NPV analysis, which shows Project 1 having a more positive NPV, thus making it the most beneficial from a valuation perspective. The report uses financial data to support its conclusions, providing a clear framework for investment decision-making.
Document Page
Financial
tabler-icon-diamond-filled.svg

Paraphrase This Document

Need a fresh take? Get an instant paraphrase of this document with our AI Paraphraser
Document Page
Table of Contents
Client’s Investments........................................................................................................................3
1. Standard deviation...................................................................................................................3
2. Calculation of market value.....................................................................................................3
3. Best alternative........................................................................................................................4
Document Page
Client’s Investments
1. Standard deviation
Possible returns
Probabilit
y
Expected
return
-37% 10% -3.70%
0% 20% 0.00%
16% 55% 8.80%
32% 15% 4.80%
SD 5.47%
Beta Value 1.30
Company’s standard deviation is lesser than market’s standard deviation of 10.2% this indicates
that company’s share is less risky and has constant return compare to market. Hence, it is good
idea for the Short Stop to invest in this company.
2. Calculation of market value
WACC=(E/V×Re)+(D/V×Rd×(1Tc))
Where:
E=Market value of the firm’s equity
D=Market value of the firm’s debt
V=E+D
Re=Cost of equity
Rd=Cost of debt
Tc=Corporate tax rate
Market value of the firm’s equity (E) = Preference shares + Ordinary shares
= 5,000,000 + 20,000,000 = 25,000,000
Market value of firm’s debt (D) = 50,000,000
Document Page
V = 75,000,000
Re = (0.71/4.56) + (0.12/0.88)
= 0.158 + 0.136 = 0.29
Rd = 4% or 0.04
Tc = 30% or 0.30
WACC = ( 25,000,000
75,000,000 × 0.29 ) + ( 50,000,000
75,000,000 ×0.04 × ( 10.30 ) )
= 0.096 + 0.0186
= 0.1153 or 11.53%
The required rate of return is 10%, while the actual rate of return is 11.53% which is higher than
required one. Thus, the result shows that WACC is not sufficient.
3. Best alternative
Average cost of return of both projects:
Project 1 = Average return / Initial investment
= $1,500,000 / $1,000,000
= 1.5
Project 2 = $1,800,000 / $2,200,000
= 0.82
The ARR result shows that Project 1 is better than Project 2
Application of Net present value method:
Project 1 Project 2 Project 1 Project 2
Yea
r Cash flows Cash flows
Discounting
factors @15% DCF DCF
0
$
1,000,000
$
2,200,000
$
1,000,000
$
2,200,000
1
$
1,500,000
$
1,800,000 0.869565217
$
1,304,347.83
$
1,565,217.39
2 $ $ 0.756143667 $ $
tabler-icon-diamond-filled.svg

Paraphrase This Document

Need a fresh take? Get an instant paraphrase of this document with our AI Paraphraser
Document Page
1,500,000 1,800,000 1,134,215.50 1,361,058.60
3
$
1,500,000
$
1,800,000 0.657516232
$
986,274.35
$
1,183,529.22
4
$
1,500,000
$
1,800,000 0.571753246
$
857,629.87
$
1,029,155.84
5
$
1,500,000
$
1,800,000 0.497176735
$
745,765.10
$
894,918.12
6
$
1,500,000
$
1,800,000 0.432327596
$
648,491.39
$
778,189.67
7
$
1,500,000
$
1,800,000 0.37593704
$
563,905.56
$
676,686.67
8
$
1,500,000
$
1,800,000 0.326901774
$
490,352.66
$
588,423.19
9
$
1,500,000
$
1,800,000 0.284262412
$
426,393.62
$
511,672.34
10
$
1,500,000
$
1,800,000 0.247184706
$
370,777.06
$
444,932.47
11
$
1,500,000 0.214943223
$
322,414.83
12
$
1,500,000 0.18690715
$
280,360.73
NPV
$
7,130,928.50
$
6,833,783.53
The outcome of NPV also favors the result identified through ARR. Project 1 have more positive
NPV compared to Project 2. Thus Project 1 is most beneficial from a valuation perspective.
chevron_up_icon
1 out of 5
circle_padding
hide_on_mobile
zoom_out_icon
[object Object]