Financial Analysis and Strategic Management Report: Redding vs. Neaves
VerifiedAdded on 2020/10/22
|12
|3769
|355
Report
AI Summary
This report provides a comprehensive analysis of strategic financial management, focusing on the performance comparison of Redding Co. and Neaves Co. through detailed financial ratio analysis. The report begins with an introduction to strategic financial management, emphasizing resource allocation and financial goal achievement. Task 1 involves the calculation and analysis of various financial ratios, including profitability, efficiency, liquidity, gearing, and investor ratios, for both companies in 2017. These ratios are then compared to assess each company's financial health and operational effectiveness. Task 2 explores the concept of agency and its significance for listed companies. Task 3 evaluates the impact of raising funding for refurbishment through additional loans on Redding Co. The report concludes with a summary of the findings, highlighting the strengths and weaknesses of each company based on the financial ratios and their implications for strategic financial management.

Strategic Financial
Management
Management
Paraphrase This Document
Need a fresh take? Get an instant paraphrase of this document with our AI Paraphraser
Table of Contents
INTRODUCTION...........................................................................................................................3
TASK 1............................................................................................................................................3
I : Calculation and analysis of Ratios of two companies:............................................................3
II : Comparison of the performance of the two companies different ratios:................................7
III: Evaluation of the use of financial ratios :..............................................................................9
TASK 2..........................................................................................................................................10
Agency and its significance for Listed companies :..................................................................10
TASK 3..........................................................................................................................................11
Impact on Redding Co. of raising the funding for the refurbishment through additional loans:
....................................................................................................................................................11
CONCLUSION..............................................................................................................................11
INTRODUCTION
Strategic financial management is a systematic allocation of resources and managing
monetary or financial resources to achieve standard performance and provide maximum returns
to shareholders. Strategic financial management explains business objectives or goals while
recognising and measuring existing and potential resources, and constructs a blueprint for
efficient allocation of financial resources to achieve targets (Gamble, Thompson and Peteraf,
2013). This report exhibits a systematic analysis of performance of Redding Co. and Neaves Co.
through critical evaluation of financial ratios of both companies and assessment of the impact of
raising the funding for the refurbishment through additional loans. This report also explains
Term agency and role of agencies in order to achieve objectives of company.
TASK 1
I : Calculation and analysis of Ratios of two companies:
There are two companies given which is Redding Co. and Neaves Co., to compare each
other performance, there is a requirement of calculation of ratios and analysis them & compare
them with each other company's ratios. For doing ratios analysis, firstly understanding the
meaning of ratio analysis is necessary.
Ratio analysis can be defined as a quantitative analysis of organisation's performance
with the help of various information which is recorded in financial statements of the company
(Barney, 2012). Ratio analysis is used to evaluate various aspects of a company’s operating and
financial performance such as its efficiency, liquidity, profitability and solvency. Calculations of
Ratios of two companies (Redding Co. and Neaves Co.) are as follows:
Profitability ratios:
These ratios are calculated to find the profitability of a company so that it can be
concluded that whether company is running in right direction and its business activities is more
profitable as compared to competitors. This includes following ratios:
Net profit ratio: This ratio is calculated to find to net profitability of company taking
sales as a base after deducting all expenses whether operating and non operating and
after adding all incomes whether operating or non operating (Berger, 2011). It shows that
how much amount of profit a company able to earn as a percentage of sales. Calculations
of this ratio for two companies are as follows:
⊘ This is a preview!⊘
Do you want full access?
Subscribe today to unlock all pages.
Trusted by 1+ million students worldwide
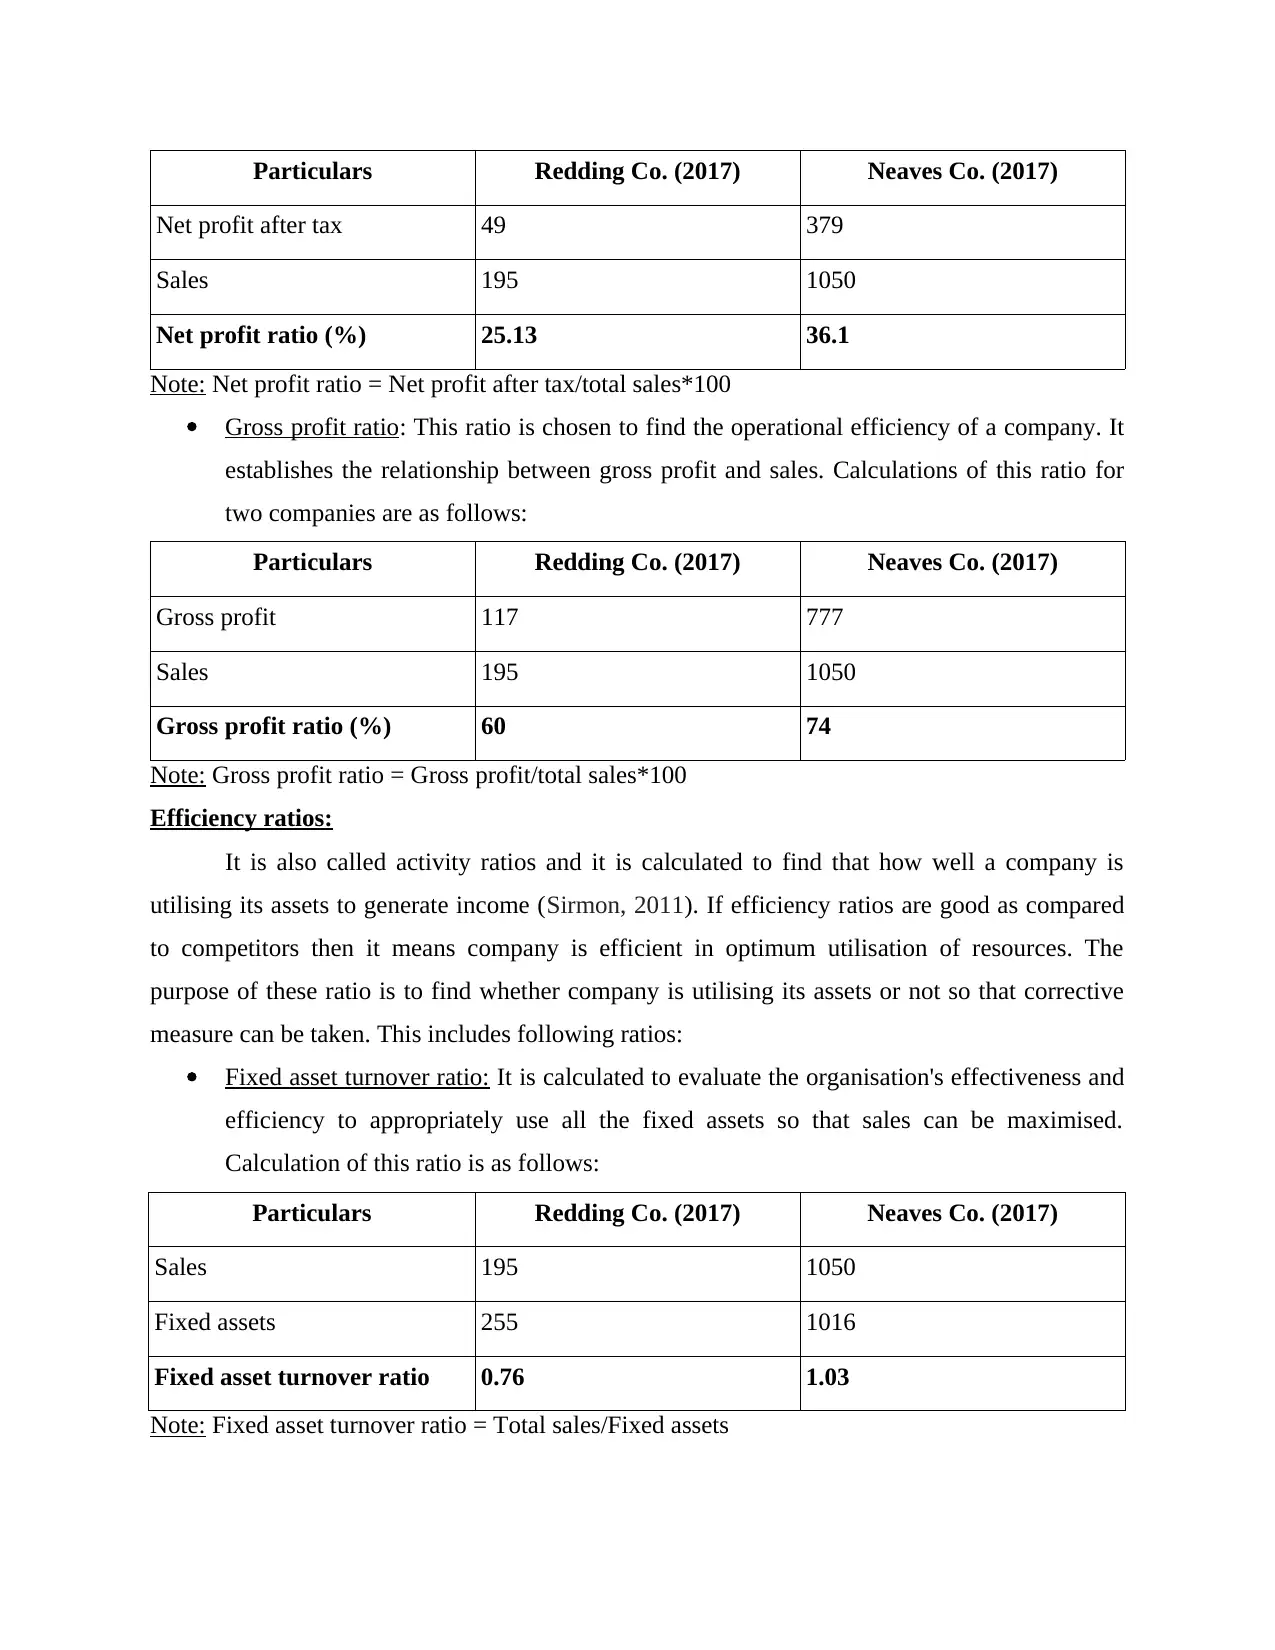
Particulars Redding Co. (2017) Neaves Co. (2017)
Net profit after tax 49 379
Sales 195 1050
Net profit ratio (%) 25.13 36.1
Note: Net profit ratio = Net profit after tax/total sales*100
Gross profit ratio: This ratio is chosen to find the operational efficiency of a company. It
establishes the relationship between gross profit and sales. Calculations of this ratio for
two companies are as follows:
Particulars Redding Co. (2017) Neaves Co. (2017)
Gross profit 117 777
Sales 195 1050
Gross profit ratio (%) 60 74
Note: Gross profit ratio = Gross profit/total sales*100
Efficiency ratios:
It is also called activity ratios and it is calculated to find that how well a company is
utilising its assets to generate income (Sirmon, 2011). If efficiency ratios are good as compared
to competitors then it means company is efficient in optimum utilisation of resources. The
purpose of these ratio is to find whether company is utilising its assets or not so that corrective
measure can be taken. This includes following ratios:
Fixed asset turnover ratio: It is calculated to evaluate the organisation's effectiveness and
efficiency to appropriately use all the fixed assets so that sales can be maximised.
Calculation of this ratio is as follows:
Particulars Redding Co. (2017) Neaves Co. (2017)
Sales 195 1050
Fixed assets 255 1016
Fixed asset turnover ratio 0.76 1.03
Note: Fixed asset turnover ratio = Total sales/Fixed assets
Paraphrase This Document
Need a fresh take? Get an instant paraphrase of this document with our AI Paraphraser
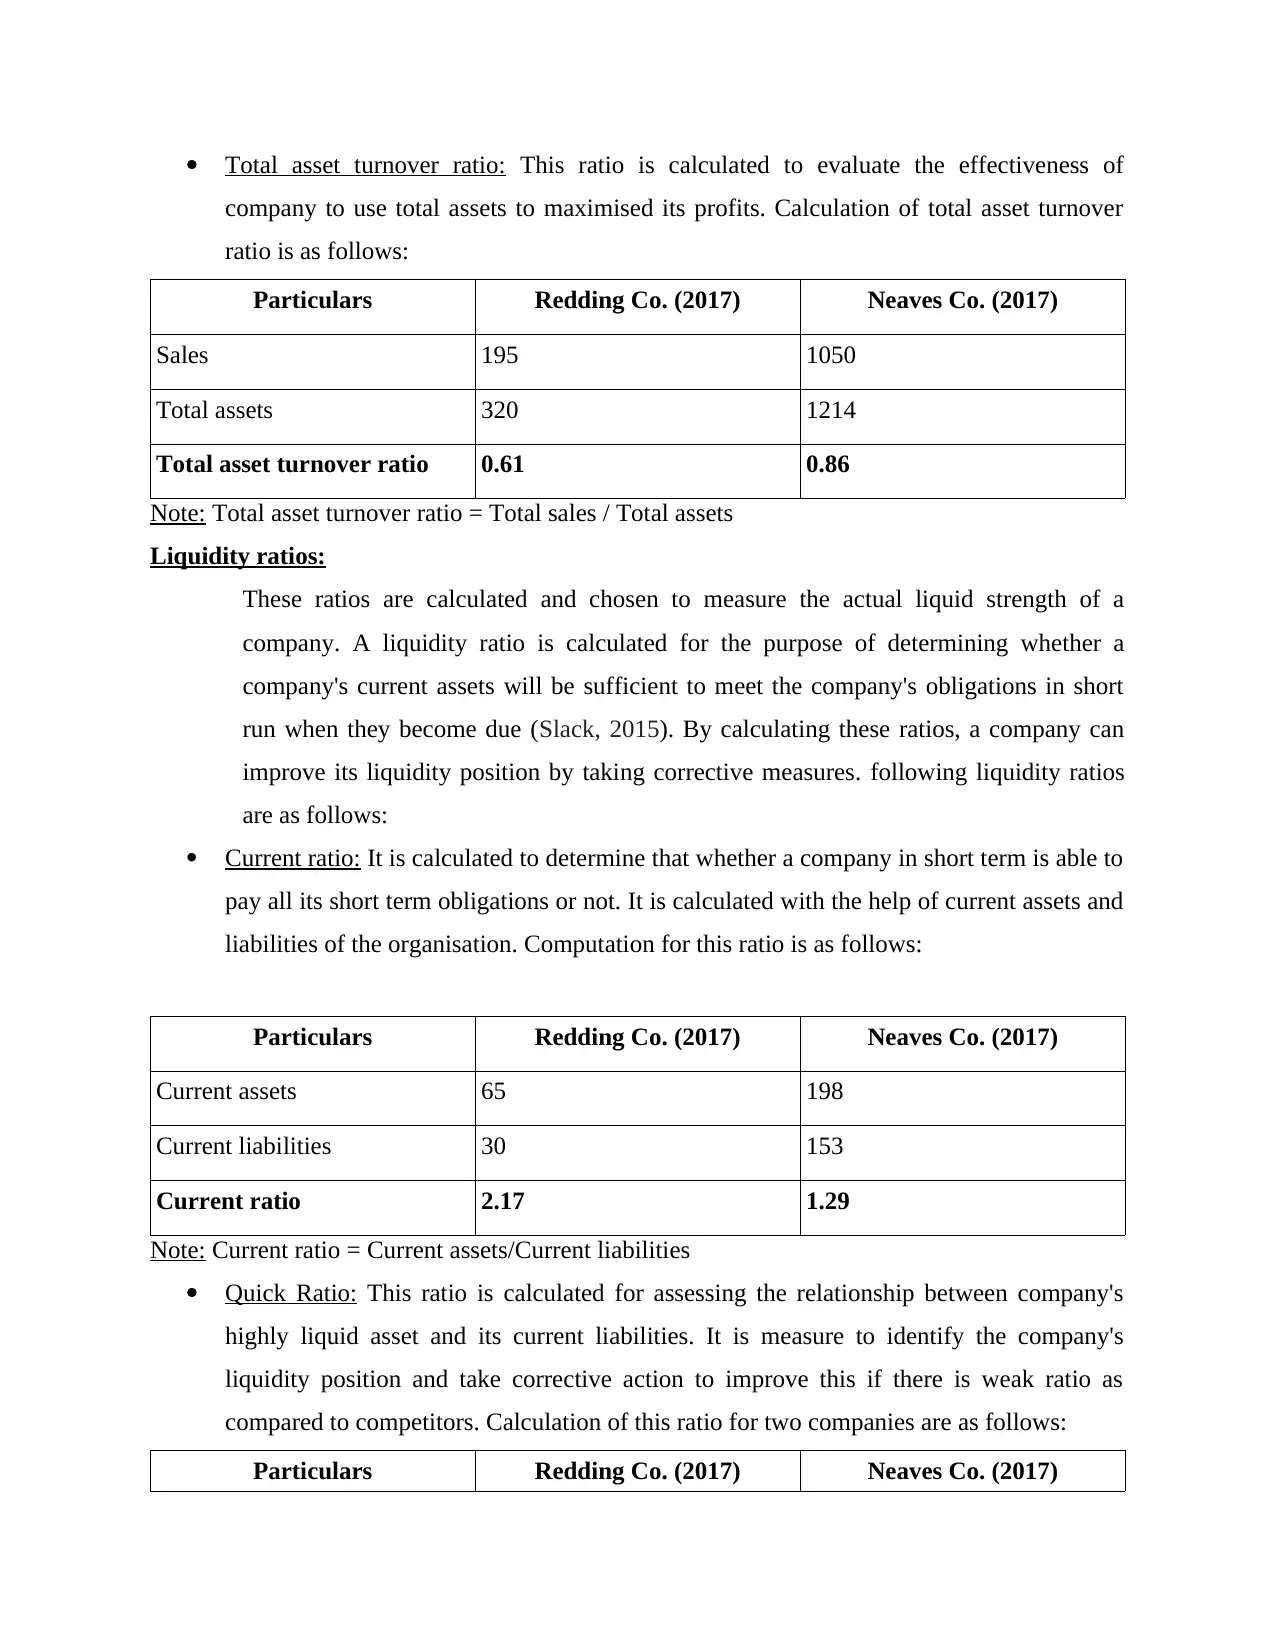
Total asset turnover ratio: This ratio is calculated to evaluate the effectiveness of
company to use total assets to maximised its profits. Calculation of total asset turnover
ratio is as follows:
Particulars Redding Co. (2017) Neaves Co. (2017)
Sales 195 1050
Total assets 320 1214
Total asset turnover ratio 0.61 0.86
Note: Total asset turnover ratio = Total sales / Total assets
Liquidity ratios:
These ratios are calculated and chosen to measure the actual liquid strength of a
company. A liquidity ratio is calculated for the purpose of determining whether a
company's current assets will be sufficient to meet the company's obligations in short
run when they become due (Slack, 2015). By calculating these ratios, a company can
improve its liquidity position by taking corrective measures. following liquidity ratios
are as follows:
Current ratio: It is calculated to determine that whether a company in short term is able to
pay all its short term obligations or not. It is calculated with the help of current assets and
liabilities of the organisation. Computation for this ratio is as follows:
Particulars Redding Co. (2017) Neaves Co. (2017)
Current assets 65 198
Current liabilities 30 153
Current ratio 2.17 1.29
Note: Current ratio = Current assets/Current liabilities
Quick Ratio: This ratio is calculated for assessing the relationship between company's
highly liquid asset and its current liabilities. It is measure to identify the company's
liquidity position and take corrective action to improve this if there is weak ratio as
compared to competitors. Calculation of this ratio for two companies are as follows:
Particulars Redding Co. (2017) Neaves Co. (2017)
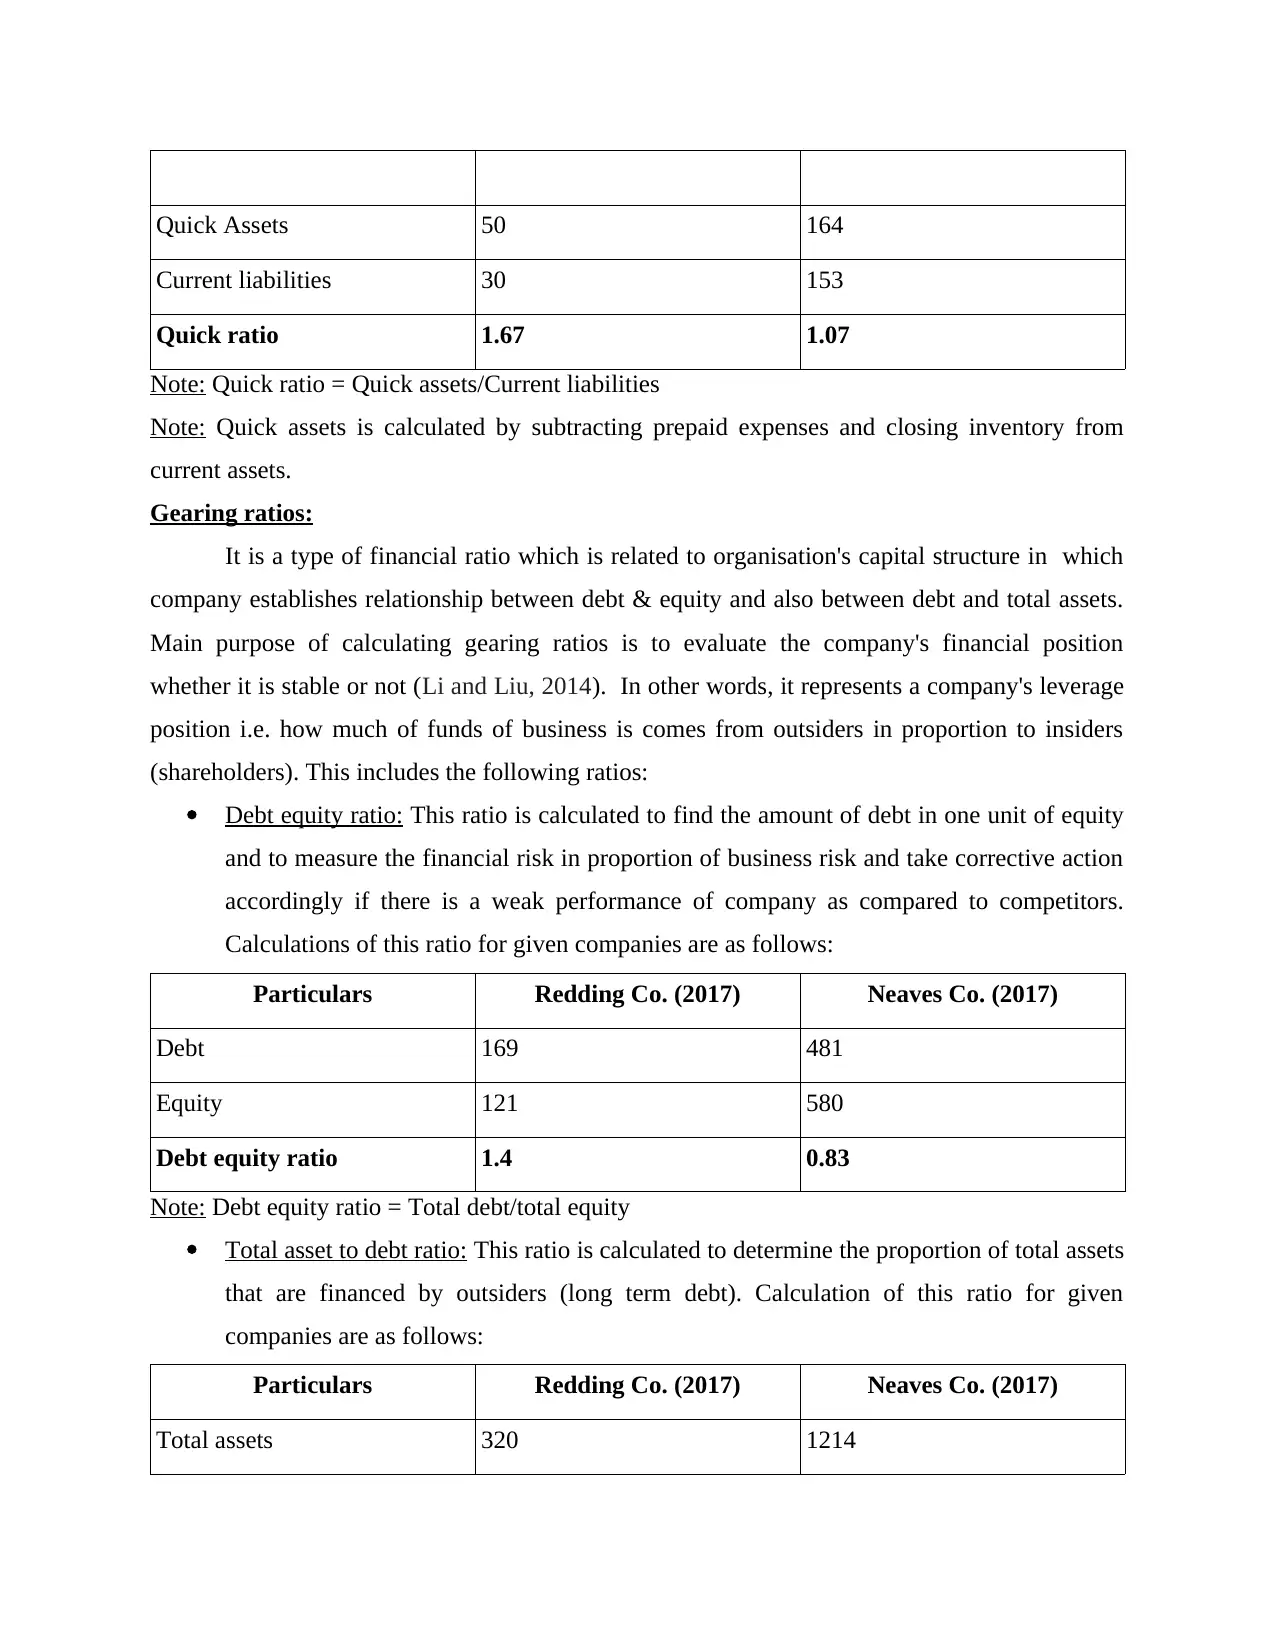
Quick Assets 50 164
Current liabilities 30 153
Quick ratio 1.67 1.07
Note: Quick ratio = Quick assets/Current liabilities
Note: Quick assets is calculated by subtracting prepaid expenses and closing inventory from
current assets.
Gearing ratios:
It is a type of financial ratio which is related to organisation's capital structure in which
company establishes relationship between debt & equity and also between debt and total assets.
Main purpose of calculating gearing ratios is to evaluate the company's financial position
whether it is stable or not (Li and Liu, 2014). In other words, it represents a company's leverage
position i.e. how much of funds of business is comes from outsiders in proportion to insiders
(shareholders). This includes the following ratios:
Debt equity ratio: This ratio is calculated to find the amount of debt in one unit of equity
and to measure the financial risk in proportion of business risk and take corrective action
accordingly if there is a weak performance of company as compared to competitors.
Calculations of this ratio for given companies are as follows:
Particulars Redding Co. (2017) Neaves Co. (2017)
Debt 169 481
Equity 121 580
Debt equity ratio 1.4 0.83
Note: Debt equity ratio = Total debt/total equity
Total asset to debt ratio: This ratio is calculated to determine the proportion of total assets
that are financed by outsiders (long term debt). Calculation of this ratio for given
companies are as follows:
Particulars Redding Co. (2017) Neaves Co. (2017)
Total assets 320 1214
⊘ This is a preview!⊘
Do you want full access?
Subscribe today to unlock all pages.
Trusted by 1+ million students worldwide
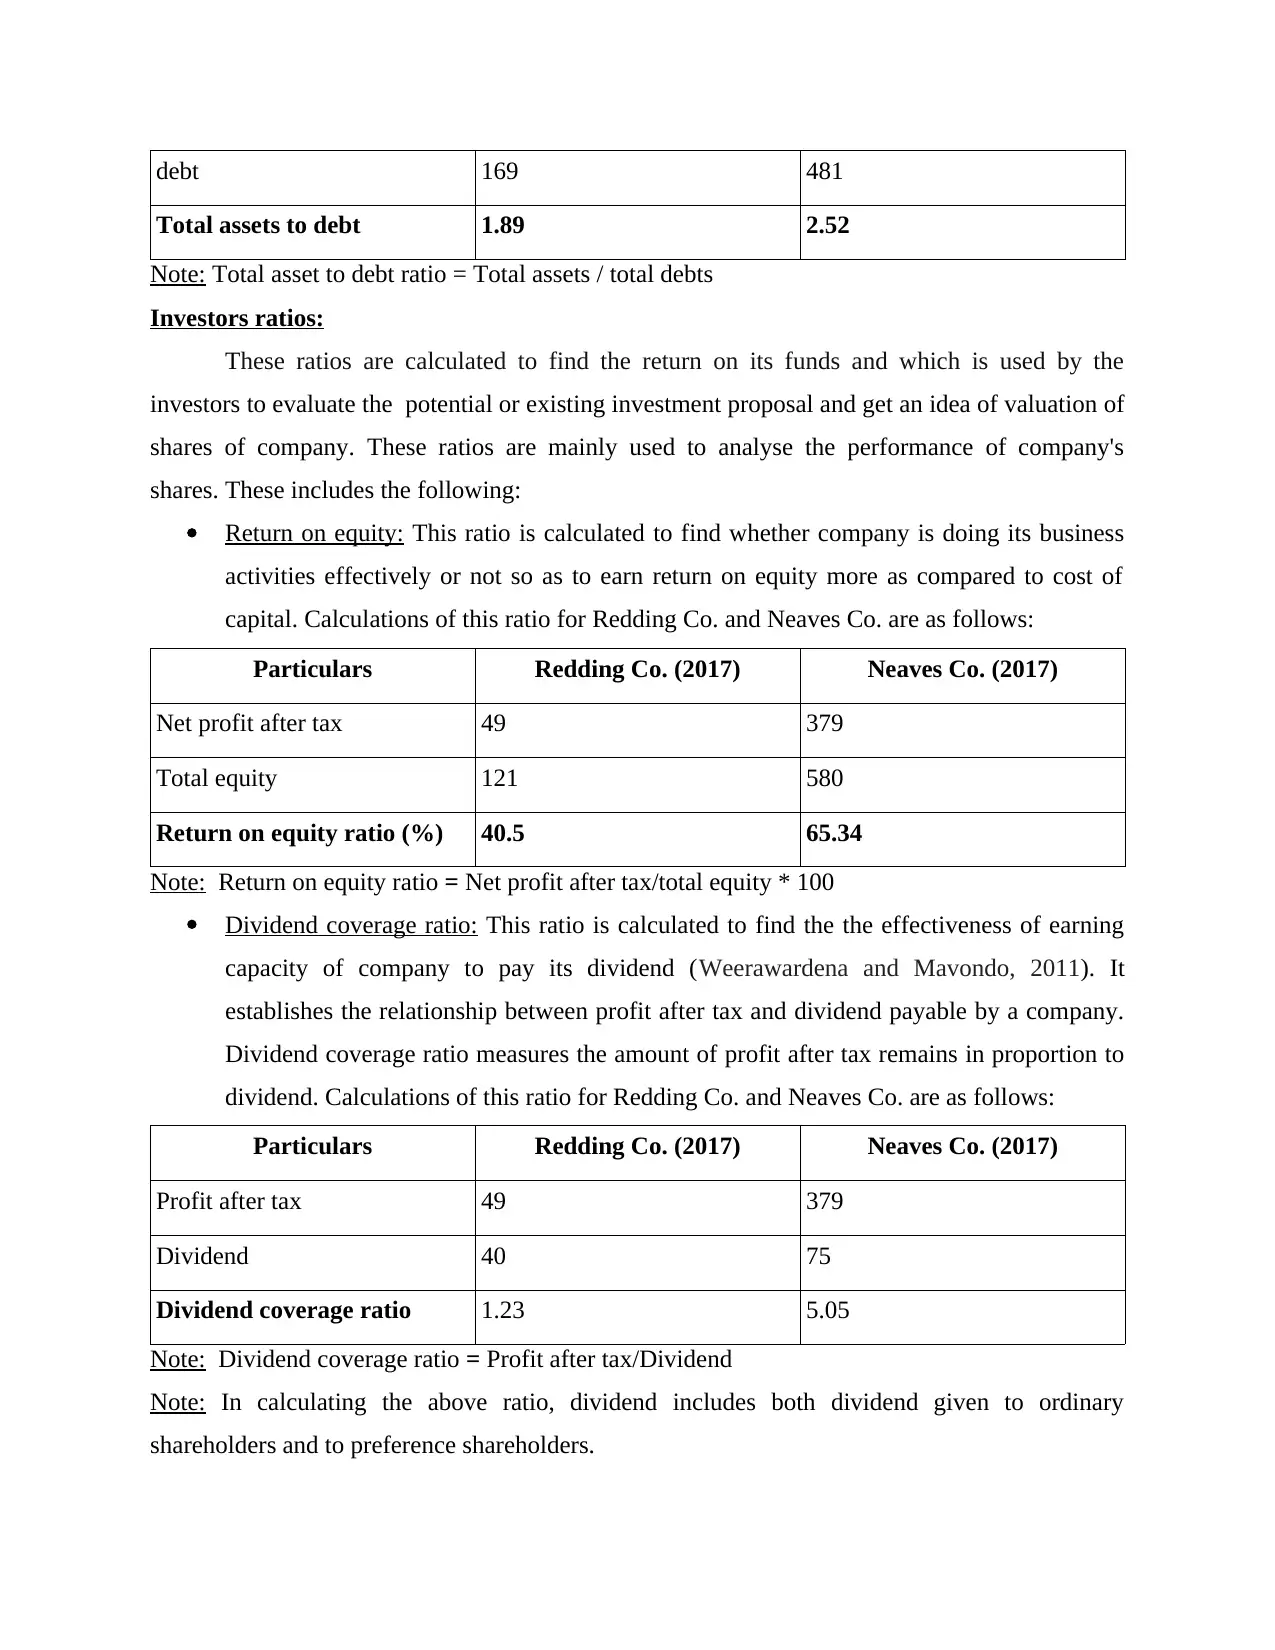
debt 169 481
Total assets to debt 1.89 2.52
Note: Total asset to debt ratio = Total assets / total debts
Investors ratios:
These ratios are calculated to find the return on its funds and which is used by the
investors to evaluate the potential or existing investment proposal and get an idea of valuation of
shares of company. These ratios are mainly used to analyse the performance of company's
shares. These includes the following:
Return on equity: This ratio is calculated to find whether company is doing its business
activities effectively or not so as to earn return on equity more as compared to cost of
capital. Calculations of this ratio for Redding Co. and Neaves Co. are as follows:
Particulars Redding Co. (2017) Neaves Co. (2017)
Net profit after tax 49 379
Total equity 121 580
Return on equity ratio (%) 40.5 65.34
Note: Return on equity ratio = Net profit after tax/total equity * 100
Dividend coverage ratio: This ratio is calculated to find the the effectiveness of earning
capacity of company to pay its dividend (Weerawardena and Mavondo, 2011). It
establishes the relationship between profit after tax and dividend payable by a company.
Dividend coverage ratio measures the amount of profit after tax remains in proportion to
dividend. Calculations of this ratio for Redding Co. and Neaves Co. are as follows:
Particulars Redding Co. (2017) Neaves Co. (2017)
Profit after tax 49 379
Dividend 40 75
Dividend coverage ratio 1.23 5.05
Note: Dividend coverage ratio = Profit after tax/Dividend
Note: In calculating the above ratio, dividend includes both dividend given to ordinary
shareholders and to preference shareholders.
Paraphrase This Document
Need a fresh take? Get an instant paraphrase of this document with our AI Paraphraser
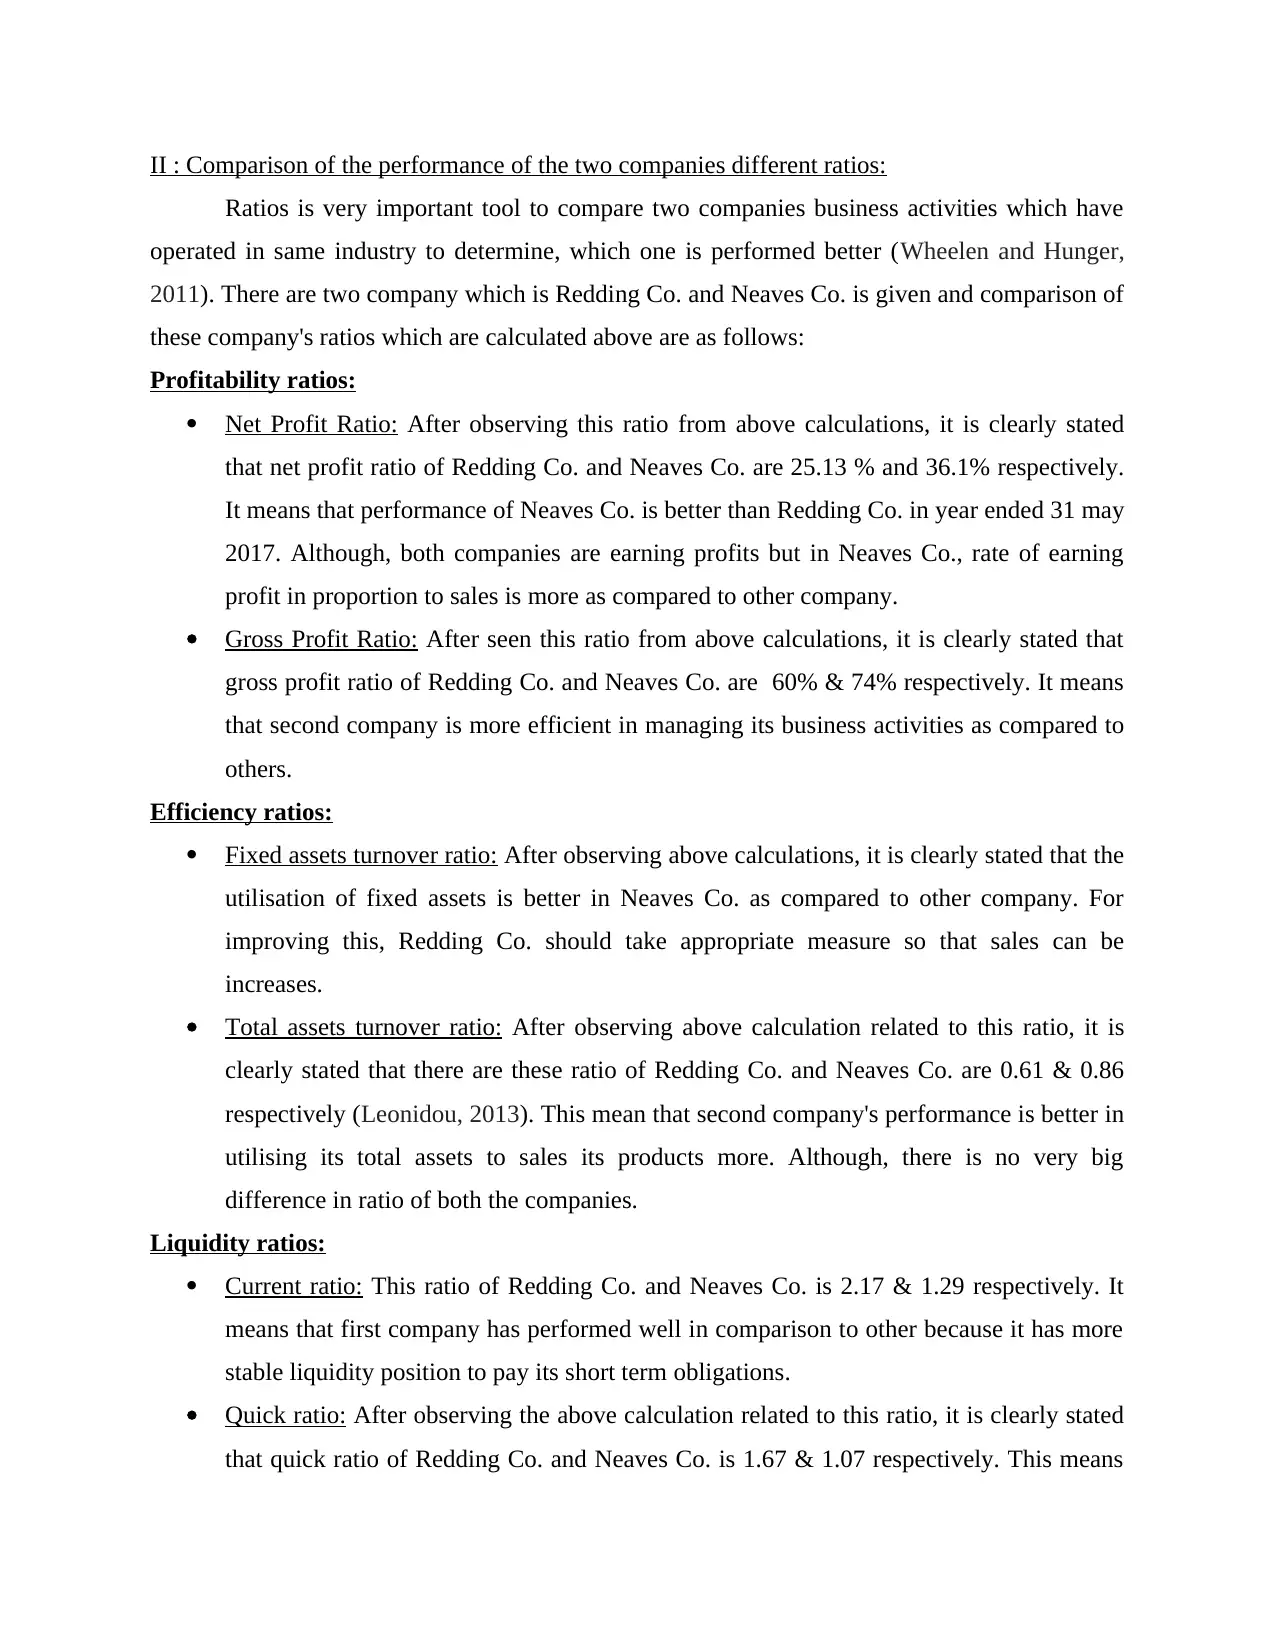
II : Comparison of the performance of the two companies different ratios:
Ratios is very important tool to compare two companies business activities which have
operated in same industry to determine, which one is performed better (Wheelen and Hunger,
2011). There are two company which is Redding Co. and Neaves Co. is given and comparison of
these company's ratios which are calculated above are as follows:
Profitability ratios:
Net Profit Ratio: After observing this ratio from above calculations, it is clearly stated
that net profit ratio of Redding Co. and Neaves Co. are 25.13 % and 36.1% respectively.
It means that performance of Neaves Co. is better than Redding Co. in year ended 31 may
2017. Although, both companies are earning profits but in Neaves Co., rate of earning
profit in proportion to sales is more as compared to other company.
Gross Profit Ratio: After seen this ratio from above calculations, it is clearly stated that
gross profit ratio of Redding Co. and Neaves Co. are 60% & 74% respectively. It means
that second company is more efficient in managing its business activities as compared to
others.
Efficiency ratios:
Fixed assets turnover ratio: After observing above calculations, it is clearly stated that the
utilisation of fixed assets is better in Neaves Co. as compared to other company. For
improving this, Redding Co. should take appropriate measure so that sales can be
increases.
Total assets turnover ratio: After observing above calculation related to this ratio, it is
clearly stated that there are these ratio of Redding Co. and Neaves Co. are 0.61 & 0.86
respectively (Leonidou, 2013). This mean that second company's performance is better in
utilising its total assets to sales its products more. Although, there is no very big
difference in ratio of both the companies.
Liquidity ratios:
Current ratio: This ratio of Redding Co. and Neaves Co. is 2.17 & 1.29 respectively. It
means that first company has performed well in comparison to other because it has more
stable liquidity position to pay its short term obligations.
Quick ratio: After observing the above calculation related to this ratio, it is clearly stated
that quick ratio of Redding Co. and Neaves Co. is 1.67 & 1.07 respectively. This means
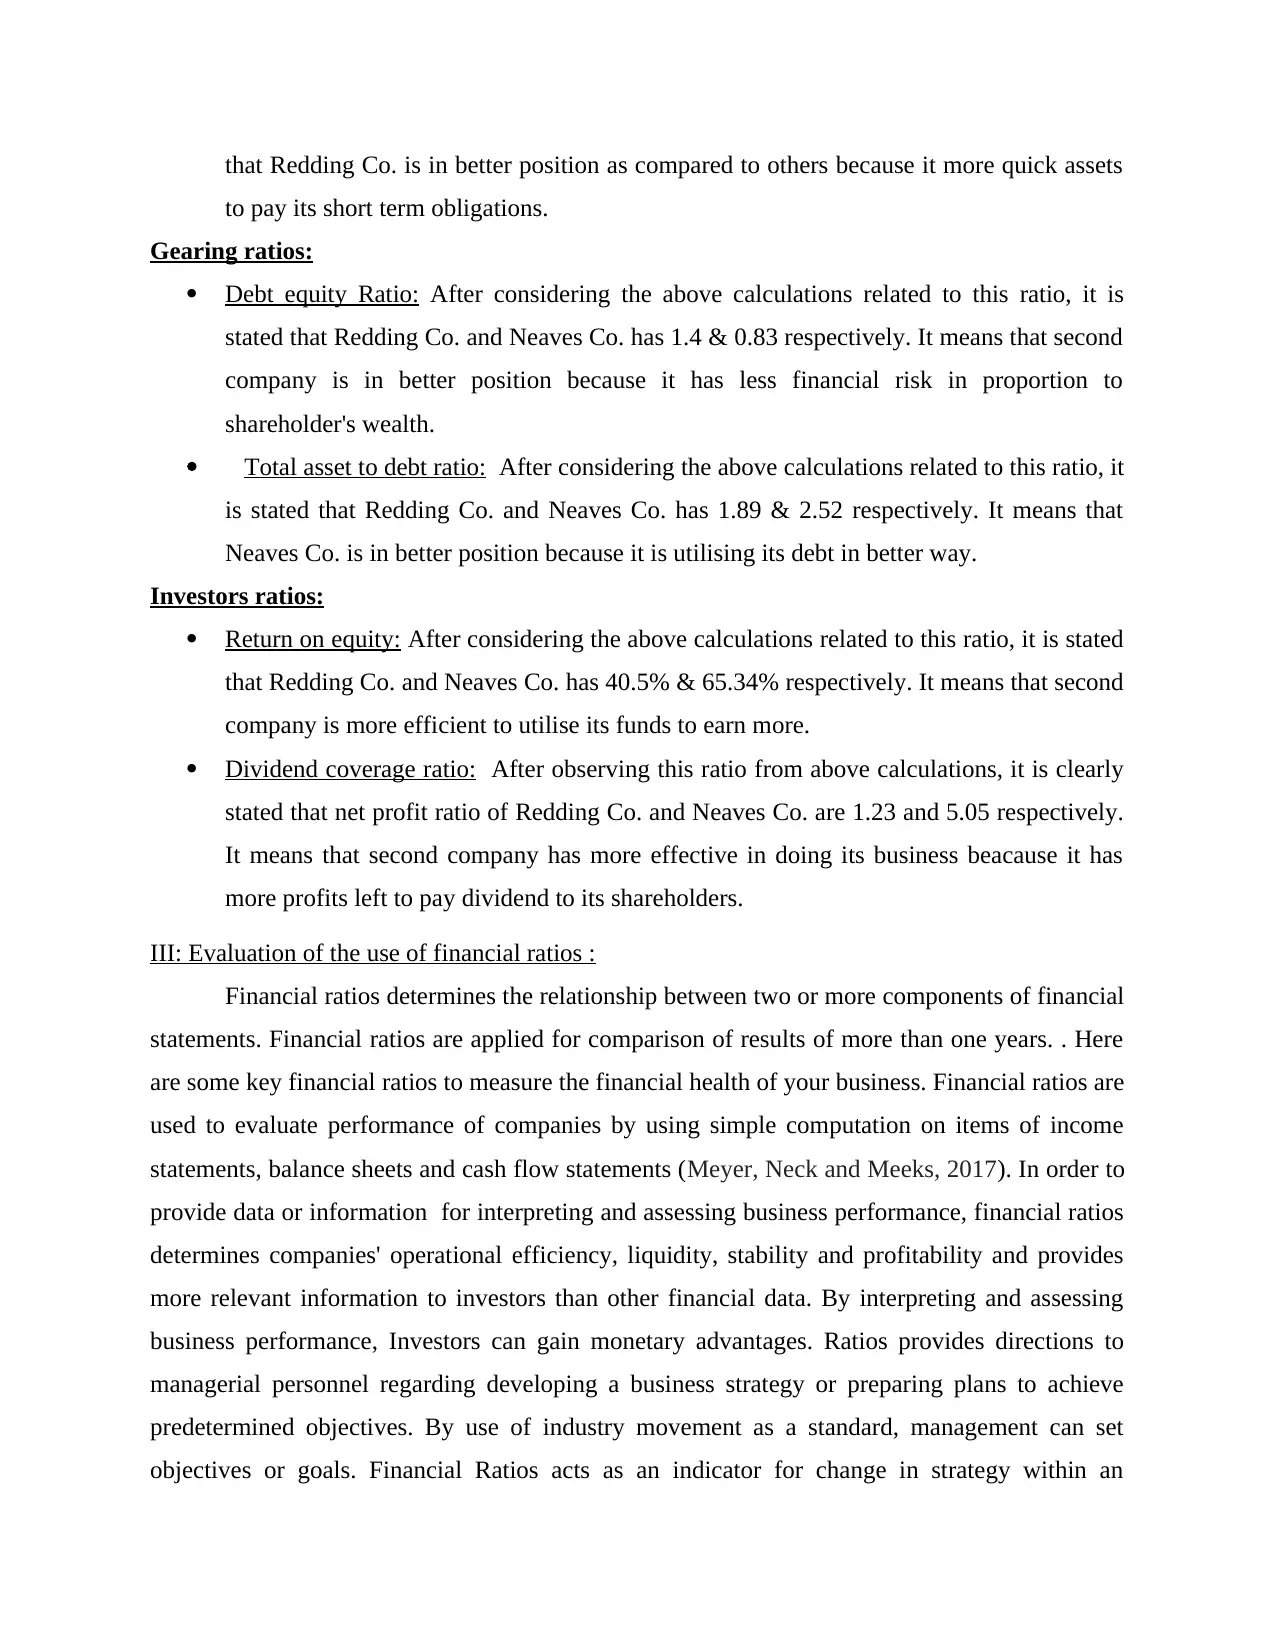
that Redding Co. is in better position as compared to others because it more quick assets
to pay its short term obligations.
Gearing ratios:
Debt equity Ratio: After considering the above calculations related to this ratio, it is
stated that Redding Co. and Neaves Co. has 1.4 & 0.83 respectively. It means that second
company is in better position because it has less financial risk in proportion to
shareholder's wealth.
Total asset to debt ratio: After considering the above calculations related to this ratio, it
is stated that Redding Co. and Neaves Co. has 1.89 & 2.52 respectively. It means that
Neaves Co. is in better position because it is utilising its debt in better way.
Investors ratios:
Return on equity: After considering the above calculations related to this ratio, it is stated
that Redding Co. and Neaves Co. has 40.5% & 65.34% respectively. It means that second
company is more efficient to utilise its funds to earn more.
Dividend coverage ratio: After observing this ratio from above calculations, it is clearly
stated that net profit ratio of Redding Co. and Neaves Co. are 1.23 and 5.05 respectively.
It means that second company has more effective in doing its business beacause it has
more profits left to pay dividend to its shareholders.
III: Evaluation of the use of financial ratios :
Financial ratios determines the relationship between two or more components of financial
statements. Financial ratios are applied for comparison of results of more than one years. . Here
are some key financial ratios to measure the financial health of your business. Financial ratios are
used to evaluate performance of companies by using simple computation on items of income
statements, balance sheets and cash flow statements (Meyer, Neck and Meeks, 2017). In order to
provide data or information for interpreting and assessing business performance, financial ratios
determines companies' operational efficiency, liquidity, stability and profitability and provides
more relevant information to investors than other financial data. By interpreting and assessing
business performance, Investors can gain monetary advantages. Ratios provides directions to
managerial personnel regarding developing a business strategy or preparing plans to achieve
predetermined objectives. By use of industry movement as a standard, management can set
objectives or goals. Financial Ratios acts as an indicator for change in strategy within an
⊘ This is a preview!⊘
Do you want full access?
Subscribe today to unlock all pages.
Trusted by 1+ million students worldwide
organization and also helps management by providing relevant guidance and feedback in
response to any structural change. Ratios presents significant financial movement in industry and
set standards for companies to evaluate their performance based on such industry standards.
Management by using these standards develop a strategy and identify the level of organisation in
industry. Financial ratios are useful in taking financing, investment and operating decisions of
company.
There are some additional information that enhance the meaning fullness of ratios
calculated such as source of data used in ratio calculation, comparison from past years ,
comparison from top competitors and projected ratio using industry trends. Overall information
used in ratio calculation is important factor which enhance reliability or meaningfulness of ratios
calculated. Such information should be from a reliable source such as company's annual report,
auditors report, data provided by any regulatory body etc. Worth of ratio calculated also
increased if a systematic comparison of ratios with previous year data or with the data of
competitors is made because it helps to address more issues. Financial ratio compiles financial
statement into comparative figures, hence assists management to analyse and assess financial
performance of company and outcomes of decisions. Financial ratio helps the management to
identify factors that affects its liquidity position, to quickly rectify the situation to avoid such
circumstances in future.
TASK 2
Agency and its significance for Listed companies :
Agency refers to financial liaison among two parties in which one party acts on the
behalf of the other. These two parties of agency are Agent and Principle. Agent is a party or
person who acts on the behalf of principle where as principal is obligated by the acts of the
agent. In the context of listed companies regulatory agencies play a major role in order to
achieve objectives of companies. A regulatory agency is a governmental body that is established
by a relevant authority to regulate other organisations. Such agencies monitor the performance
and compliance of company or organization and helps to develop clarity of information which
provide a basis for decision-making (Foss and Knudsen, 2013). Such agencies provides a
structural framework for listed companies to achieve their objectives and goals.
Paraphrase This Document
Need a fresh take? Get an instant paraphrase of this document with our AI Paraphraser
In the context of Redding Co. and Neaves Co. such agencies helps directly or indirectly
to achieve their objectives or goals. Redding Company want to take an additional funding for
refurbishment of equipment and premises, taking loan from banks is a difficult task and also
affects its financial performance in market. But by using credit rating given by credit rating
agencies, it become easier for Redding Company to take loan from bank. Neaves Company is
newly formed company which has grown by acquiring its local competitors and achieved a
equivalent growth of already established company. This is only possible due to regulatory
agency' s framework related to takeover. Agencies promotes the businesses of companies and
provides a way within the law which enable them to achieve its objectives and to expand
business.
TASK 3
Impact on Redding Co. of raising the funding for the refurbishment through additional loans:
Redding Company wants to invest $100m in a major refurbishment of their equipment
and premises, which will require additional funding through loan. Before taking such type of
financial decision company should conduct an assessment to identify possible impacts
(Rothaermel, 2015). However for a listed company, first funding option should be equity funding
instead of debt funding. In this context following are the major impacts on Redding company:
Raising funds for the refurbishment of Equipment or premises through additional loans
have an impact on owner’s ability to grow a business in case if interest rate in increased.
Such type of additional loan creates additional need of additional cash in order to repay
loans that may be results in negative net cash flow.
Some times due to increased loan repayments at a particular point of profitability of
business may be dropped, that creates difficulties for raising loans in future.
During the refurbishment of equipment and premises, income and productivity related
with such equipment and premises will be null or relatively very low meanwhile the
burden of repayments of loan can create negative growth and net loss.
Some times such type of additional loans shows unfavourable debt equity ratio, which
can reduce the confidence of investors or small shareholders.
CONCLUSION
From the above project report it has been concluded that evaluation of performance is
necessary in order to figure out various aspects of company's performance in order to make
comparison between two companies and to make projections. Through analysis of data of
Redding Company and Neaves Company using ratio analysis it is clear that Neaves is superior
and has more favourable financial ratios than Redding. Companies can use performance
evaluation to determine various operations of company, projections and factors helps in decision
making process. Some factors should be considered in order to enhance the meaningfulness of
financial ratios of company that also enhance confidence of investors.
REFERENCES:
Books and Journals:
Gamble, J. E., Thompson, A. A. and Peteraf, M. A., 2013. Essentials of strategic management:
The quest for competitive advantage. McGraw-Hill/Irwin.
Barney, J. B., 2012. Purchasing, supply chain management and sustained competitive advantage:
The relevance of resource‐based theory. Journal of supply chain management. 48(2).
pp.3-6.
Berger, L. A. and Berger, D. R. eds., 2011. The talent management handbook: Creating a
sustainable competitive advantage by selecting, developing, and promoting the best
people. New York: McGraw-Hill.
Sirmon, D. G. and et. al., 2011. Resource orchestration to create competitive advantage: Breadth,
depth, and life cycle effects. Journal of management. 37(5). pp.1390-1412.
Slack, N., 2015. Operations strategy. John Wiley & Sons, Ltd.
Li, D. Y. and Liu, J., 2014. Dynamic capabilities, environmental dynamism, and competitive
advantage: Evidence from China. Journal of Business Research. 67(1). pp.2793-2799.
Weerawardena, J. and Mavondo, F. T., 2011. Capabilities, innovation and competitive
advantage. Industrial Marketing Management. 40(8). pp.1220-1223.
Wheelen, T. L. and Hunger, J. D., 2011. Concepts in strategic management and business policy.
Pearson Education India.
Leonidou, L. C. and et. al., 2013. Resources and capabilities as drivers of hotel environmental
marketing strategy: Implications for competitive advantage and performance. Tourism
Management. 35. pp.94-110.
Meyer, G. D., Neck, H. M. and Meeks, M. D., 2017. The entrepreneurship‐strategic management
interface. Strategic entrepreneurship: Creating a new mindset, pp.17-44.
Foss, N. J. and Knudsen, C. eds., 2013. Towards a competence theory of the firm (Vol. 2).
Routledge.
Rothaermel, F. T., 2015. Strategic management. McGraw-Hill Education.
⊘ This is a preview!⊘
Do you want full access?
Subscribe today to unlock all pages.
Trusted by 1+ million students worldwide
1 out of 12
Related Documents


Your All-in-One AI-Powered Toolkit for Academic Success.
+13062052269
info@desklib.com
Available 24*7 on WhatsApp / Email
![[object Object]](/_next/static/media/star-bottom.7253800d.svg)
Unlock your academic potential
Copyright © 2020–2026 A2Z Services. All Rights Reserved. Developed and managed by ZUCOL.