University of Sunderland Financial Management Report
VerifiedAdded on 2022/12/23
|14
|3924
|90
Report
AI Summary
This report provides a comprehensive analysis of financial management principles, focusing on investment appraisal techniques and market efficiency. It begins with an introduction to financial management and its importance in business, defining key concepts and objectives. The main body of the report is divided into two parts. Part A delves into the application of various investment appraisal methods, including the payback period, net present value (NPV), accounting rate of return (ARR), and internal rate of return (IRR), with detailed calculations for Project X and Project Y. The report evaluates the benefits and limitations of each method, offering insights into their practical applications and implications for decision-making. Part B assesses the strengths of market efficiency, supported by relevant academic evidence. The report concludes by summarizing the key findings and emphasizing the significance of financial management in achieving organizational goals. The report includes tables with calculations for payback period, NPV, ARR, and IRR for two projects, and references relevant academic sources to support its analysis. This report is a detailed analysis of financial management concepts, investment appraisal, and market efficiency, designed to provide a comprehensive understanding of the topic.

Financial management
Paraphrase This Document
Need a fresh take? Get an instant paraphrase of this document with our AI Paraphraser

Table of Contents
INTRODUCTION...........................................................................................................................3
MAIN BODY...................................................................................................................................3
Part A...........................................................................................................................................3
Part B ..........................................................................................................................................8
CONCLUSION..............................................................................................................................10
REFERENCES................................................................................................................................1
INTRODUCTION
Financial management is most important aspect in the business that include the excellent
knowledge in financial terms and also refers to planning, organising, directing and controlling of
financial undertakings (Akbasheva and Yaitskaya, 2021). It is refers as essential form of
determining and allocation of the objectives of the company. In this report, it is being discussed
about the different forms of investment appraisal such as Payback period, Accounting rate of
return, Net present value and IRR and discussed their limitation and benefits in the organisation.
Apart from that it is being evaluated the three differing strengths of market efficiency with the
support of relevant academic evidence.
MAIN BODY
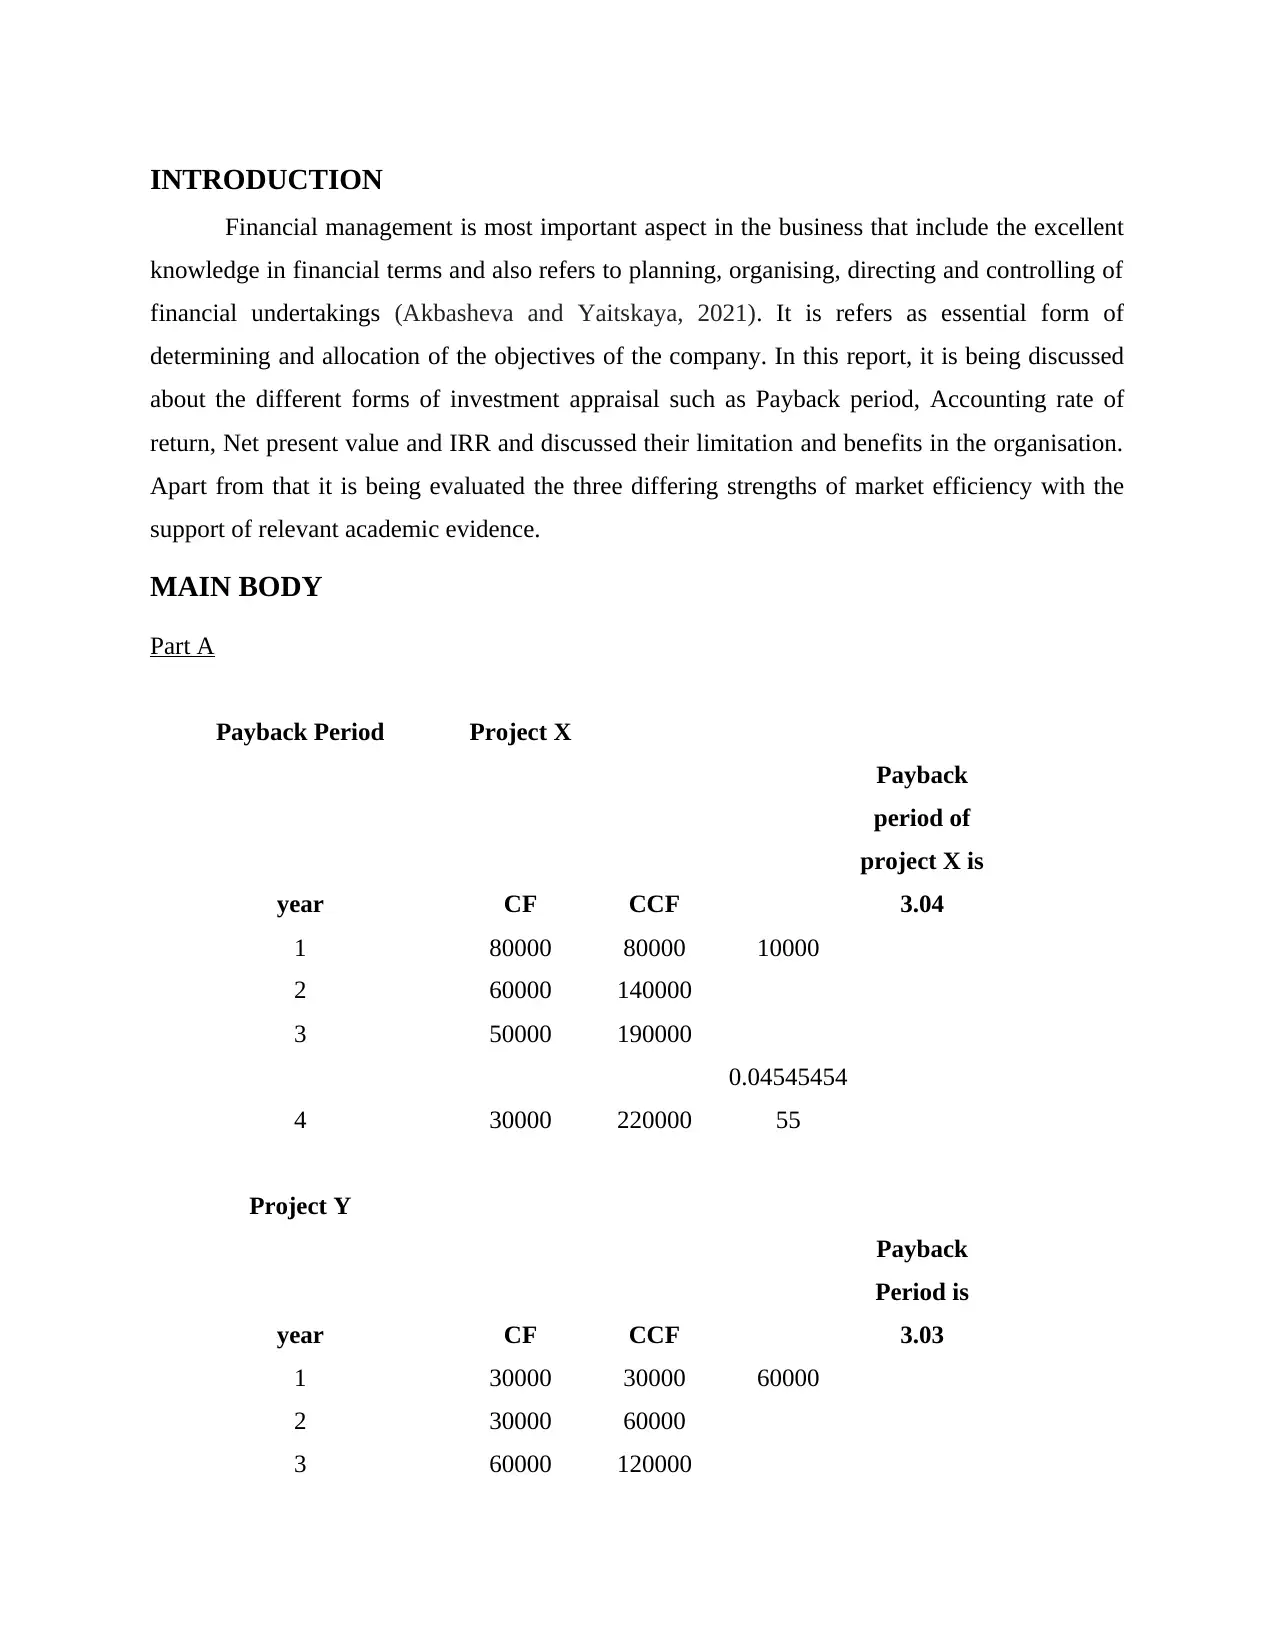
Part A
Payback Period Project X
year CF CCF
Payback
period of
project X is
3.04
1 80000 80000 10000
2 60000 140000
3 50000 190000
4 30000 220000
0.04545454
55
Project Y
year CF CCF
Payback
Period is
3.03
1 30000 30000 60000
2 30000 60000
3 60000 120000
Financial management is most important aspect in the business that include the excellent
knowledge in financial terms and also refers to planning, organising, directing and controlling of
financial undertakings (Akbasheva and Yaitskaya, 2021). It is refers as essential form of
determining and allocation of the objectives of the company. In this report, it is being discussed
about the different forms of investment appraisal such as Payback period, Accounting rate of
return, Net present value and IRR and discussed their limitation and benefits in the organisation.
Apart from that it is being evaluated the three differing strengths of market efficiency with the
support of relevant academic evidence.
MAIN BODY
Part A
Payback Period Project X
year CF CCF
Payback
period of
project X is
3.04
1 80000 80000 10000
2 60000 140000
3 50000 190000
4 30000 220000
0.04545454
55
Project Y
year CF CCF
Payback
Period is
3.03
1 30000 30000 60000
2 30000 60000
3 60000 120000
⊘ This is a preview!⊘
Do you want full access?
Subscribe today to unlock all pages.
Trusted by 1+ million students worldwide
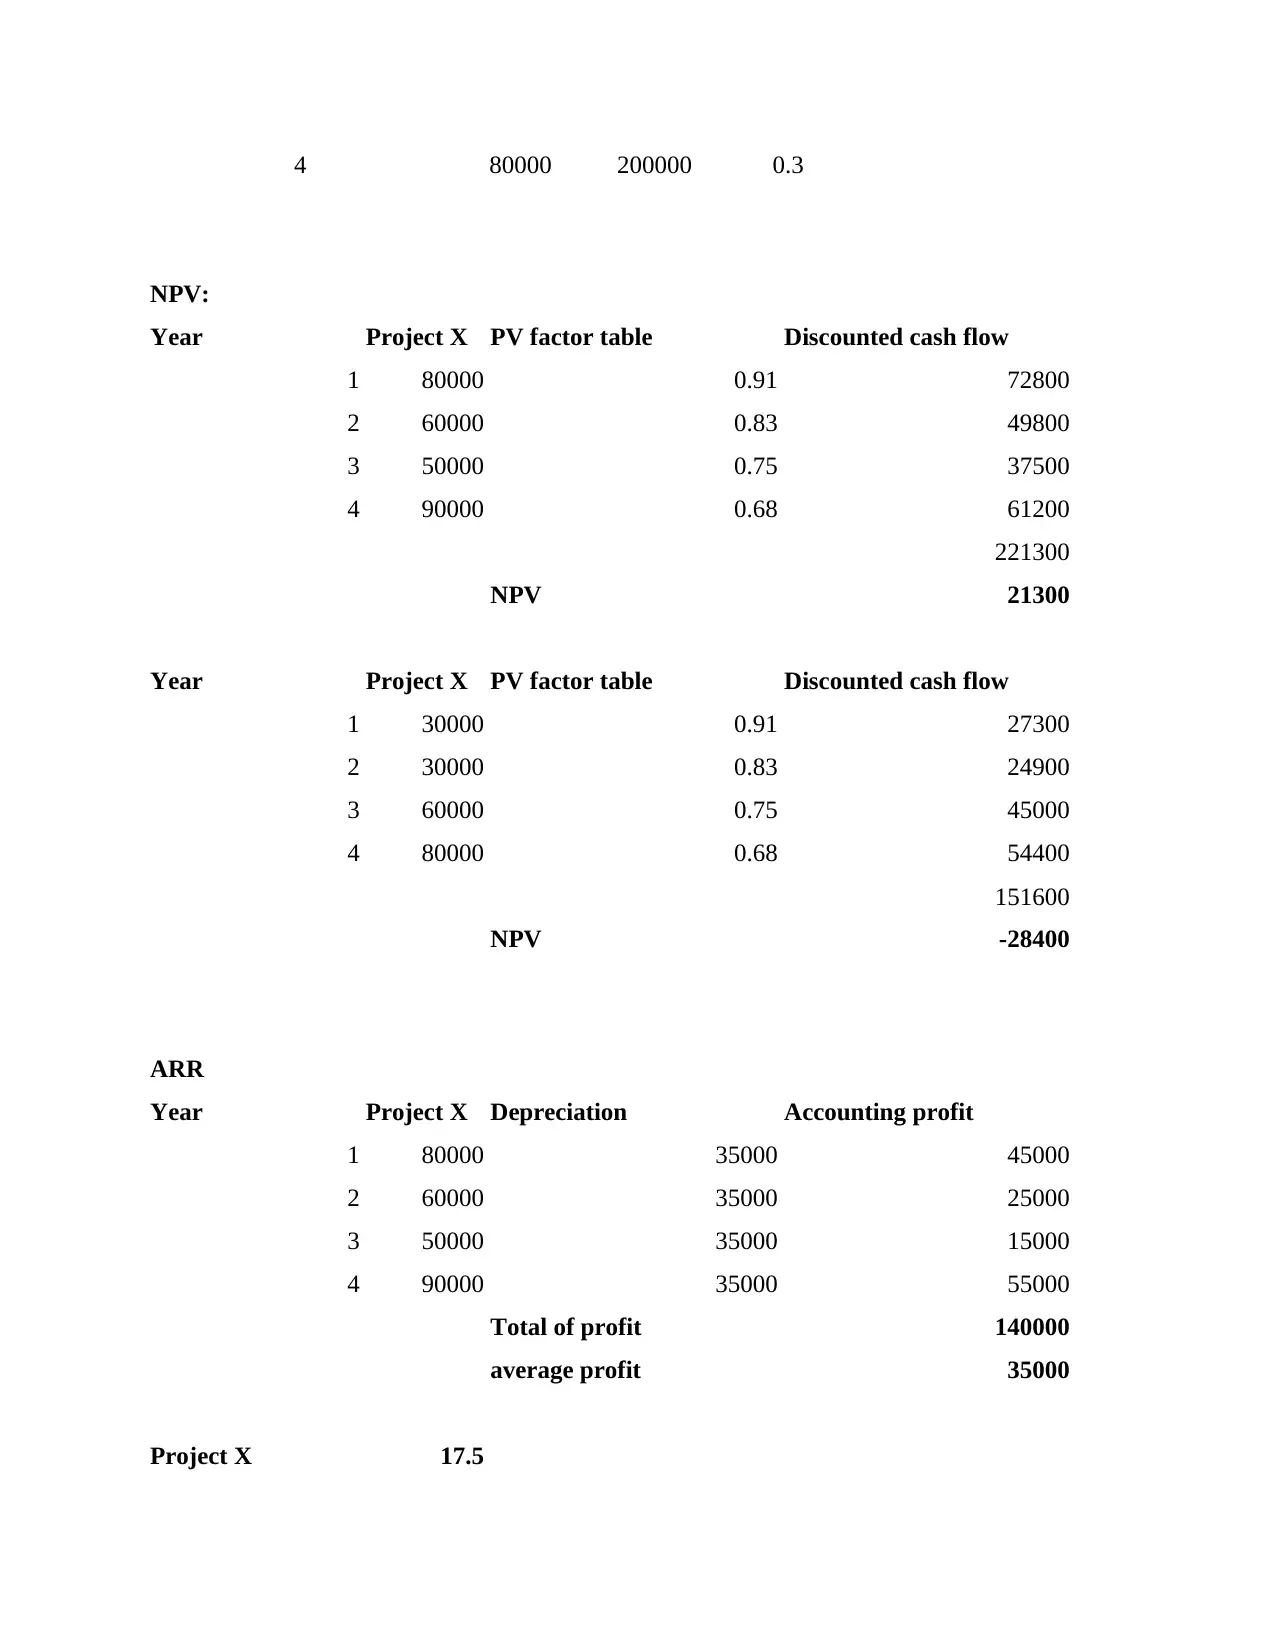
4 80000 200000 0.3
NPV:
Year Project X PV factor table Discounted cash flow
1 80000 0.91 72800
2 60000 0.83 49800
3 50000 0.75 37500
4 90000 0.68 61200
221300
NPV 21300
Year Project X PV factor table Discounted cash flow
1 30000 0.91 27300
2 30000 0.83 24900
3 60000 0.75 45000
4 80000 0.68 54400
151600
NPV -28400
ARR
Year Project X Depreciation Accounting profit
1 80000 35000 45000
2 60000 35000 25000
3 50000 35000 15000
4 90000 35000 55000
Total of profit 140000
average profit 35000
Project X 17.5
Paraphrase This Document
Need a fresh take? Get an instant paraphrase of this document with our AI Paraphraser

Year Project Y Depreciation Accounting profit
1 30000 44000 -14000
2 30000 44000 -14000
3 60000 44000 16000
4 80000 44000 36000
Total of profit 24000
average profit 6000
Project Y 3.3
IRR
Year Project X
0 -200000
1 80000
2 60000
3 50000
4 90000
15%
Year Project Y
0 -180000
1 30000
2 30000
3 60000
4 80000
4%
Pay back period: It is considered as time which is required to recover their initial investment
that shows how long it takes for business as an investment (Anton, 2018). The amount of time
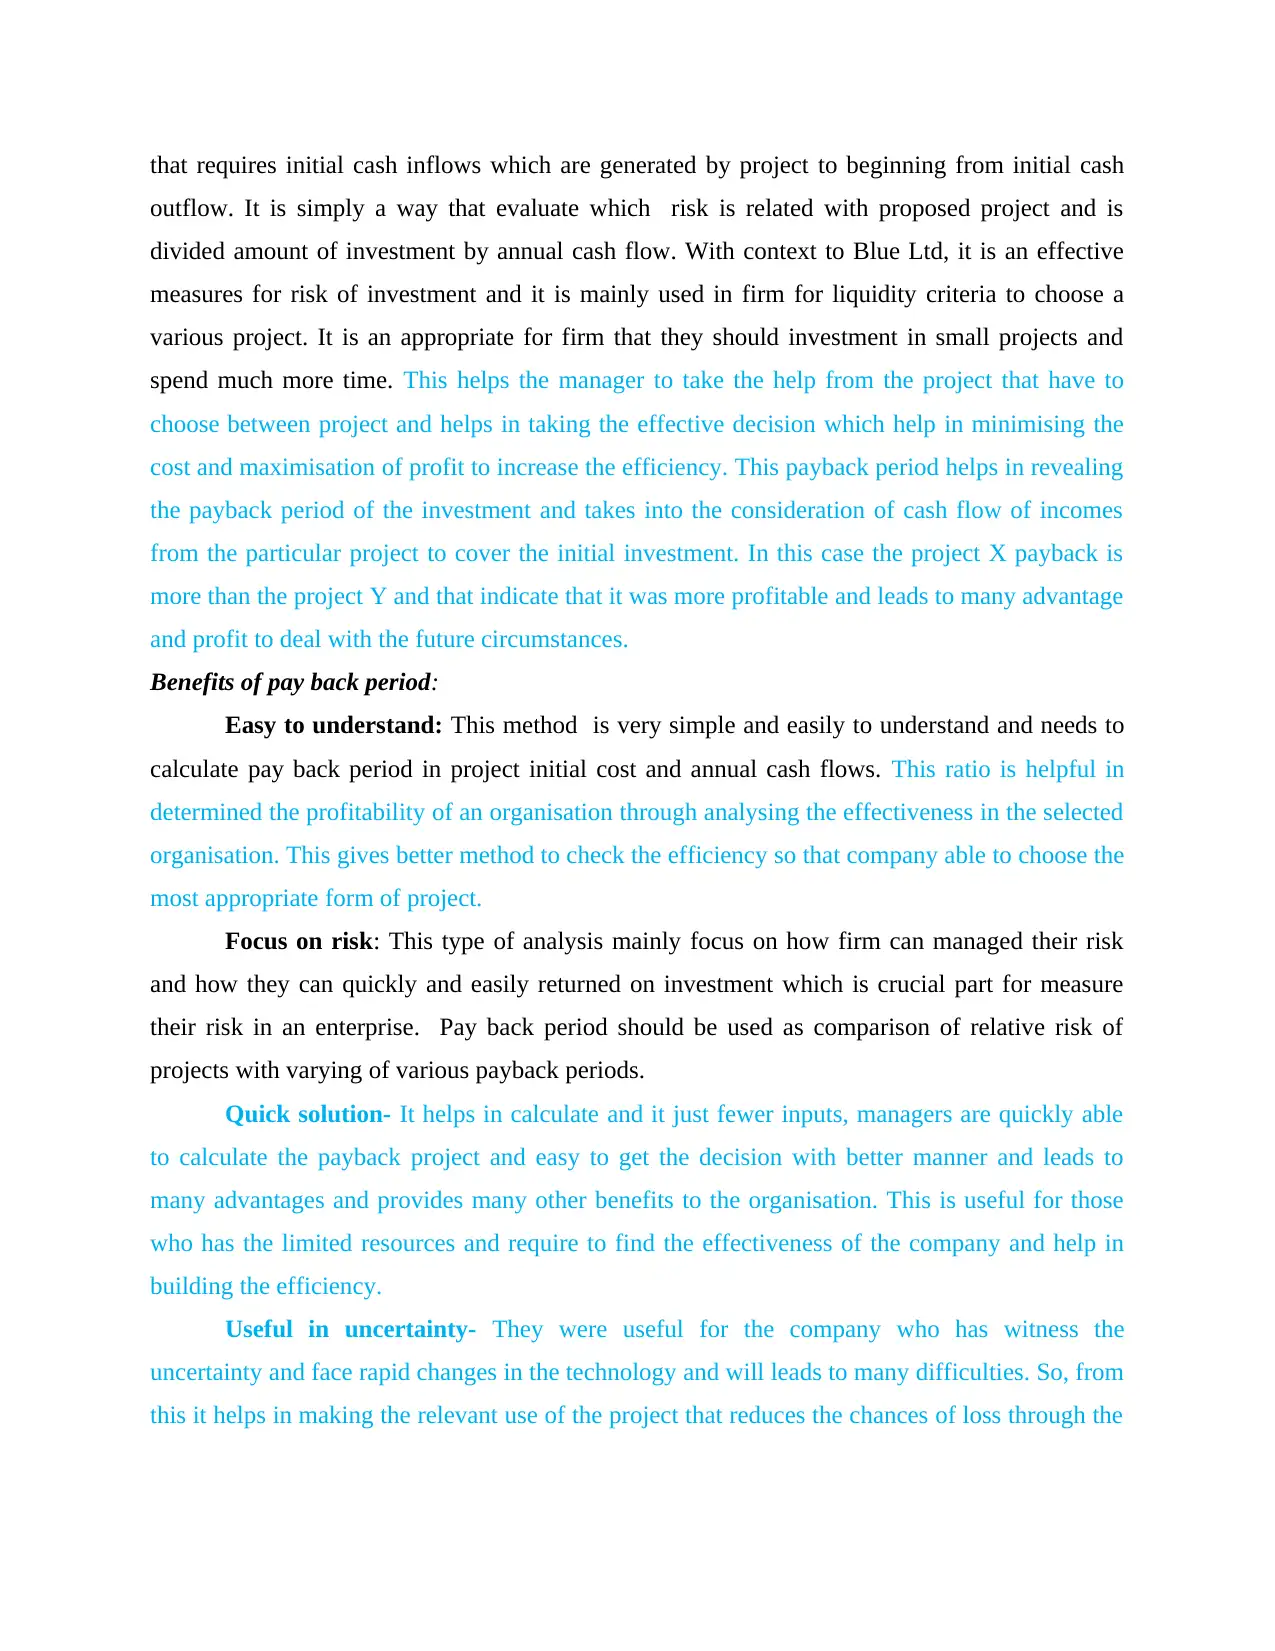
that requires initial cash inflows which are generated by project to beginning from initial cash
outflow. It is simply a way that evaluate which risk is related with proposed project and is
divided amount of investment by annual cash flow. With context to Blue Ltd, it is an effective
measures for risk of investment and it is mainly used in firm for liquidity criteria to choose a
various project. It is an appropriate for firm that they should investment in small projects and
spend much more time. This helps the manager to take the help from the project that have to
choose between project and helps in taking the effective decision which help in minimising the
cost and maximisation of profit to increase the efficiency. This payback period helps in revealing
the payback period of the investment and takes into the consideration of cash flow of incomes
from the particular project to cover the initial investment. In this case the project X payback is
more than the project Y and that indicate that it was more profitable and leads to many advantage
and profit to deal with the future circumstances.
Benefits of pay back period:
Easy to understand: This method is very simple and easily to understand and needs to
calculate pay back period in project initial cost and annual cash flows. This ratio is helpful in
determined the profitability of an organisation through analysing the effectiveness in the selected
organisation. This gives better method to check the efficiency so that company able to choose the
most appropriate form of project.
Focus on risk: This type of analysis mainly focus on how firm can managed their risk
and how they can quickly and easily returned on investment which is crucial part for measure
their risk in an enterprise. Pay back period should be used as comparison of relative risk of
projects with varying of various payback periods.
Quick solution- It helps in calculate and it just fewer inputs, managers are quickly able
to calculate the payback project and easy to get the decision with better manner and leads to
many advantages and provides many other benefits to the organisation. This is useful for those
who has the limited resources and require to find the effectiveness of the company and help in
building the efficiency.
Useful in uncertainty- They were useful for the company who has witness the
uncertainty and face rapid changes in the technology and will leads to many difficulties. So, from
this it helps in making the relevant use of the project that reduces the chances of loss through the
⊘ This is a preview!⊘
Do you want full access?
Subscribe today to unlock all pages.
Trusted by 1+ million students worldwide
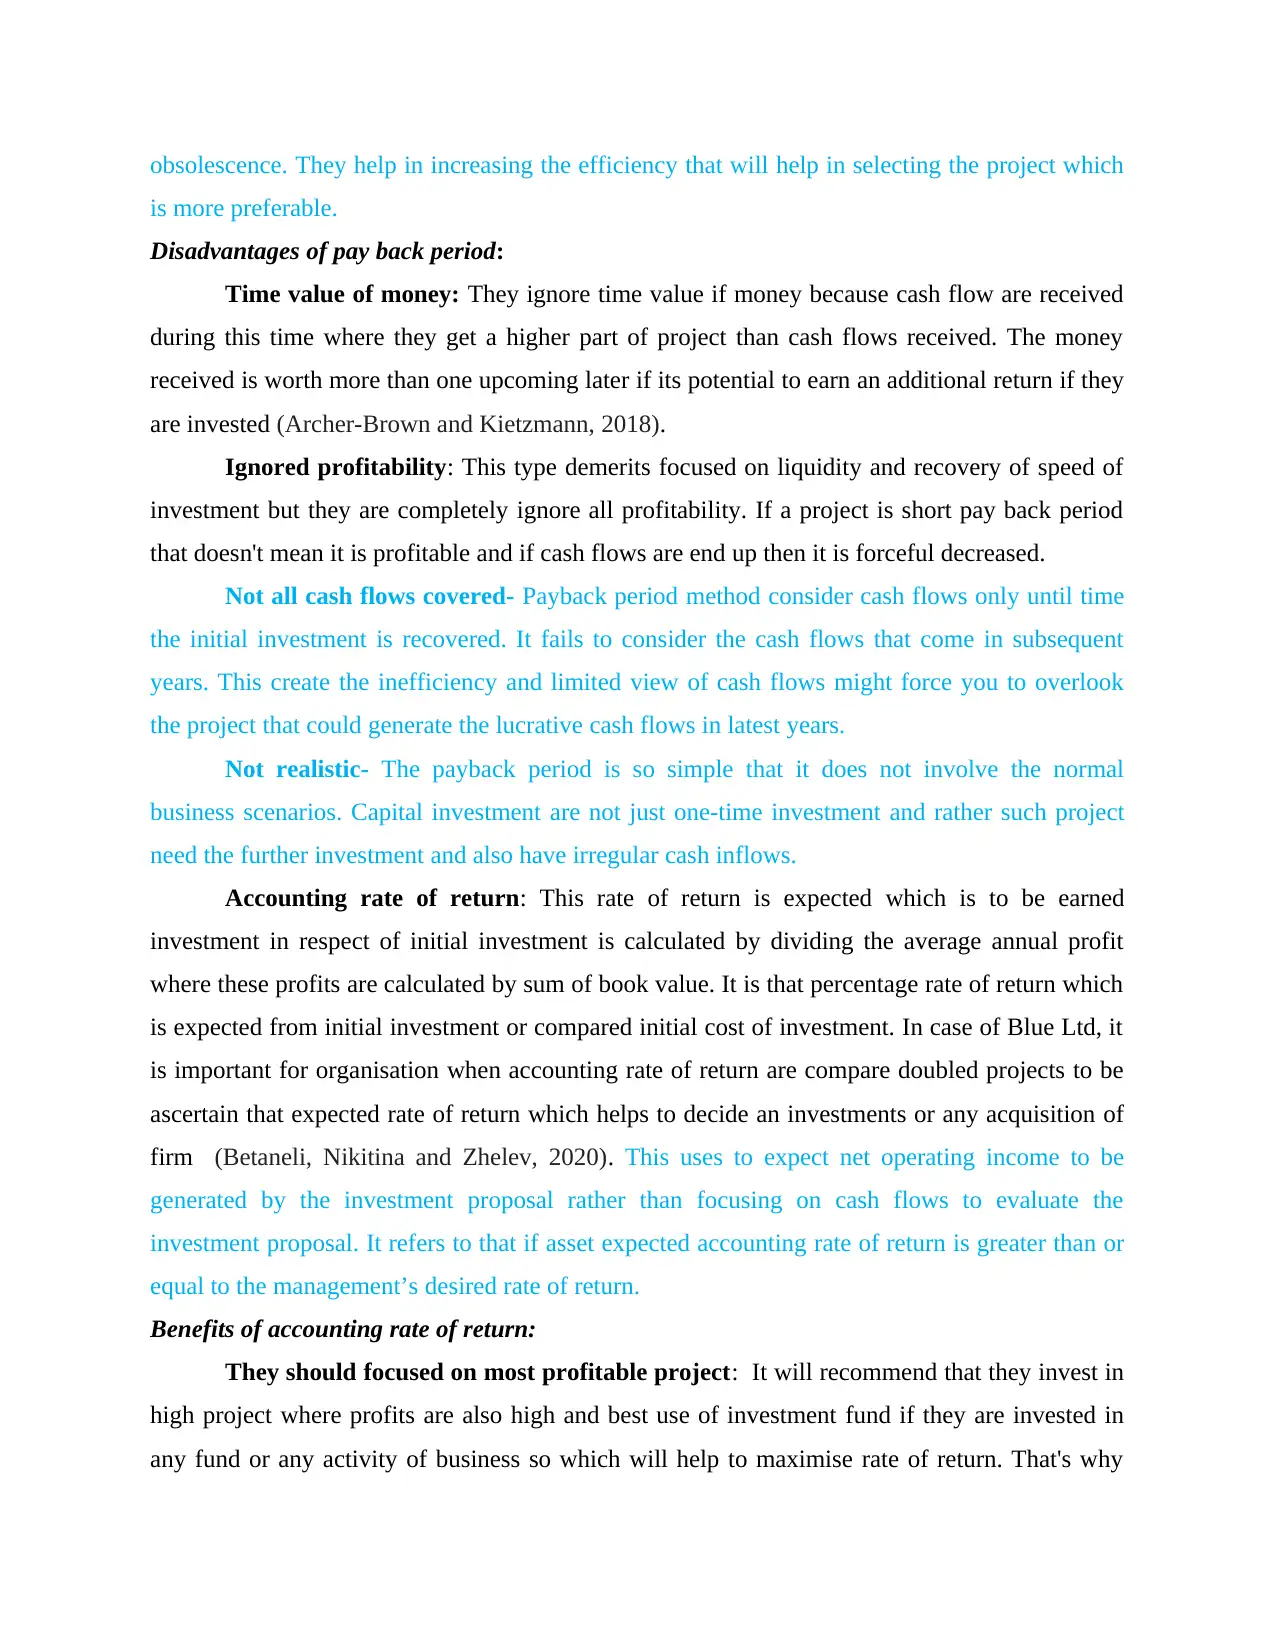
obsolescence. They help in increasing the efficiency that will help in selecting the project which
is more preferable.
Disadvantages of pay back period:
Time value of money: They ignore time value if money because cash flow are received
during this time where they get a higher part of project than cash flows received. The money
received is worth more than one upcoming later if its potential to earn an additional return if they
are invested (Archer-Brown and Kietzmann, 2018).
Ignored profitability: This type demerits focused on liquidity and recovery of speed of
investment but they are completely ignore all profitability. If a project is short pay back period
that doesn't mean it is profitable and if cash flows are end up then it is forceful decreased.
Not all cash flows covered- Payback period method consider cash flows only until time
the initial investment is recovered. It fails to consider the cash flows that come in subsequent
years. This create the inefficiency and limited view of cash flows might force you to overlook
the project that could generate the lucrative cash flows in latest years.
Not realistic- The payback period is so simple that it does not involve the normal
business scenarios. Capital investment are not just one-time investment and rather such project
need the further investment and also have irregular cash inflows.
Accounting rate of return: This rate of return is expected which is to be earned
investment in respect of initial investment is calculated by dividing the average annual profit
where these profits are calculated by sum of book value. It is that percentage rate of return which
is expected from initial investment or compared initial cost of investment. In case of Blue Ltd, it
is important for organisation when accounting rate of return are compare doubled projects to be
ascertain that expected rate of return which helps to decide an investments or any acquisition of
firm (Betaneli, Nikitina and Zhelev, 2020). This uses to expect net operating income to be
generated by the investment proposal rather than focusing on cash flows to evaluate the
investment proposal. It refers to that if asset expected accounting rate of return is greater than or
equal to the management’s desired rate of return.
Benefits of accounting rate of return:
They should focused on most profitable project: It will recommend that they invest in
high project where profits are also high and best use of investment fund if they are invested in
any fund or any activity of business so which will help to maximise rate of return. That's why
Paraphrase This Document
Need a fresh take? Get an instant paraphrase of this document with our AI Paraphraser

they should focused on profitable project that will impact on profitability an productivity in an
organisation. It can gives clear picture of project.
Simple method: This method is very easy to understand and simple because it does not
require any complicated situation. It considers total profits and savings over time period for
various economic life of project. ARR is a technique for comparing actual capital projects that
would be easily understood by everyone.
Facilitates decision rules- It is easy to take the decision regarding the suitable capital
project. As, project with higher ARR is selected and project with lower ARR is ignored. This
helps the manager to take fast decision as compared to others as it is easy to understand and also
to select the project.
Limitations of accounting rate of return:
Ignores time factors: It is a method which does not require time value of money and
long time project will be highly selected on basis of accounting rate of return. The main primary
weakness that average return method selection of alternative use of funds is that time of funds
which is being ignored (Klimek and Jędrych, 2021).
Ignore whole project team: It is mainly focused on each and every year profits instead
of entire return of project. In fact, most of the project have low returns because of it has long
useful life. It ignores that period of profits which have to be earned in 20% rate of return on 10
years and it is not no longer term of project and risk is also involved.
Inconsistence- Accounting rate of return does not remain constant over useful life for
many projects and thus look desirable in one period but undesirable in another period. This leads
to confusion among the manager about profitability and accuracy of the project and leads to
many problems.
Net present value: It is a difference between net present value of cash inflow and net
present value of cash outflow over a specific period of time. The value of net present is required
that rate of return where project are compared to initial investment of other project. In case of
Blue Ltd, it is useful for managers that need to compare of initial spending of cash against the net
present value of return. It can also consider time value of money for upcoming cash flows. It is
helpful to determine capital budgeting for analyse main profitability of an investment projected.
This helps in let you know whether the value of all cash flows that project generates will exceed
the cost of starting the particular project and tells whether that project is positive or negative
outlook.
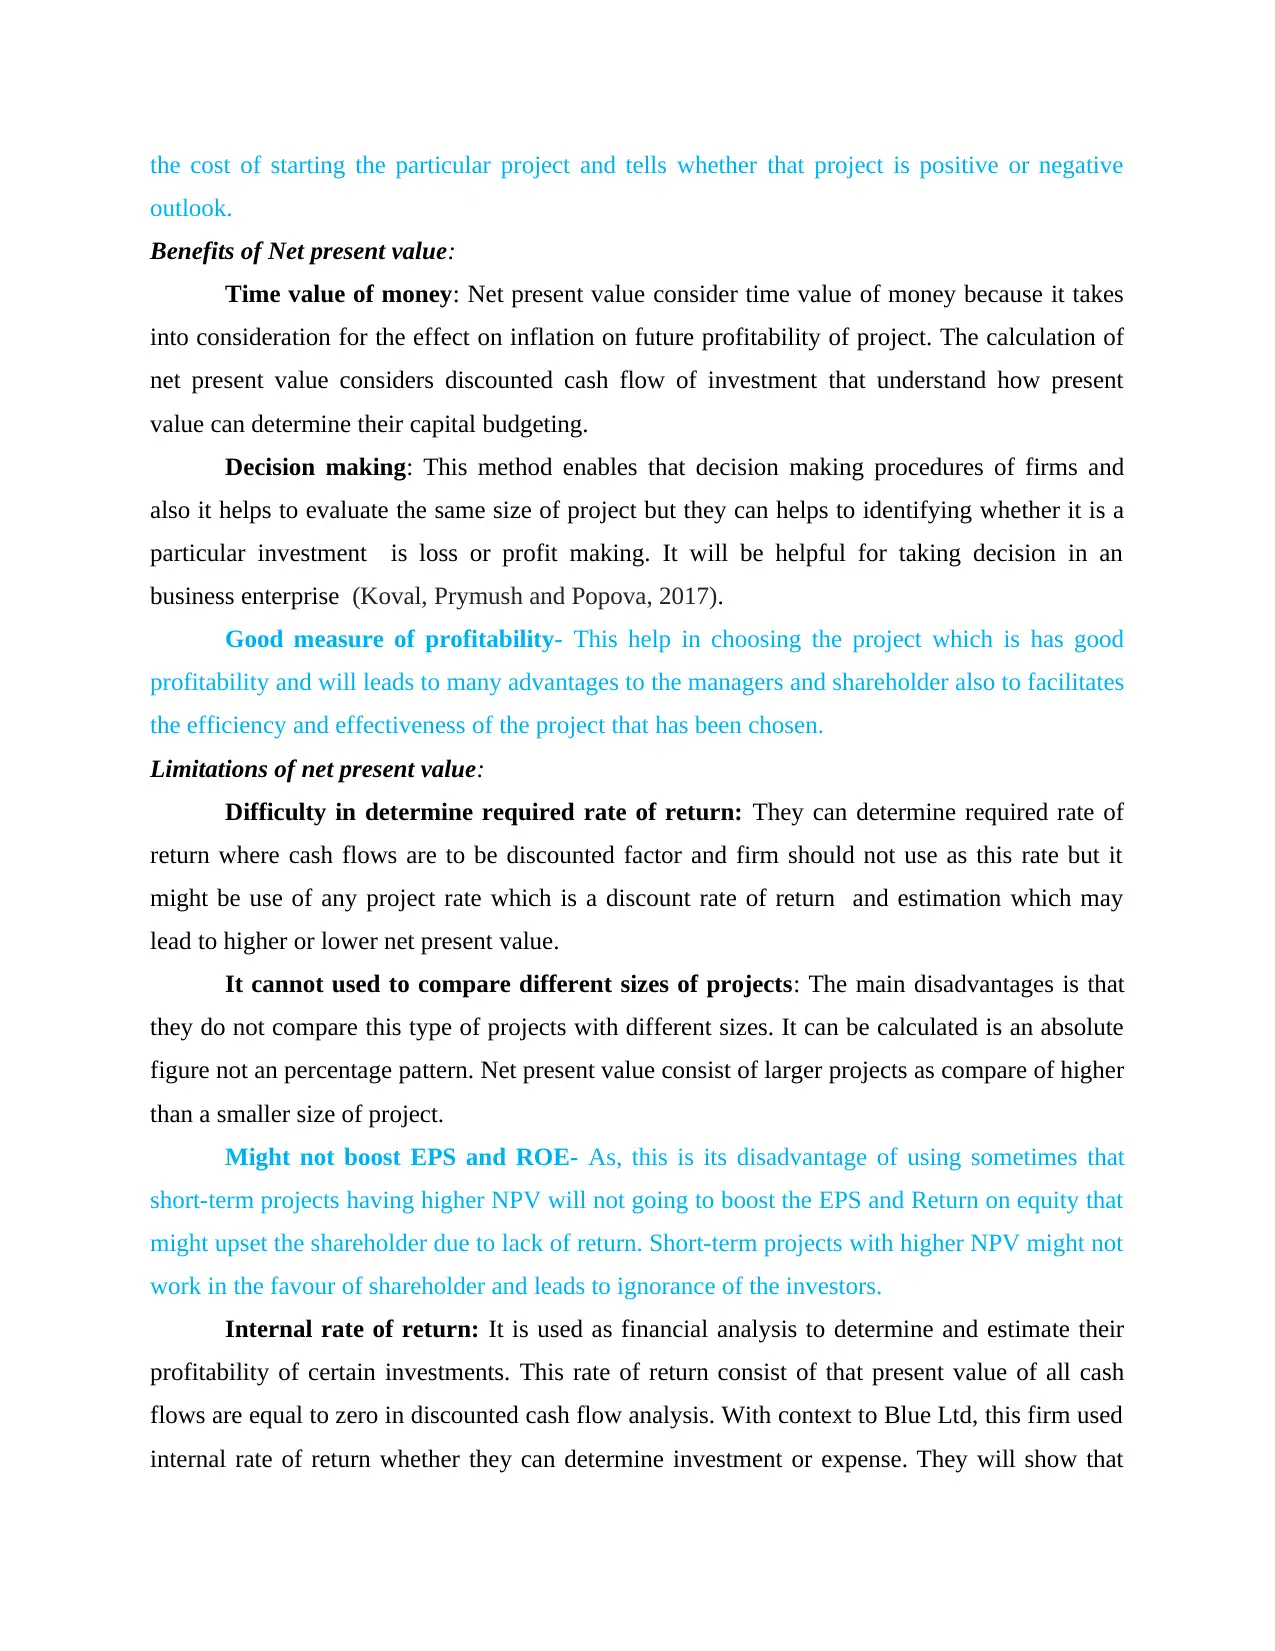
Benefits of Net present value:
Time value of money: Net present value consider time value of money because it takes
into consideration for the effect on inflation on future profitability of project. The calculation of
net present value considers discounted cash flow of investment that understand how present
value can determine their capital budgeting.
Decision making: This method enables that decision making procedures of firms and
also it helps to evaluate the same size of project but they can helps to identifying whether it is a
particular investment is loss or profit making. It will be helpful for taking decision in an
business enterprise (Koval, Prymush and Popova, 2017).
Good measure of profitability- This help in choosing the project which is has good
profitability and will leads to many advantages to the managers and shareholder also to facilitates
the efficiency and effectiveness of the project that has been chosen.
Limitations of net present value:
Difficulty in determine required rate of return: They can determine required rate of
return where cash flows are to be discounted factor and firm should not use as this rate but it
might be use of any project rate which is a discount rate of return and estimation which may
lead to higher or lower net present value.
It cannot used to compare different sizes of projects: The main disadvantages is that
they do not compare this type of projects with different sizes. It can be calculated is an absolute
figure not an percentage pattern. Net present value consist of larger projects as compare of higher
than a smaller size of project.
Might not boost EPS and ROE- As, this is its disadvantage of using sometimes that
short-term projects having higher NPV will not going to boost the EPS and Return on equity that
might upset the shareholder due to lack of return. Short-term projects with higher NPV might not
work in the favour of shareholder and leads to ignorance of the investors.
Internal rate of return: It is used as financial analysis to determine and estimate their
profitability of certain investments. This rate of return consist of that present value of all cash
flows are equal to zero in discounted cash flow analysis. With context to Blue Ltd, this firm used
internal rate of return whether they can determine investment or expense. They will show that
outlook.
Benefits of Net present value:
Time value of money: Net present value consider time value of money because it takes
into consideration for the effect on inflation on future profitability of project. The calculation of
net present value considers discounted cash flow of investment that understand how present
value can determine their capital budgeting.
Decision making: This method enables that decision making procedures of firms and
also it helps to evaluate the same size of project but they can helps to identifying whether it is a
particular investment is loss or profit making. It will be helpful for taking decision in an
business enterprise (Koval, Prymush and Popova, 2017).
Good measure of profitability- This help in choosing the project which is has good
profitability and will leads to many advantages to the managers and shareholder also to facilitates
the efficiency and effectiveness of the project that has been chosen.
Limitations of net present value:
Difficulty in determine required rate of return: They can determine required rate of
return where cash flows are to be discounted factor and firm should not use as this rate but it
might be use of any project rate which is a discount rate of return and estimation which may
lead to higher or lower net present value.
It cannot used to compare different sizes of projects: The main disadvantages is that
they do not compare this type of projects with different sizes. It can be calculated is an absolute
figure not an percentage pattern. Net present value consist of larger projects as compare of higher
than a smaller size of project.
Might not boost EPS and ROE- As, this is its disadvantage of using sometimes that
short-term projects having higher NPV will not going to boost the EPS and Return on equity that
might upset the shareholder due to lack of return. Short-term projects with higher NPV might not
work in the favour of shareholder and leads to ignorance of the investors.
Internal rate of return: It is used as financial analysis to determine and estimate their
profitability of certain investments. This rate of return consist of that present value of all cash
flows are equal to zero in discounted cash flow analysis. With context to Blue Ltd, this firm used
internal rate of return whether they can determine investment or expense. They will show that
⊘ This is a preview!⊘
Do you want full access?
Subscribe today to unlock all pages.
Trusted by 1+ million students worldwide
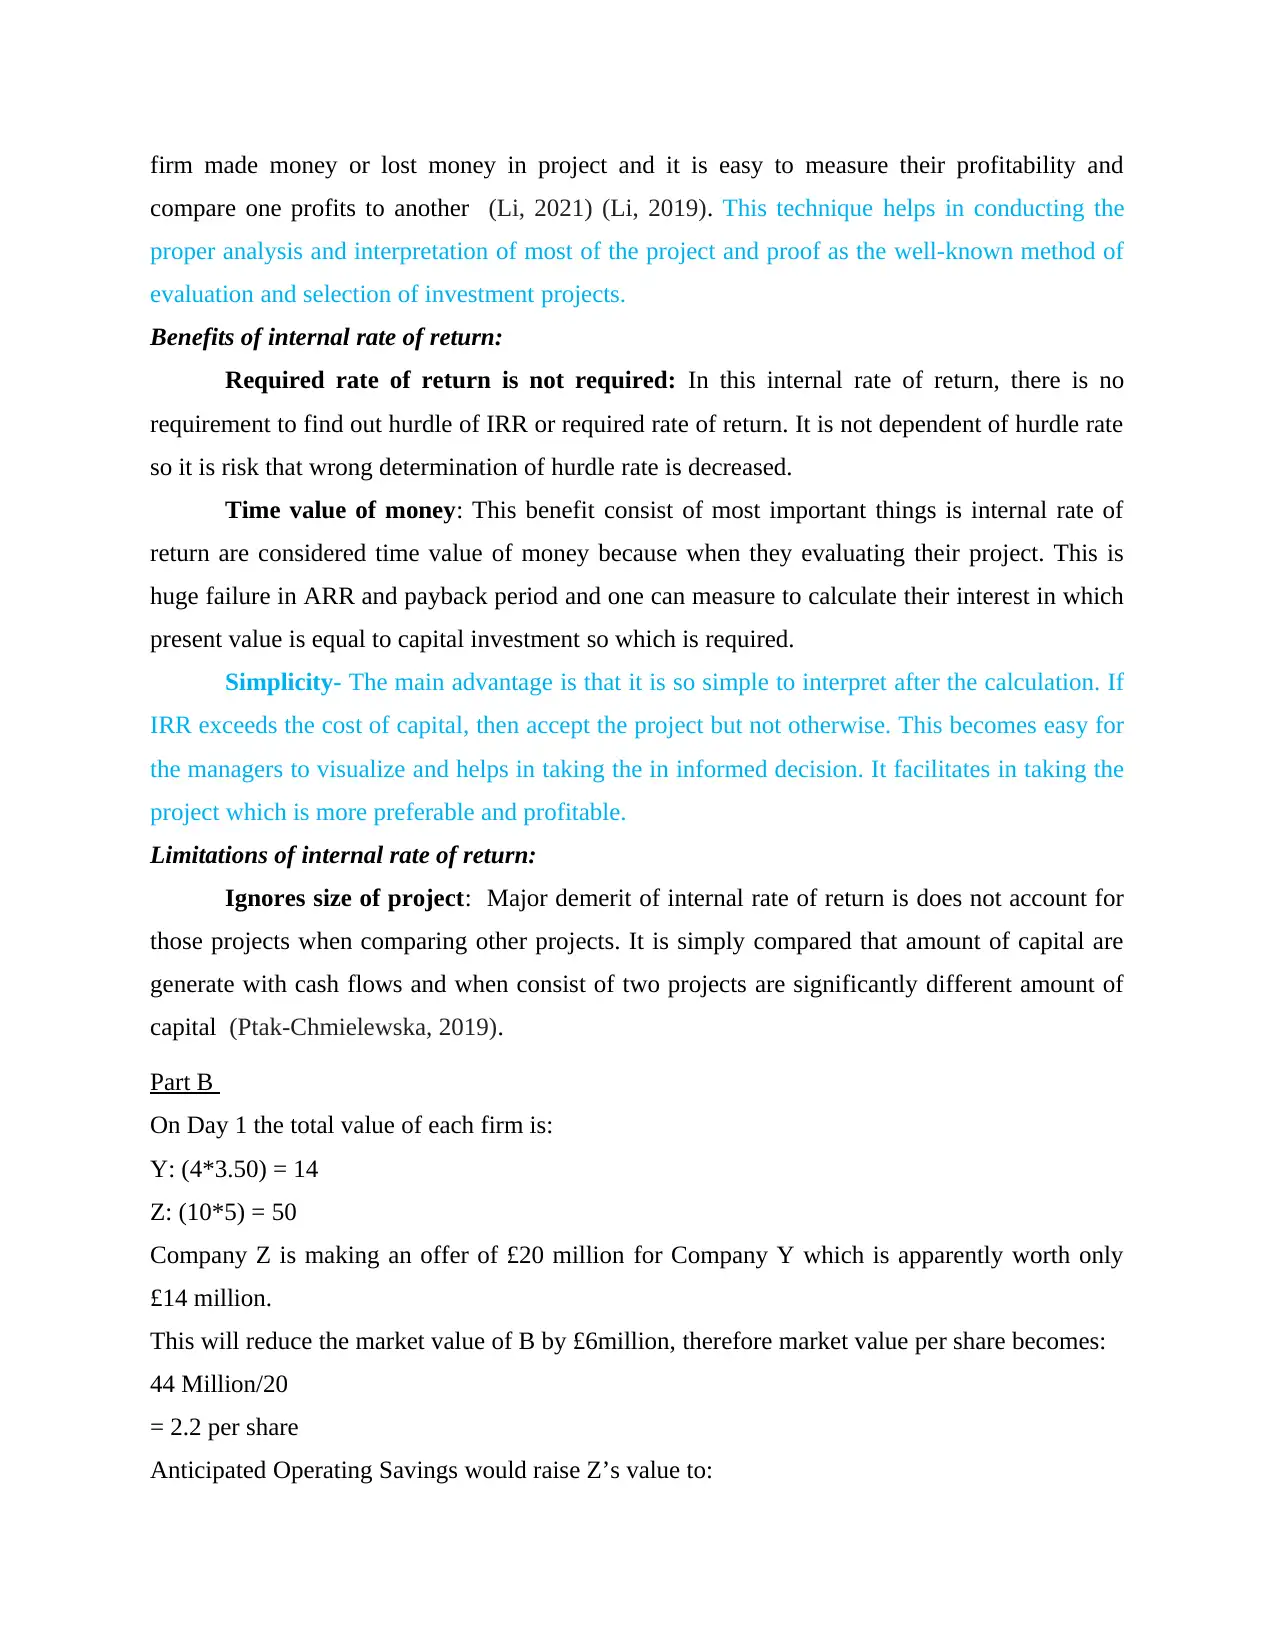
firm made money or lost money in project and it is easy to measure their profitability and
compare one profits to another (Li, 2021) (Li, 2019). This technique helps in conducting the
proper analysis and interpretation of most of the project and proof as the well-known method of
evaluation and selection of investment projects.
Benefits of internal rate of return:
Required rate of return is not required: In this internal rate of return, there is no
requirement to find out hurdle of IRR or required rate of return. It is not dependent of hurdle rate
so it is risk that wrong determination of hurdle rate is decreased.
Time value of money: This benefit consist of most important things is internal rate of
return are considered time value of money because when they evaluating their project. This is
huge failure in ARR and payback period and one can measure to calculate their interest in which
present value is equal to capital investment so which is required.
Simplicity- The main advantage is that it is so simple to interpret after the calculation. If
IRR exceeds the cost of capital, then accept the project but not otherwise. This becomes easy for
the managers to visualize and helps in taking the in informed decision. It facilitates in taking the
project which is more preferable and profitable.
Limitations of internal rate of return:
Ignores size of project: Major demerit of internal rate of return is does not account for
those projects when comparing other projects. It is simply compared that amount of capital are
generate with cash flows and when consist of two projects are significantly different amount of
capital (Ptak-Chmielewska, 2019).
Part B
On Day 1 the total value of each firm is:
Y: (4*3.50) = 14
Z: (10*5) = 50
Company Z is making an offer of £20 million for Company Y which is apparently worth only
£14 million.
This will reduce the market value of B by £6million, therefore market value per share becomes:
44 Million/20
= 2.2 per share
Anticipated Operating Savings would raise Z’s value to:
Paraphrase This Document
Need a fresh take? Get an instant paraphrase of this document with our AI Paraphraser
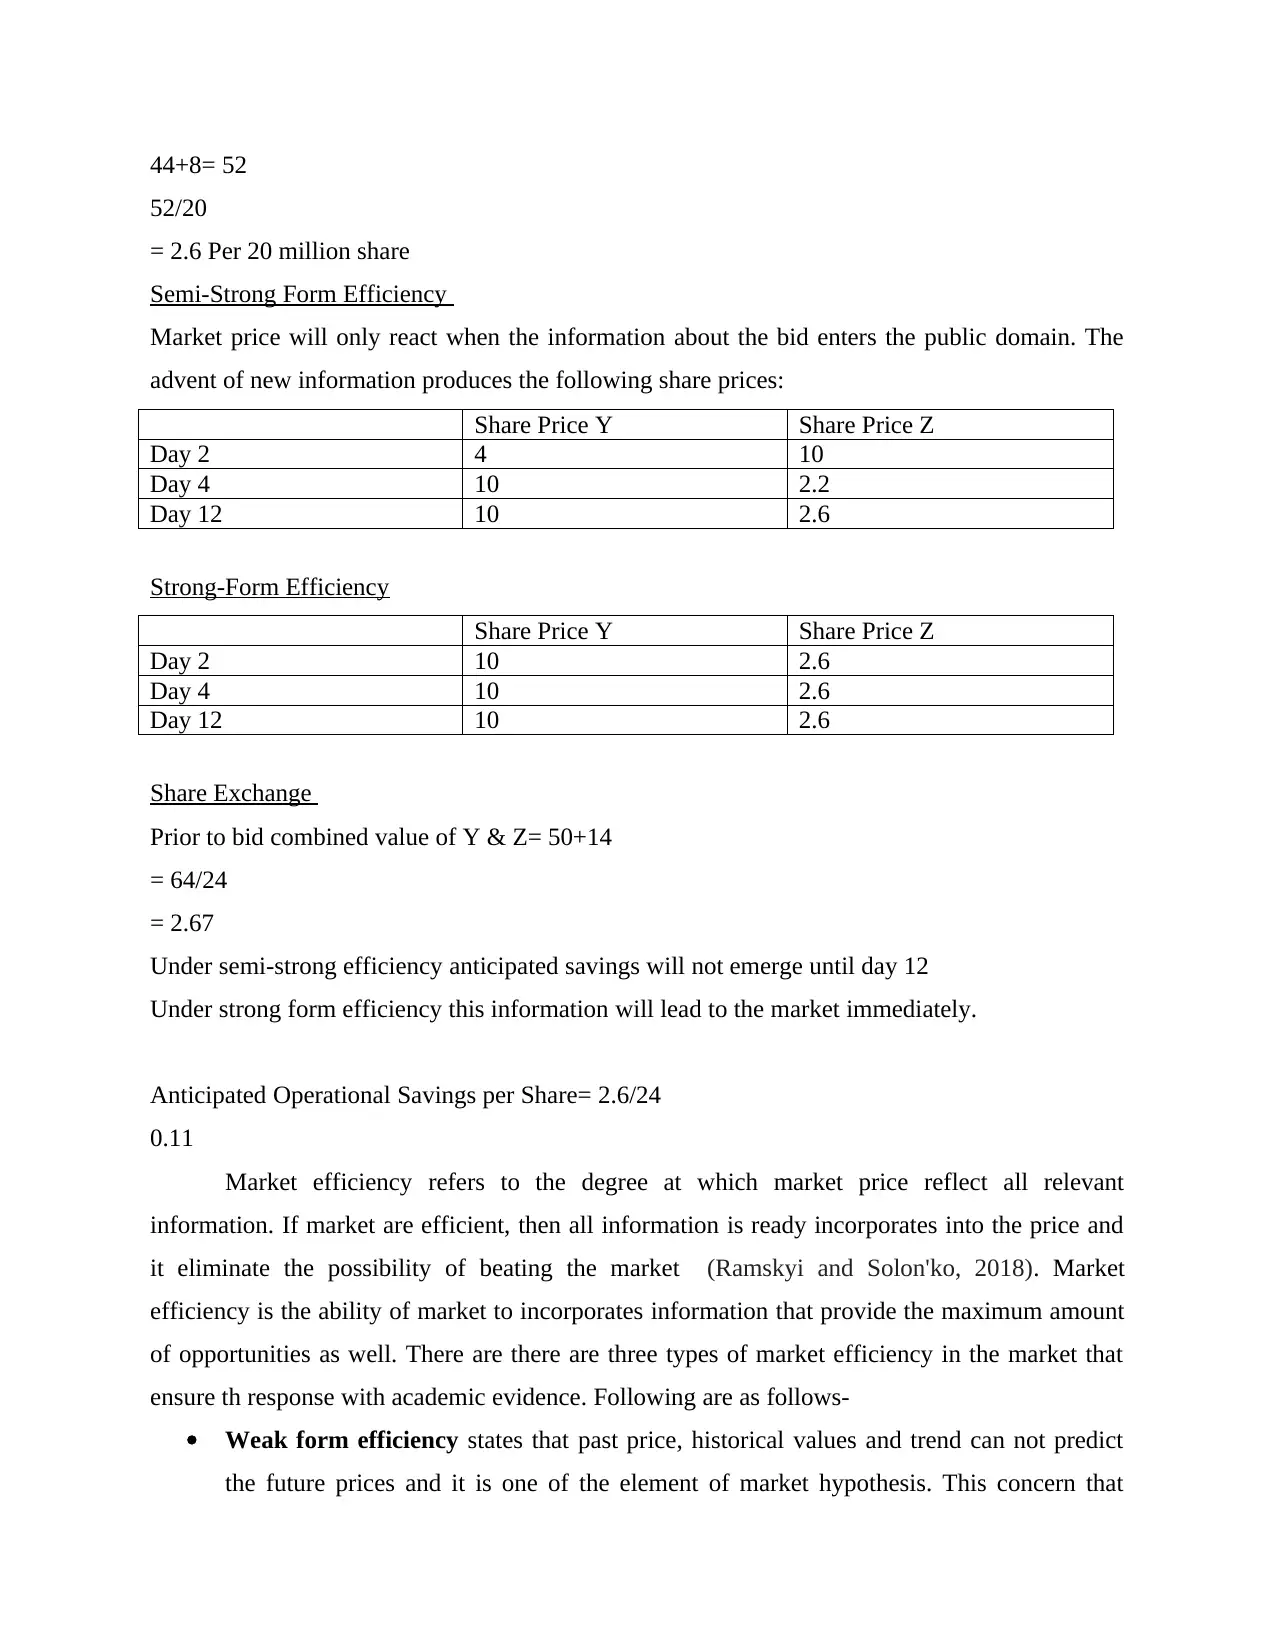
44+8= 52
52/20
= 2.6 Per 20 million share
Semi-Strong Form Efficiency
Market price will only react when the information about the bid enters the public domain. The
advent of new information produces the following share prices:
Share Price Y Share Price Z
Day 2 4 10
Day 4 10 2.2
Day 12 10 2.6
Strong-Form Efficiency
Share Price Y Share Price Z
Day 2 10 2.6
Day 4 10 2.6
Day 12 10 2.6
Share Exchange
Prior to bid combined value of Y & Z= 50+14
= 64/24
= 2.67
Under semi-strong efficiency anticipated savings will not emerge until day 12
Under strong form efficiency this information will lead to the market immediately.
Anticipated Operational Savings per Share= 2.6/24
0.11
Market efficiency refers to the degree at which market price reflect all relevant
information. If market are efficient, then all information is ready incorporates into the price and
it eliminate the possibility of beating the market (Ramskyi and Solon'ko, 2018). Market
efficiency is the ability of market to incorporates information that provide the maximum amount
of opportunities as well. There are there are three types of market efficiency in the market that
ensure th response with academic evidence. Following are as follows-
Weak form efficiency states that past price, historical values and trend can not predict
the future prices and it is one of the element of market hypothesis. This concern that
stock prices reflect all current information. It is extremely difficult for the weak form
efficiency to outperform in the market. The basis of theory of weak form efficiency is
that investor are rational, capable and intelligent. The use of this market efficiency is in
short term profit higher than market average one to correctly pick up the stocks that were
undervalued and overvalued by the fundamental analysis. This does not consider the
technical analysis to be accurate and asserts that fundamental analysis can be flawed and
investor advocate weak from the efficiency assume they can randomly pick investment or
portfolios that gives them similar returns. The use of efficient this market is to be define
the proper weak form of efficiency in the company and leads to many issues in the
company.
Semi-strong form efficiency is an aspect of the efficient market hypothesis (EMH) that
refers to current stock price that adjusted rapidly to release the new public information.
This refers to understand the effectiveness of the investor and will help in taking decision
in fundamental and technical analysis that will be useless in the predicting the stock
future price movement and only material non- public information consider useful for the
trading the market. Apart from that it exist where security prices already prices reflect all
publicly that used to available information that is not possible to earn the excess return.
This helps in maintaining the effective relationship with that give used to give results to
the investor and other kind of trading facility (Shrestha, 2018). This help in analysing the
importance of fundamental and technical that does not use for the predicting the future
price movement. This generally helps in analysing the fact which is usually help in
finding the efficiency in the market.
Strong form efficiency is most stringent version of the efficient market that all
information in the market, where public or private is accounted to stock price and it is
believe that even insider information cannot give the advantages to the investor. The
degree in the market implies that profit exceeding the normal returns that could be
realized regardless of the amount of information investor that has access too. Economist
has designed that this estimate the investment advisory services as the useless that is not
able to give the relevant information. This is important components that also consider as
the random walk theory and states that overall market are randomly influence by the past
⊘ This is a preview!⊘
Do you want full access?
Subscribe today to unlock all pages.
Trusted by 1+ million students worldwide
1 out of 14
Related Documents


Your All-in-One AI-Powered Toolkit for Academic Success.
+13062052269
info@desklib.com
Available 24*7 on WhatsApp / Email
![[object Object]](/_next/static/media/star-bottom.7253800d.svg)
Unlock your academic potential
Copyright © 2020–2026 A2Z Services. All Rights Reserved. Developed and managed by ZUCOL.