Financial Management and Analysis Report: Tesco Company Case Study
VerifiedAdded on 2023/01/04
|12
|2965
|43
Report
AI Summary
This report provides a comprehensive analysis of financial management principles, focusing on financial performance evaluation, investment decisions, and risk assessment. The report begins with an introduction to financial management, followed by an analysis of Tesco's financial performance using various ratios, including liquidity, profitability, efficiency, and capital structure. It then explores the limitations of financial analysis and offers recommendations for improvement. The report further delves into investment appraisal techniques such as payback period, NPV, and IRR, providing calculations and recommendations for investment choices. It also examines the theoretical ex-right price, value of rights, and their effects on wealth, along with market capitalization, net asset value, price/earnings ratio, and historic dividend growth rate calculations. Finally, the report differentiates between systemic and unsystematic risk, capital and money markets, and risk and uncertainty, concluding with a discussion on the suitability of a bank overdraft for property purchase. The report utilizes financial data and calculations to support its analysis and recommendations.

FINANCIAL MANAGEMENT AND ANALYSIS
Paraphrase This Document
Need a fresh take? Get an instant paraphrase of this document with our AI Paraphraser
Table of Contents
Introduction......................................................................................................................................4
TASK 1............................................................................................................................................4
1. Analysis of financial performance...........................................................................................4
2. Limitation of analysis..............................................................................................................4
3. Recommendation.....................................................................................................................4
TASK 2............................................................................................................................................4
1. Payback period.........................................................................................................................4
2. NPV.........................................................................................................................................4
3. IRR...........................................................................................................................................4
4. Recommendation for the choice..............................................................................................4
TASK 3............................................................................................................................................4
A. Theoretical ex-right price........................................................................................................4
B. Value of rights.........................................................................................................................4
C. Effects on the wealth...............................................................................................................4
TASK 4............................................................................................................................................5
A). Market capitalisation.............................................................................................................5
B). Net assets value......................................................................................................................5
C) Price/earning ratio method......................................................................................................5
D) Historic dividend growth rate.................................................................................................5
E) How much it should offer to buy the shares of this company................................................5
TASK 5............................................................................................................................................5
A) Difference between systemic and unsystematic risk as used in the Capital Asset Pricing
Model (CAPM)............................................................................................................................5
B) Difference between the capital market and the money market...............................................5
C). Difference between risk and uncertainty...............................................................................5
D). Reasons whether a bank overdraft is suitable to finance the purchase of this property........5
CONCLUSION................................................................................................................................5
REFERENCES................................................................................................................................6

⊘ This is a preview!⊘
Do you want full access?
Subscribe today to unlock all pages.
Trusted by 1+ million students worldwide
Introduction
Financial management is indeed a company management field dedicated to the selective need for
resources and the appropriate examination of the means of funding to allow the investment unit
to step in the course of achieving its objectives (Masini and Menichetti, 2012). Long-term
financial decisions or financing decisions involve committing money, or capital equipment, for a
prolonged period of time. The financial practises and results of an organisation are decided by
these judgments. In this report, different aspect of financial management are discussed.
TASK 1
1. Analysis of financial performance:
Liquidity ratio analysis: This ratio shows how much liquidity is going on in the company. If
look at the liquidity ratio in Tesco company then a lot has been low in the year 2019 as compared
to this year 2018. This ratio is determined by dividing the total liabilities on the total assets.
Similarly, the quick ratio will also be calculated when the company subtracts the inventory from
the formula of total assets total current liabilities. Like current ratio, it is working in year 2019 as
compared to year 2018.
2. Profitability ratio analysis: Profitability ratio is seen in how the company has a tendency to
make a profit. In the Tesco Company the trend of earning gross profit of the year 2019 has been
found more than in the year 2018.
3. Efficiency ratio analysis: This ratio is seen in the company that how well the company is using
its assets and liabilities. This ratio makes good calculations of debtors and inventory.
4. Capital structure: The capital structure of the company is built in such a way that all the assets
to be financed. It is extracted as follows:
5. Stock market performance: The stock market performance of Tesco company has changed
many times in the year 2018 and 2019.
Paraphrase This Document
Need a fresh take? Get an instant paraphrase of this document with our AI Paraphraser
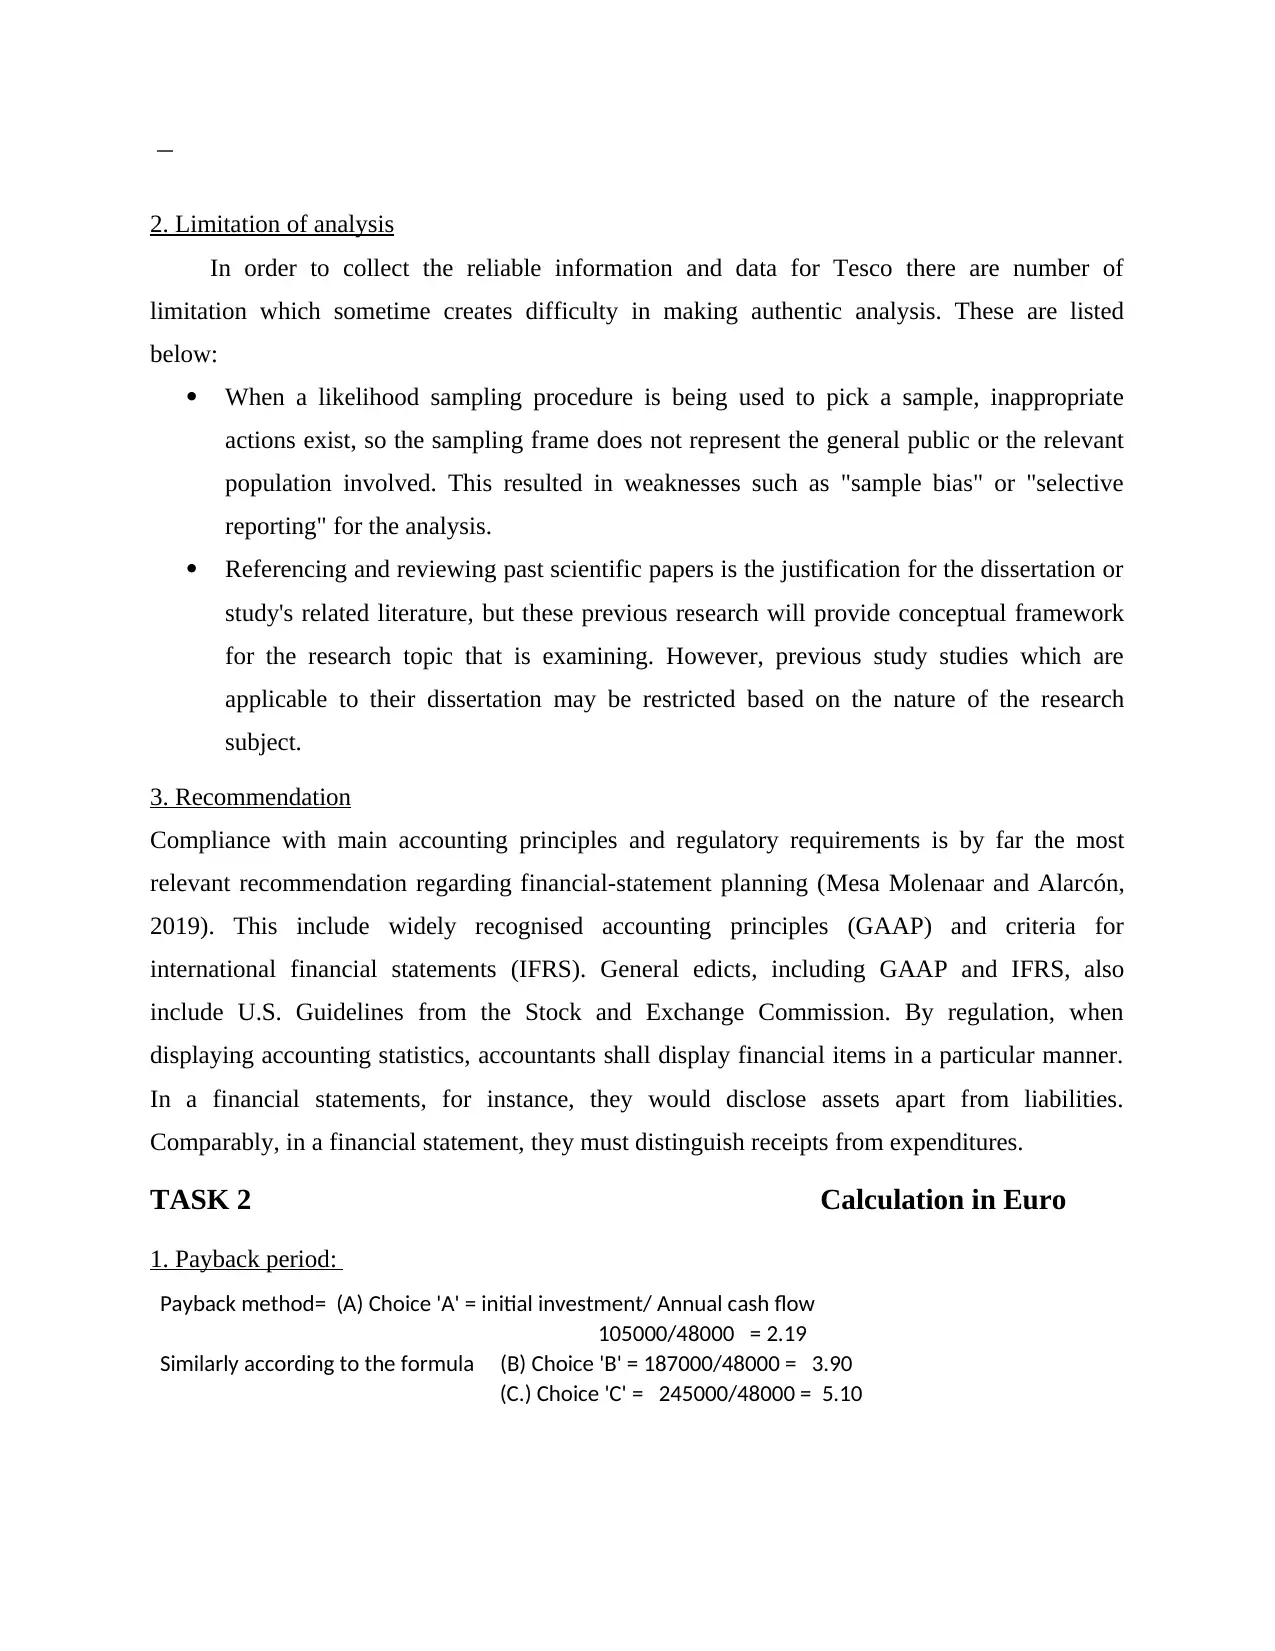
2. Limitation of analysis
In order to collect the reliable information and data for Tesco there are number of
limitation which sometime creates difficulty in making authentic analysis. These are listed
below:
When a likelihood sampling procedure is being used to pick a sample, inappropriate
actions exist, so the sampling frame does not represent the general public or the relevant
population involved. This resulted in weaknesses such as "sample bias" or "selective
reporting" for the analysis.
Referencing and reviewing past scientific papers is the justification for the dissertation or
study's related literature, but these previous research will provide conceptual framework
for the research topic that is examining. However, previous study studies which are
applicable to their dissertation may be restricted based on the nature of the research
subject.
3. Recommendation
Compliance with main accounting principles and regulatory requirements is by far the most
relevant recommendation regarding financial-statement planning (Mesa Molenaar and Alarcón,
2019). This include widely recognised accounting principles (GAAP) and criteria for
international financial statements (IFRS). General edicts, including GAAP and IFRS, also
include U.S. Guidelines from the Stock and Exchange Commission. By regulation, when
displaying accounting statistics, accountants shall display financial items in a particular manner.
In a financial statements, for instance, they would disclose assets apart from liabilities.
Comparably, in a financial statement, they must distinguish receipts from expenditures.
TASK 2 Calculation in Euro
1. Payback period:
Payback method= (A) Choice 'A' = initial investment/ Annual cash flow
105000/48000 = 2.19
Similarly according to the formula (B) Choice 'B' = 187000/48000 = 3.90
(C.) Choice 'C' = 245000/48000 = 5.10
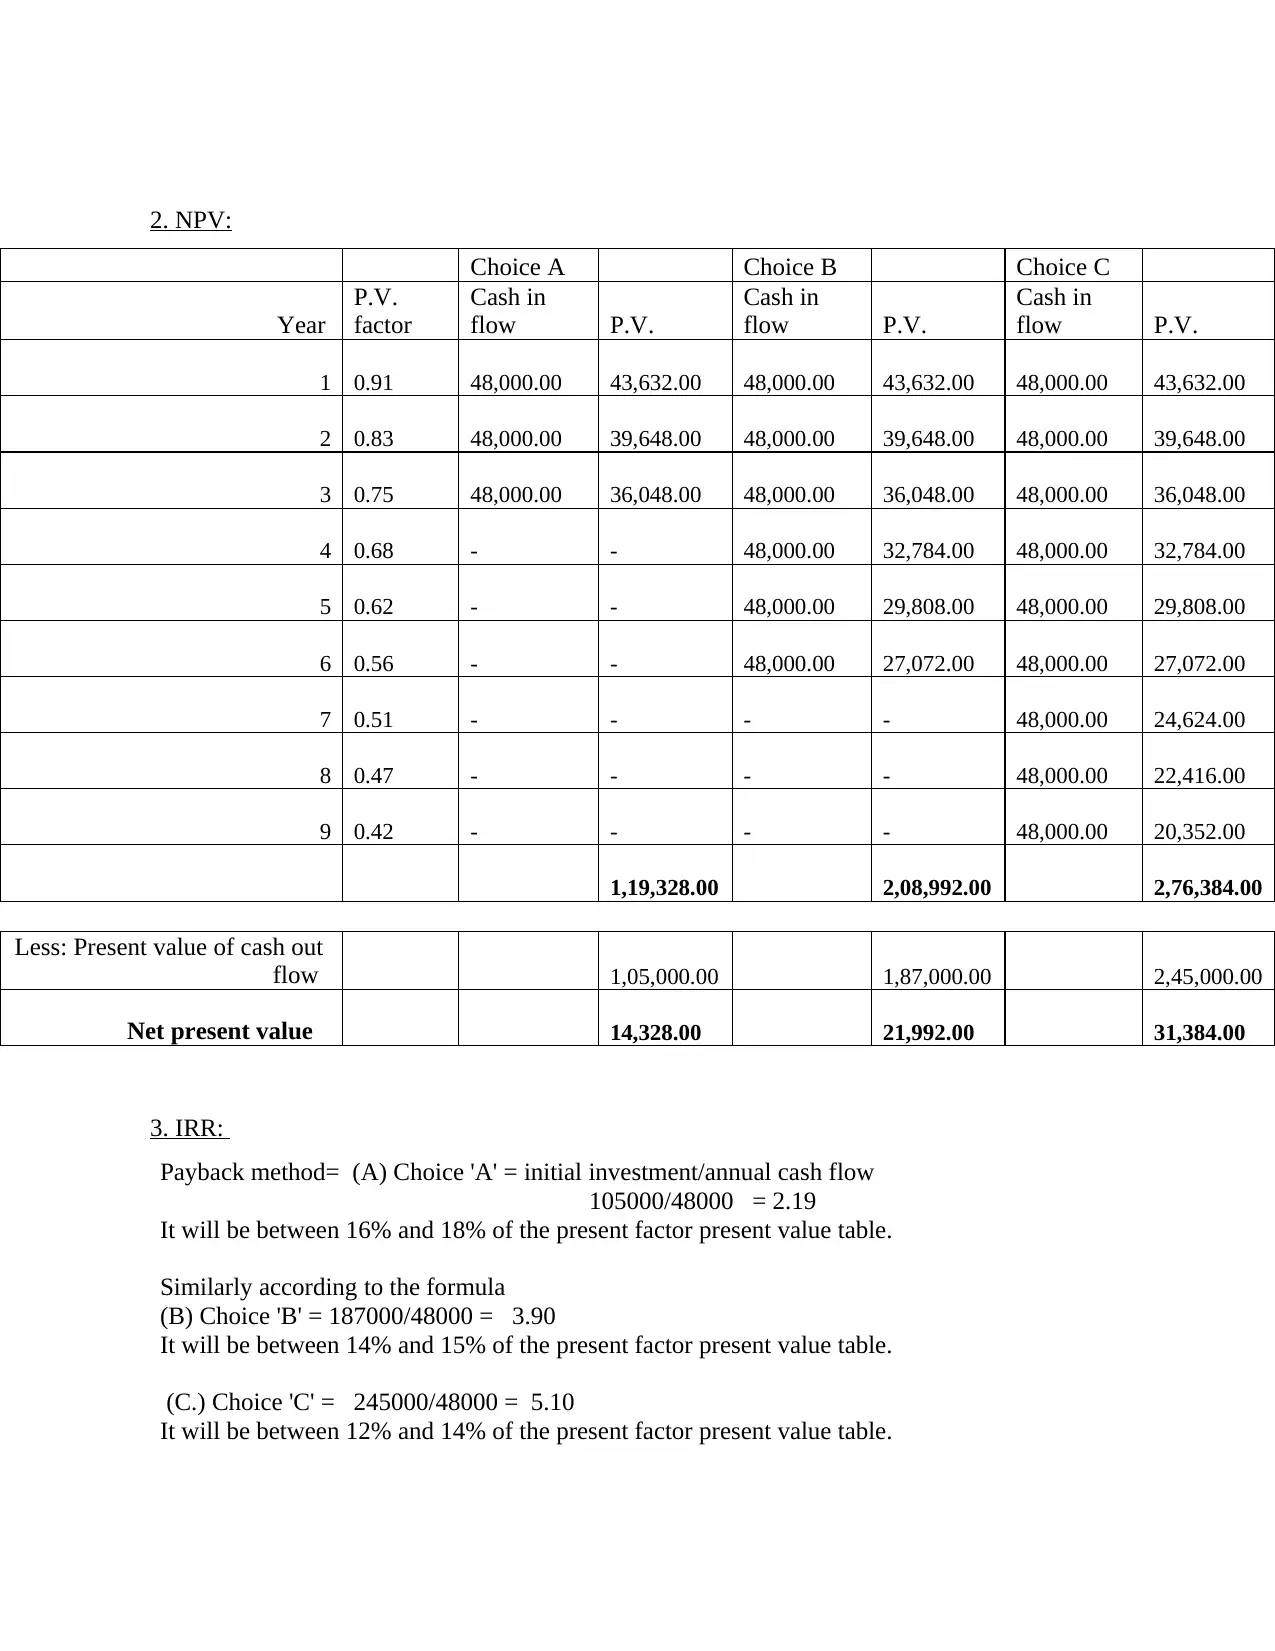
2. NPV:
Choice A Choice B Choice C
Year
P.V.
factor
Cash in
flow P.V.
Cash in
flow P.V.
Cash in
flow P.V.
1 0.91 48,000.00 43,632.00 48,000.00 43,632.00 48,000.00 43,632.00
2 0.83 48,000.00 39,648.00 48,000.00 39,648.00 48,000.00 39,648.00
3 0.75 48,000.00 36,048.00 48,000.00 36,048.00 48,000.00 36,048.00
4 0.68 - - 48,000.00 32,784.00 48,000.00 32,784.00
5 0.62 - - 48,000.00 29,808.00 48,000.00 29,808.00
6 0.56 - - 48,000.00 27,072.00 48,000.00 27,072.00
7 0.51 - - - - 48,000.00 24,624.00
8 0.47 - - - - 48,000.00 22,416.00
9 0.42 - - - - 48,000.00 20,352.00
1,19,328.00 2,08,992.00 2,76,384.00
Less: Present value of cash out
flow 1,05,000.00 1,87,000.00 2,45,000.00
Net present value 14,328.00 21,992.00 31,384.00
3. IRR:
Payback method= (A) Choice 'A' = initial investment/annual cash flow
105000/48000 = 2.19
It will be between 16% and 18% of the present factor present value table.
Similarly according to the formula
(B) Choice 'B' = 187000/48000 = 3.90
It will be between 14% and 15% of the present factor present value table.
(C.) Choice 'C' = 245000/48000 = 5.10
It will be between 12% and 14% of the present factor present value table.
⊘ This is a preview!⊘
Do you want full access?
Subscribe today to unlock all pages.
Trusted by 1+ million students worldwide
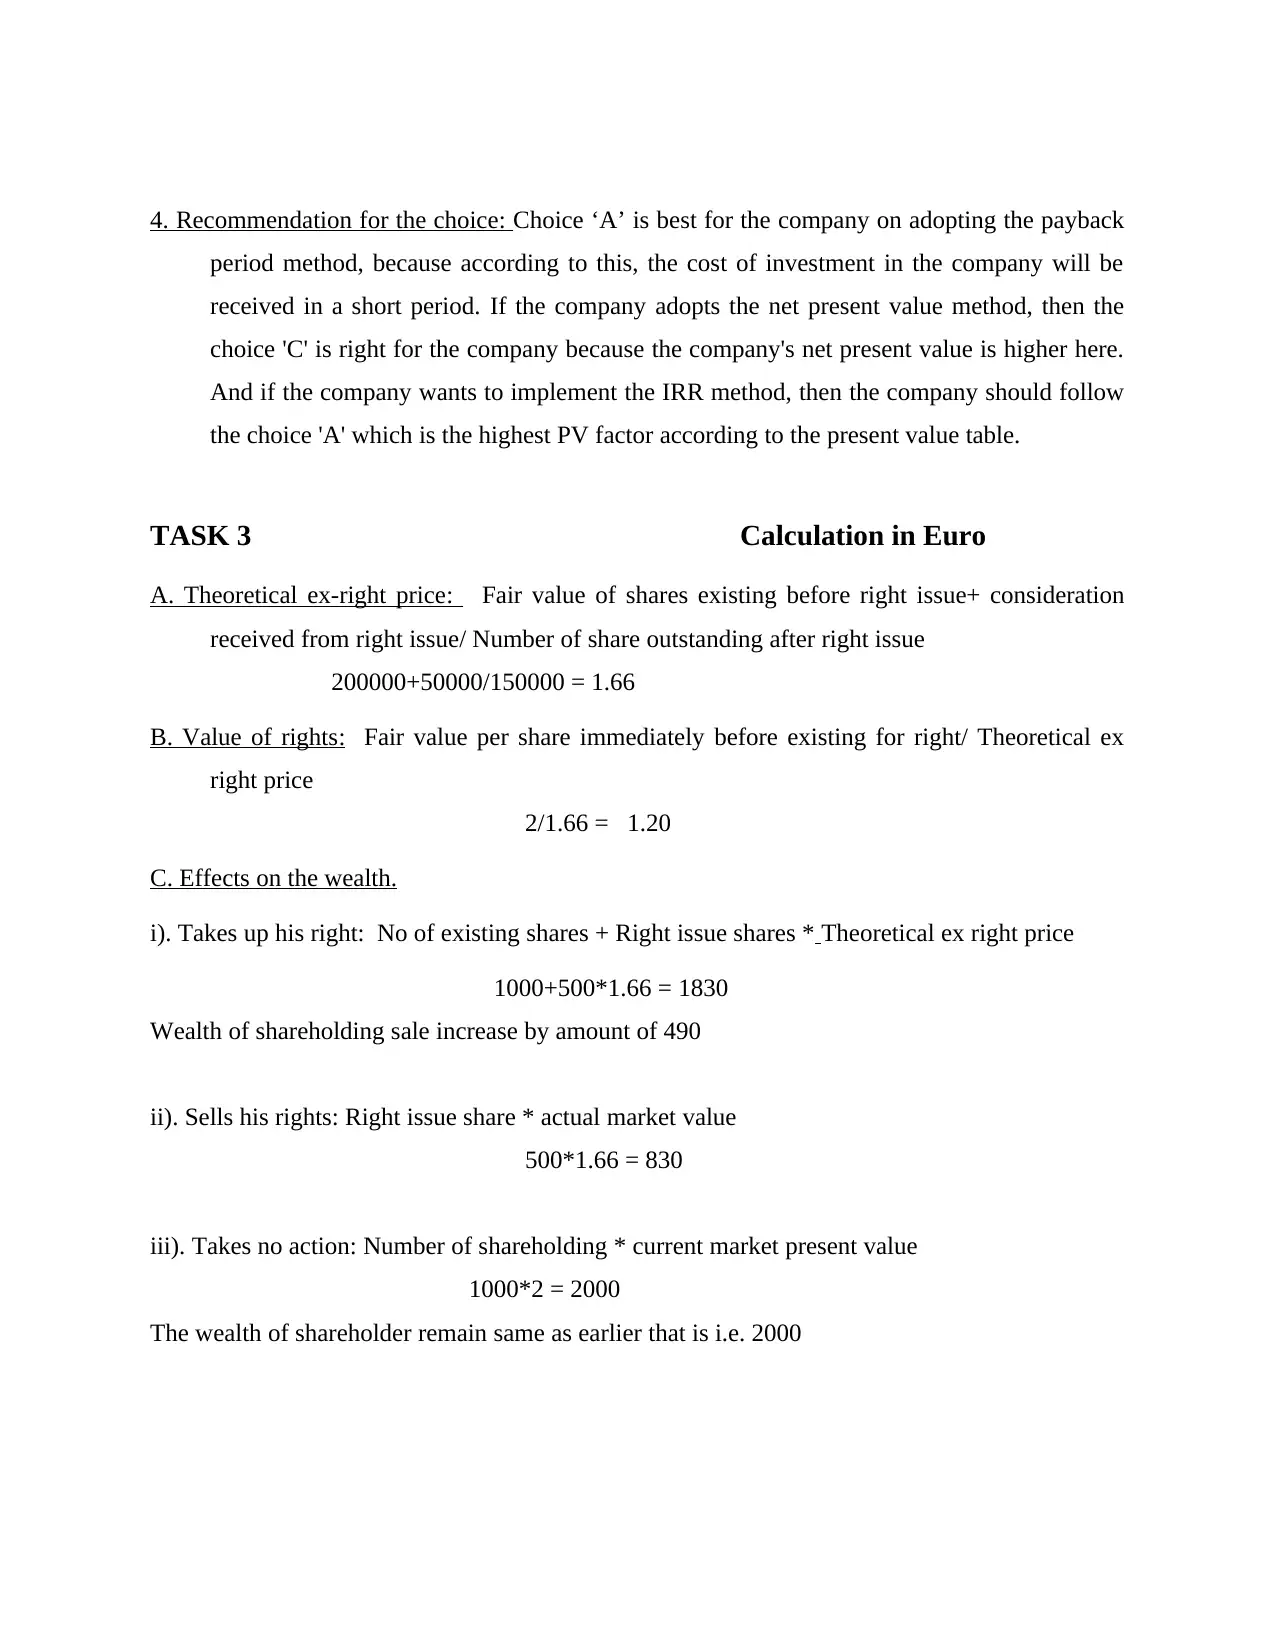
4. Recommendation for the choice: Choice ‘A’ is best for the company on adopting the payback
period method, because according to this, the cost of investment in the company will be
received in a short period. If the company adopts the net present value method, then the
choice 'C' is right for the company because the company's net present value is higher here.
And if the company wants to implement the IRR method, then the company should follow
the choice 'A' which is the highest PV factor according to the present value table.
TASK 3 Calculation in Euro
A. Theoretical ex-right price: Fair value of shares existing before right issue+ consideration
received from right issue/ Number of share outstanding after right issue
200000+50000/150000 = 1.66
B. Value of rights: Fair value per share immediately before existing for right/ Theoretical ex
right price
2/1.66 = 1.20
C. Effects on the wealth.
i). Takes up his right: No of existing shares + Right issue shares * Theoretical ex right price
1000+500*1.66 = 1830
Wealth of shareholding sale increase by amount of 490
ii). Sells his rights: Right issue share * actual market value
500*1.66 = 830
iii). Takes no action: Number of shareholding * current market present value
1000*2 = 2000
The wealth of shareholder remain same as earlier that is i.e. 2000
Paraphrase This Document
Need a fresh take? Get an instant paraphrase of this document with our AI Paraphraser
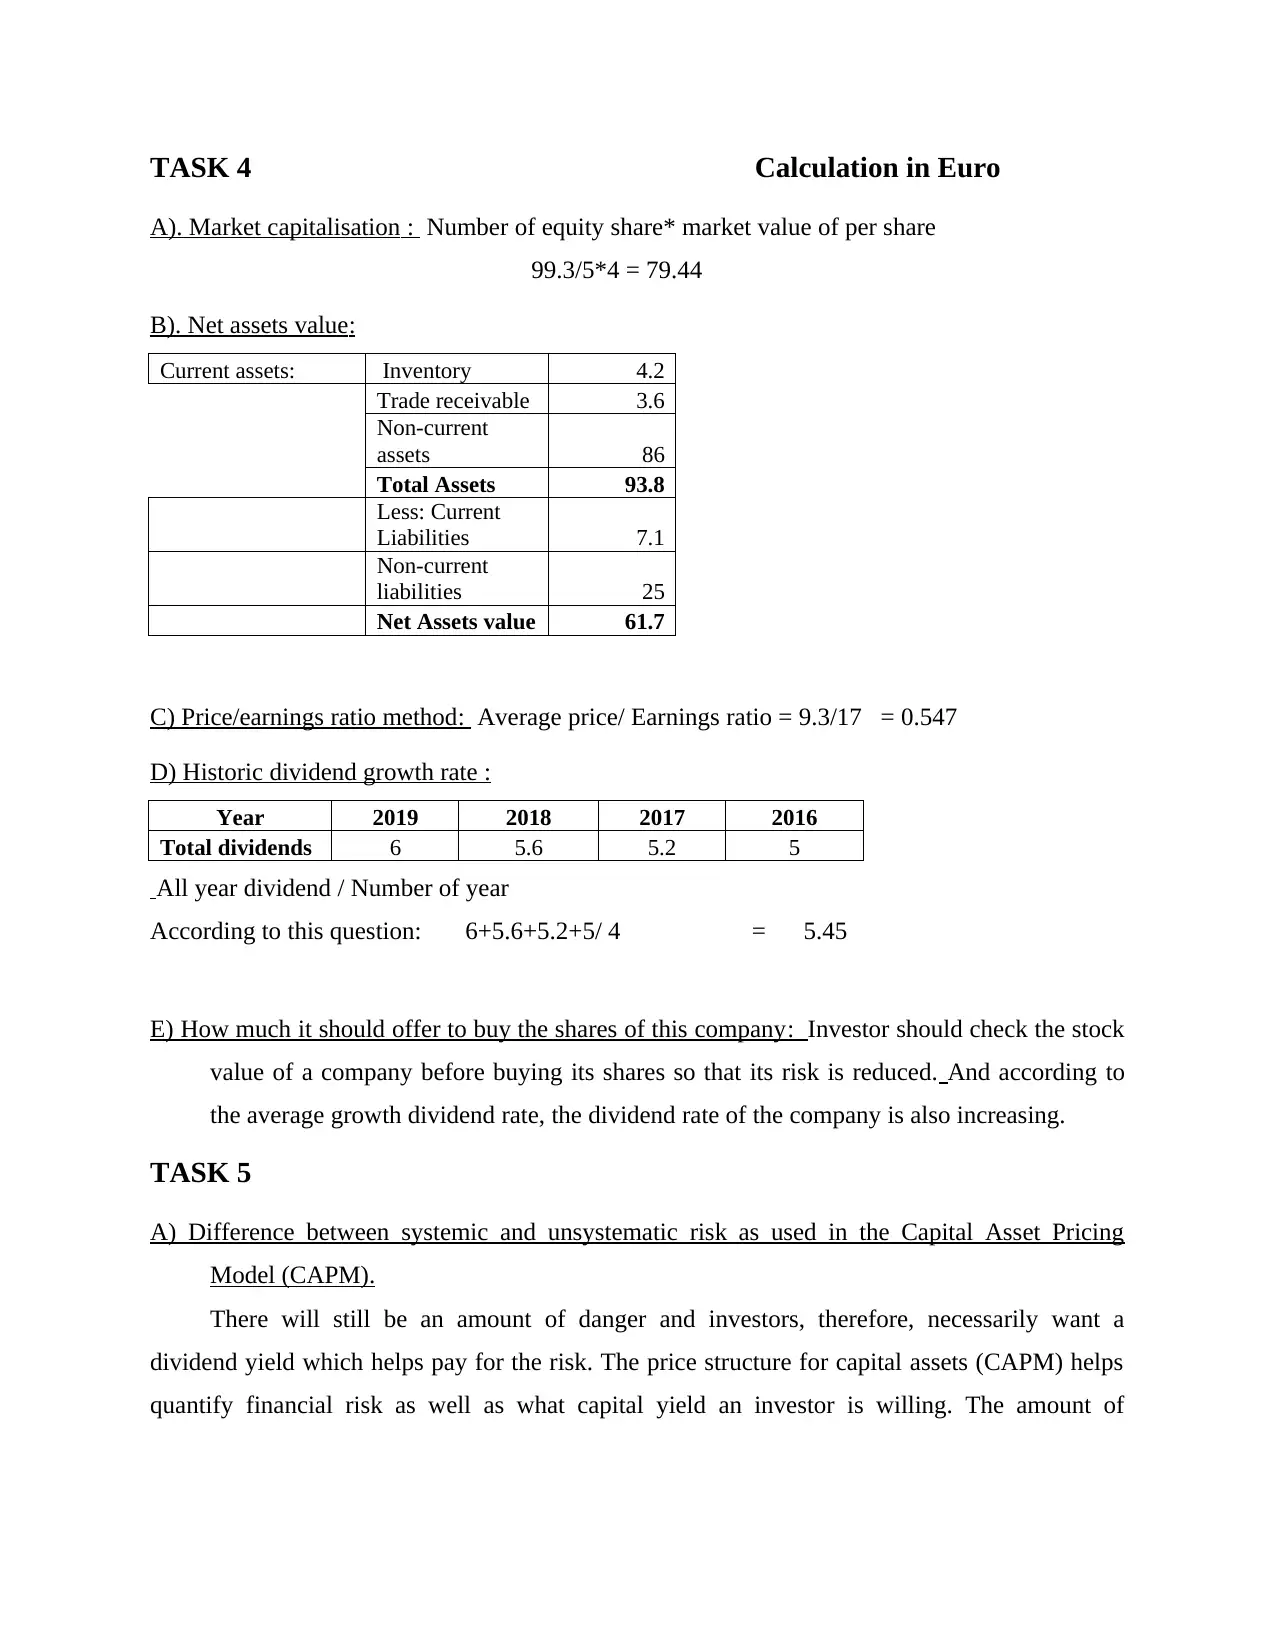
TASK 4 Calculation in Euro
A). Market capitalisation : Number of equity share* market value of per share
99.3/5*4 = 79.44
B). Net assets value:
Current assets: Inventory 4.2
Trade receivable 3.6
Non-current
assets 86
Total Assets 93.8
Less: Current
Liabilities 7.1
Non-current
liabilities 25
Net Assets value 61.7
C) Price/earnings ratio method: Average price/ Earnings ratio = 9.3/17 = 0.547
D) Historic dividend growth rate :
Year 2019 2018 2017 2016
Total dividends 6 5.6 5.2 5
All year dividend / Number of year
According to this question: 6+5.6+5.2+5/ 4 = 5.45
E) How much it should offer to buy the shares of this company: Investor should check the stock
value of a company before buying its shares so that its risk is reduced. And according to
the average growth dividend rate, the dividend rate of the company is also increasing.
TASK 5
A) Difference between systemic and unsystematic risk as used in the Capital Asset Pricing
Model (CAPM).
There will still be an amount of danger and investors, therefore, necessarily want a
dividend yield which helps pay for the risk. The price structure for capital assets (CAPM) helps
quantify financial risk as well as what capital yield an investor is willing. The amount of
unsystematic risk as well as systemic risk was its overall risk. The expectations of the capital
asset pricing model (CAPM) results in stock holders liquid assets in order to reduce risk.
Systemic risk Unsystematic risk
There are business risks that can never be
segmented, i.e., general investment threats.
Case studies of systematic threats include
interest rates, recessions, and conflicts.
Modern theory demonstrates that by
diversifying of an investment, individual
threat can be eliminated or at least mitigated.
The problem would be that the issue of
systemic risk is not yet addressed by
sustainability; only an investment containing
all share price securities will not eradicate the
risk.
This risk is measured as "specific risk," which
applies to particular stocks. In more scientific
terminology, it reflects the portion of the
returning of a stock and is not associated with
the fluctuations of the commercial public.
Therefore, systemic risk is just what
devastates shareholders so much when
measuring a reasonable return (Mihăilă, 2014)
Beta is a mathematical index of a company's stock uncertainty toward the entire economy.
It is usually seen as either a measurement of systemic risk or a definition of performance. It
defines the business as possessing a beta of 1. The variance for a commodity explains how far
the value of the stock changes relative to the demand. It is more risky that the general markets if
another share have a beta of 1. If an investment does have a beta of 1.3, for instance, it is
potentially 30 percent more risky than the index. In particular, shares have a favourable beta
when they are linked to the economy.
B) Difference between the capital market and the money market.
The money market as well as the capital market were two large elements of the international
economic market, not really a single entity. Some of the difference are listed below:
Money market Capital market
The money market becomes brief debt
dealing. This is a continuous influx of
currency, lending and investing for a period
as brief as immediately and thus no more than
one year, between states, companies, financial
Trade of both equities and bonds protects the
financial market. There are securities acquired
by banking firms, licenced traders, and
private owners over the lengthy period. The
stock market is split approximately into a
⊘ This is a preview!⊘
Do you want full access?
Subscribe today to unlock all pages.
Trusted by 1+ million students worldwide
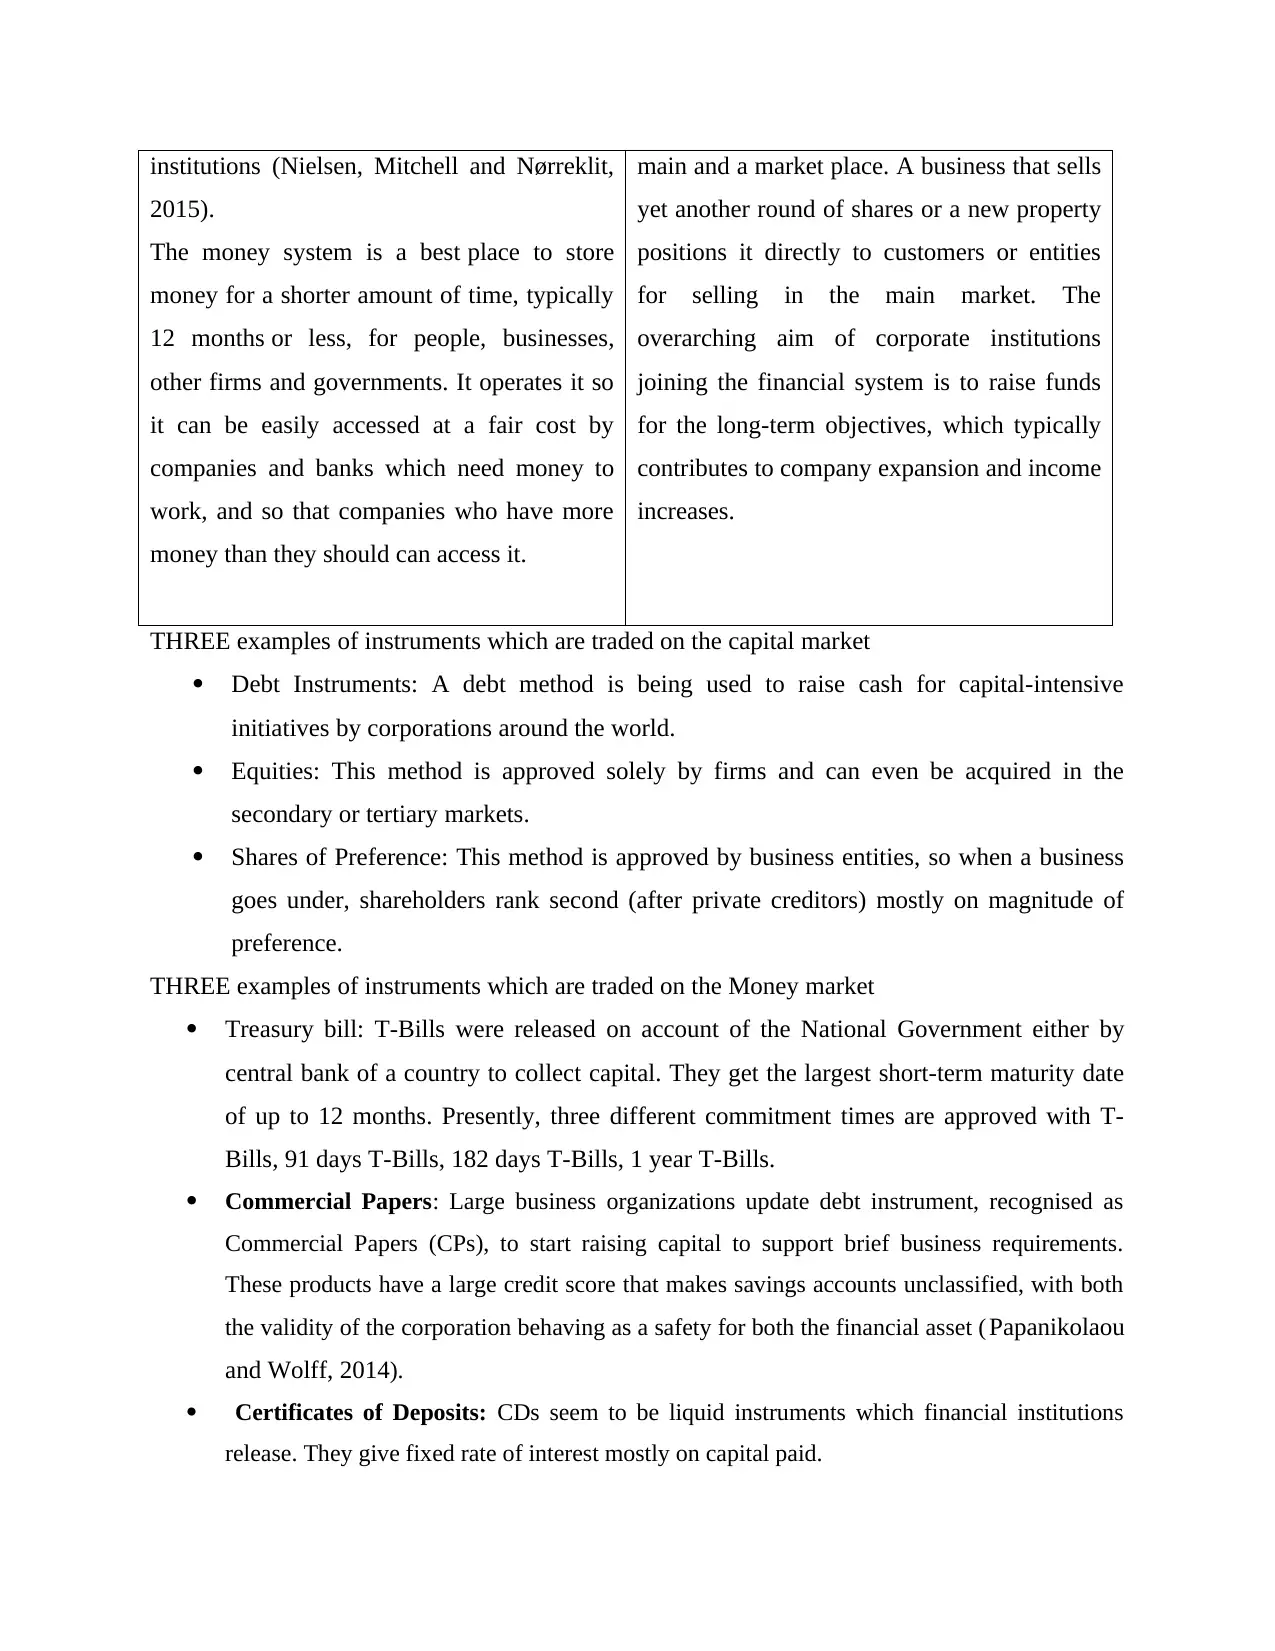
institutions (Nielsen, Mitchell and Nørreklit,
2015).
The money system is a best place to store
money for a shorter amount of time, typically
12 months or less, for people, businesses,
other firms and governments. It operates it so
it can be easily accessed at a fair cost by
companies and banks which need money to
work, and so that companies who have more
money than they should can access it.
main and a market place. A business that sells
yet another round of shares or a new property
positions it directly to customers or entities
for selling in the main market. The
overarching aim of corporate institutions
joining the financial system is to raise funds
for the long-term objectives, which typically
contributes to company expansion and income
increases.
THREE examples of instruments which are traded on the capital market
Debt Instruments: A debt method is being used to raise cash for capital-intensive
initiatives by corporations around the world.
Equities: This method is approved solely by firms and can even be acquired in the
secondary or tertiary markets.
Shares of Preference: This method is approved by business entities, so when a business
goes under, shareholders rank second (after private creditors) mostly on magnitude of
preference.
THREE examples of instruments which are traded on the Money market
Treasury bill: T-Bills were released on account of the National Government either by
central bank of a country to collect capital. They get the largest short-term maturity date
of up to 12 months. Presently, three different commitment times are approved with T-
Bills, 91 days T-Bills, 182 days T-Bills, 1 year T-Bills.
Commercial Papers: Large business organizations update debt instrument, recognised as
Commercial Papers (CPs), to start raising capital to support brief business requirements.
These products have a large credit score that makes savings accounts unclassified, with both
the validity of the corporation behaving as a safety for both the financial asset ( Papanikolaou
and Wolff, 2014).
Certificates of Deposits: CDs seem to be liquid instruments which financial institutions
release. They give fixed rate of interest mostly on capital paid.
Paraphrase This Document
Need a fresh take? Get an instant paraphrase of this document with our AI Paraphraser
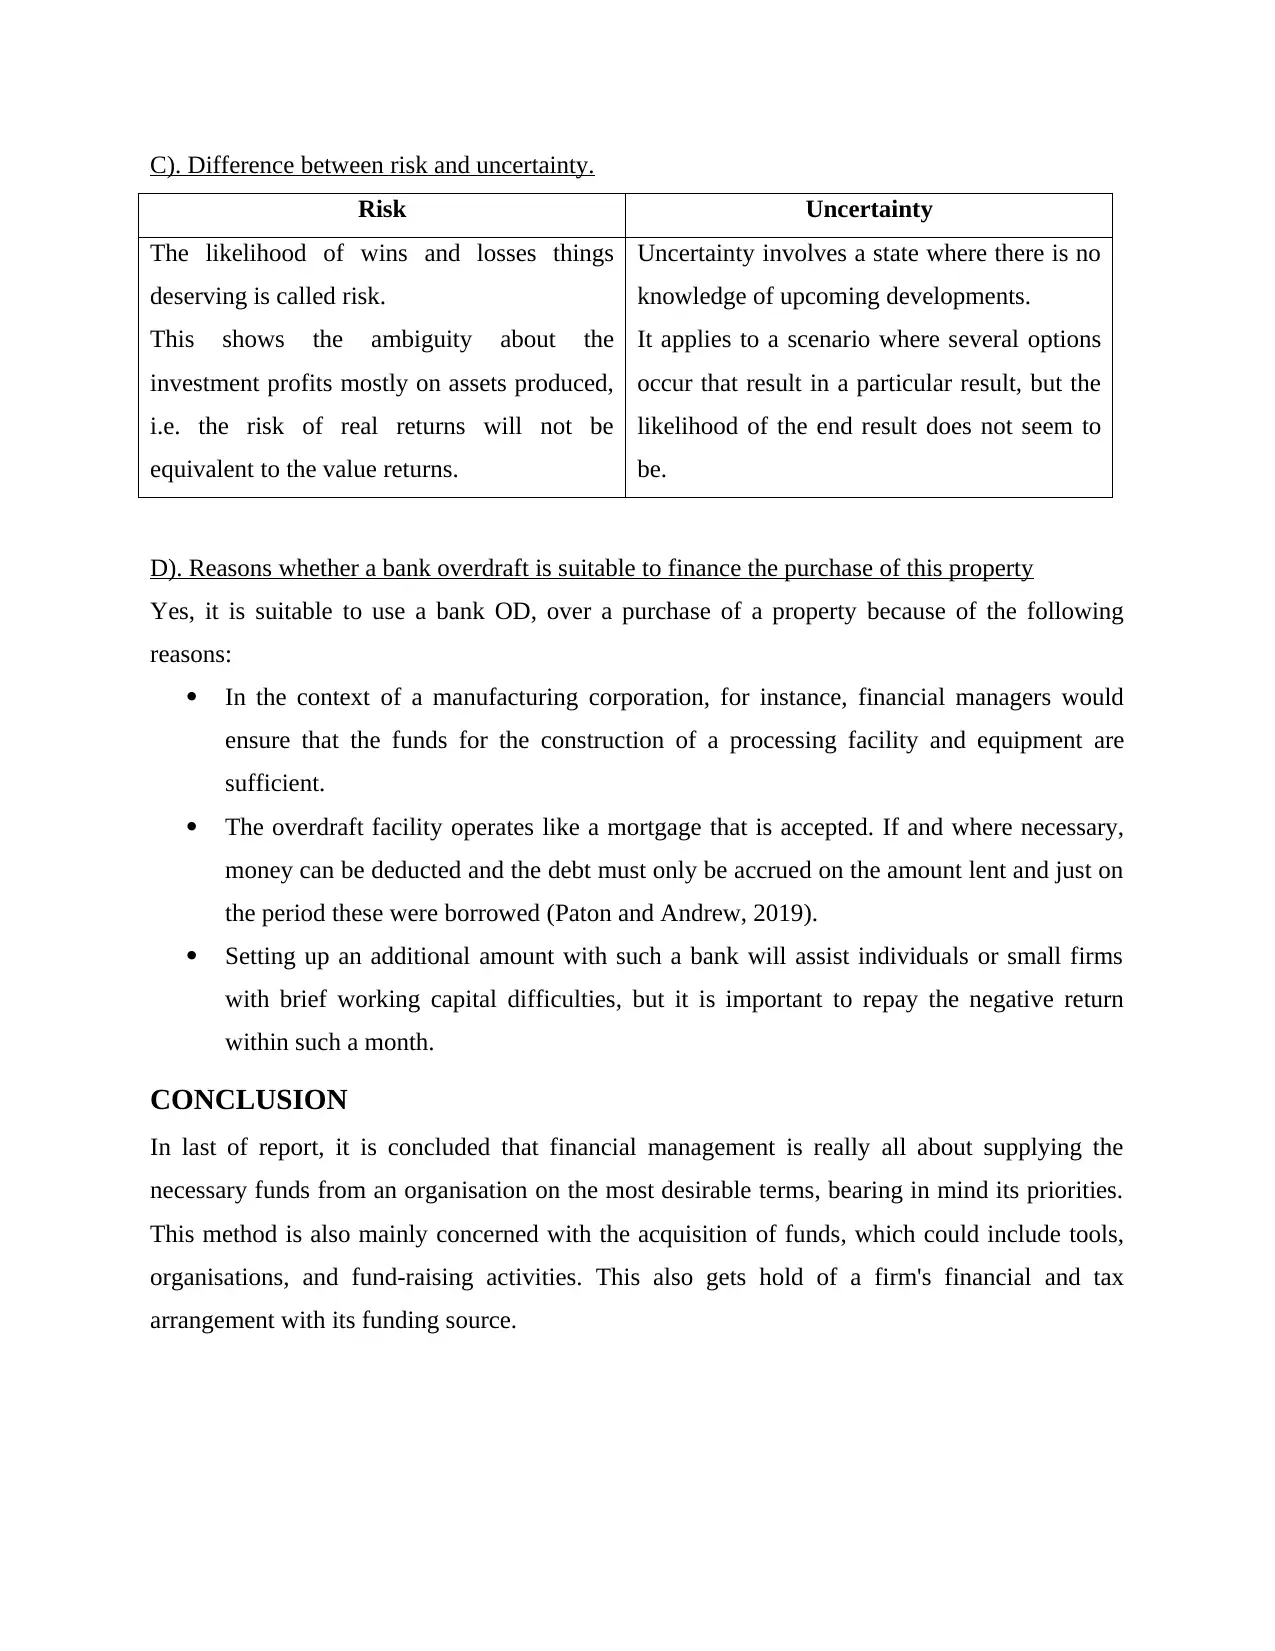
C). Difference between risk and uncertainty.
Risk Uncertainty
The likelihood of wins and losses things
deserving is called risk.
This shows the ambiguity about the
investment profits mostly on assets produced,
i.e. the risk of real returns will not be
equivalent to the value returns.
Uncertainty involves a state where there is no
knowledge of upcoming developments.
It applies to a scenario where several options
occur that result in a particular result, but the
likelihood of the end result does not seem to
be.
D). Reasons whether a bank overdraft is suitable to finance the purchase of this property
Yes, it is suitable to use a bank OD, over a purchase of a property because of the following
reasons:
In the context of a manufacturing corporation, for instance, financial managers would
ensure that the funds for the construction of a processing facility and equipment are
sufficient.
The overdraft facility operates like a mortgage that is accepted. If and where necessary,
money can be deducted and the debt must only be accrued on the amount lent and just on
the period these were borrowed (Paton and Andrew, 2019).
Setting up an additional amount with such a bank will assist individuals or small firms
with brief working capital difficulties, but it is important to repay the negative return
within such a month.
CONCLUSION
In last of report, it is concluded that financial management is really all about supplying the
necessary funds from an organisation on the most desirable terms, bearing in mind its priorities.
This method is also mainly concerned with the acquisition of funds, which could include tools,
organisations, and fund-raising activities. This also gets hold of a firm's financial and tax
arrangement with its funding source.
REFERENCES
Books and Journals
Masini, A. and Menichetti, E., 2012. The impact of behavioural factors in the renewable energy
investment decision making process: Conceptual framework and empirical findings. Energy
Policy, 40, pp.28-38.
Mesa, H. A., Molenaar, K. R. and Alarcón, L. F., 2019. Comparative analysis between integrated
project delivery and lean project delivery. International Journal of Project
Management, 37(3), pp.395-409.
Mihăilă, M., 2014. Managerial accounting and decision making, in energy industry. Procedia-
Social and Behavioral Sciences, 109, pp.1199-1202.
Nielsen, L. B., Mitchell, F. and Nørreklit, H., 2015, March. Management accounting and
decision making: Two case studies of outsourcing. In Accounting Forum (Vol. 39, No. 1,
pp. 66-82). Taylor & Francis.
Papanikolaou, N. I. and Wolff, C. C., 2014. The role of on-and off-balance-sheet leverage of
banks in the late 2000s crisis. Journal of Financial Stability, 14, pp.3-22.
Paton, S. and Andrew, B., 2019. The role of the Project Management Office (PMO) in product
lifecycle management: A case study in the defence industry. International Journal of
Production Economics, 208, pp.43-52.
⊘ This is a preview!⊘
Do you want full access?
Subscribe today to unlock all pages.
Trusted by 1+ million students worldwide
1 out of 12
Related Documents


Your All-in-One AI-Powered Toolkit for Academic Success.
+13062052269
info@desklib.com
Available 24*7 on WhatsApp / Email
![[object Object]](/_next/static/media/star-bottom.7253800d.svg)
Unlock your academic potential
Copyright © 2020–2026 A2Z Services. All Rights Reserved. Developed and managed by ZUCOL.