Financial Management Report: Unit 7003V1 Financial Management Analysis
VerifiedAdded on 2023/06/07
|23
|5426
|396
Report
AI Summary
This report, submitted by a student, provides a comprehensive analysis of financial management principles. It begins by outlining the sources of financial data, both internal and external, emphasizing the importance of accurate and reliable information for decision-making. The report then delves into the financial performance of Crawford Healthcare, calculating and analyzing various financial ratios such as gross profit ratio, net profit ratio, gearing ratio, asset turnover ratio, current ratio, acid test ratio, and return on capital employed. Through comparative analysis, the report identifies strengths and weaknesses in the company's financial position, offering recommendations for improvement, particularly in areas like liquidity management. Furthermore, the report addresses budgeting, explaining how a budget can be produced considering financial constraints, targets, legal requirements, and accounting conventions. Finally, the report examines investment proposals, identifying criteria for judgment, analyzing viability, and evaluating their impact on organizational objectives, concluding with recommendations for financial strategy.
DistanceLearningCollege and Training – Submission Sheet
NAME STUDENT NO. If known
DATE
INSTITUTE
COURSE
UNIT TITLE
TOPIC
TASK REF
THE TASK
FINANCIAL MANAGEMENT
NAME STUDENT NO. If known
DATE
INSTITUTE
COURSE
UNIT TITLE
TOPIC
TASK REF
THE TASK
FINANCIAL MANAGEMENT
Paraphrase This Document
Need a fresh take? Get an instant paraphrase of this document with our AI Paraphraser
DistanceLearningCollege and Training – Submission Sheet
TABLE OF CONTENTS
Introduction...................................................................................................................6
Task 1:..........................................................................................................................6
A.C. 1.1 - Determine how to obtain financial data and assess its validity................6
A.C. 1.4 - Review and question financial data..........................................................7
Task 2...........................................................................................................................8
A.C. 1.2 - Apply different types of analytical tools and techniques to a range of
financial documents, formulating conclusions about performance levels and needs
of stakeholders..........................................................................................................8
A.C. 1.3 - Conduct comparative analysis of financial data.....................................10
Task 3:........................................................................................................................12
A.C. 2.1 - Identify how a budget can be produced taking into account financial
constraints and achievement of targets, legal requirements and accounting
conventions.............................................................................................................12
Task 4:........................................................................................................................15
A.C. 2.2 - Analyse the budget outcomes against organisational objectives
identifying alternatives.............................................................................................15
Task 5:........................................................................................................................16
A.C. 3.1 - Identify criteria by which proposals are judged.......................................16
A.C. 3.2 - Analyzing the viability of the proposal for expenditure...........................17
A.C. 3.3 - Identify the strengths and weaknesses and give feedback on the
financial proposal....................................................................................................18
A.C. 3.4 - Evaluate the impact of the proposal on the strategic objectives of the
organisation.............................................................................................................19
Conclusion and Recommendations............................................................................19

DistanceLearningCollege and Training – Submission Sheet
References.................................................................................................................21
List of Tables
Table 1: Calculation of Ratios of Crawford Healthcare................................................5
References.................................................................................................................21
List of Tables
Table 1: Calculation of Ratios of Crawford Healthcare................................................5
⊘ This is a preview!⊘
Do you want full access?
Subscribe today to unlock all pages.
Trusted by 1+ million students worldwide

DistanceLearningCollege and Training – Submission Sheet
List of Figures
Figure 1 : Approaches of Budgeting.............................................................................8
List of Figures
Figure 1 : Approaches of Budgeting.............................................................................8
Paraphrase This Document
Need a fresh take? Get an instant paraphrase of this document with our AI Paraphraser
DistanceLearningCollege and Training – Submission Sheet
Introduction
Accurate information has a significant role in the decision-making process as an
organization can make a sound decision only in case accurate information is
supplied to the correct people at the right time in a comprehensibleformat.As per the
assertions of Mimura, et al. (2015), external as well as internal information is
considered by an investor to make a decision relating to investment or to assess the
efficiency of an organization. Present report emphasis on assessment of the external
as well as internal sources from which appropriate financial data can be attained.
Further assessment of the various ratios of Crawford Healthcare has been done in
order to evaluate its financial performance. Discussion relating to methods of
evaluating investment proposals will also be provided in order to ascertain the best
method for the company.
A.C. 1.1 Source of financial data that is HM revenue and customs.
A.C.1.4 include a profit and loss account or other financial data within your
organization (no names need to be disclosed), then as per the Task examine this
data (maybe comparing 2 or 3 previous years) and identify areas that you consider
deserve further investigation/analysis explaining how and why you consider this to
be necessary. Is it profitable?
You then need to refer to the task again and describe the types of data on other
organisations that you may require from time to time, such as competitors, suppliers
(to ensure they are financially sound in order to provide a constant supply chain).
You then need to go on to explain briefly how you would test the validity of the data.
A.C. 1.2 you need to apply these to the financial data provided in AC1.4. Giving
actual calculations of the ratios.
A.C.1.3 calculate the ratios for previous year’s data and referring to the task
compare them to the current year, drawing your own conclusions on your findings,
identifying strengths and weaknesses and making recommendations of ways in
which any shortcomings could be addressed.
DistanceLearningCollege and Training – Submission Sheet
Task 1:
A.C. 1.1 - Determine how to obtain financial data and assess its validity
Types of data required
Internal Sources
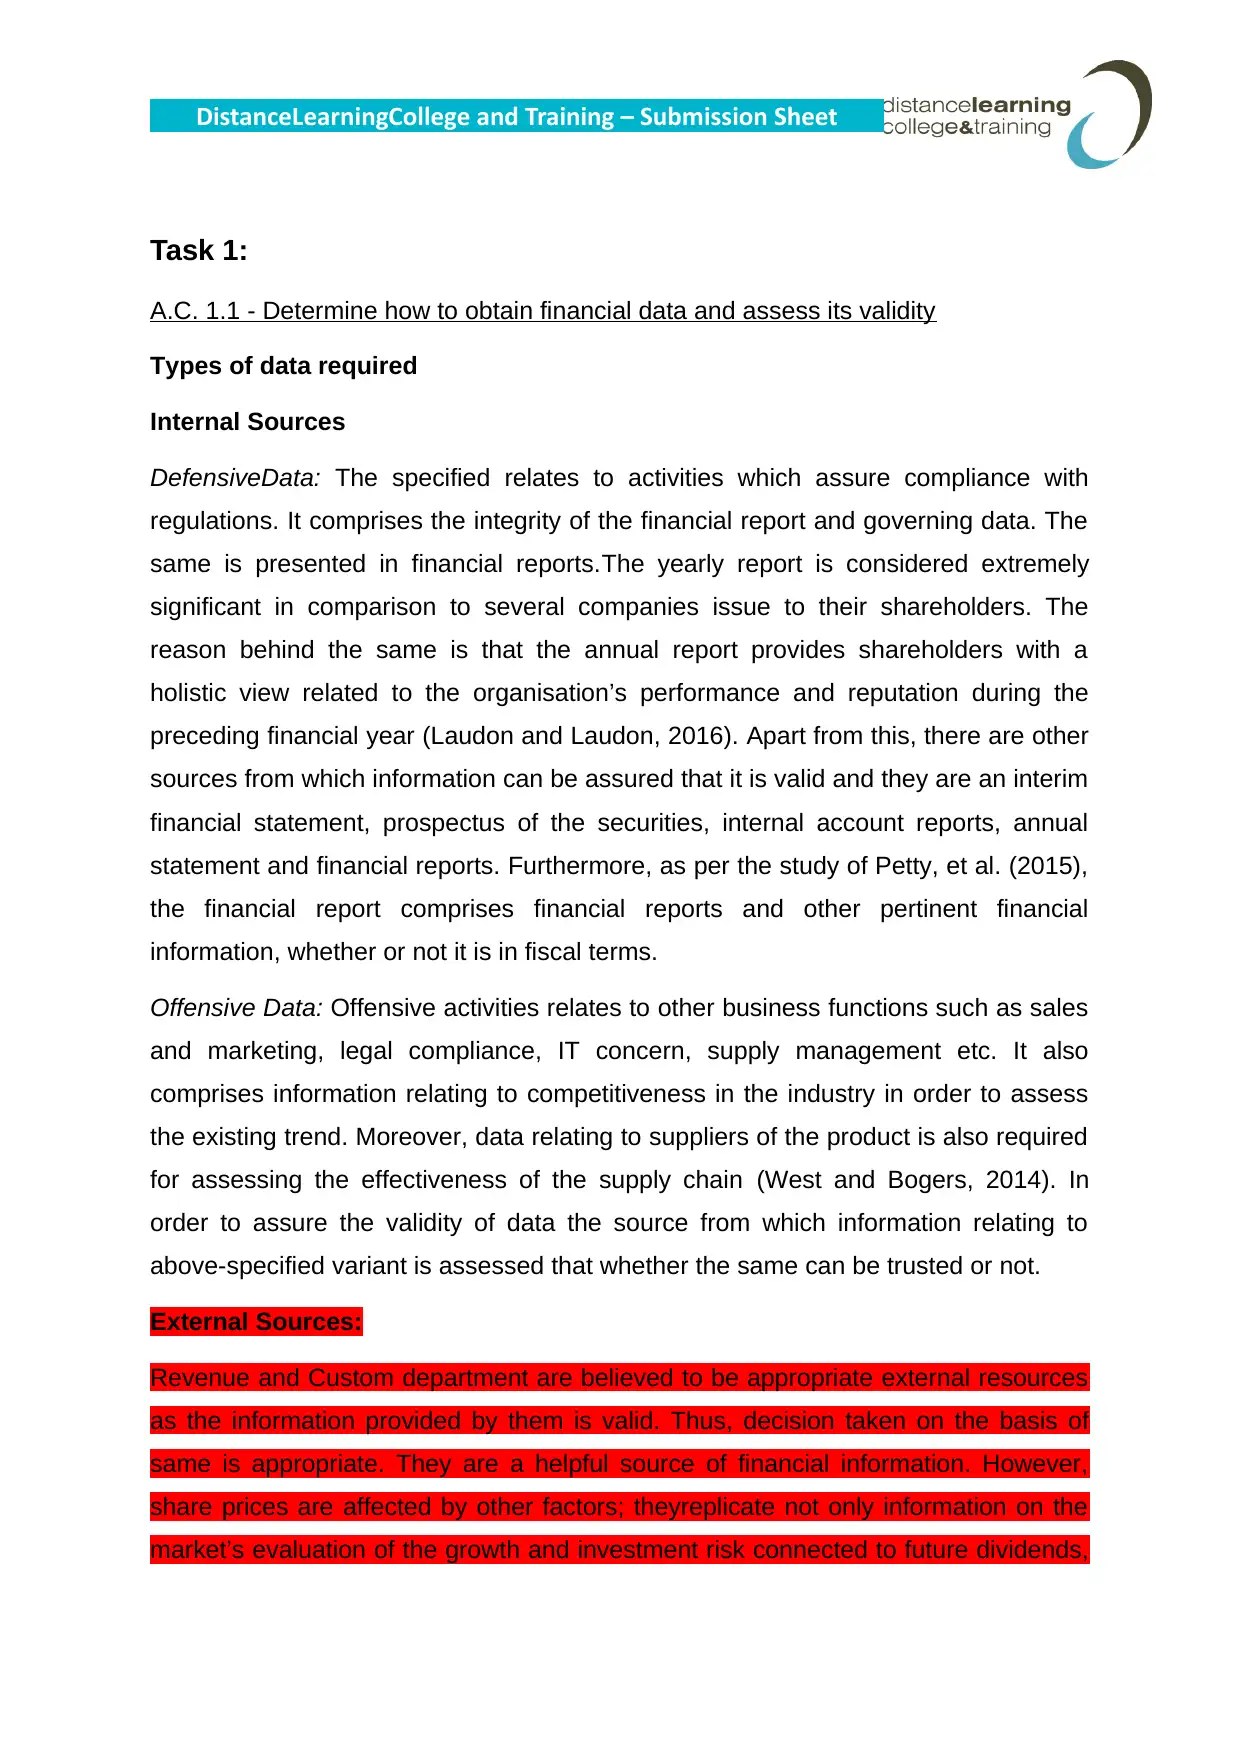
DefensiveData: The specified relates to activities which assure compliance with
regulations. It comprises the integrity of the financial report and governing data. The
same is presented in financial reports.The yearly report is considered extremely
significant in comparison to several companies issue to their shareholders. The
reason behind the same is that the annual report provides shareholders with a
holistic view related to the organisation’s performance and reputation during the
preceding financial year (Laudon and Laudon, 2016). Apart from this, there are other
sources from which information can be assured that it is valid and they are an interim
financial statement, prospectus of the securities, internal account reports, annual
statement and financial reports. Furthermore, as per the study of Petty, et al. (2015),
the financial report comprises financial reports and other pertinent financial
information, whether or not it is in fiscal terms.
Offensive Data: Offensive activities relates to other business functions such as sales
and marketing, legal compliance, IT concern, supply management etc. It also
comprises information relating to competitiveness in the industry in order to assess
the existing trend. Moreover, data relating to suppliers of the product is also required
for assessing the effectiveness of the supply chain (West and Bogers, 2014). In
order to assure the validity of data the source from which information relating to
above-specified variant is assessed that whether the same can be trusted or not.
External Sources:
Revenue and Custom department are believed to be appropriate external resources
as the information provided by them is valid. Thus, decision taken on the basis of
same is appropriate. They are a helpful source of financial information. However,
share prices are affected by other factors; theyreplicate not only information on the
market’s evaluation of the growth and investment risk connected to future dividends,
Task 1:
A.C. 1.1 - Determine how to obtain financial data and assess its validity
Types of data required
Internal Sources
DefensiveData: The specified relates to activities which assure compliance with
regulations. It comprises the integrity of the financial report and governing data. The
same is presented in financial reports.The yearly report is considered extremely
significant in comparison to several companies issue to their shareholders. The
reason behind the same is that the annual report provides shareholders with a
holistic view related to the organisation’s performance and reputation during the
preceding financial year (Laudon and Laudon, 2016). Apart from this, there are other
sources from which information can be assured that it is valid and they are an interim
financial statement, prospectus of the securities, internal account reports, annual
statement and financial reports. Furthermore, as per the study of Petty, et al. (2015),
the financial report comprises financial reports and other pertinent financial
information, whether or not it is in fiscal terms.
Offensive Data: Offensive activities relates to other business functions such as sales
and marketing, legal compliance, IT concern, supply management etc. It also
comprises information relating to competitiveness in the industry in order to assess
the existing trend. Moreover, data relating to suppliers of the product is also required
for assessing the effectiveness of the supply chain (West and Bogers, 2014). In
order to assure the validity of data the source from which information relating to
above-specified variant is assessed that whether the same can be trusted or not.
External Sources:
Revenue and Custom department are believed to be appropriate external resources
as the information provided by them is valid. Thus, decision taken on the basis of
same is appropriate. They are a helpful source of financial information. However,
share prices are affected by other factors; theyreplicate not only information on the
market’s evaluation of the growth and investment risk connected to future dividends,
⊘ This is a preview!⊘
Do you want full access?
Subscribe today to unlock all pages.
Trusted by 1+ million students worldwide
DistanceLearningCollege and Training – Submission Sheet
but also on the probability of insolvency. It order to assess same other external
variants should also be assessed in detail.
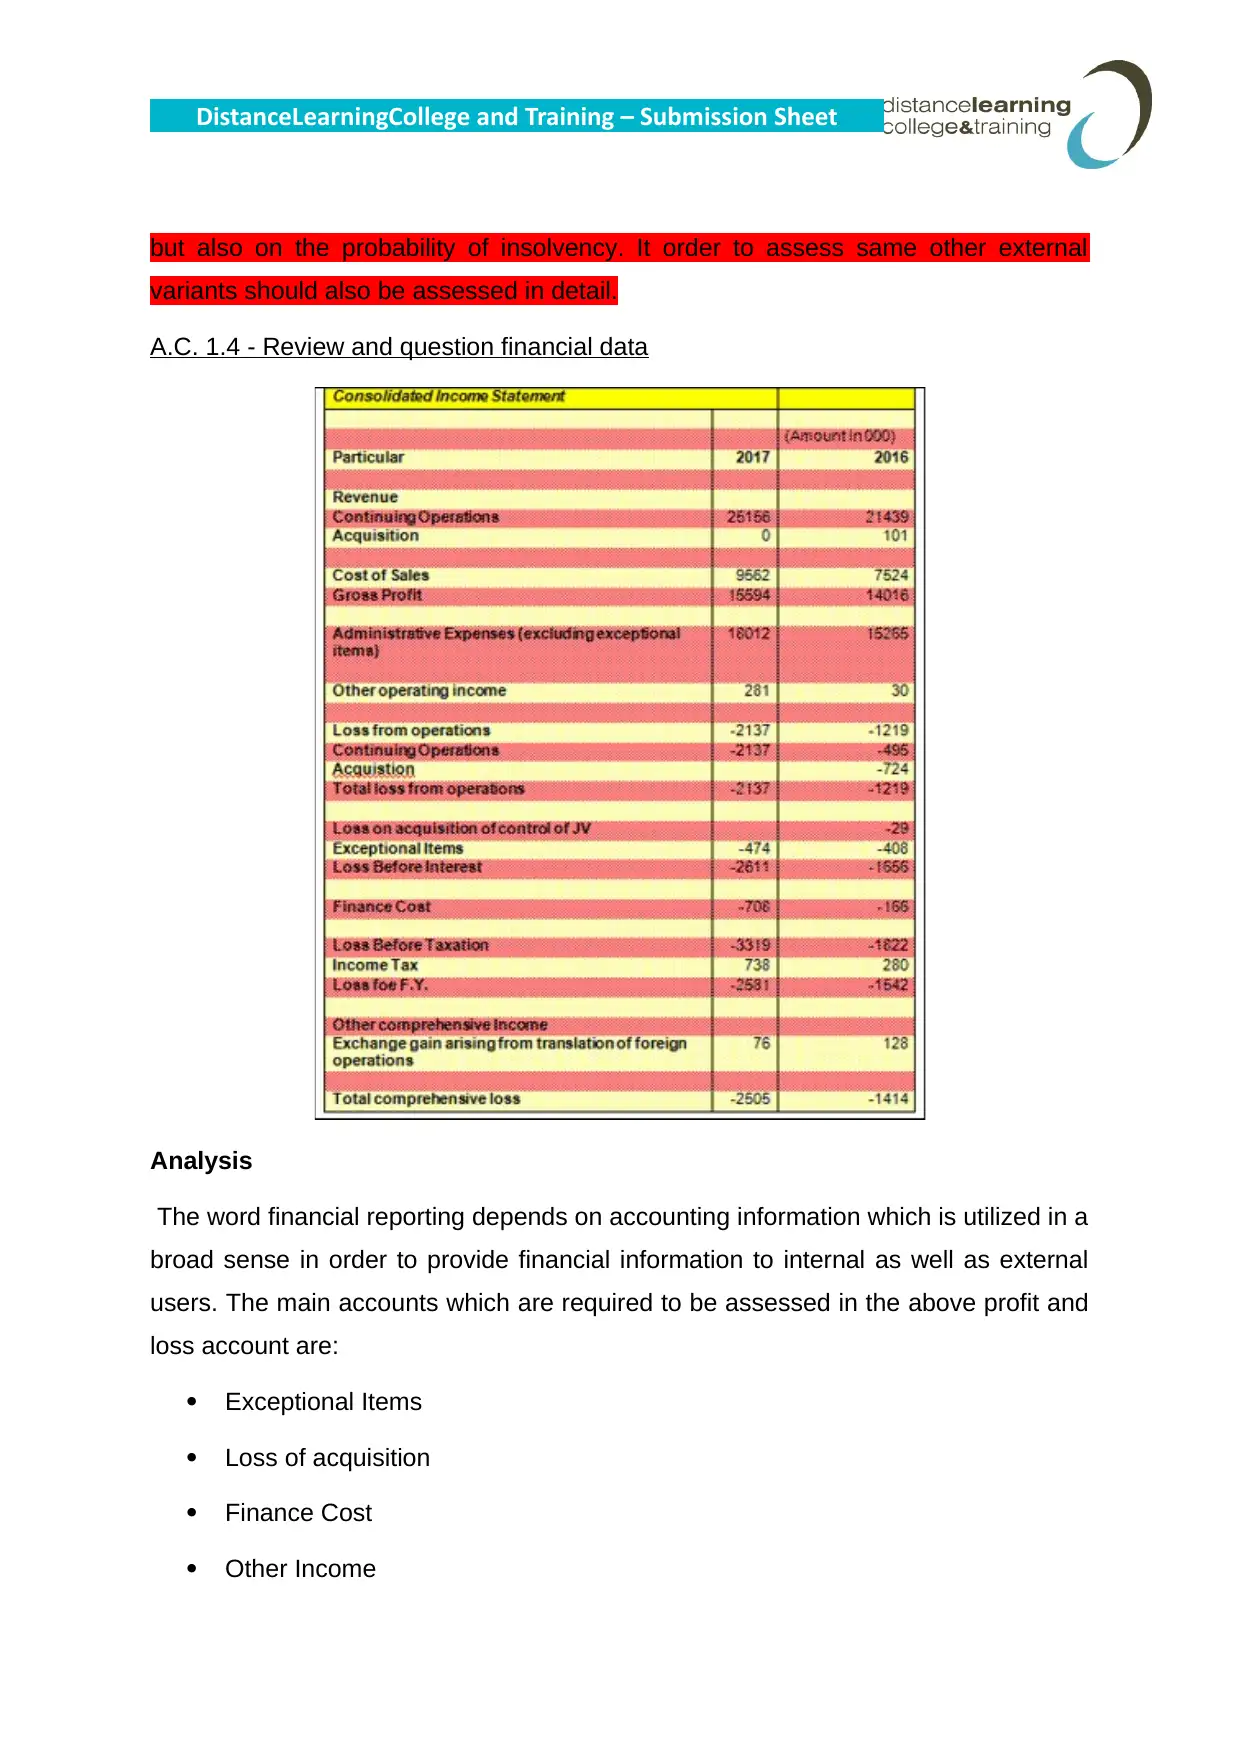
A.C. 1.4 - Review and question financial data
Analysis
The word financial reporting depends on accounting information which is utilized in a
broad sense in order to provide financial information to internal as well as external
users. The main accounts which are required to be assessed in the above profit and
loss account are:
Exceptional Items
Loss of acquisition
Finance Cost
Other Income
but also on the probability of insolvency. It order to assess same other external
variants should also be assessed in detail.
A.C. 1.4 - Review and question financial data
Analysis
The word financial reporting depends on accounting information which is utilized in a
broad sense in order to provide financial information to internal as well as external
users. The main accounts which are required to be assessed in the above profit and
loss account are:
Exceptional Items
Loss of acquisition
Finance Cost
Other Income
Paraphrase This Document
Need a fresh take? Get an instant paraphrase of this document with our AI Paraphraser
DistanceLearningCollege and Training – Submission Sheet
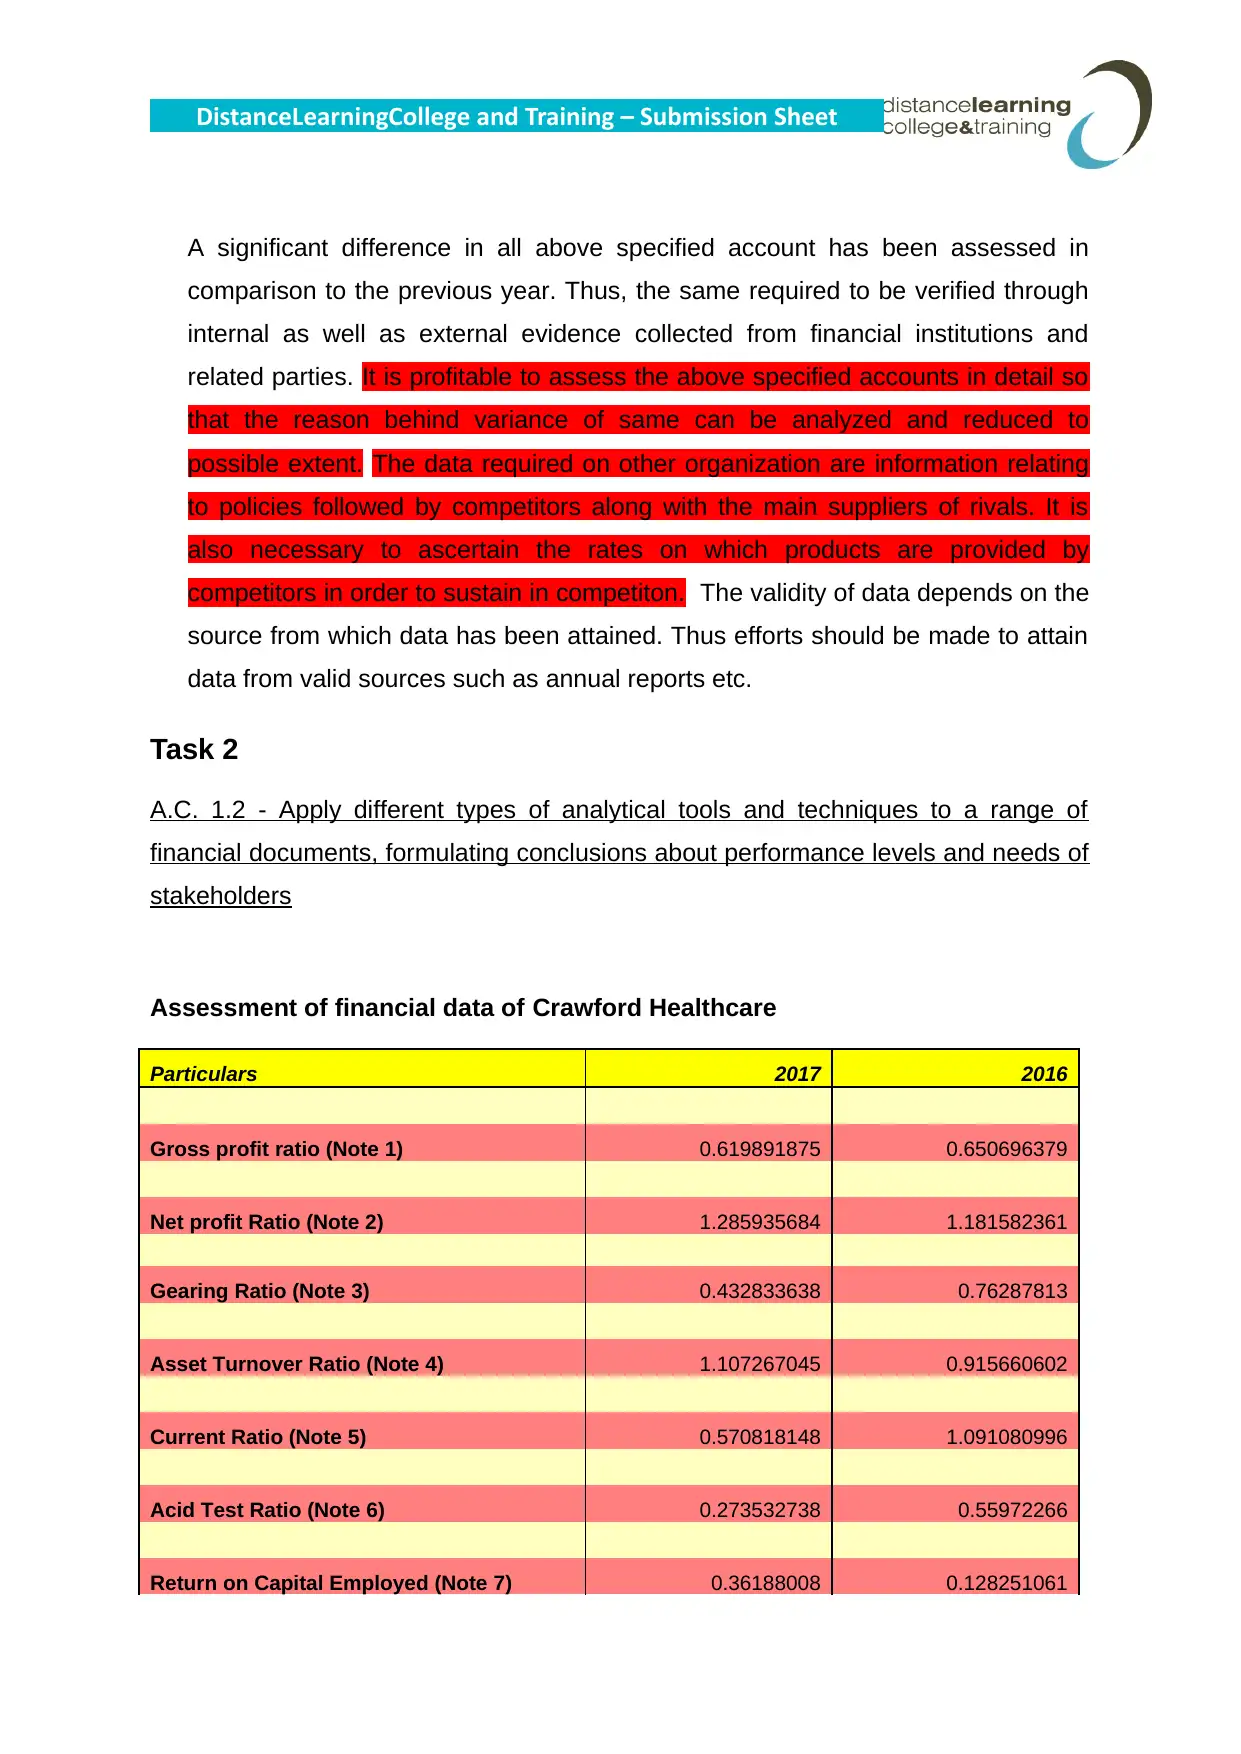
A significant difference in all above specified account has been assessed in
comparison to the previous year. Thus, the same required to be verified through
internal as well as external evidence collected from financial institutions and
related parties. It is profitable to assess the above specified accounts in detail so
that the reason behind variance of same can be analyzed and reduced to
possible extent. The data required on other organization are information relating
to policies followed by competitors along with the main suppliers of rivals. It is
also necessary to ascertain the rates on which products are provided by
competitors in order to sustain in competiton. The validity of data depends on the
source from which data has been attained. Thus efforts should be made to attain
data from valid sources such as annual reports etc.
Task 2
A.C. 1.2 - Apply different types of analytical tools and techniques to a range of
financial documents, formulating conclusions about performance levels and needs of
stakeholders
Assessment of financial data of Crawford Healthcare
Particulars 2017 2016
Gross profit ratio (Note 1) 0.619891875 0.650696379
Net profit Ratio (Note 2) 1.285935684 1.181582361
Gearing Ratio (Note 3) 0.432833638 0.76287813
Asset Turnover Ratio (Note 4) 1.107267045 0.915660602
Current Ratio (Note 5) 0.570818148 1.091080996
Acid Test Ratio (Note 6) 0.273532738 0.55972266
Return on Capital Employed (Note 7) 0.36188008 0.128251061
DistanceLearningCollege and Training – Submission Sheet
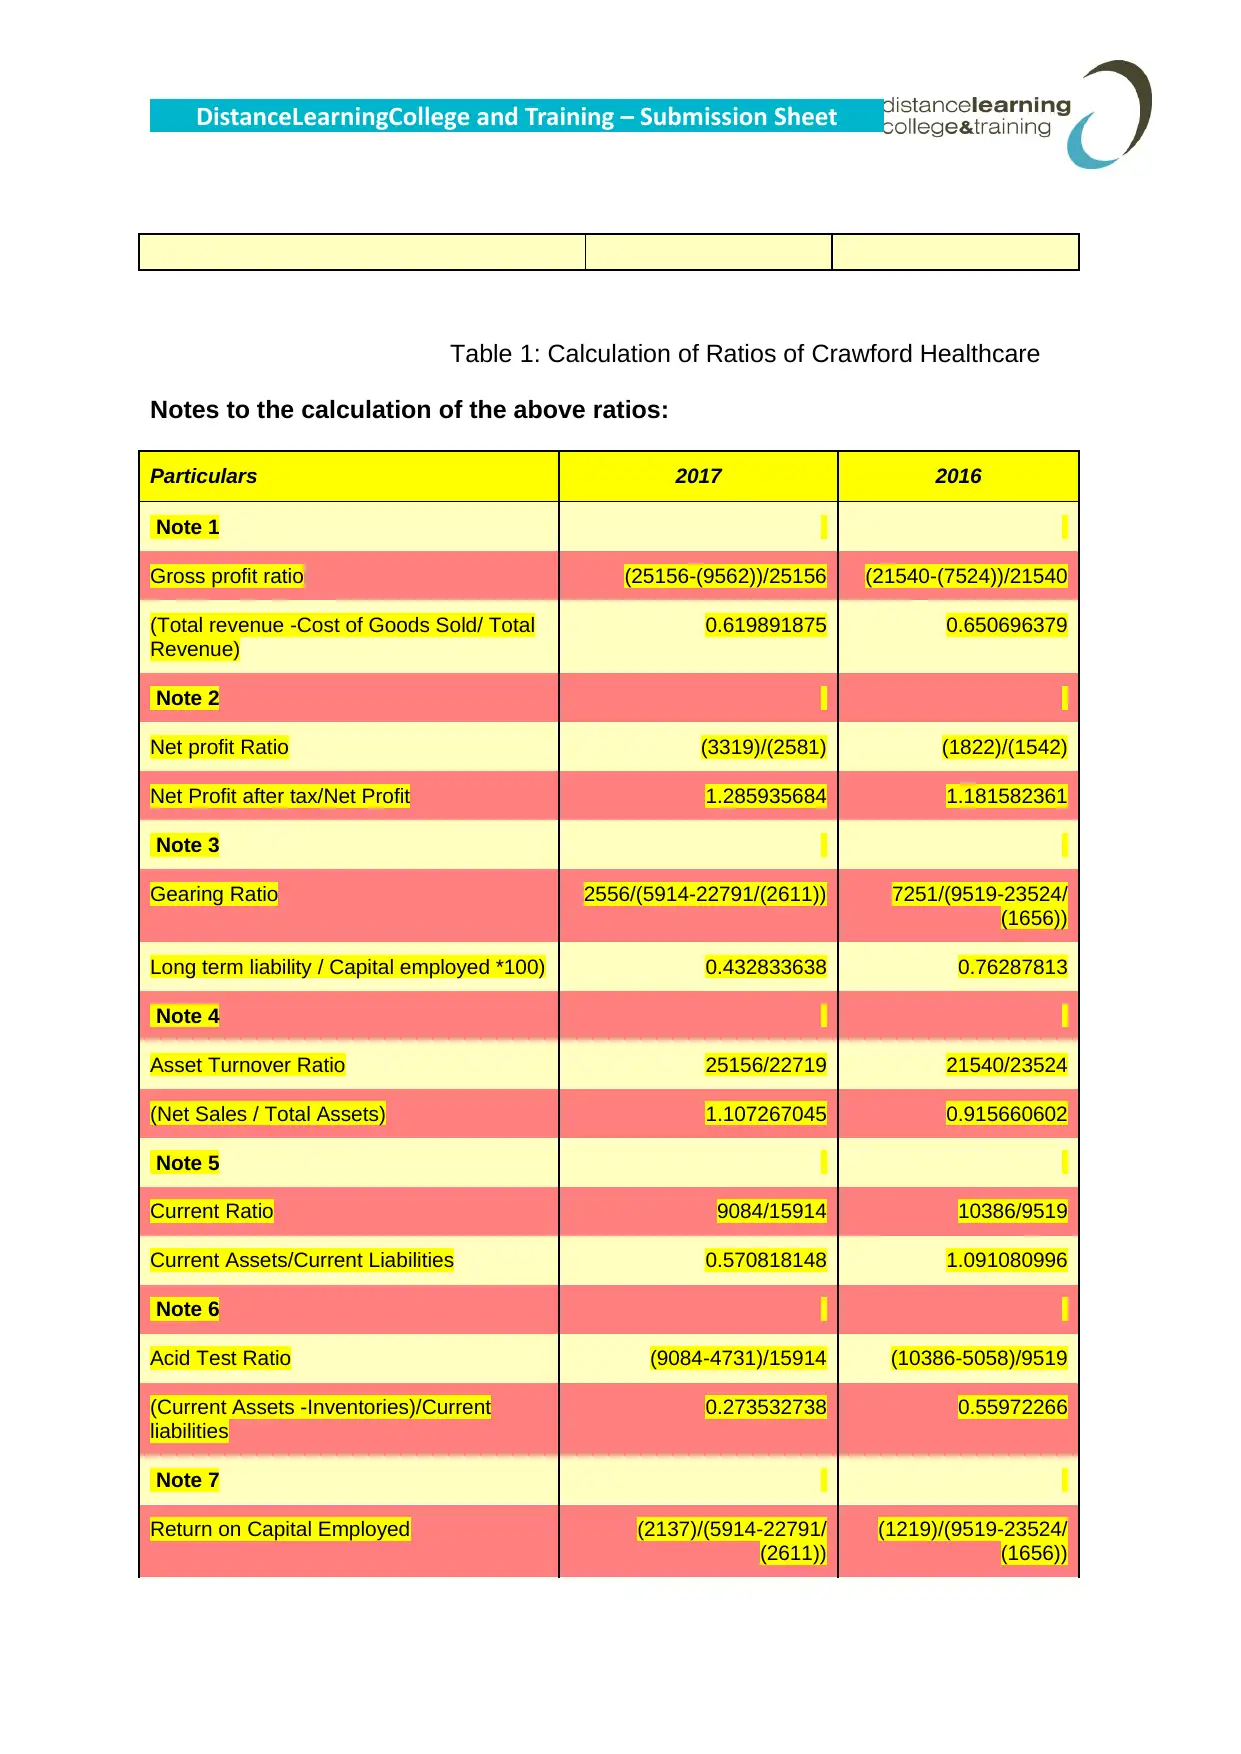
Table 1: Calculation of Ratios of Crawford Healthcare
Notes to the calculation of the above ratios:
Particulars 2017 2016
Note 1
Gross profit ratio (25156-(9562))/25156 (21540-(7524))/21540
(Total revenue -Cost of Goods Sold/ Total
Revenue)
0.619891875 0.650696379
Note 2
Net profit Ratio (3319)/(2581) (1822)/(1542)
Net Profit after tax/Net Profit 1.285935684 1.181582361
Note 3
Gearing Ratio 2556/(5914-22791/(2611)) 7251/(9519-23524/
(1656))
Long term liability / Capital employed *100) 0.432833638 0.76287813
Note 4
Asset Turnover Ratio 25156/22719 21540/23524
(Net Sales / Total Assets) 1.107267045 0.915660602
Note 5
Current Ratio 9084/15914 10386/9519
Current Assets/Current Liabilities 0.570818148 1.091080996
Note 6
Acid Test Ratio (9084-4731)/15914 (10386-5058)/9519
(Current Assets -Inventories)/Current
liabilities
0.273532738 0.55972266
Note 7
Return on Capital Employed (2137)/(5914-22791/
(2611))
(1219)/(9519-23524/
(1656))
⊘ This is a preview!⊘
Do you want full access?
Subscribe today to unlock all pages.
Trusted by 1+ million students worldwide

DistanceLearningCollege and Training – Submission Sheet
Net Operating Profit/Capital Employed 0.36188008 0.128251061
A.C. 1.3 - Conduct comparative analysis of financial data
Net Operating Profit/Capital Employed 0.36188008 0.128251061
A.C. 1.3 - Conduct comparative analysis of financial data
Paraphrase This Document
Need a fresh take? Get an instant paraphrase of this document with our AI Paraphraser
DistanceLearningCollege and Training – Submission Sheet
Strength of company
Profitability
Gross profit (GP) ratio can be defined as a profitability ratio which demonstrates the
connection between gross profit and net sales income(Arkan, 2016). Further, the
gross profit of the company is low which indicates that an organisation is having
decreasing trend of gross profit which means products are under-priced. Thus, the
same can be improved through increasing the price of products. Net profit (NP) ratio
refers to profitability which illustrates the correlation of net profit after tax with net
sales. The net profit can be calculated by dividing the net profit after tax with net
sales of the company. Further, elevated net profit indicates that a Crawford
Healthcare is capableofchanging sales into real income. Thisthe same can be said to
be the strength of the company
Efficiency
Gearing ratio is used to calculate the fraction of the organisation’s borrowed funds to
its equity. Further, this ratio signifies the financial risk to which a company is
subjected to extreme debt can result in financial complexities. The gearing ratio of
the company is low, indicating that the proportion of debt is low than equity. The
asset turnover ratio calculates the value of an organisation’s sales or income
generated relative to the value of its assets. Further, higher asset turnover ratio of
Crawford Healthcare is a strength which indicates that of the companyperforming in
an efficient manner as it signifies that an organisation is producing more income.
Moreover the equity position also represents the efficiency of company in managing
required through its own resources (capital and retained earnings)
Return on capital employed (ROCE) refers to the financial ratio which estimates the
profitability of an organisation as well as the efficiency with which its capital is
utilized. Moreover, it is necessary that the company’s ROE is higher than the cost or
else it implies that the organisation is not employing its capital efficiently as well as it
is not producing shareholder value. Further, ROCE of Crawford Healthcare is
higher, andit is signifying that capital is utilised in an effective manner.
DistanceLearningCollege and Training – Submission Sheet
Weakness
Liquidity
The current ratio can be defined as a liquidity and efficiency ratio which calculates
the capability of the company to recompense its short-term liabilities with its current
assets. Further, the current ratio of the company is low which implies that it is not
efficiently capable of paying off its debt and it represents the weakness of the
company. However even the ratio has decreased to a significant extent in
comparison to the previous year, butstill, it has not been lower in comparison to idol
ratio, i.e. 0.5:1. Acid test ratio can be defined as the strong indicator of whether the
company has adequate short-term assets or not. The same implies that whether the
company is capable of meeting its immediate liabilities. Further, the companyhas an
acid test ratio of less than 1, indicating that the company does not have sufficient
liquid assets to meet their current liabilities...
Conclusion and Recommendations
Ratio analysis are applied to assess the actual position of an organization on all
financial as well as non-financial metrics i.e. profitability, liquidity and efficiency.
Thus, in case of above company it can be assessed that it is not able to manage its
cash in appropriate manner as due to same reason it is weak at liquidity
parameters.The same can be improved through managing liquid funds and making
them available all the time. Further, it is recommended to develop appropriate
budget in structured manner so that regular monitoring against organisational or
departmental targets could be done. The required quantum of liquid assets can be
known from same and attempt could be made for their availability.
⊘ This is a preview!⊘
Do you want full access?
Subscribe today to unlock all pages.
Trusted by 1+ million students worldwide
1 out of 23
Related Documents


Your All-in-One AI-Powered Toolkit for Academic Success.
+13062052269
info@desklib.com
Available 24*7 on WhatsApp / Email
![[object Object]](/_next/static/media/star-bottom.7253800d.svg)
Unlock your academic potential
Copyright © 2020–2026 A2Z Services. All Rights Reserved. Developed and managed by ZUCOL.