Financial Management Analysis Report
VerifiedAdded on 2020/03/23
|14
|2765
|496
Report
AI Summary
This report presents a comprehensive financial management analysis of Pick N Pay, covering key metrics such as Economic Value Added (EVA), Total Shareholder Return (TSR), profitability ratios, and market capitalization. The analysis spans from 2012 to 2017, highlighting the company's performance trends and providing insights into its financial health. The report concludes that while the company has delivered significant value to its investors, there are areas for improvement.
Running Head: FINANCE
Finance
Name of the Student:
Name of the University:
Authors Note:
Finance
Name of the Student:
Name of the University:
Authors Note:
Paraphrase This Document
Need a fresh take? Get an instant paraphrase of this document with our AI Paraphraser
2FINANCIAL MANAGEMENT
Table of Contents
Economic Value Added Analysis:...................................................................................................3
Total Shareholders Return...............................................................................................................4
Profitability analysis:.......................................................................................................................5
Market capitalization analysis:........................................................................................................7
Return on investor’s fund:...............................................................................................................7
Cash flow analysis:..........................................................................................................................9
Net asset value:..............................................................................................................................11
Conclusion:....................................................................................................................................11
Reference.......................................................................................................................................12
3FINANCIAL MANAGEMENT
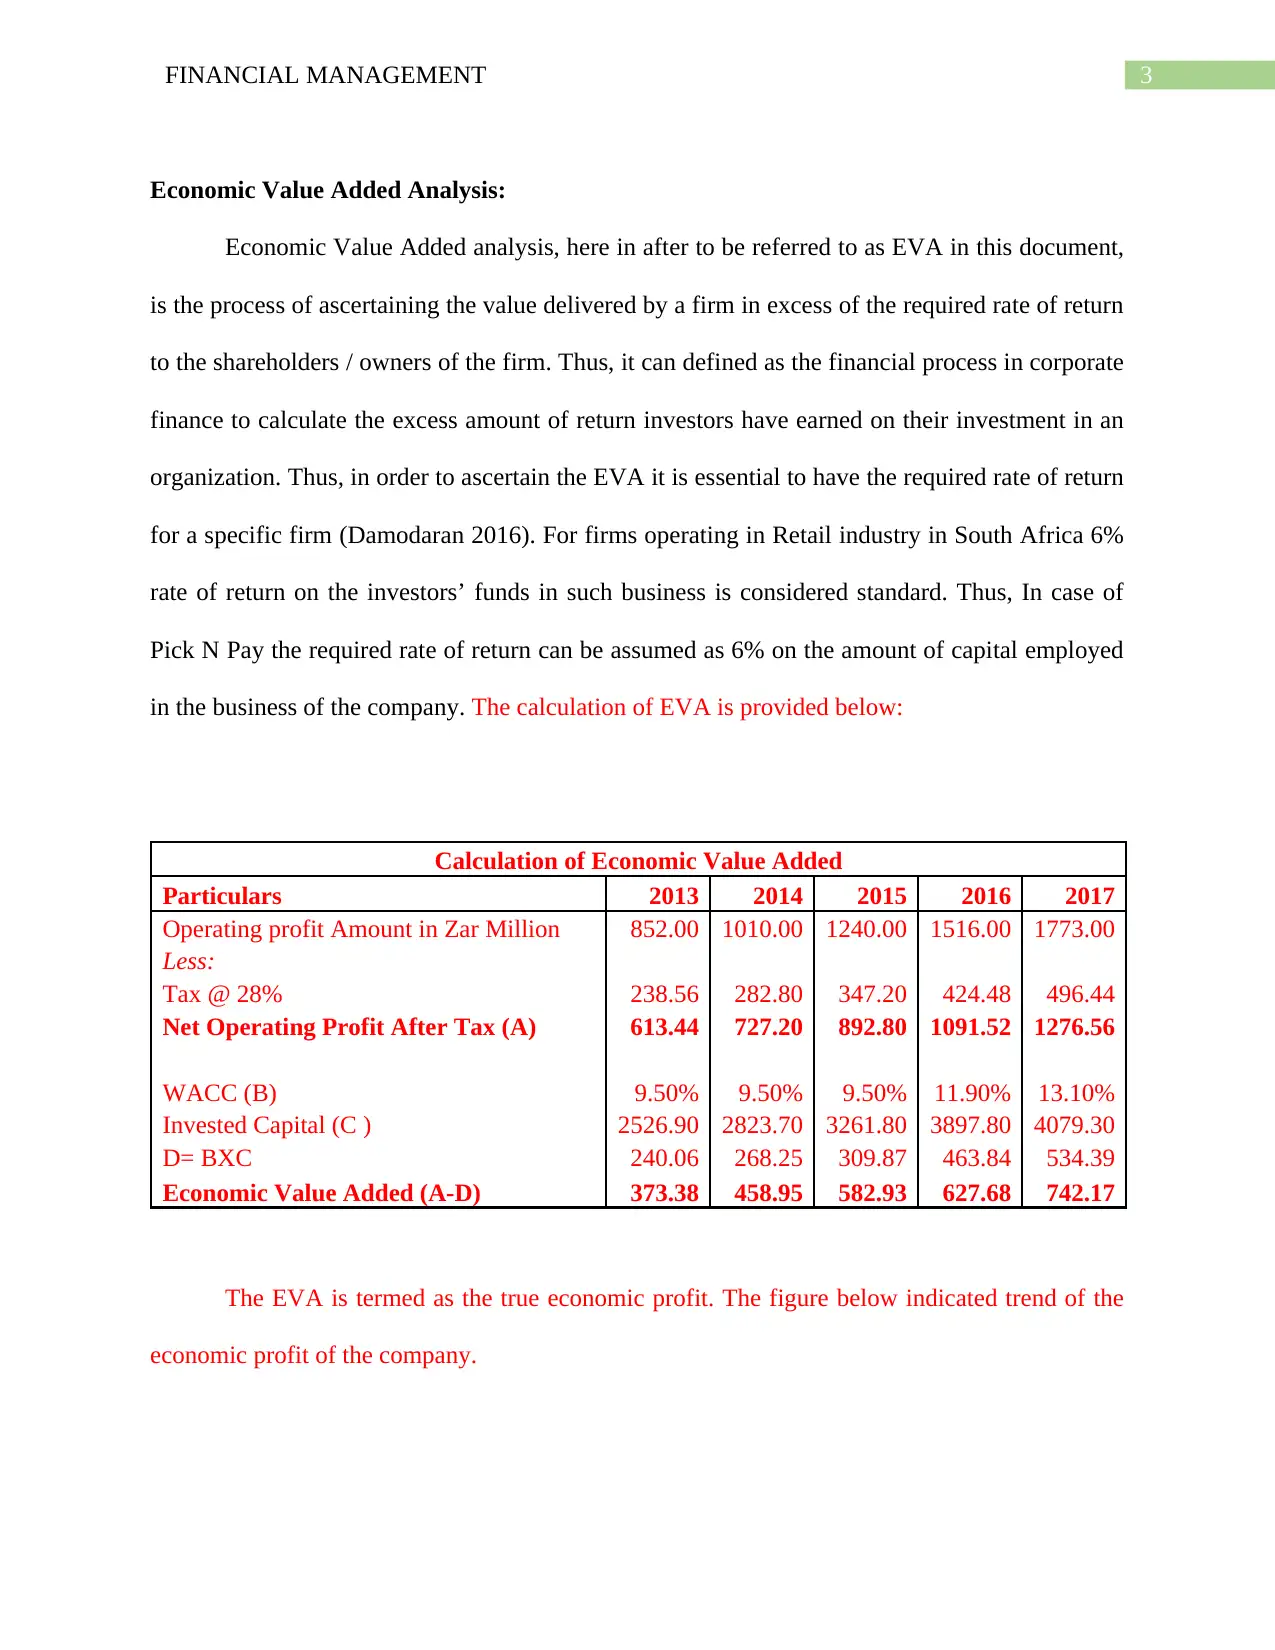
Economic Value Added Analysis:
Economic Value Added analysis, here in after to be referred to as EVA in this document,
is the process of ascertaining the value delivered by a firm in excess of the required rate of return
to the shareholders / owners of the firm. Thus, it can defined as the financial process in corporate
finance to calculate the excess amount of return investors have earned on their investment in an
organization. Thus, in order to ascertain the EVA it is essential to have the required rate of return
for a specific firm (Damodaran 2016). For firms operating in Retail industry in South Africa 6%
rate of return on the investors’ funds in such business is considered standard. Thus, In case of
Pick N Pay the required rate of return can be assumed as 6% on the amount of capital employed
in the business of the company. The calculation of EVA is provided below:
Calculation of Economic Value Added
Particulars 2013 2014 2015 2016 2017
Operating profit Amount in Zar Million 852.00 1010.00 1240.00 1516.00 1773.00
Less:
Tax @ 28% 238.56 282.80 347.20 424.48 496.44
Net Operating Profit After Tax (A) 613.44 727.20 892.80 1091.52 1276.56
WACC (B) 9.50% 9.50% 9.50% 11.90% 13.10%
Invested Capital (C ) 2526.90 2823.70 3261.80 3897.80 4079.30
D= BXC 240.06 268.25 309.87 463.84 534.39
Economic Value Added (A-D) 373.38 458.95 582.93 627.68 742.17
The EVA is termed as the true economic profit. The figure below indicated trend of the
economic profit of the company.
⊘ This is a preview!⊘
Do you want full access?
Subscribe today to unlock all pages.
Trusted by 1+ million students worldwide
4FINANCIAL MANAGEMENT
2013 2014 2015 2016 2017
0.00
100.00
200.00
300.00
400.00
500.00
600.00
700.00
800.00
Economic Value Added (A-D)
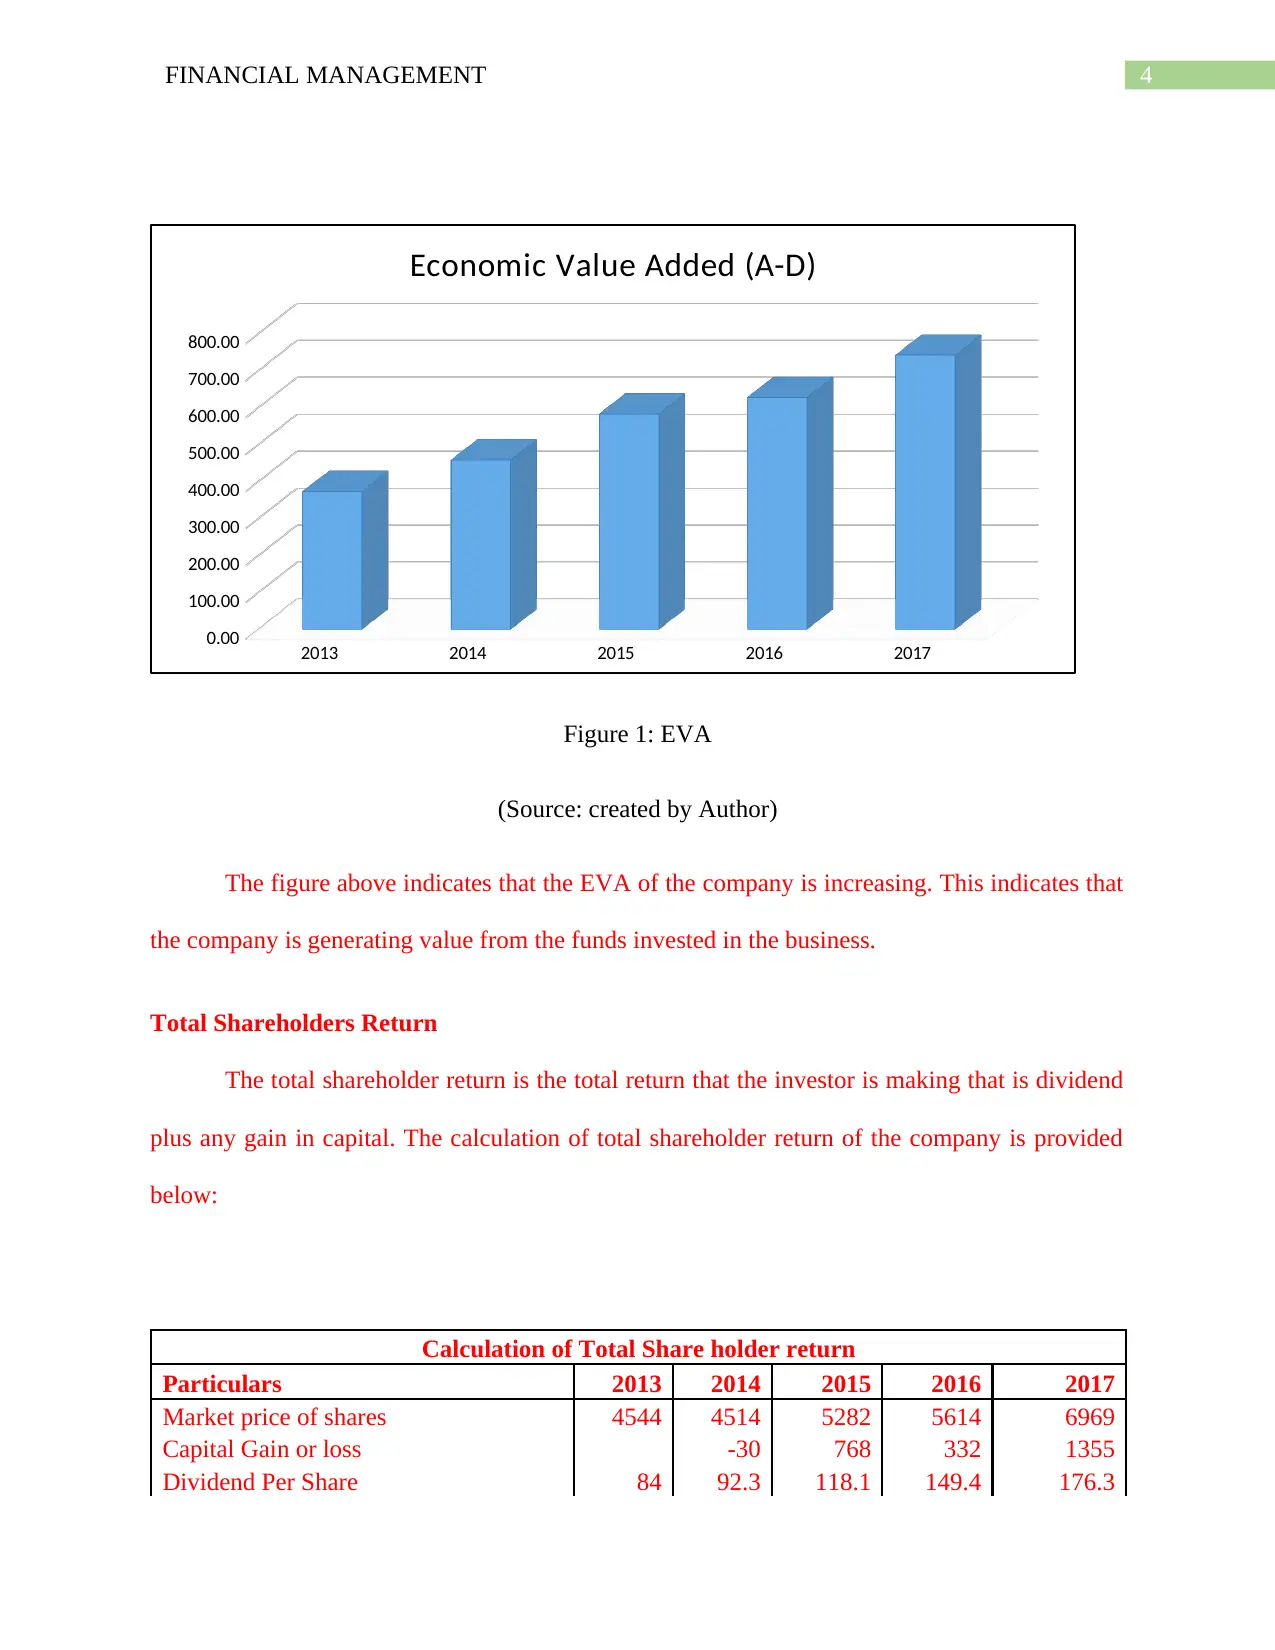
Figure 1: EVA
(Source: created by Author)
The figure above indicates that the EVA of the company is increasing. This indicates that
the company is generating value from the funds invested in the business.
Total Shareholders Return
The total shareholder return is the total return that the investor is making that is dividend
plus any gain in capital. The calculation of total shareholder return of the company is provided
below:
Calculation of Total Share holder return
Particulars 2013 2014 2015 2016 2017
Market price of shares 4544 4514 5282 5614 6969
Capital Gain or loss -30 768 332 1355
Dividend Per Share 84 92.3 118.1 149.4 176.3
2013 2014 2015 2016 2017
0.00
100.00
200.00
300.00
400.00
500.00
600.00
700.00
800.00
Economic Value Added (A-D)
Figure 1: EVA
(Source: created by Author)
The figure above indicates that the EVA of the company is increasing. This indicates that
the company is generating value from the funds invested in the business.
Total Shareholders Return
The total shareholder return is the total return that the investor is making that is dividend
plus any gain in capital. The calculation of total shareholder return of the company is provided
below:
Calculation of Total Share holder return
Particulars 2013 2014 2015 2016 2017
Market price of shares 4544 4514 5282 5614 6969
Capital Gain or loss -30 768 332 1355
Dividend Per Share 84 92.3 118.1 149.4 176.3
Paraphrase This Document
Need a fresh take? Get an instant paraphrase of this document with our AI Paraphraser
5FINANCIAL MANAGEMENT
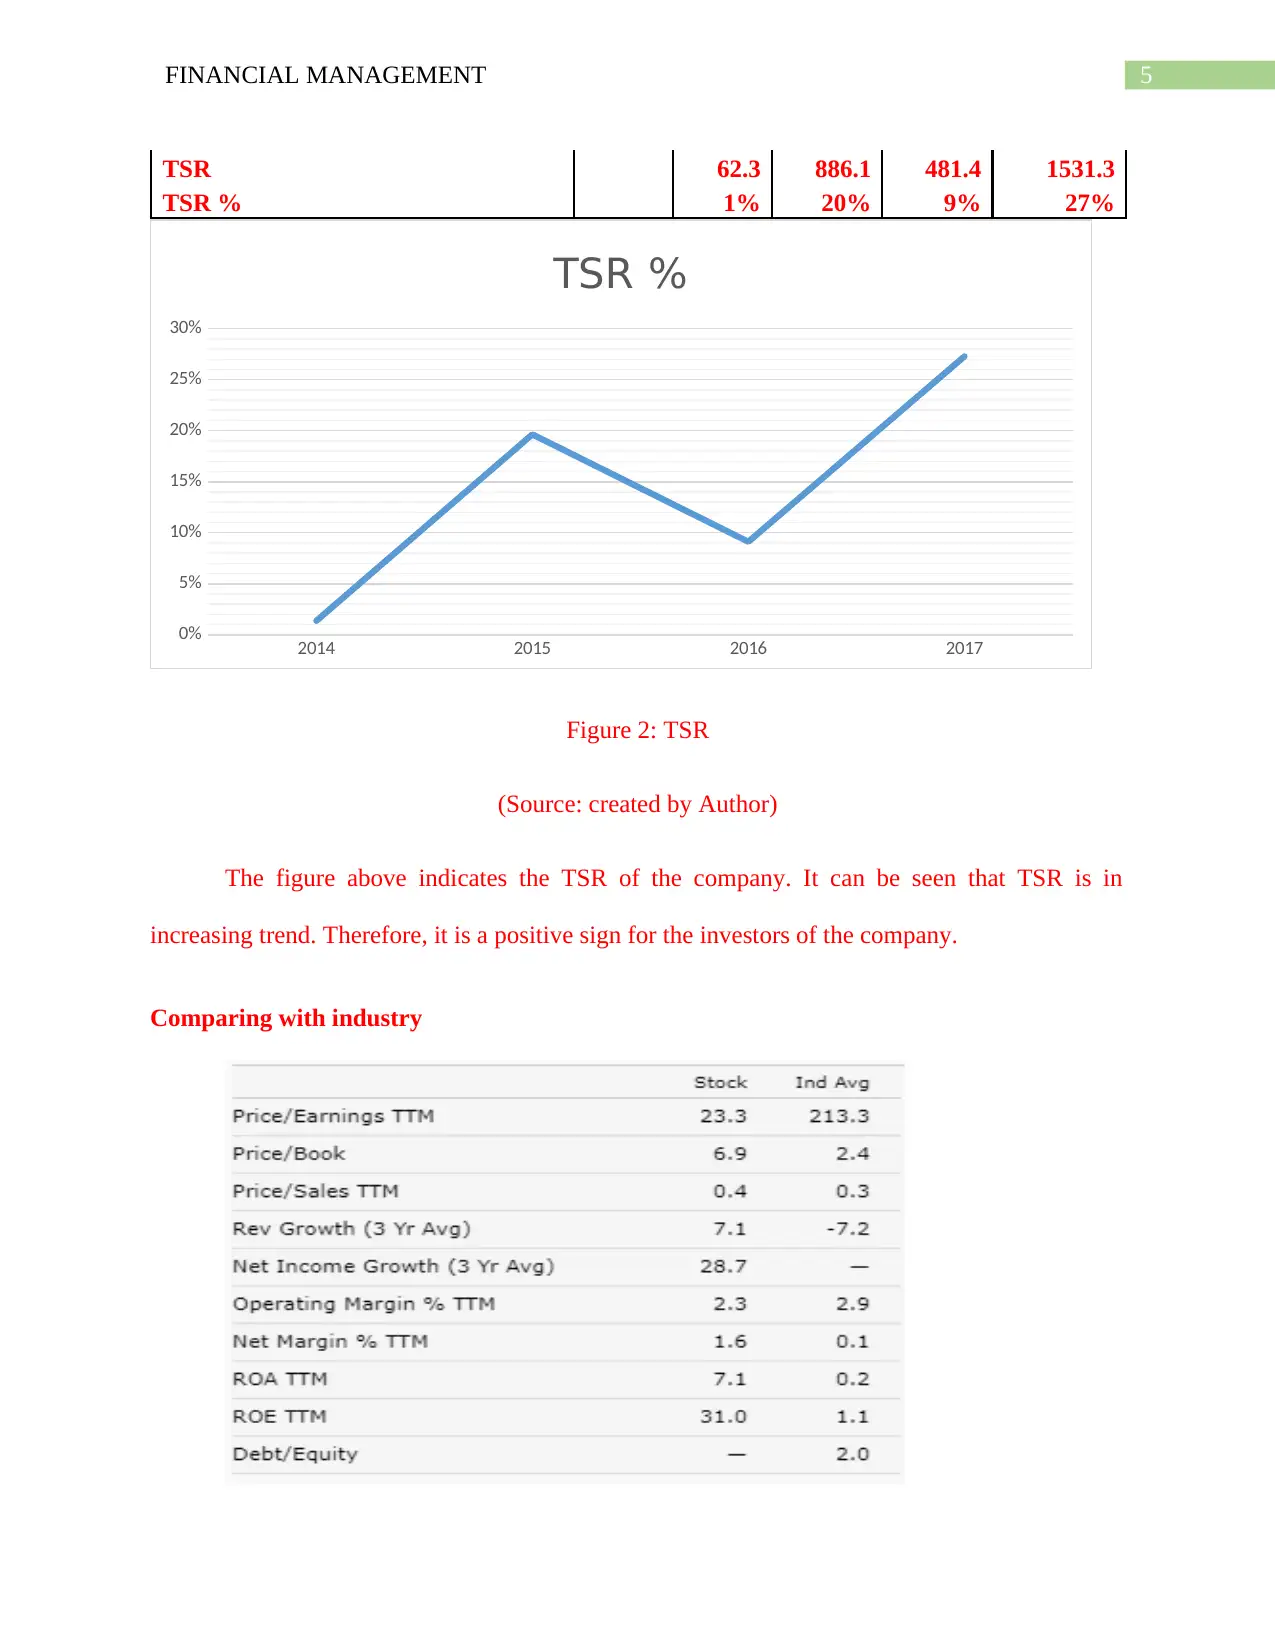
TSR 62.3 886.1 481.4 1531.3
TSR % 1% 20% 9% 27%
2014 2015 2016 2017
0%
5%
10%
15%
20%
25%
30%
TSR %
Figure 2: TSR
(Source: created by Author)
The figure above indicates the TSR of the company. It can be seen that TSR is in
increasing trend. Therefore, it is a positive sign for the investors of the company.
Comparing with industry
6FINANCIAL MANAGEMENT
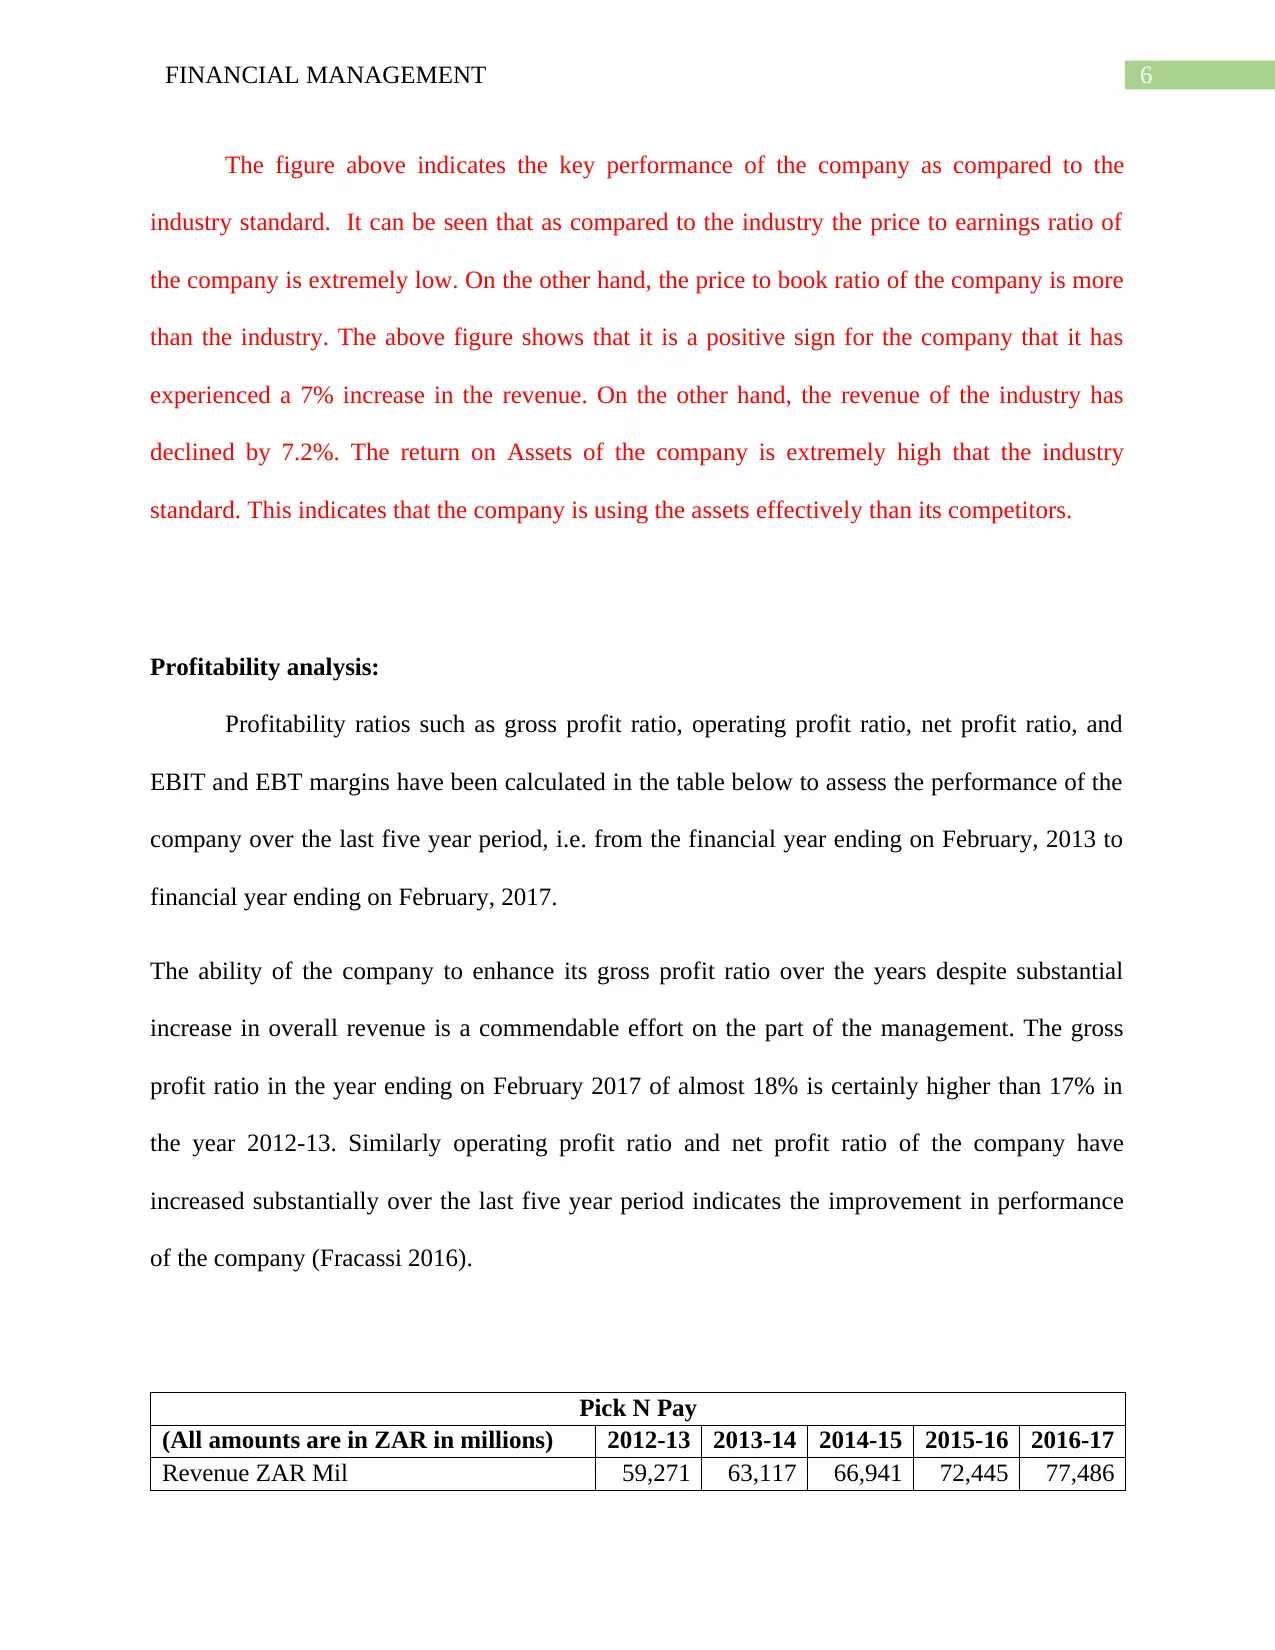
The figure above indicates the key performance of the company as compared to the
industry standard. It can be seen that as compared to the industry the price to earnings ratio of
the company is extremely low. On the other hand, the price to book ratio of the company is more
than the industry. The above figure shows that it is a positive sign for the company that it has
experienced a 7% increase in the revenue. On the other hand, the revenue of the industry has
declined by 7.2%. The return on Assets of the company is extremely high that the industry
standard. This indicates that the company is using the assets effectively than its competitors.
Profitability analysis:
Profitability ratios such as gross profit ratio, operating profit ratio, net profit ratio, and
EBIT and EBT margins have been calculated in the table below to assess the performance of the
company over the last five year period, i.e. from the financial year ending on February, 2013 to
financial year ending on February, 2017.
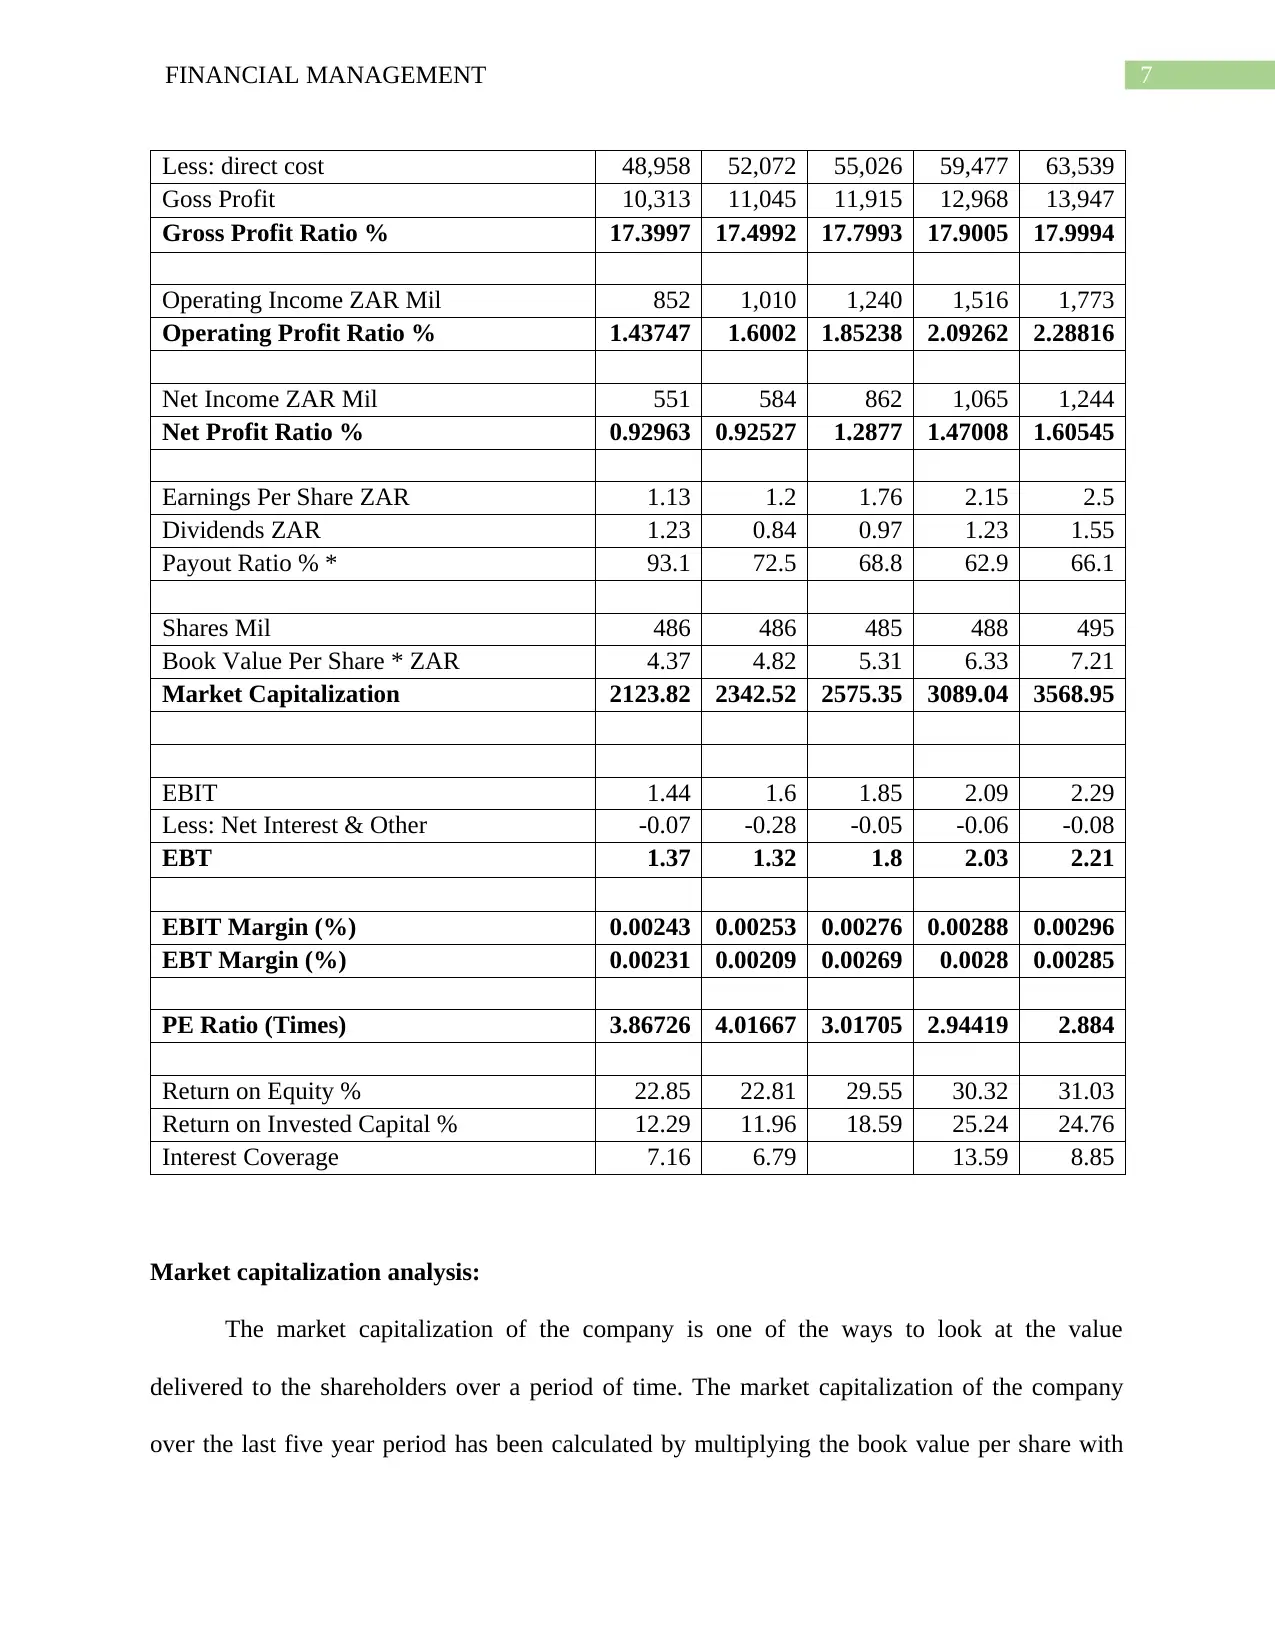
The ability of the company to enhance its gross profit ratio over the years despite substantial
increase in overall revenue is a commendable effort on the part of the management. The gross
profit ratio in the year ending on February 2017 of almost 18% is certainly higher than 17% in
the year 2012-13. Similarly operating profit ratio and net profit ratio of the company have
increased substantially over the last five year period indicates the improvement in performance
of the company (Fracassi 2016).
Pick N Pay
(All amounts are in ZAR in millions) 2012-13 2013-14 2014-15 2015-16 2016-17
Revenue ZAR Mil 59,271 63,117 66,941 72,445 77,486
The figure above indicates the key performance of the company as compared to the
industry standard. It can be seen that as compared to the industry the price to earnings ratio of
the company is extremely low. On the other hand, the price to book ratio of the company is more
than the industry. The above figure shows that it is a positive sign for the company that it has
experienced a 7% increase in the revenue. On the other hand, the revenue of the industry has
declined by 7.2%. The return on Assets of the company is extremely high that the industry
standard. This indicates that the company is using the assets effectively than its competitors.
Profitability analysis:
Profitability ratios such as gross profit ratio, operating profit ratio, net profit ratio, and
EBIT and EBT margins have been calculated in the table below to assess the performance of the
company over the last five year period, i.e. from the financial year ending on February, 2013 to
financial year ending on February, 2017.
The ability of the company to enhance its gross profit ratio over the years despite substantial
increase in overall revenue is a commendable effort on the part of the management. The gross
profit ratio in the year ending on February 2017 of almost 18% is certainly higher than 17% in
the year 2012-13. Similarly operating profit ratio and net profit ratio of the company have
increased substantially over the last five year period indicates the improvement in performance
of the company (Fracassi 2016).
Pick N Pay
(All amounts are in ZAR in millions) 2012-13 2013-14 2014-15 2015-16 2016-17
Revenue ZAR Mil 59,271 63,117 66,941 72,445 77,486
⊘ This is a preview!⊘
Do you want full access?
Subscribe today to unlock all pages.
Trusted by 1+ million students worldwide
7FINANCIAL MANAGEMENT
Less: direct cost 48,958 52,072 55,026 59,477 63,539
Goss Profit 10,313 11,045 11,915 12,968 13,947
Gross Profit Ratio % 17.3997 17.4992 17.7993 17.9005 17.9994
Operating Income ZAR Mil 852 1,010 1,240 1,516 1,773
Operating Profit Ratio % 1.43747 1.6002 1.85238 2.09262 2.28816
Net Income ZAR Mil 551 584 862 1,065 1,244
Net Profit Ratio % 0.92963 0.92527 1.2877 1.47008 1.60545
Earnings Per Share ZAR 1.13 1.2 1.76 2.15 2.5
Dividends ZAR 1.23 0.84 0.97 1.23 1.55
Payout Ratio % * 93.1 72.5 68.8 62.9 66.1
Shares Mil 486 486 485 488 495
Book Value Per Share * ZAR 4.37 4.82 5.31 6.33 7.21
Market Capitalization 2123.82 2342.52 2575.35 3089.04 3568.95
EBIT 1.44 1.6 1.85 2.09 2.29
Less: Net Interest & Other -0.07 -0.28 -0.05 -0.06 -0.08
EBT 1.37 1.32 1.8 2.03 2.21
EBIT Margin (%) 0.00243 0.00253 0.00276 0.00288 0.00296
EBT Margin (%) 0.00231 0.00209 0.00269 0.0028 0.00285
PE Ratio (Times) 3.86726 4.01667 3.01705 2.94419 2.884
Return on Equity % 22.85 22.81 29.55 30.32 31.03
Return on Invested Capital % 12.29 11.96 18.59 25.24 24.76
Interest Coverage 7.16 6.79 13.59 8.85
Market capitalization analysis:
The market capitalization of the company is one of the ways to look at the value
delivered to the shareholders over a period of time. The market capitalization of the company
over the last five year period has been calculated by multiplying the book value per share with
Paraphrase This Document
Need a fresh take? Get an instant paraphrase of this document with our AI Paraphraser
8FINANCIAL MANAGEMENT
the number of shares outstanding. From market capitalization of ZAR 2123.83 Million in the
year 2012-13 to ZAR 3568.95 Million in the year 2016-17, an increase of ZAR 1445.13 Million
shows that the company has been able to enhance the capital value of the investment by almost
70% over the last five year (Hillier et al. 2013).
The decreasing price earnings ratio of the company though is something the management
needs to focus on and take some actions to increase the price earnings ratio. From 3.87 times in
2012-13 to 2.88 times in the year 2016-17 is certainly not an ideal situation for the company.
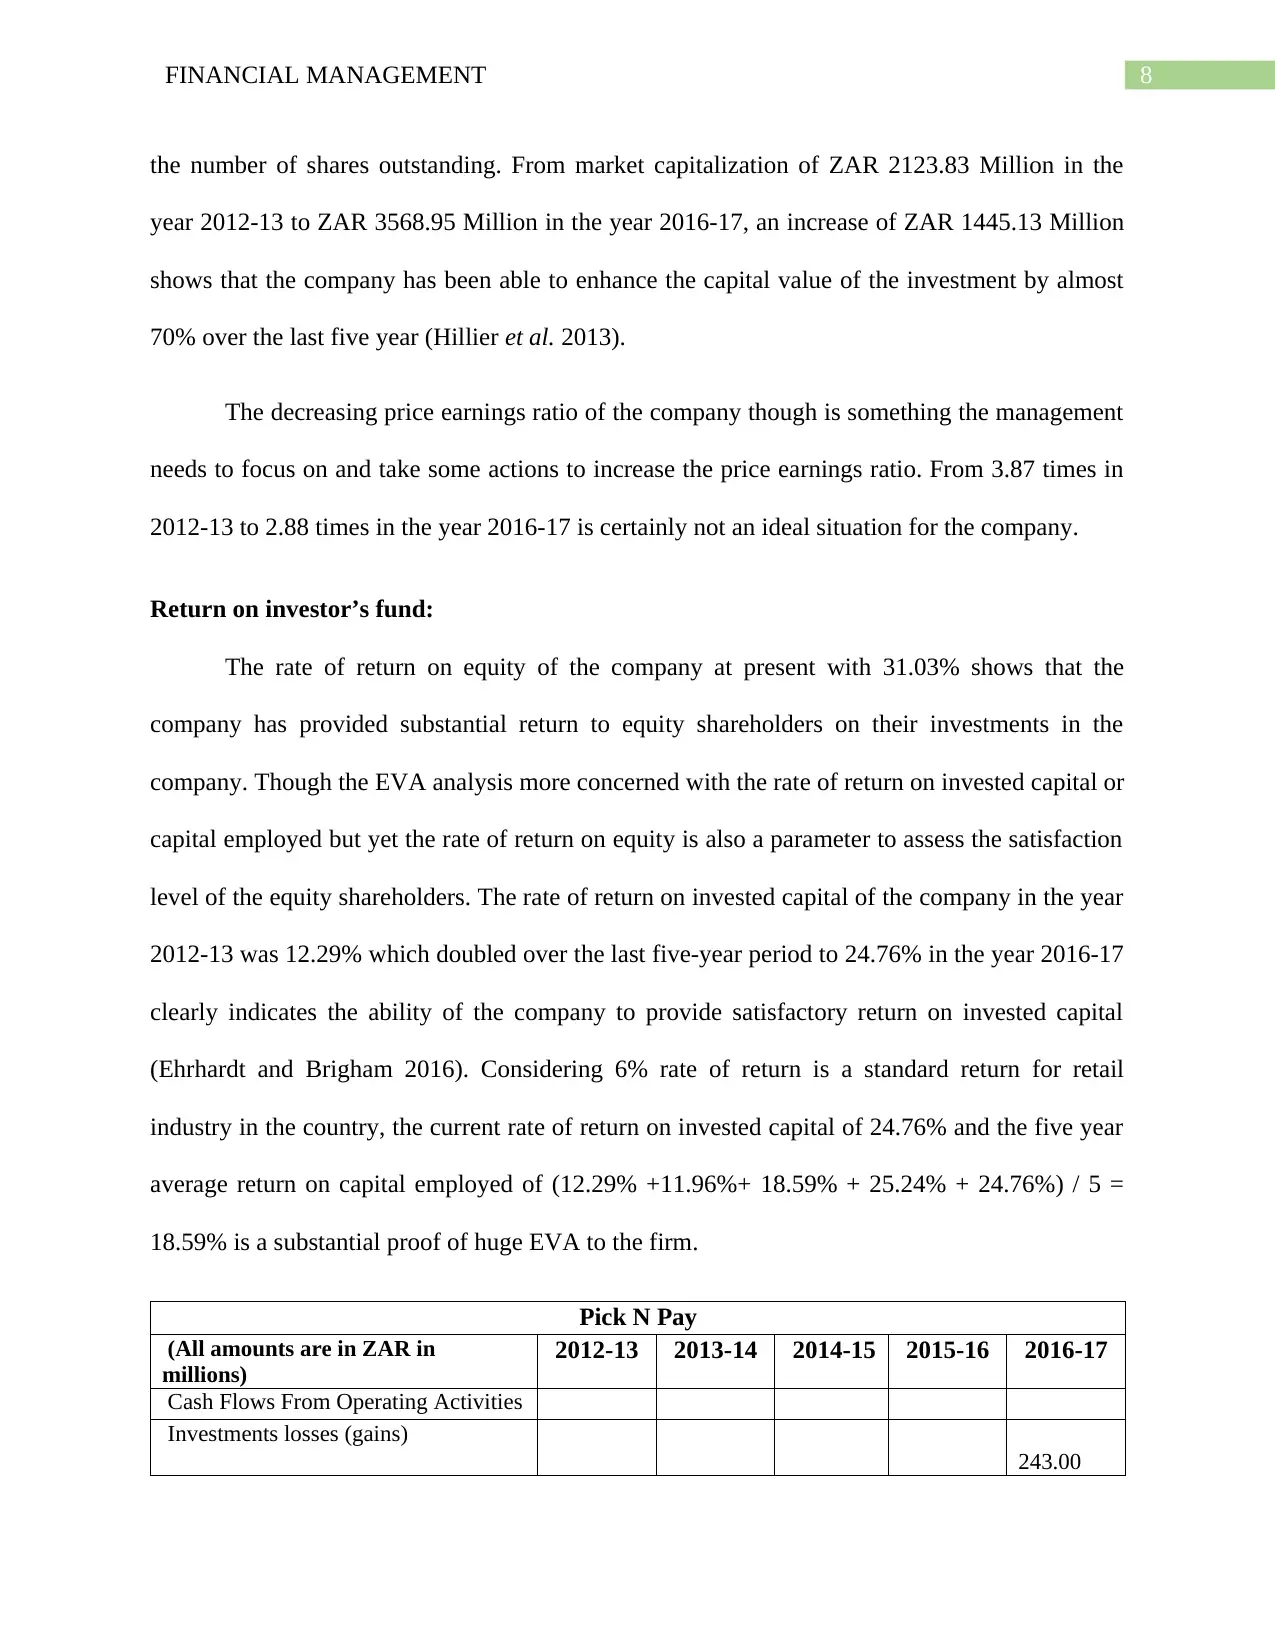
Return on investor’s fund:
The rate of return on equity of the company at present with 31.03% shows that the
company has provided substantial return to equity shareholders on their investments in the
company. Though the EVA analysis more concerned with the rate of return on invested capital or
capital employed but yet the rate of return on equity is also a parameter to assess the satisfaction
level of the equity shareholders. The rate of return on invested capital of the company in the year
2012-13 was 12.29% which doubled over the last five-year period to 24.76% in the year 2016-17
clearly indicates the ability of the company to provide satisfactory return on invested capital
(Ehrhardt and Brigham 2016). Considering 6% rate of return is a standard return for retail
industry in the country, the current rate of return on invested capital of 24.76% and the five year
average return on capital employed of (12.29% +11.96%+ 18.59% + 25.24% + 24.76%) / 5 =
18.59% is a substantial proof of huge EVA to the firm.
Pick N Pay
(All amounts are in ZAR in
millions)
2012-13 2013-14 2014-15 2015-16 2016-17
Cash Flows From Operating Activities
Investments losses (gains)
243.00
the number of shares outstanding. From market capitalization of ZAR 2123.83 Million in the
year 2012-13 to ZAR 3568.95 Million in the year 2016-17, an increase of ZAR 1445.13 Million
shows that the company has been able to enhance the capital value of the investment by almost
70% over the last five year (Hillier et al. 2013).
The decreasing price earnings ratio of the company though is something the management
needs to focus on and take some actions to increase the price earnings ratio. From 3.87 times in
2012-13 to 2.88 times in the year 2016-17 is certainly not an ideal situation for the company.
Return on investor’s fund:
The rate of return on equity of the company at present with 31.03% shows that the
company has provided substantial return to equity shareholders on their investments in the
company. Though the EVA analysis more concerned with the rate of return on invested capital or
capital employed but yet the rate of return on equity is also a parameter to assess the satisfaction
level of the equity shareholders. The rate of return on invested capital of the company in the year
2012-13 was 12.29% which doubled over the last five-year period to 24.76% in the year 2016-17
clearly indicates the ability of the company to provide satisfactory return on invested capital
(Ehrhardt and Brigham 2016). Considering 6% rate of return is a standard return for retail
industry in the country, the current rate of return on invested capital of 24.76% and the five year
average return on capital employed of (12.29% +11.96%+ 18.59% + 25.24% + 24.76%) / 5 =
18.59% is a substantial proof of huge EVA to the firm.
Pick N Pay
(All amounts are in ZAR in
millions)
2012-13 2013-14 2014-15 2015-16 2016-17
Cash Flows From Operating Activities
Investments losses (gains)
243.00
9FINANCIAL MANAGEMENT
Stock based compensation
91.00 72.00 140.00 190.00 413.00
Inventory
(626.00) 32.00 (673.00) (492.00) (839.00)
Other working capital
(386.00) 752.00 825.00 1,221.00 (147.00)
Other non-cash items
839.00 1,270.00 1,378.00 1,565.00 1,160.00
Net Cash Flow from Operating
activities (82.00) 2,126.00 1,670.00 2,484.00 830.00
Cash Flows From Investing Activities
Investments in property, plant, and
equipment (970.00) (882.00) (897.00) (1,623.00) (1,736.00)
Property, plant, and equipment
reductions 232.00 38.00 57.00 40.00 50.00
Acquisitions, net
(118.00) (103.00) (51.00) (88.00) 2.00
Purchases of investments
(16.00) (7.00)
Purchases of intangibles
(242.00) (289.00) (159.00) (86.00) (134.00)
Sales of intangibles
11.00 5.00
Other investing charges
(18.00) 6.00 54.00 13.00 23.00
Net Cash Flow from Investing
Activities (1,116.00) (1,219.00) (991.00) (1,760.00) (1,802.00)
Cash Flows From Financing Activities
Long-term debt issued
281.00 400.00 49.00
Long-term debt repayment
(1,101.00
)
(255.00) (445.00)
Common stock issued
3.00 1.00 1.00
-
8.00
Repurchases of treasury stock
(79.00) (47.00) (177.00) (126.00) (347.00)
Other financing activities
(260.00)
Net cash flow from financing
activities (336.00) 235.00 (877.00) (381.00) (735.00)
Effect of exchange rate changes
(8.00) (2.00) 2.00 15.00 (14.00)
Net cash inflow /(outflow)
⊘ This is a preview!⊘
Do you want full access?
Subscribe today to unlock all pages.
Trusted by 1+ million students worldwide
10FINANCIAL MANAGEMENT
(1,542.00) 1,140.00 (196.00) 358.00 (1,721.00)
Add: Cash at beginning of period
1,272.00 (270.00) 870.00 524.00 883.00
Cash at end of period
(270.00) 870.00 674.00 882.00 (838.00)
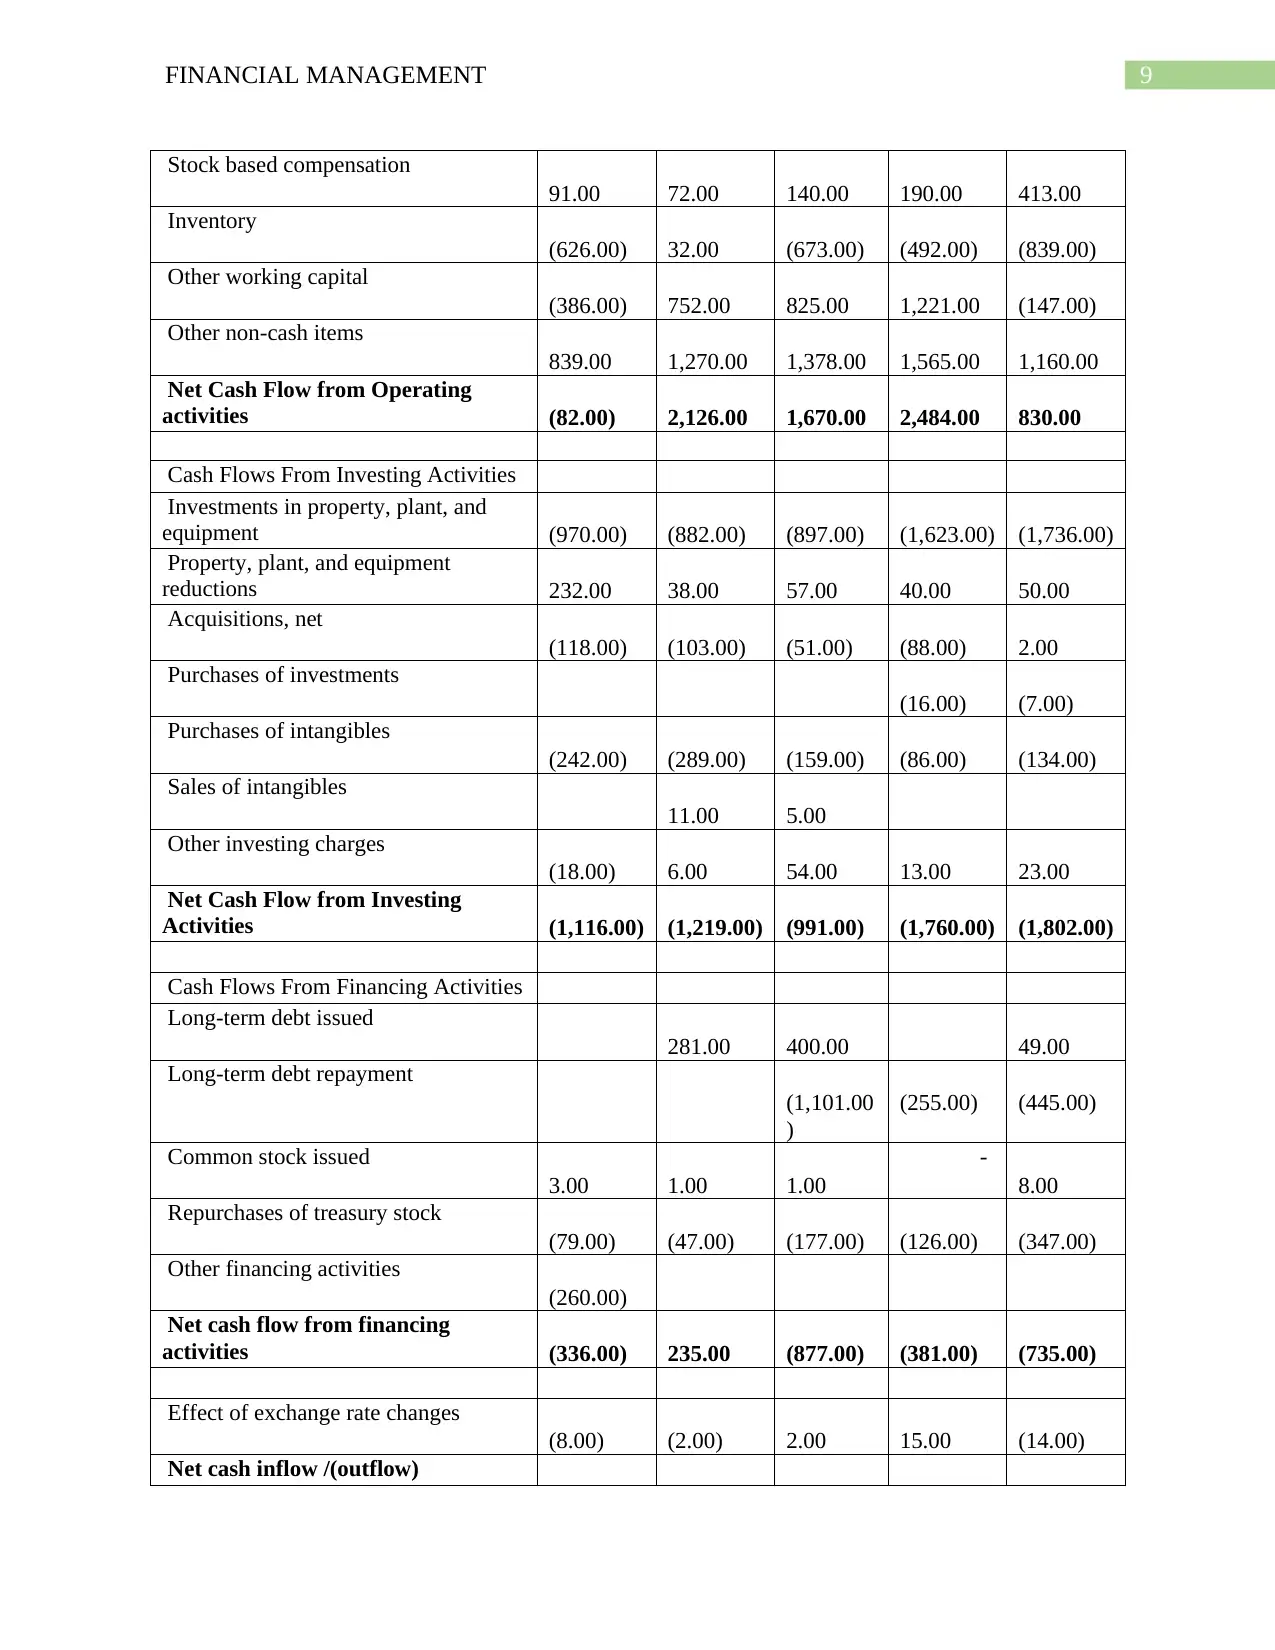
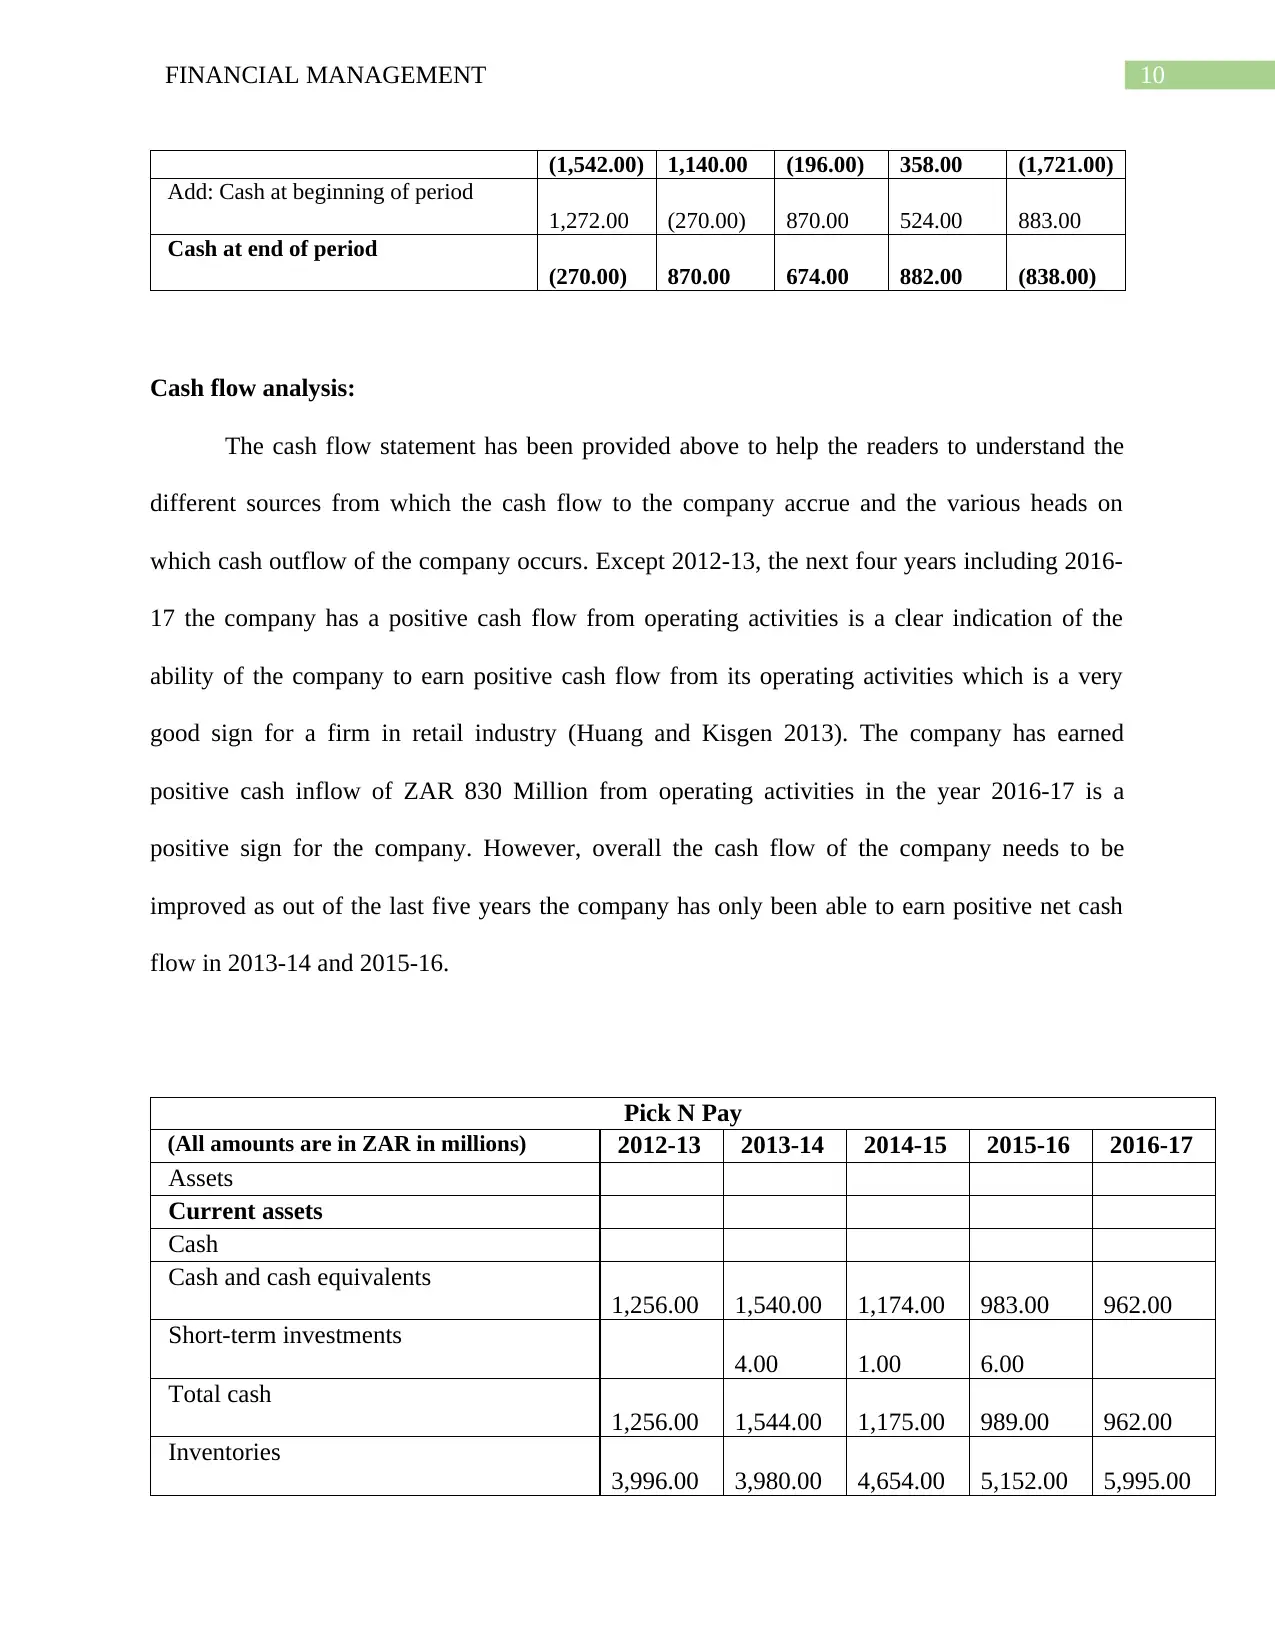
Cash flow analysis:
The cash flow statement has been provided above to help the readers to understand the
different sources from which the cash flow to the company accrue and the various heads on
which cash outflow of the company occurs. Except 2012-13, the next four years including 2016-
17 the company has a positive cash flow from operating activities is a clear indication of the
ability of the company to earn positive cash flow from its operating activities which is a very
good sign for a firm in retail industry (Huang and Kisgen 2013). The company has earned
positive cash inflow of ZAR 830 Million from operating activities in the year 2016-17 is a
positive sign for the company. However, overall the cash flow of the company needs to be
improved as out of the last five years the company has only been able to earn positive net cash
flow in 2013-14 and 2015-16.
Pick N Pay
(All amounts are in ZAR in millions) 2012-13 2013-14 2014-15 2015-16 2016-17
Assets
Current assets
Cash
Cash and cash equivalents
1,256.00 1,540.00 1,174.00 983.00 962.00
Short-term investments
4.00 1.00 6.00
Total cash
1,256.00 1,544.00 1,175.00 989.00 962.00
Inventories
3,996.00 3,980.00 4,654.00 5,152.00 5,995.00
(1,542.00) 1,140.00 (196.00) 358.00 (1,721.00)
Add: Cash at beginning of period
1,272.00 (270.00) 870.00 524.00 883.00
Cash at end of period
(270.00) 870.00 674.00 882.00 (838.00)
Cash flow analysis:
The cash flow statement has been provided above to help the readers to understand the
different sources from which the cash flow to the company accrue and the various heads on
which cash outflow of the company occurs. Except 2012-13, the next four years including 2016-
17 the company has a positive cash flow from operating activities is a clear indication of the
ability of the company to earn positive cash flow from its operating activities which is a very
good sign for a firm in retail industry (Huang and Kisgen 2013). The company has earned
positive cash inflow of ZAR 830 Million from operating activities in the year 2016-17 is a
positive sign for the company. However, overall the cash flow of the company needs to be
improved as out of the last five years the company has only been able to earn positive net cash
flow in 2013-14 and 2015-16.
Pick N Pay
(All amounts are in ZAR in millions) 2012-13 2013-14 2014-15 2015-16 2016-17
Assets
Current assets
Cash
Cash and cash equivalents
1,256.00 1,540.00 1,174.00 983.00 962.00
Short-term investments
4.00 1.00 6.00
Total cash
1,256.00 1,544.00 1,175.00 989.00 962.00
Inventories
3,996.00 3,980.00 4,654.00 5,152.00 5,995.00
Paraphrase This Document
Need a fresh take? Get an instant paraphrase of this document with our AI Paraphraser
11FINANCIAL MANAGEMENT
Other current assets
2,361.00 2,841.00 2,957.00 3,326.00 3,445.00
Total current assets
7,613.00 8,365.00 8,786.00 9,467.00 10,402.00
Non-current assets
Property, plant and equipment, net
3,918.00 4,039.00 4,187.00 4,951.00 5,584.00
Intangible assets
948.00 988.00 1,010.00 1,005.00 984.00
Deferred income taxes
174.00 212.00 199.00 225.00 218.00
Prepaid pension costs
2.00
Other long-term assets
366.00 501.00 524.00 937.00 915.00
Total non-current assets
5,408.00 5,740.00 5,920.00 7,118.00 7,701.00
Total assets
13,021.00 14,105.00 14,706.00 16,585.00 18,103.00
Liabilities and stockholders' equity
Liabilities
Current liabilities
Short-term debt
1,933.00 670.00 792.00 100.00 1,800.00
Capital leases
24.00 738.00 447.00 49.00
Taxes payable
83.00 111.00 127.00 183.00 175.00
Other current liabilities
6,868.00 8,093.00 9,027.00 10,625.00 10,502.00
Total current liabilities
8,908.00 9,612.00 9,946.00 11,355.00 12,526.00
Non-current liabilities
Long-term debt
700.00 493.00
Capital leases
997.00 747.00 83.00 84.00
Deferred taxes liabilities
10.00 14.00
Other long-term liabilities
1,043.00 1,138.00 1,240.00 1,399.00
Total non-current liabilities
1,697.00 1,790.00 1,631.00 1,333.00 1,497.00
Total liabilities
10,605.00 11,402.00 11,576.00 12,687.00 14,023.00
12FINANCIAL MANAGEMENT
Stockholders' equity
Retained earnings
2,562.00 2,850.00 3,311.00 3,883.00 4,652.00
Treasury stock
(139.00) (146.00) (169.00) (64.00) (554.00)
Accumulated other comprehensive
income (7.00) (1.00) (12.00) 79.00 (18.00)
Total stockholders' equity
2,416.00 2,703.00 3,130.00 3,898.00 4,080.00
Total liabilities and stockholders'
equity 13,021.00 14,105.00 14,706.00 16,585.00 18,103.00
Net Asset Value
2,416.00 2,703.00 3,129.00 3,897.00 4,080.00
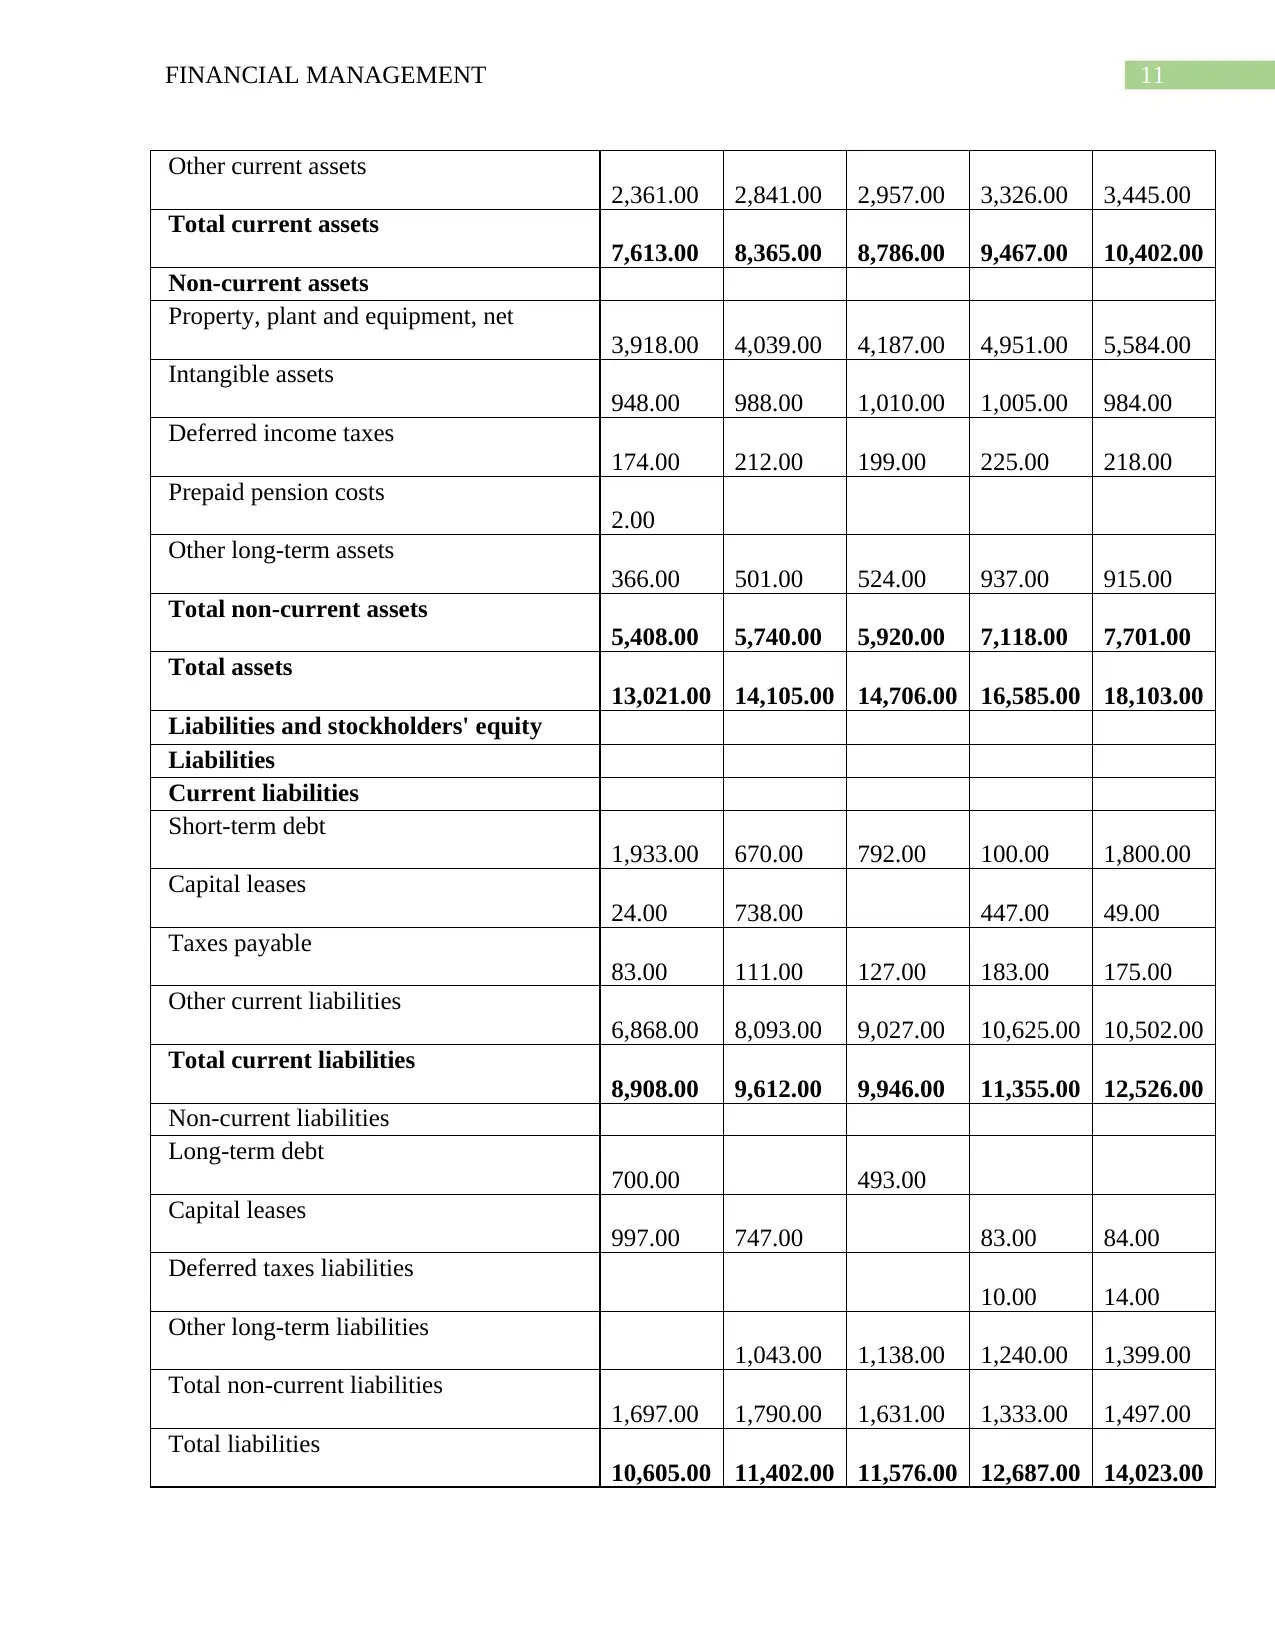
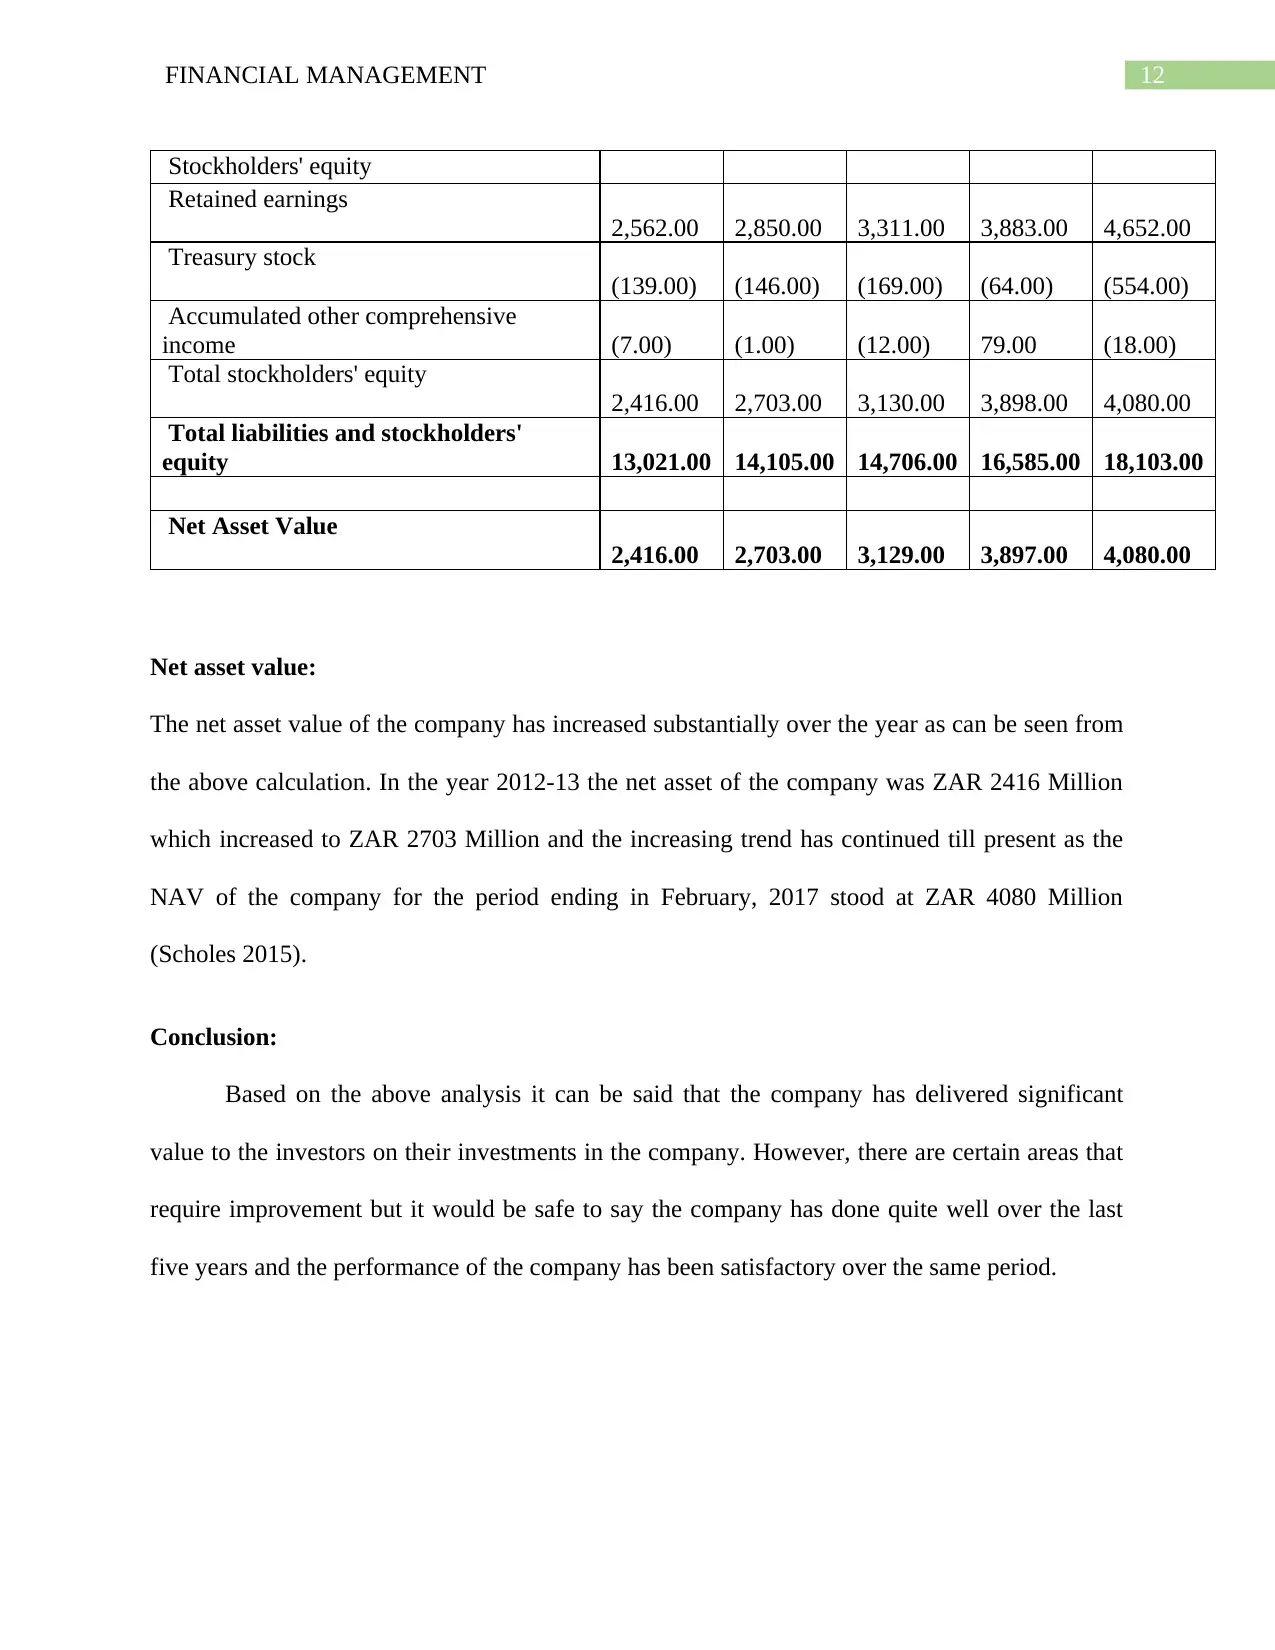
Net asset value:
The net asset value of the company has increased substantially over the year as can be seen from
the above calculation. In the year 2012-13 the net asset of the company was ZAR 2416 Million
which increased to ZAR 2703 Million and the increasing trend has continued till present as the
NAV of the company for the period ending in February, 2017 stood at ZAR 4080 Million
(Scholes 2015).
Conclusion:
Based on the above analysis it can be said that the company has delivered significant
value to the investors on their investments in the company. However, there are certain areas that
require improvement but it would be safe to say the company has done quite well over the last
five years and the performance of the company has been satisfactory over the same period.
Stockholders' equity
Retained earnings
2,562.00 2,850.00 3,311.00 3,883.00 4,652.00
Treasury stock
(139.00) (146.00) (169.00) (64.00) (554.00)
Accumulated other comprehensive
income (7.00) (1.00) (12.00) 79.00 (18.00)
Total stockholders' equity
2,416.00 2,703.00 3,130.00 3,898.00 4,080.00
Total liabilities and stockholders'
equity 13,021.00 14,105.00 14,706.00 16,585.00 18,103.00
Net Asset Value
2,416.00 2,703.00 3,129.00 3,897.00 4,080.00
Net asset value:
The net asset value of the company has increased substantially over the year as can be seen from
the above calculation. In the year 2012-13 the net asset of the company was ZAR 2416 Million
which increased to ZAR 2703 Million and the increasing trend has continued till present as the
NAV of the company for the period ending in February, 2017 stood at ZAR 4080 Million
(Scholes 2015).
Conclusion:
Based on the above analysis it can be said that the company has delivered significant
value to the investors on their investments in the company. However, there are certain areas that
require improvement but it would be safe to say the company has done quite well over the last
five years and the performance of the company has been satisfactory over the same period.
⊘ This is a preview!⊘
Do you want full access?
Subscribe today to unlock all pages.
Trusted by 1+ million students worldwide
1 out of 14
Related Documents


Your All-in-One AI-Powered Toolkit for Academic Success.
+13062052269
info@desklib.com
Available 24*7 on WhatsApp / Email
![[object Object]](/_next/static/media/star-bottom.7253800d.svg)
Unlock your academic potential
Copyright © 2020–2026 A2Z Services. All Rights Reserved. Developed and managed by ZUCOL.