BABS4 Financial Management and Analysis Report - Semester 1, 2021

Verified

Added on  2022/12/26

|22
|3818
|99
Report
AI Summary
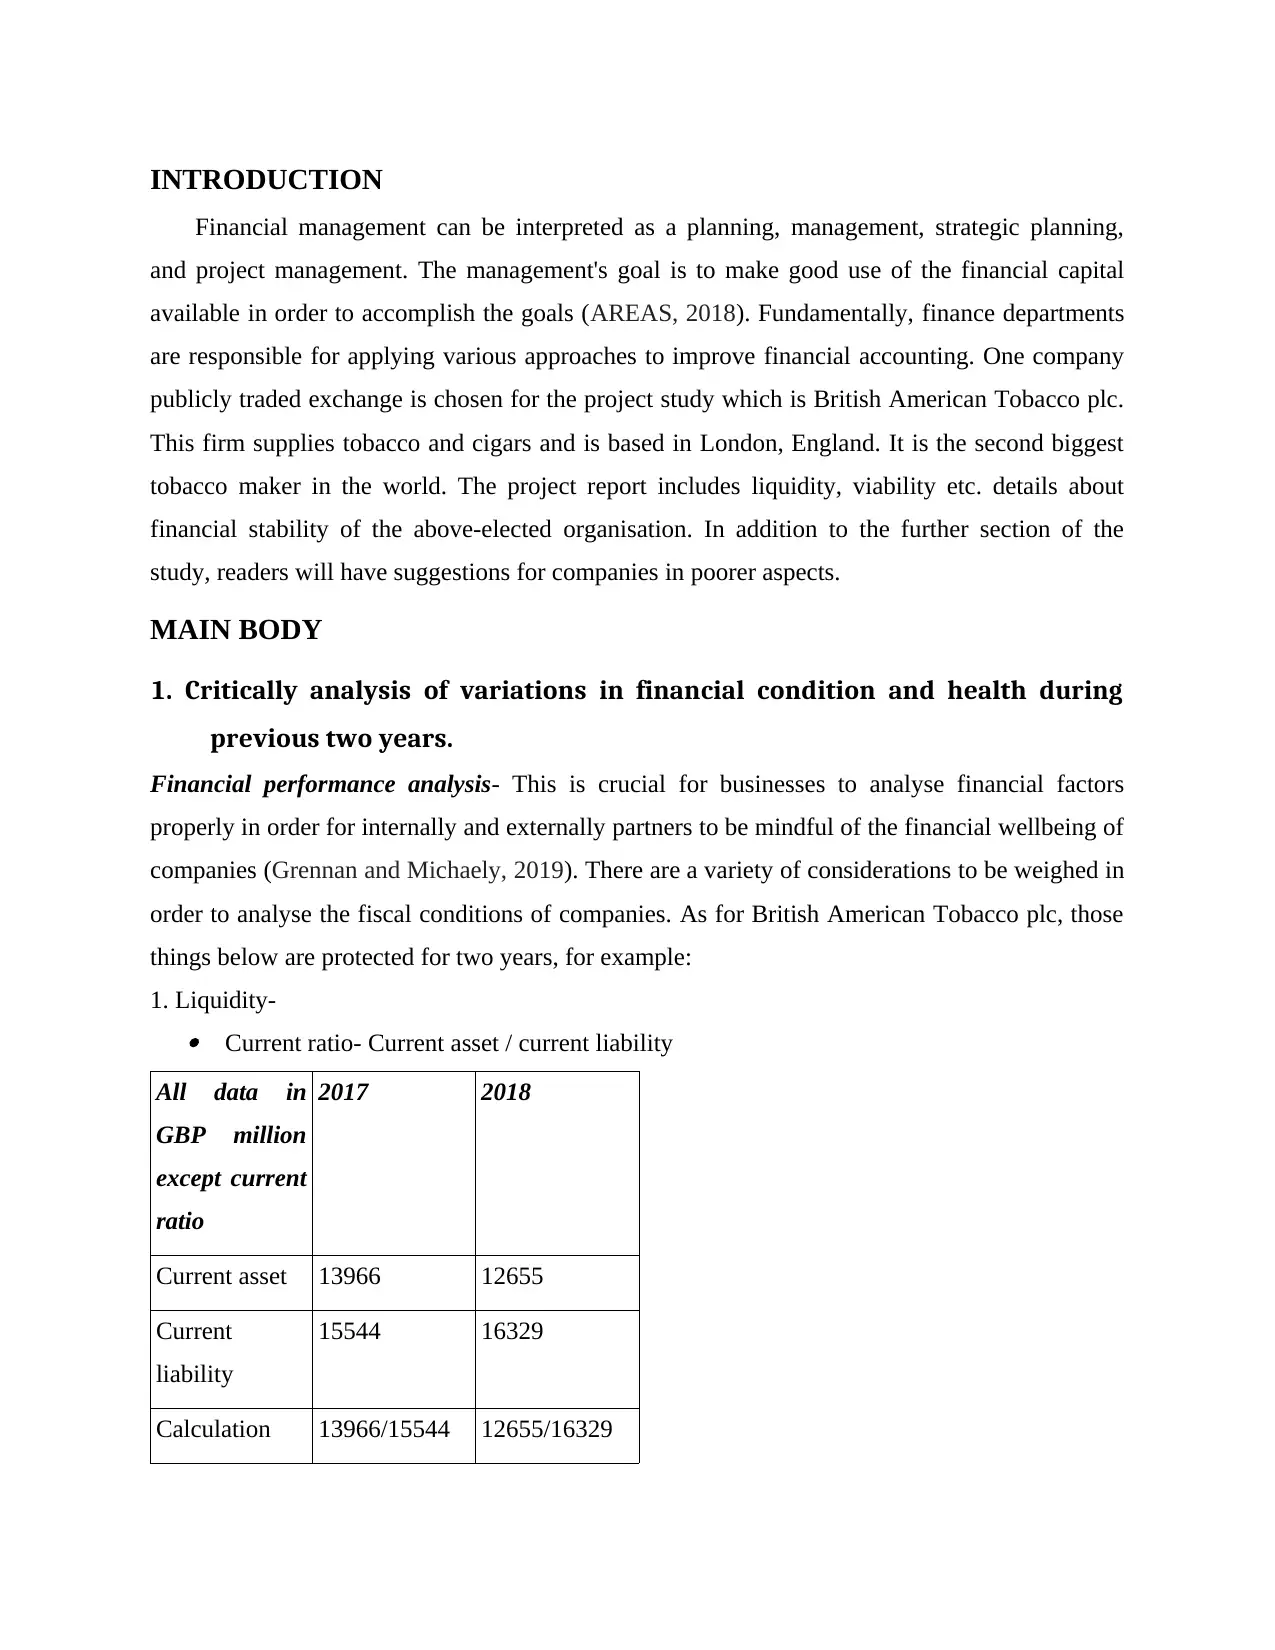
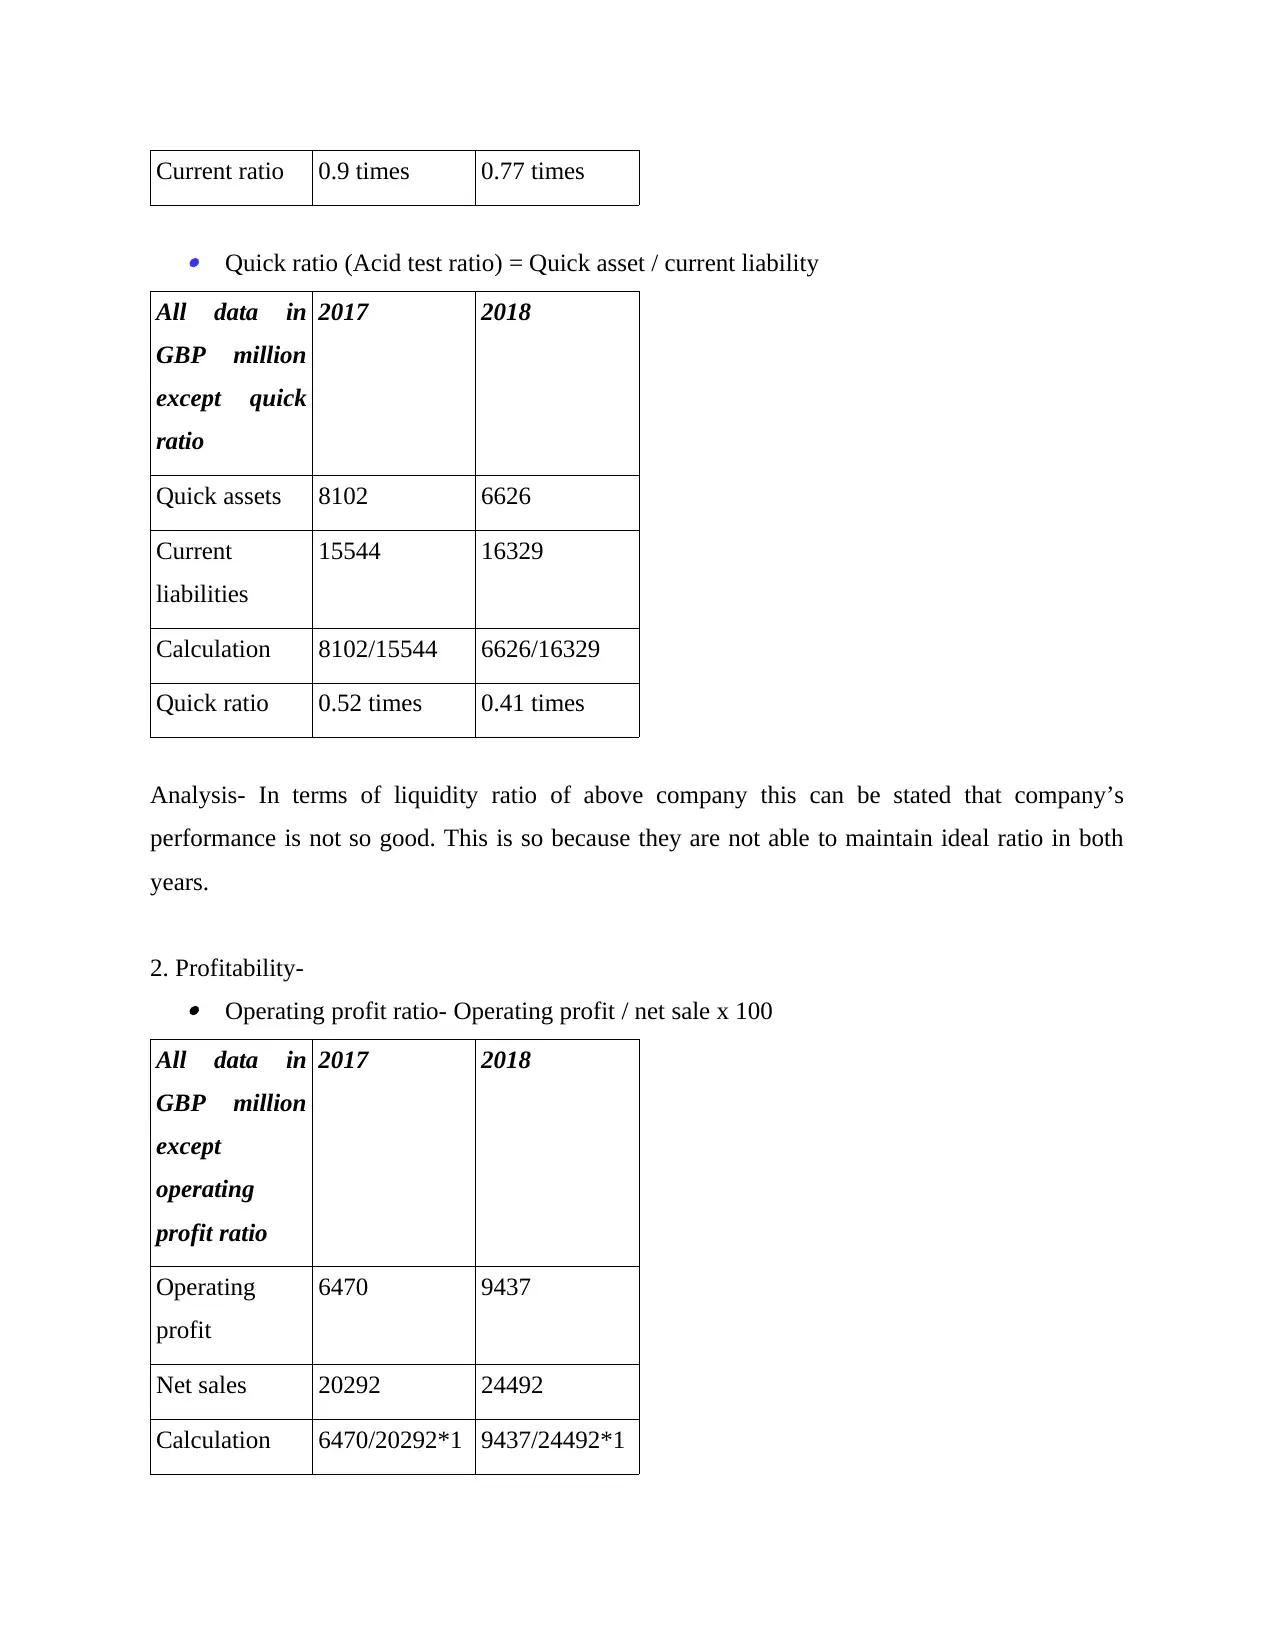
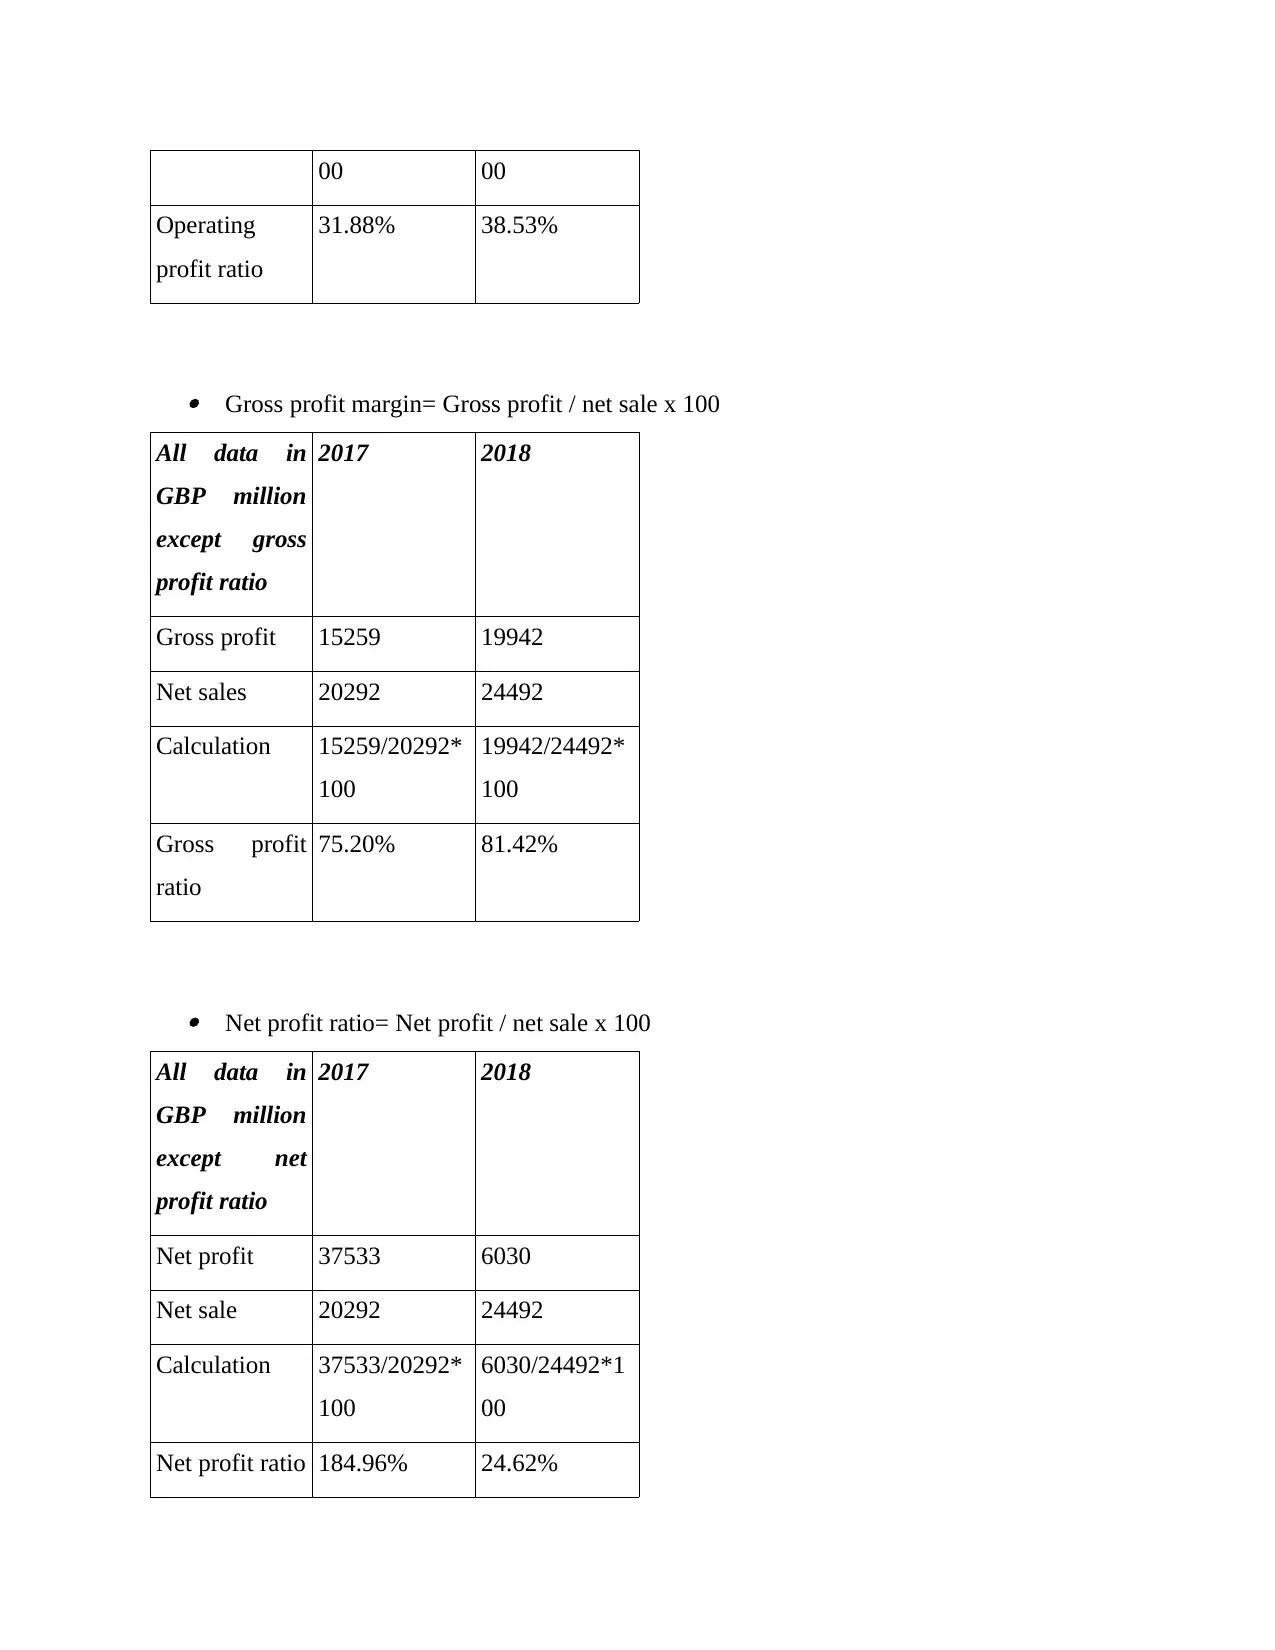
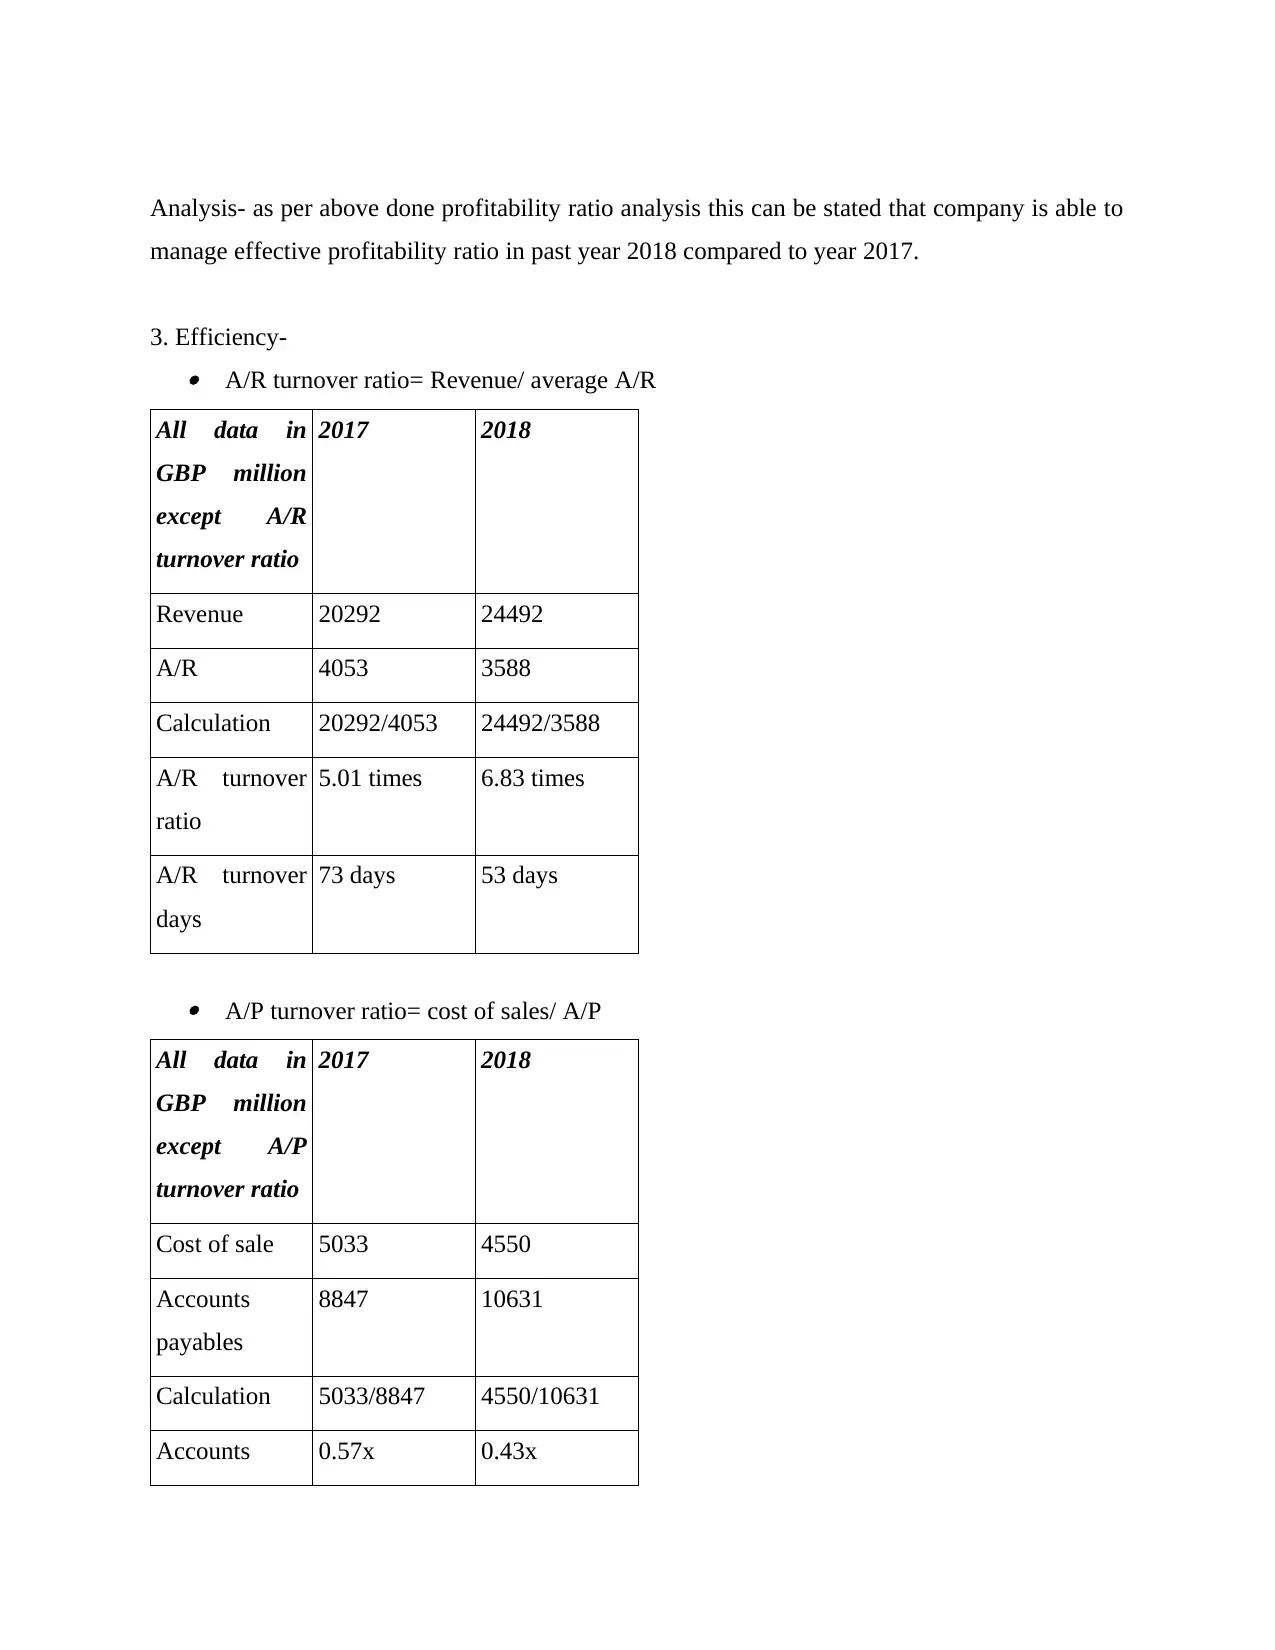
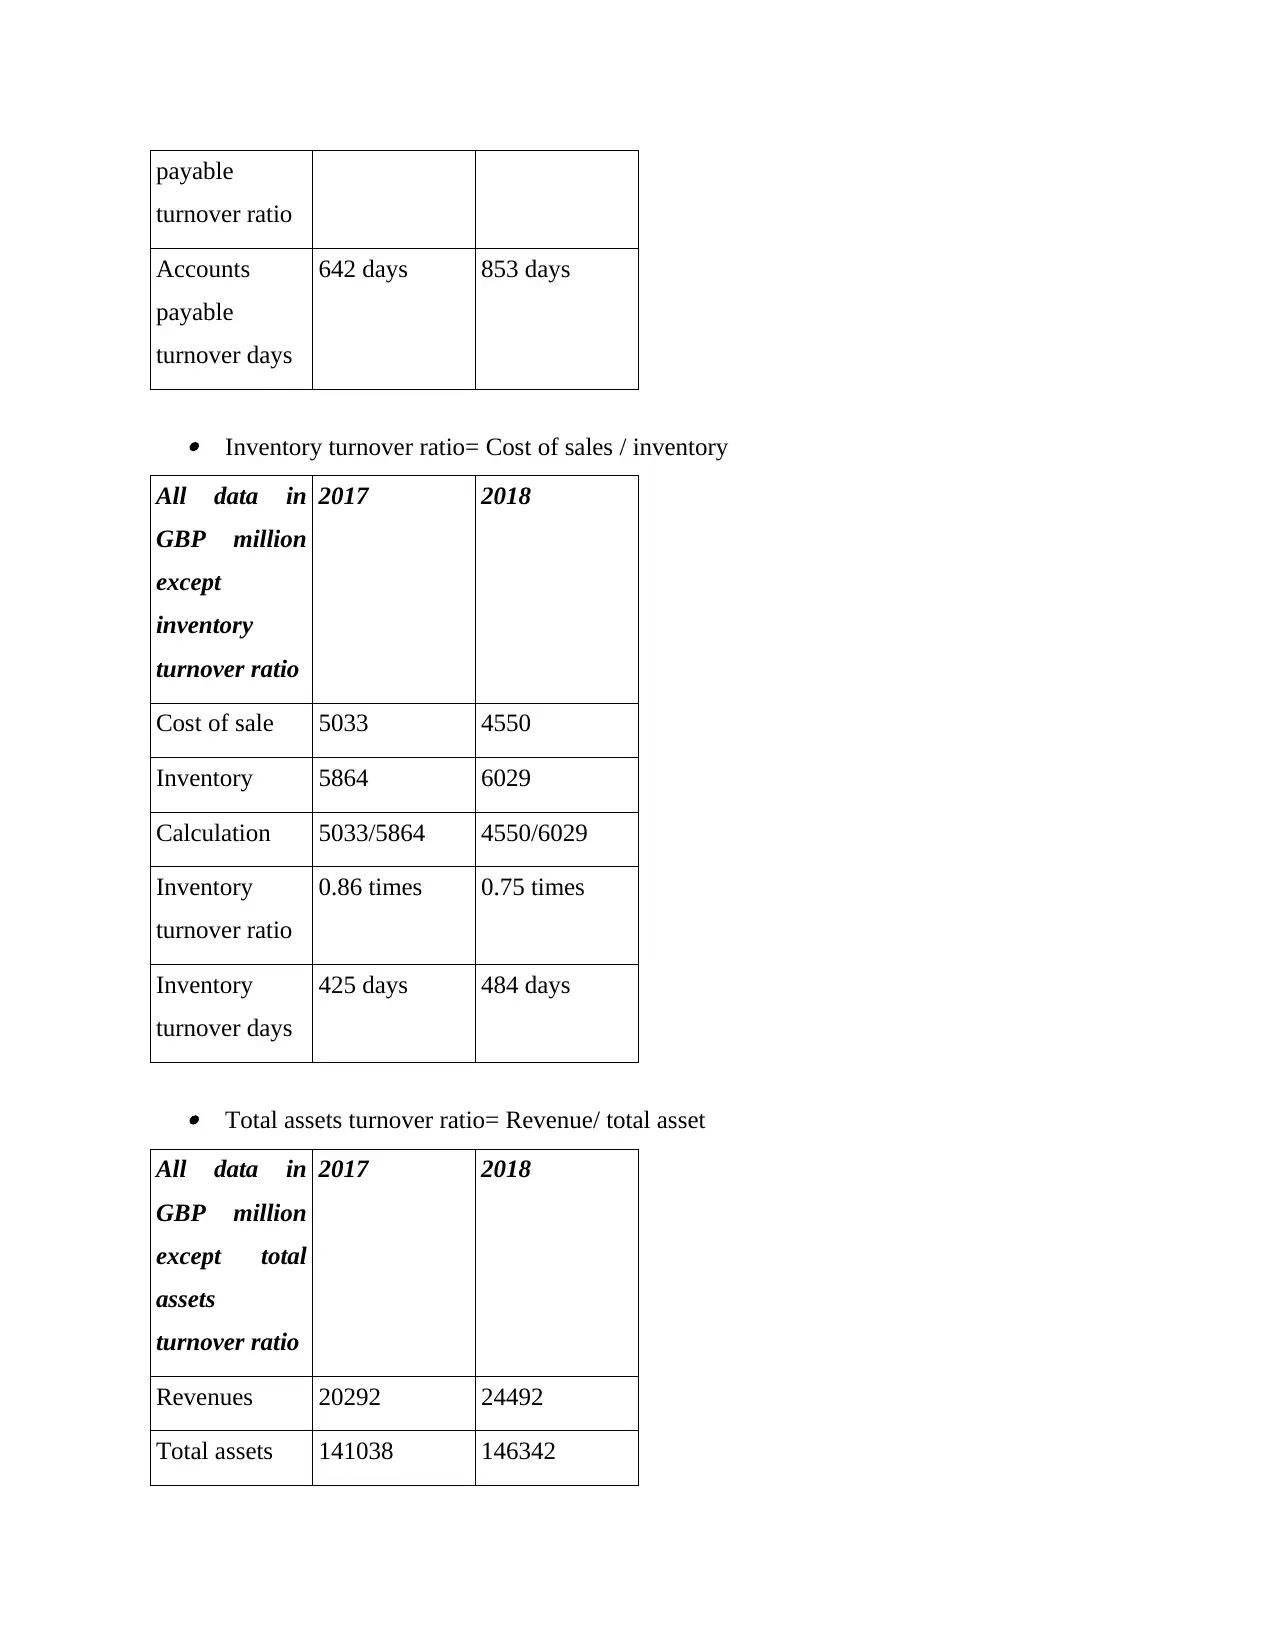
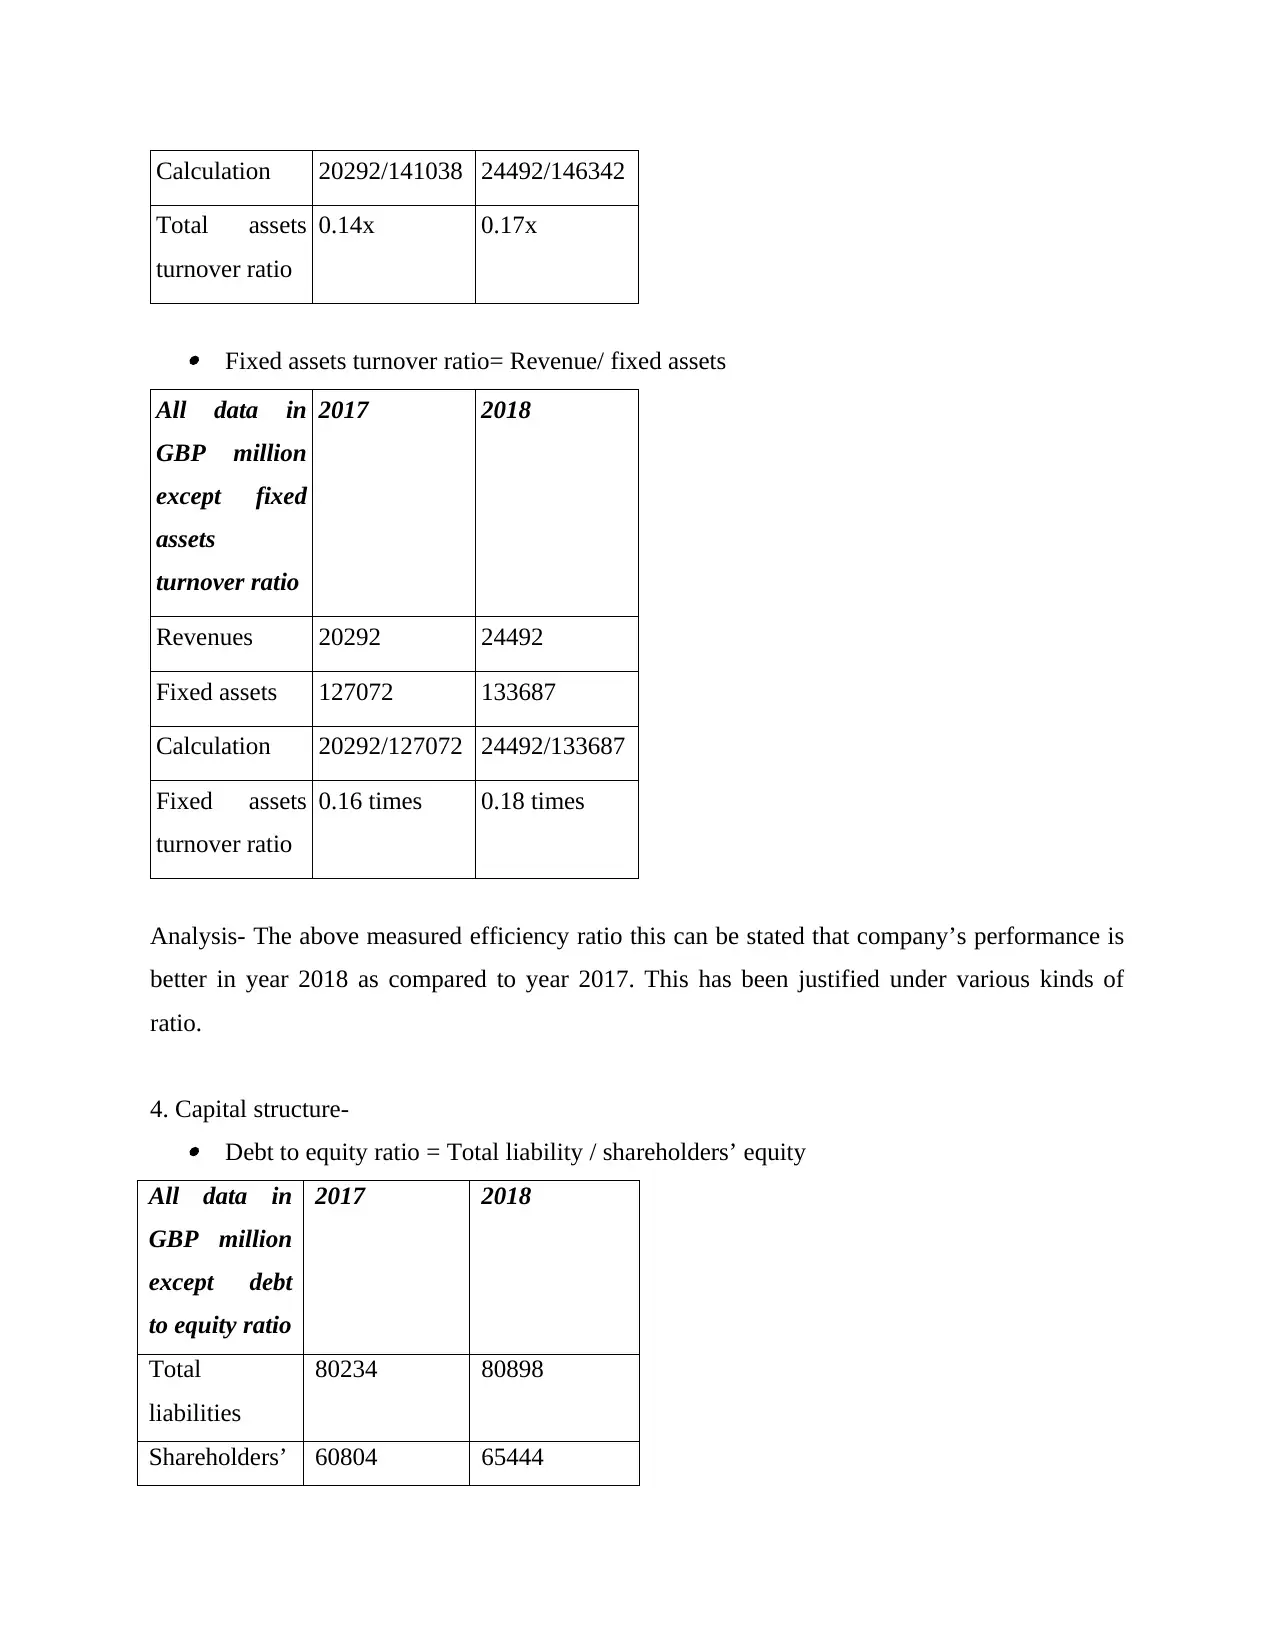
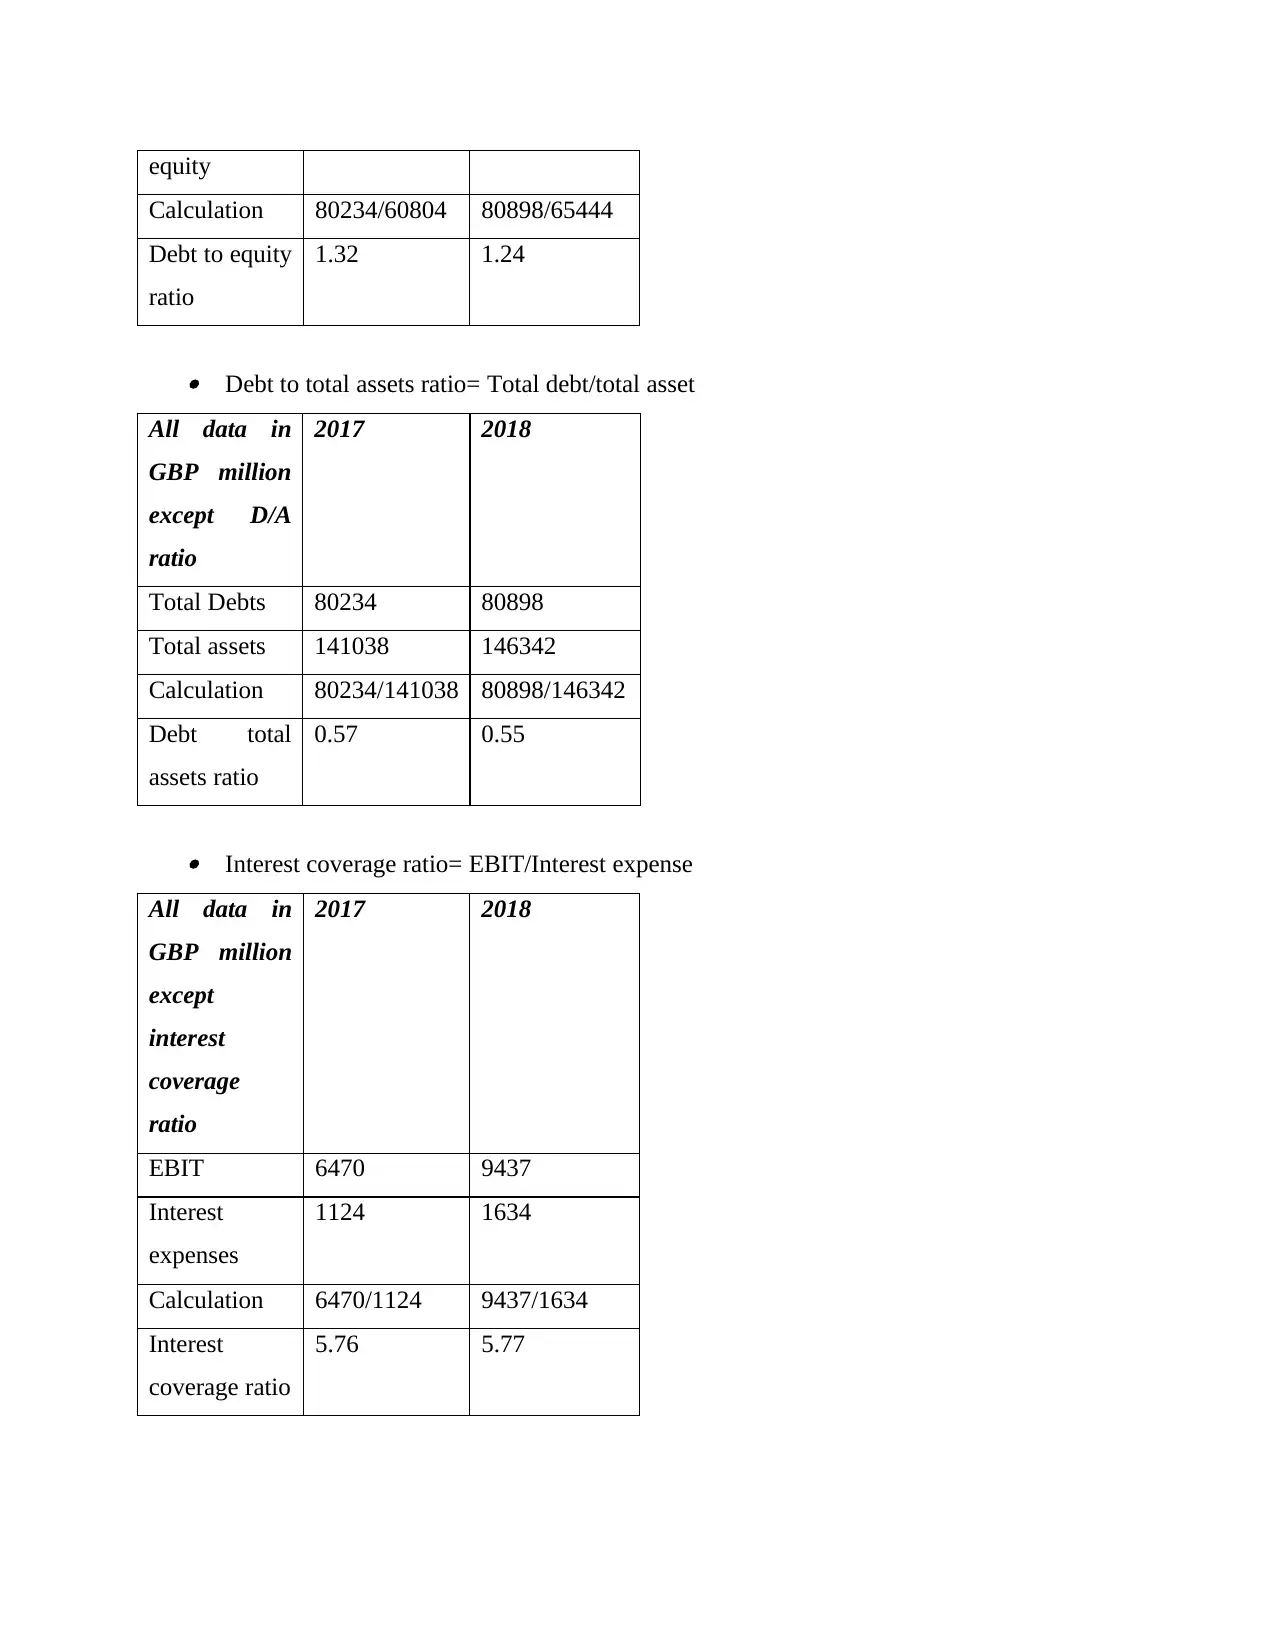
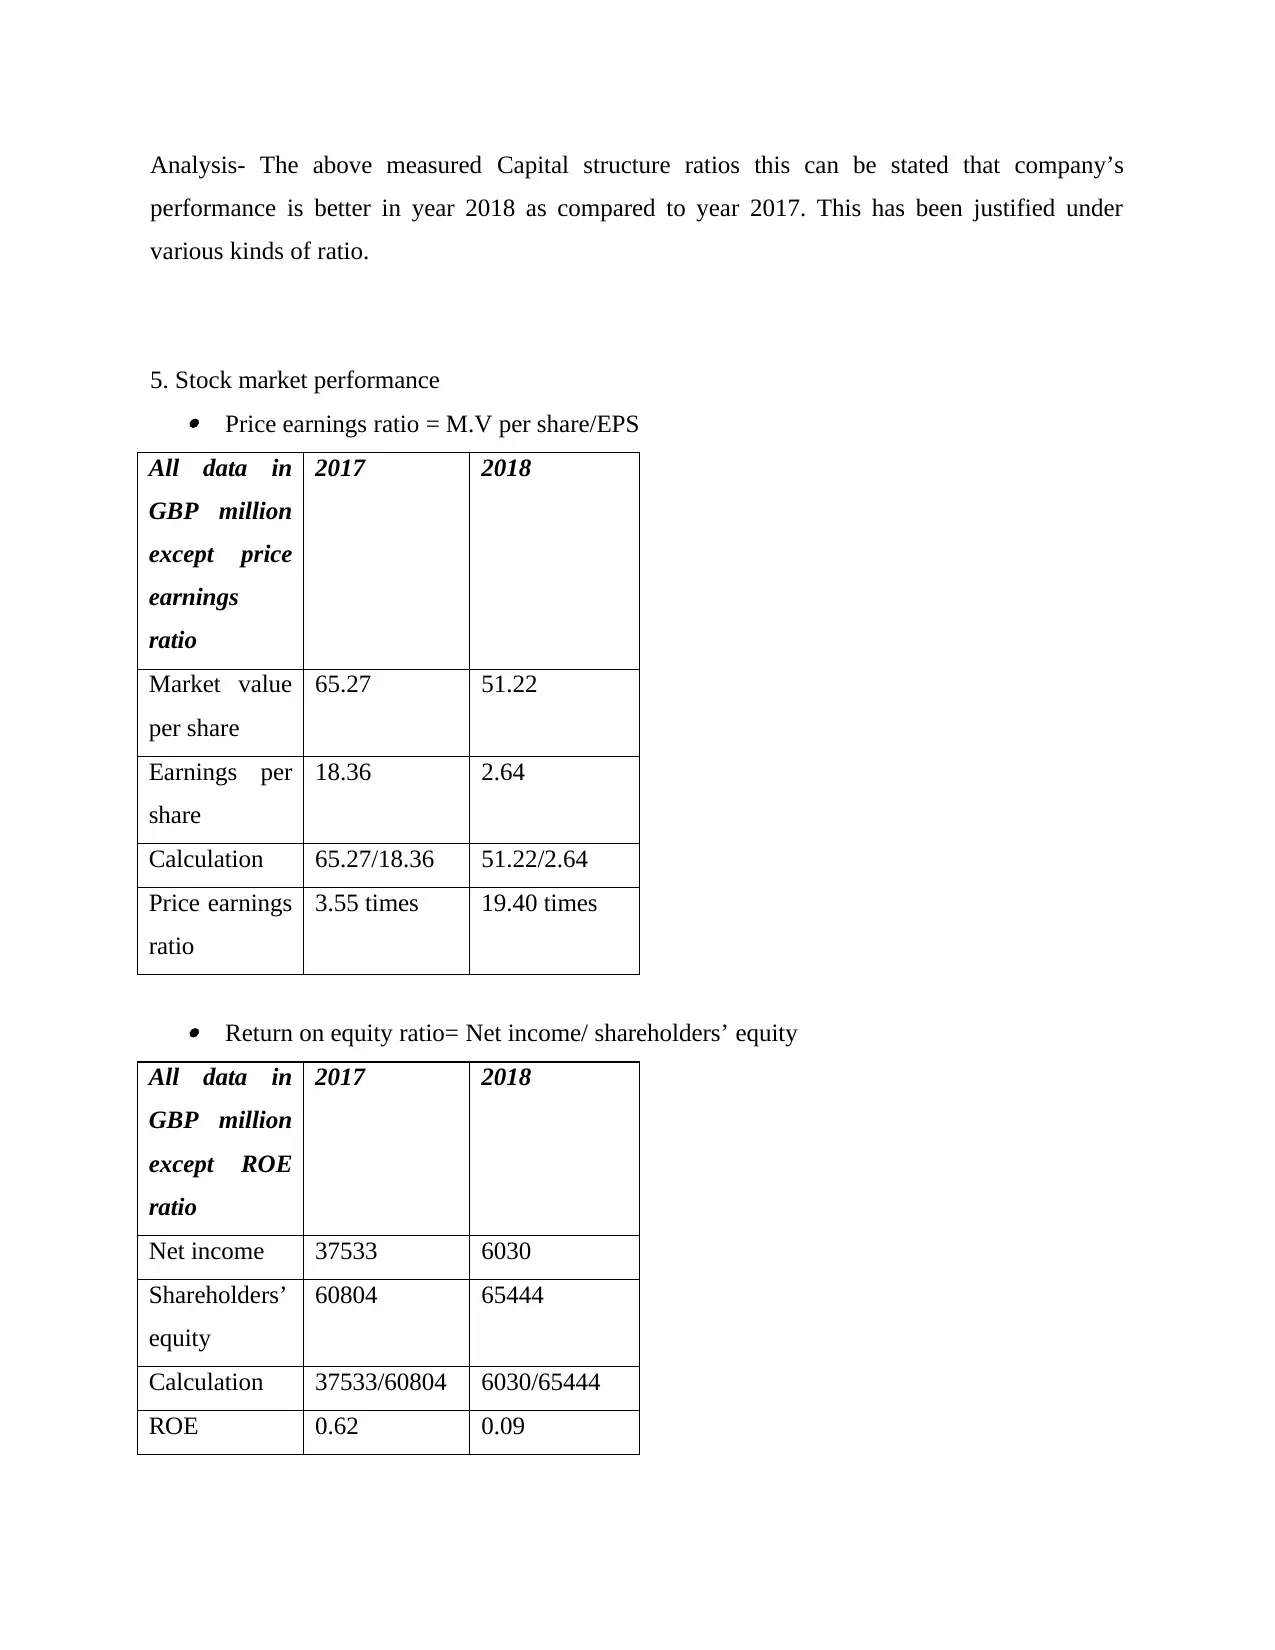
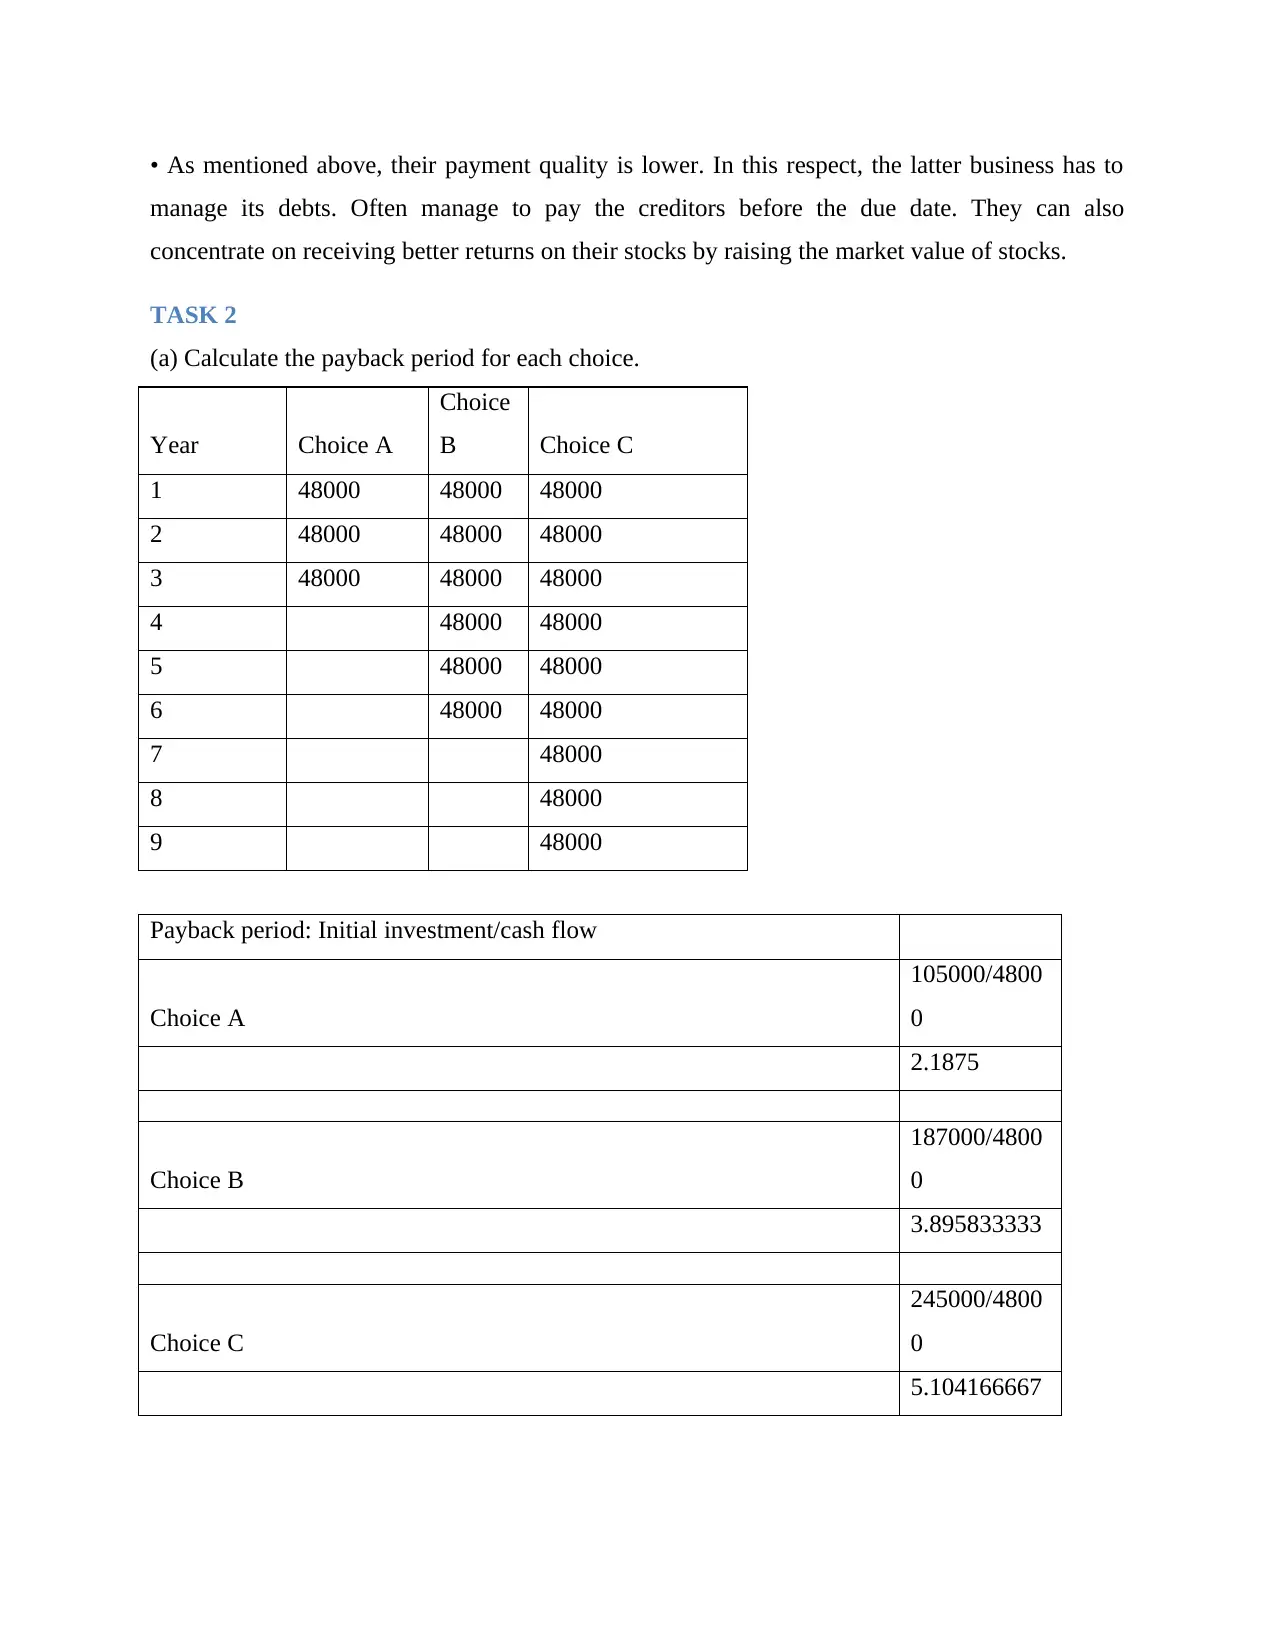
This report provides a detailed financial analysis of British American Tobacco plc, examining its performance over two years using various financial ratios. The analysis covers liquidity, profitability, efficiency, capital structure, and stock market performance. The report identifies problems and limitations within the analysis, offering recommendations for improvements. Furthermore, it includes investment appraisal calculations such as payback period, Net Present Value (NPV), and Internal Rate of Return (IRR) for different investment choices. The report also addresses theoretical ex-rights price calculations, the value of rights, and their impact on investor wealth. Finally, it explores company valuation methods, including market capitalization, net asset value, and price/earnings ratio, concluding with an analysis of the average historic dividend growth rate. This comprehensive analysis aims to provide a holistic view of the company's financial health and investment opportunities.
Document Page
FINANCIAL
MANAGEMENT AND
ANALYSIS
tabler-icon-diamond-filled.svg

Paraphrase This Document

Need a fresh take? Get an instant paraphrase of this document with our AI Paraphraser
Document Page
Contents
INTRODUCTION...........................................................................................................................3
MAIN BODY..................................................................................................................................3
1. Critically analysis of variations in financial condition and health during previous two years.
.....................................................................................................................................................3
2. Explanation of problem of analysis.......................................................................................11
3. Recommendation to above company in accordance of analysis...........................................11
TASK 2......................................................................................................................................12
Task 3.............................................................................................................................................15
Task 4.............................................................................................................................................16
(a) Difference between systematic and unsystematic risk and factors to monitor sensitivity of
market........................................................................................................................................18
(b) Difference between capital and money market, interest bearing instruments and document
instrument?................................................................................................................................19
(c) Difference between risk and uncertainty..............................................................................20
(d) Explain with reasons whether a bank overdraft is suitable to finance the purchase of this
property......................................................................................................................................21
CONCLUSION..............................................................................................................................21
REFERENCES..............................................................................................................................22
Document Page
INTRODUCTION
Financial management can be interpreted as a planning, management, strategic planning,
and project management. The management's goal is to make good use of the financial capital
available in order to accomplish the goals (AREAS, 2018). Fundamentally, finance departments
are responsible for applying various approaches to improve financial accounting. One company
publicly traded exchange is chosen for the project study which is British American Tobacco plc.
This firm supplies tobacco and cigars and is based in London, England. It is the second biggest
tobacco maker in the world. The project report includes liquidity, viability etc. details about
financial stability of the above-elected organisation. In addition to the further section of the
study, readers will have suggestions for companies in poorer aspects.
MAIN BODY
1. Critically analysis of variations in financial condition and health during
previous two years.
Financial performance analysis- This is crucial for businesses to analyse financial factors
properly in order for internally and externally partners to be mindful of the financial wellbeing of
companies (Grennan and Michaely, 2019). There are a variety of considerations to be weighed in
order to analyse the fiscal conditions of companies. As for British American Tobacco plc, those
things below are protected for two years, for example:
1. Liquidity- Current ratio- Current asset / current liability
All data in
GBP million
except current
ratio
2017 2018
Current asset 13966 12655
Current
liability
15544 16329
Calculation 13966/15544 12655/16329
Document Page
Current ratio 0.9 times 0.77 times
Quick ratio (Acid test ratio) = Quick asset / current liability
All data in
GBP million
except quick
ratio
2017 2018
Quick assets 8102 6626
Current
liabilities
15544 16329
Calculation 8102/15544 6626/16329
Quick ratio 0.52 times 0.41 times
Analysis- In terms of liquidity ratio of above company this can be stated that company’s
performance is not so good. This is so because they are not able to maintain ideal ratio in both
years.
2. Profitability- Operating profit ratio- Operating profit / net sale x 100
All data in
GBP million
except
operating
profit ratio
2017 2018
Operating
profit
6470 9437
Net sales 20292 24492
Calculation 6470/20292*1 9437/24492*1
tabler-icon-diamond-filled.svg

Paraphrase This Document

Need a fresh take? Get an instant paraphrase of this document with our AI Paraphraser
Document Page
00 00
Operating
profit ratio
31.88% 38.53%
Gross profit margin= Gross profit / net sale x 100
All data in
GBP million
except gross
profit ratio
2017 2018
Gross profit 15259 19942
Net sales 20292 24492
Calculation 15259/20292*
100
19942/24492*
100
Gross profit
ratio
75.20% 81.42%
Net profit ratio= Net profit / net sale x 100
All data in
GBP million
except net
profit ratio
2017 2018
Net profit 37533 6030
Net sale 20292 24492
Calculation 37533/20292*
100
6030/24492*1
00
Net profit ratio 184.96% 24.62%
Document Page
Analysis- as per above done profitability ratio analysis this can be stated that company is able to
manage effective profitability ratio in past year 2018 compared to year 2017.
3. Efficiency- A/R turnover ratio= Revenue/ average A/R
All data in
GBP million
except A/R
turnover ratio
2017 2018
Revenue 20292 24492
A/R 4053 3588
Calculation 20292/4053 24492/3588
A/R turnover
ratio
5.01 times 6.83 times
A/R turnover
days
73 days 53 days
A/P turnover ratio= cost of sales/ A/P
All data in
GBP million
except A/P
turnover ratio
2017 2018
Cost of sale 5033 4550
Accounts
payables
8847 10631
Calculation 5033/8847 4550/10631
Accounts 0.57x 0.43x
Document Page
payable
turnover ratio
Accounts
payable
turnover days
642 days 853 days
Inventory turnover ratio= Cost of sales / inventory
All data in
GBP million
except
inventory
turnover ratio
2017 2018
Cost of sale 5033 4550
Inventory 5864 6029
Calculation 5033/5864 4550/6029
Inventory
turnover ratio
0.86 times 0.75 times
Inventory
turnover days
425 days 484 days
Total assets turnover ratio= Revenue/ total asset
All data in
GBP million
except total
assets
turnover ratio
2017 2018
Revenues 20292 24492
Total assets 141038 146342
tabler-icon-diamond-filled.svg

Paraphrase This Document

Need a fresh take? Get an instant paraphrase of this document with our AI Paraphraser
Document Page
Calculation 20292/141038 24492/146342
Total assets
turnover ratio
0.14x 0.17x
Fixed assets turnover ratio= Revenue/ fixed assets
All data in
GBP million
except fixed
assets
turnover ratio
2017 2018
Revenues 20292 24492
Fixed assets 127072 133687
Calculation 20292/127072 24492/133687
Fixed assets
turnover ratio
0.16 times 0.18 times
Analysis- The above measured efficiency ratio this can be stated that company’s performance is
better in year 2018 as compared to year 2017. This has been justified under various kinds of
ratio.
4. Capital structure- Debt to equity ratio = Total liability / shareholders’ equity
All data in
GBP million
except debt
to equity ratio
2017 2018
Total
liabilities
80234 80898
Shareholders’ 60804 65444
Document Page
equity
Calculation 80234/60804 80898/65444
Debt to equity
ratio
1.32 1.24
Debt to total assets ratio= Total debt/total asset
All data in
GBP million
except D/A
ratio
2017 2018
Total Debts 80234 80898
Total assets 141038 146342
Calculation 80234/141038 80898/146342
Debt total
assets ratio
0.57 0.55
Interest coverage ratio= EBIT/Interest expense
All data in
GBP million
except
interest
coverage
ratio
2017 2018
EBIT 6470 9437
Interest
expenses
1124 1634
Calculation 6470/1124 9437/1634
Interest
coverage ratio
5.76 5.77
Document Page
Analysis- The above measured Capital structure ratios this can be stated that company’s
performance is better in year 2018 as compared to year 2017. This has been justified under
various kinds of ratio.
5. Stock market performance Price earnings ratio = M.V per share/EPS
All data in
GBP million
except price
earnings
ratio
2017 2018
Market value
per share
65.27 51.22
Earnings per
share
18.36 2.64
Calculation 65.27/18.36 51.22/2.64
Price earnings
ratio
3.55 times 19.40 times
Return on equity ratio= Net income/ shareholders’ equity
All data in
GBP million
except ROE
ratio
2017 2018
Net income 37533 6030
Shareholders’
equity
60804 65444
Calculation 37533/60804 6030/65444
ROE 0.62 0.09
tabler-icon-diamond-filled.svg

Paraphrase This Document

Need a fresh take? Get an instant paraphrase of this document with our AI Paraphraser
Document Page
Analysis- In terms of stock market performance this can be stated that company is managing in
an effective manner their stock in year 2018 compared to year 2017.
2. Explanation of problem of analysis.
The ratio analysis methodology was used in the previous section of the quantitative report of
British American Tobacco Plc. This is a tool for calculating and interpreting various kinds of
ratios to realise the exact financial situation. Some important ratio analysis problems are listed
below, which are as follows:
• Book value averages – this is one of the main challenges when it comes to depending on ratios.
Based on the book valuation (mainly past costs), financial knowledge is not reflected in the
present state of the business (Yüksel, Dinçer and Meral, 2019).
• No quality control assessment- Detail is contained in the ratios on the financial side.
Knowledge on administrative aspects is not considered. As a result, careful review of an
organisation becomes impossible (Schroeder, Clark and Cathey, 2019).
3. Recommendation to above company in accordance of analysis.
According to the ratio review of British American Tobacco Plc, the financial situation of the firm
presents various problems. Below are among this company's poor sectors:
• In the present year the earnings per share is in a bad position, slipping from a massive margin
in 2018 compared with 2017. • In the present period, the net profit is in an unfailing situation.
• With respect to the productivity level, the company cannot pay its creditors on schedule and
this adversely affects their goodwill. •
• In addition, you will see that in all two years, the firm cannot produce a better yield on its
shares. This would not lead to any further spending from its owners.
Recommendation:
• Company should aim to reduce the current costs and try to boost the current net assets to
maximise liquidity.
• The company should concentrate upon managing its costs in order to maximise its degree of net
profitability.
Document Page
• As mentioned above, their payment quality is lower. In this respect, the latter business has to
manage its debts. Often manage to pay the creditors before the due date. They can also
concentrate on receiving better returns on their stocks by raising the market value of stocks.
TASK 2
(a) Calculate the payback period for each choice.
Year Choice A
Choice
B Choice C
1 48000 48000 48000
2 48000 48000 48000
3 48000 48000 48000
4 48000 48000
5 48000 48000
6 48000 48000
7 48000
8 48000
9 48000
Payback period: Initial investment/cash flow
Choice A
105000/4800
0
2.1875
Choice B
187000/4800
0
3.895833333
Choice C
245000/4800
0
5.104166667
chevron_up_icon
1 out of 22
circle_padding
hide_on_mobile
zoom_out_icon