Financial Management Assignment: Risk, Return, and Ethical Dilemmas
VerifiedAdded on 2020/05/28
|11
|2436
|51
Homework Assignment
AI Summary
This financial management assignment delves into various aspects of financial analysis and decision-making. It begins with a detailed calculation of stock returns and volatility, followed by an in-depth examination of firm liquidity, operating profitability, financing decisions, and return on common equity through ratio analysis. The assignment then explores investment appraisal techniques, comparing projects using payback period, accounting rate of return (ARR), net present value (NPV), and profitability index (PI). Furthermore, it presents a graphical analysis of risk and return relationships, recommending investment strategies based on risk profiles. Finally, the assignment concludes by discussing key axioms of finance, including the risk-return trade-off, time value of money, and ethical dilemmas, providing real-world examples to illustrate these concepts.

Running Head: Financial Management
Financial Management
Financial Management
Paraphrase This Document
Need a fresh take? Get an instant paraphrase of this document with our AI Paraphraser

Financial Management 2
Table of Contents
Question 1.............................................................................................................................................3
Question 2.............................................................................................................................................4
Question 3.............................................................................................................................................6
Question 4.............................................................................................................................................8
Question 5.............................................................................................................................................9
References:..........................................................................................................................................12
Financial Management 3
Question 1
Part A & B
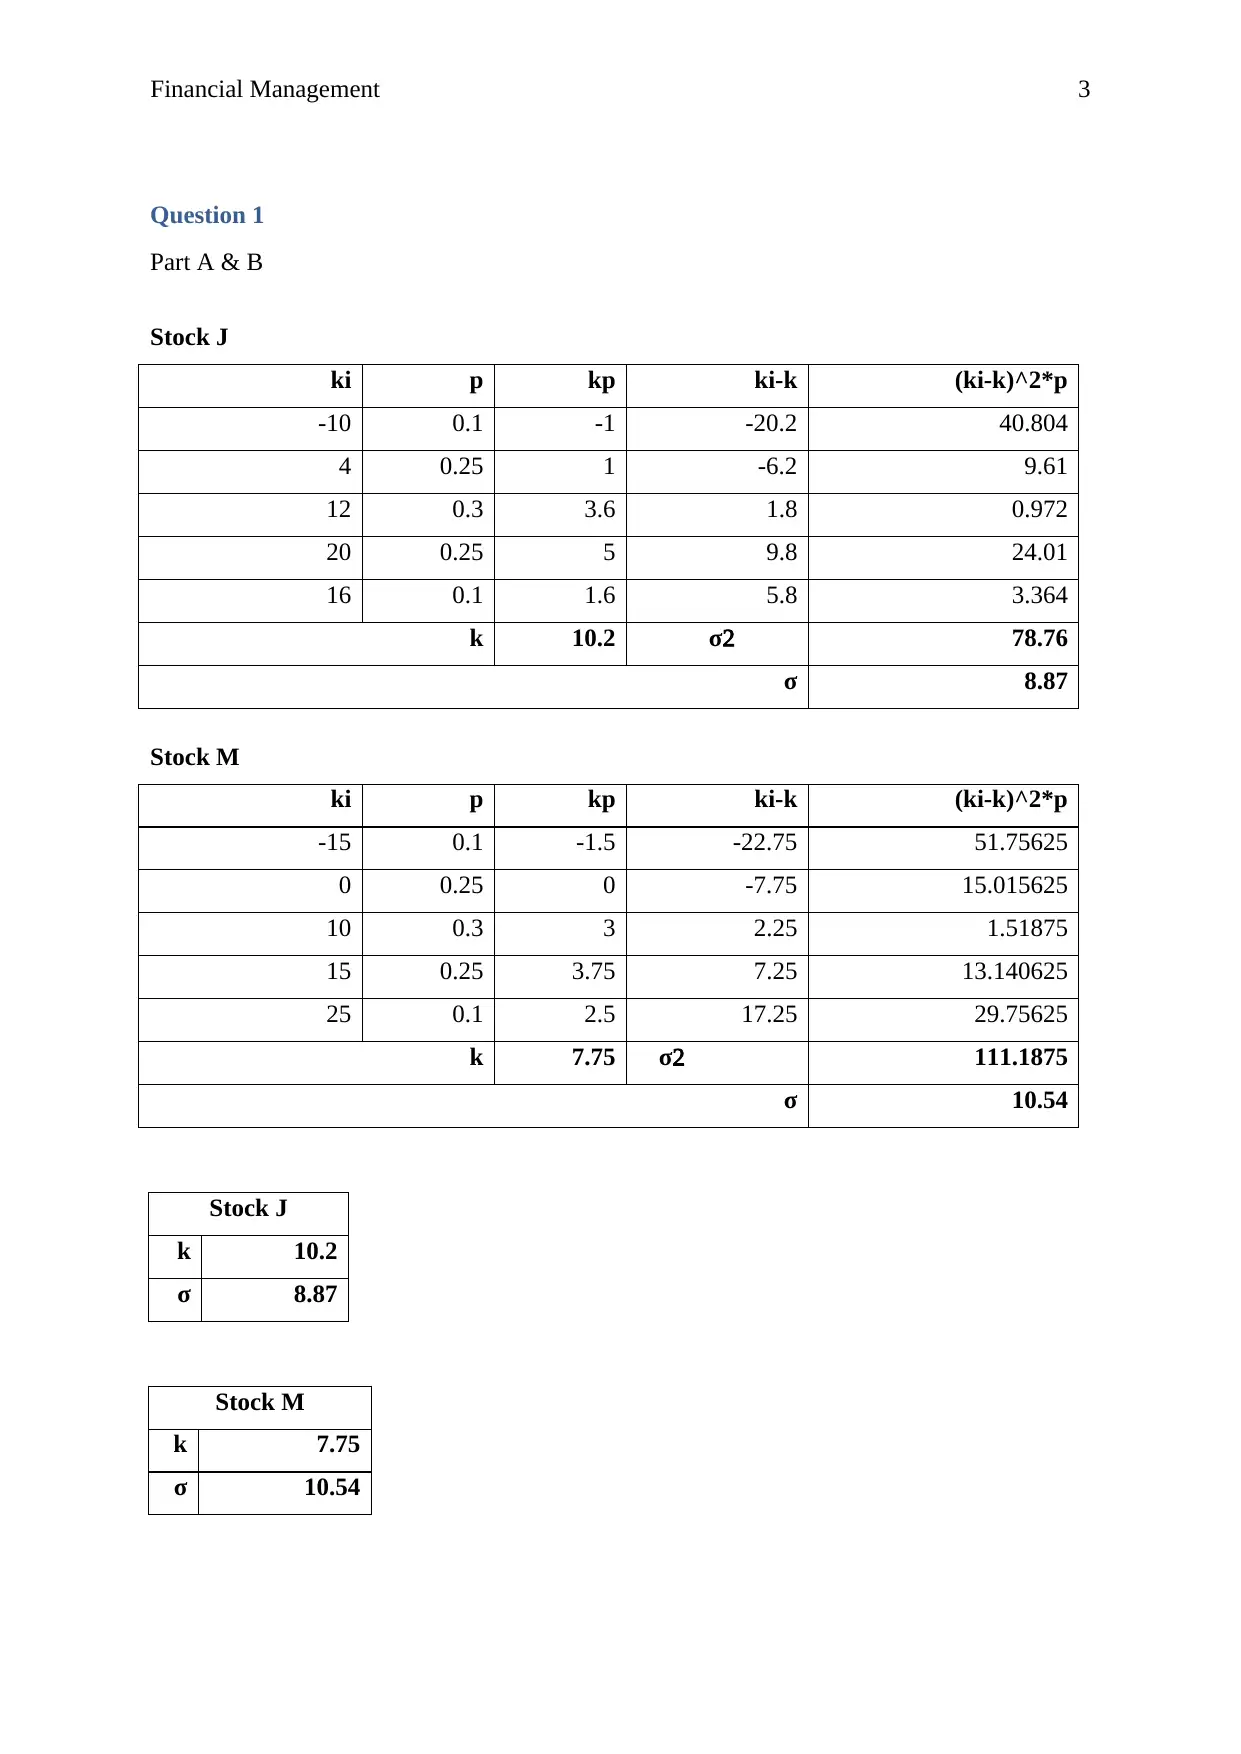
Stock J
ki p kp ki-k (ki-k)^2*p
-10 0.1 -1 -20.2 40.804
4 0.25 1 -6.2 9.61
12 0.3 3.6 1.8 0.972
20 0.25 5 9.8 24.01
16 0.1 1.6 5.8 3.364
k 10.2 σ 78.76
σ 8.87
Stock M
ki p kp ki-k (ki-k)^2*p
-15 0.1 -1.5 -22.75 51.75625
0 0.25 0 -7.75 15.015625
10 0.3 3 2.25 1.51875
15 0.25 3.75 7.25 13.140625
25 0.1 2.5 17.25 29.75625
k 7.75 σ 111.1875
σ 10.54
Stock J
k 10.2
σ 8.87
Stock M
k 7.75
σ 10.54
Question 1
Part A & B
Stock J
ki p kp ki-k (ki-k)^2*p
-10 0.1 -1 -20.2 40.804
4 0.25 1 -6.2 9.61
12 0.3 3.6 1.8 0.972
20 0.25 5 9.8 24.01
16 0.1 1.6 5.8 3.364
k 10.2 σ 78.76
σ 8.87
Stock M
ki p kp ki-k (ki-k)^2*p
-15 0.1 -1.5 -22.75 51.75625
0 0.25 0 -7.75 15.015625
10 0.3 3 2.25 1.51875
15 0.25 3.75 7.25 13.140625
25 0.1 2.5 17.25 29.75625
k 7.75 σ 111.1875
σ 10.54
Stock J
k 10.2
σ 8.87
Stock M
k 7.75
σ 10.54
⊘ This is a preview!⊘
Do you want full access?
Subscribe today to unlock all pages.
Trusted by 1+ million students worldwide
Financial Management 4
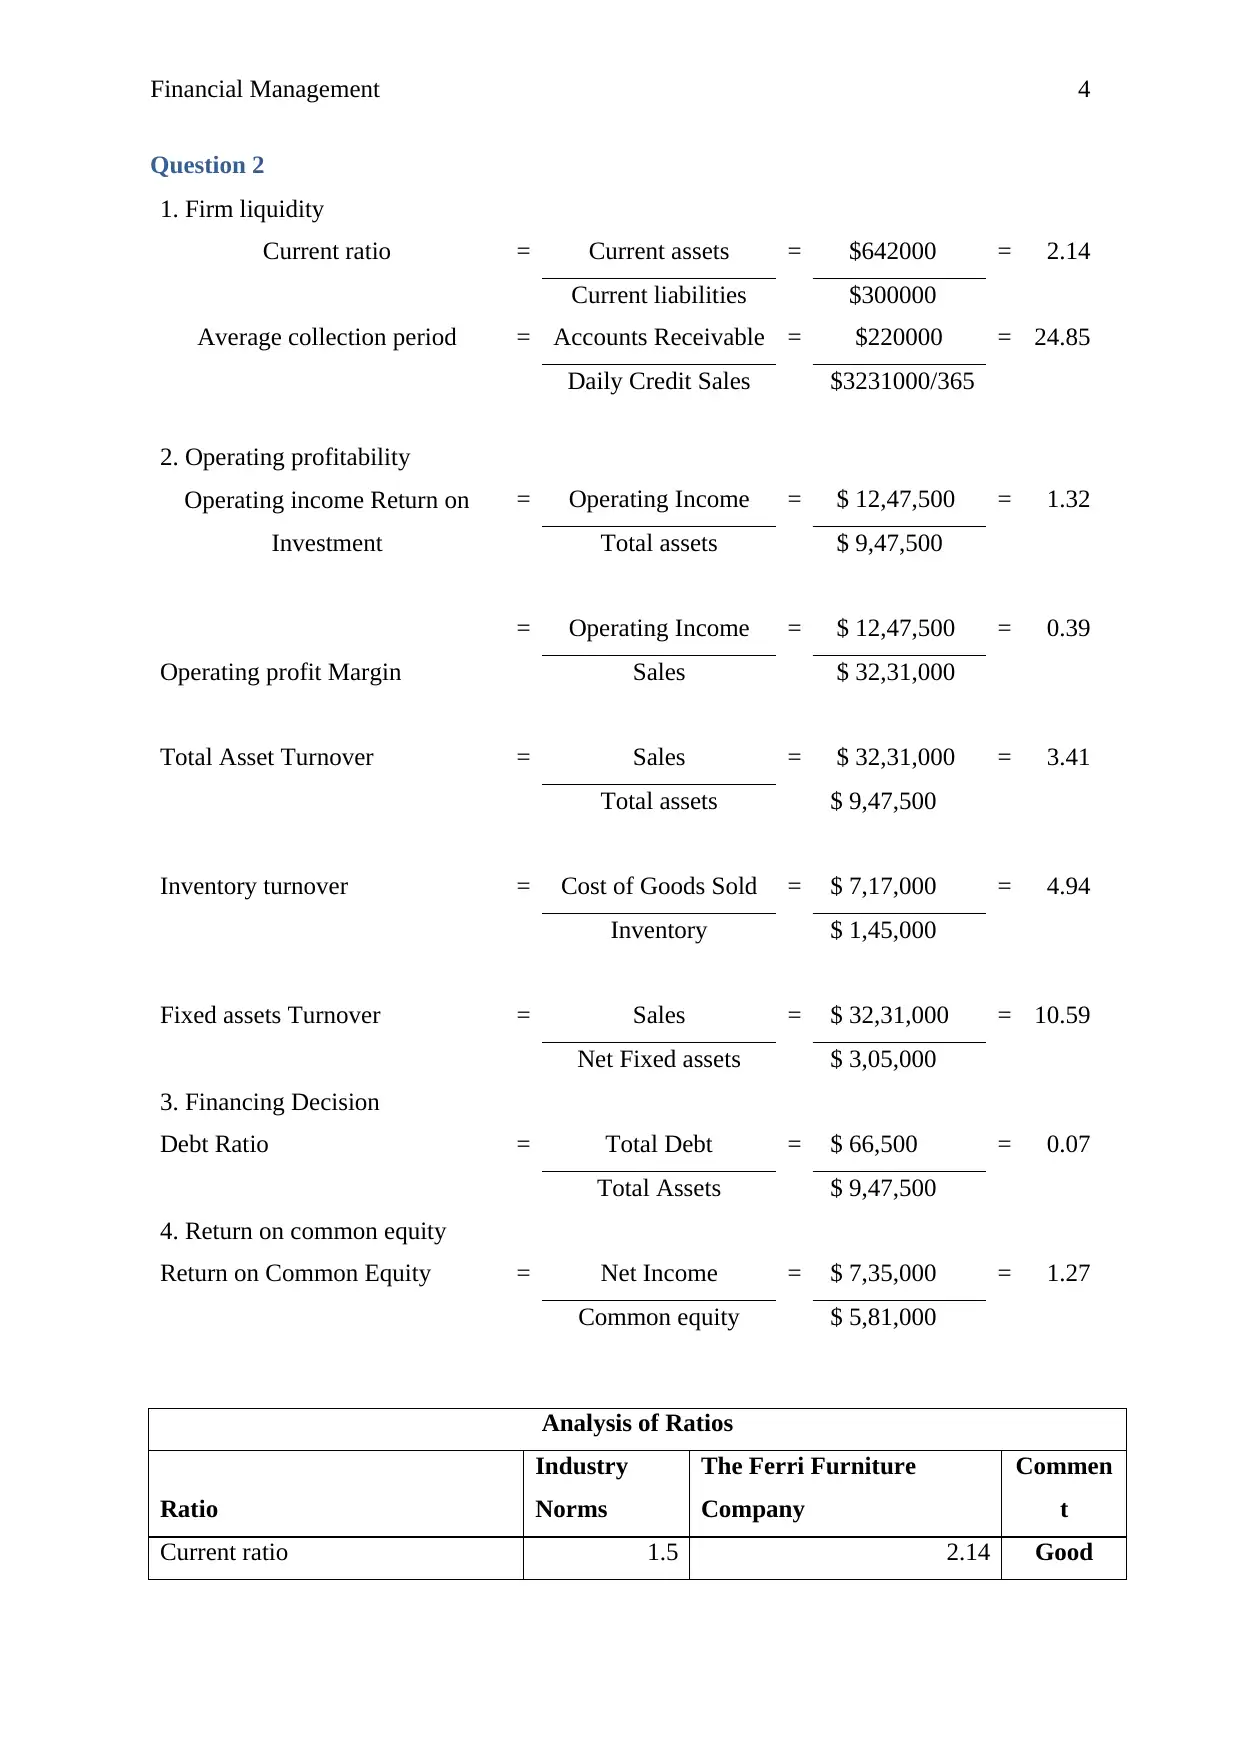
Question 2
1. Firm liquidity
Current ratio = Current assets = $642000 = 2.14
Current liabilities $300000
Average collection period = Accounts Receivable = $220000 = 24.85
Daily Credit Sales $3231000/365
2. Operating profitability
Operating income Return on
Investment
= Operating Income = $ 12,47,500 = 1.32
Total assets $ 9,47,500
Operating profit Margin
= Operating Income = $ 12,47,500 = 0.39
Sales $ 32,31,000
Total Asset Turnover = Sales = $ 32,31,000 = 3.41
Total assets $ 9,47,500
Inventory turnover = Cost of Goods Sold = $ 7,17,000 = 4.94
Inventory $ 1,45,000
Fixed assets Turnover = Sales = $ 32,31,000 = 10.59
Net Fixed assets $ 3,05,000
3. Financing Decision
Debt Ratio = Total Debt = $ 66,500 = 0.07
Total Assets $ 9,47,500
4. Return on common equity
Return on Common Equity = Net Income = $ 7,35,000 = 1.27
Common equity $ 5,81,000
Analysis of Ratios
Ratio
Industry
Norms
The Ferri Furniture
Company
Commen
t
Current ratio 1.5 2.14 Good
Paraphrase This Document
Need a fresh take? Get an instant paraphrase of this document with our AI Paraphraser
Financial Management 5
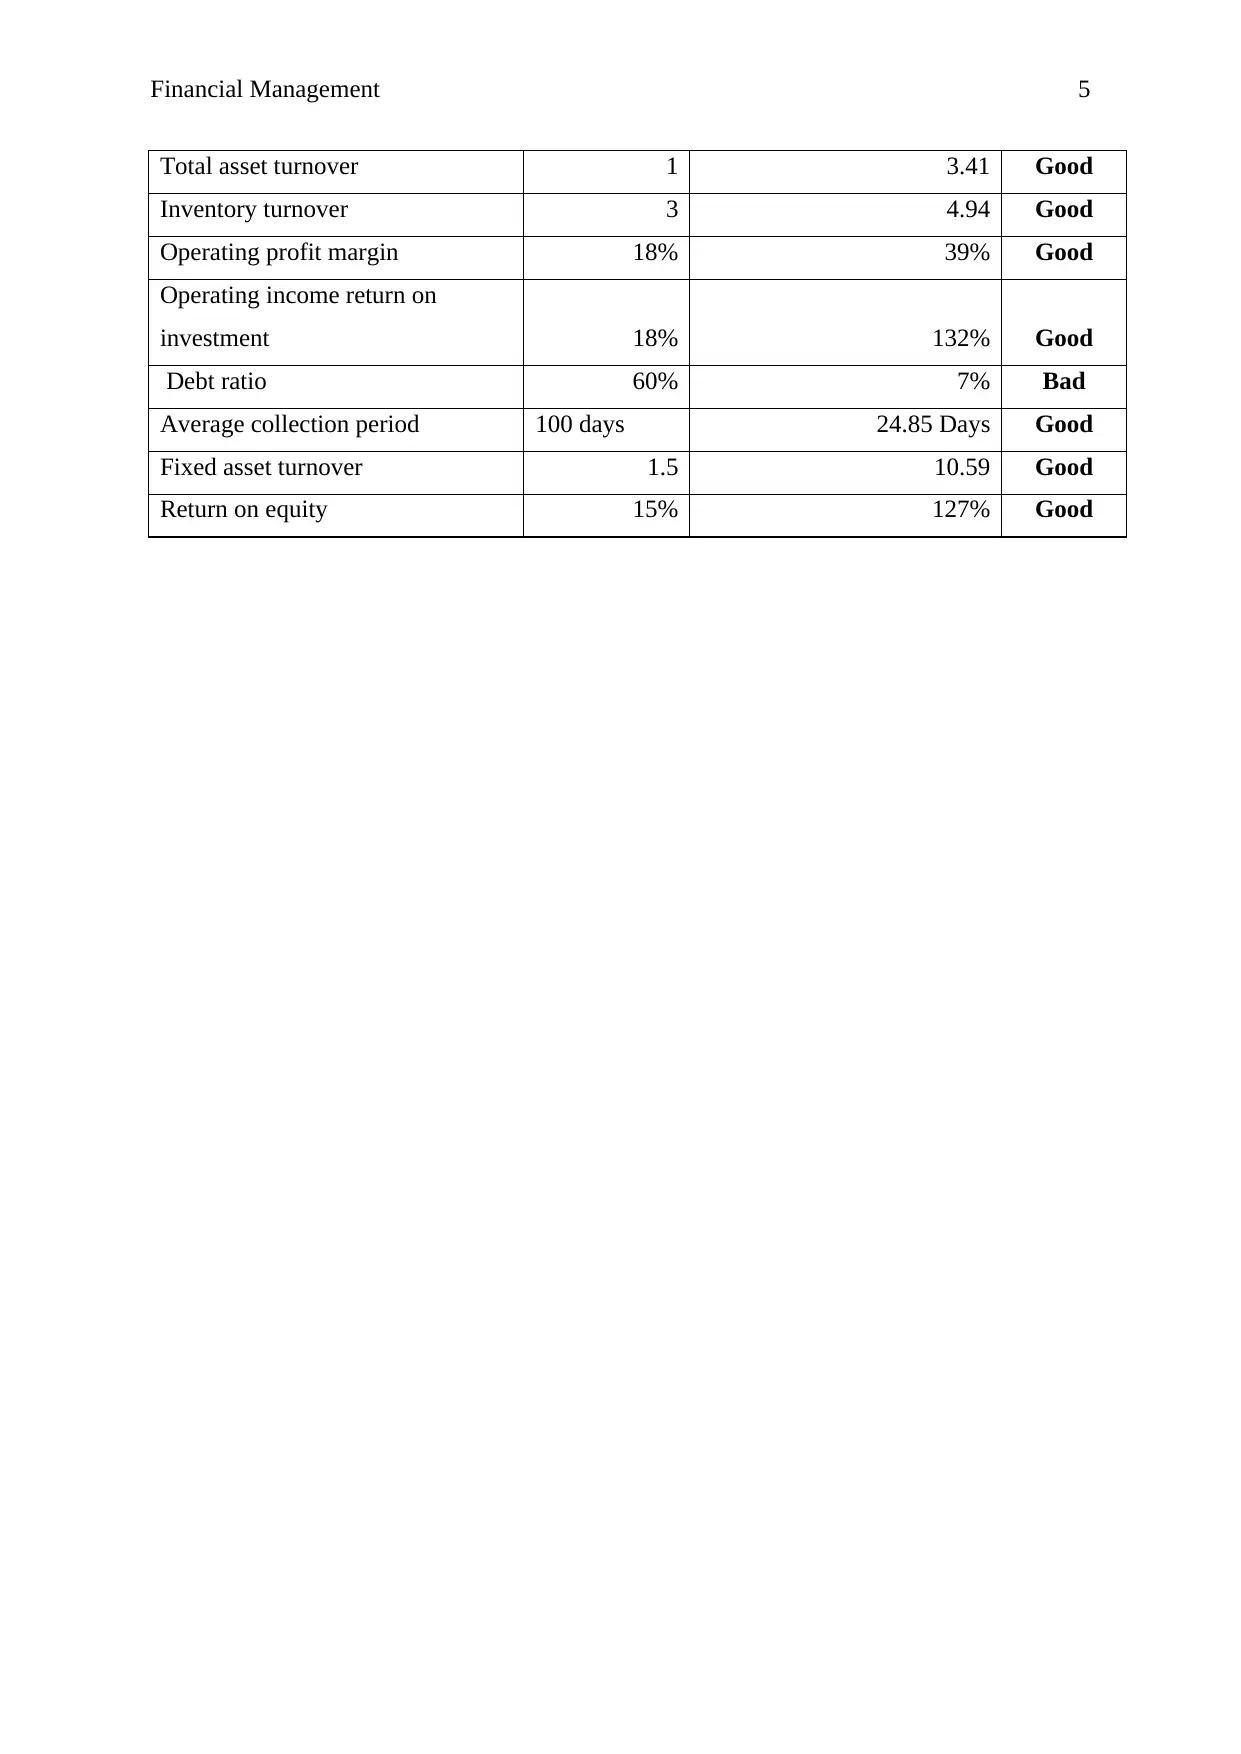
Total asset turnover 1 3.41 Good
Inventory turnover 3 4.94 Good
Operating profit margin 18% 39% Good
Operating income return on
investment 18% 132% Good
Debt ratio 60% 7% Bad
Average collection period 100 days 24.85 Days Good
Fixed asset turnover 1.5 10.59 Good
Return on equity 15% 127% Good
Total asset turnover 1 3.41 Good
Inventory turnover 3 4.94 Good
Operating profit margin 18% 39% Good
Operating income return on
investment 18% 132% Good
Debt ratio 60% 7% Bad
Average collection period 100 days 24.85 Days Good
Fixed asset turnover 1.5 10.59 Good
Return on equity 15% 127% Good
Financial Management 6
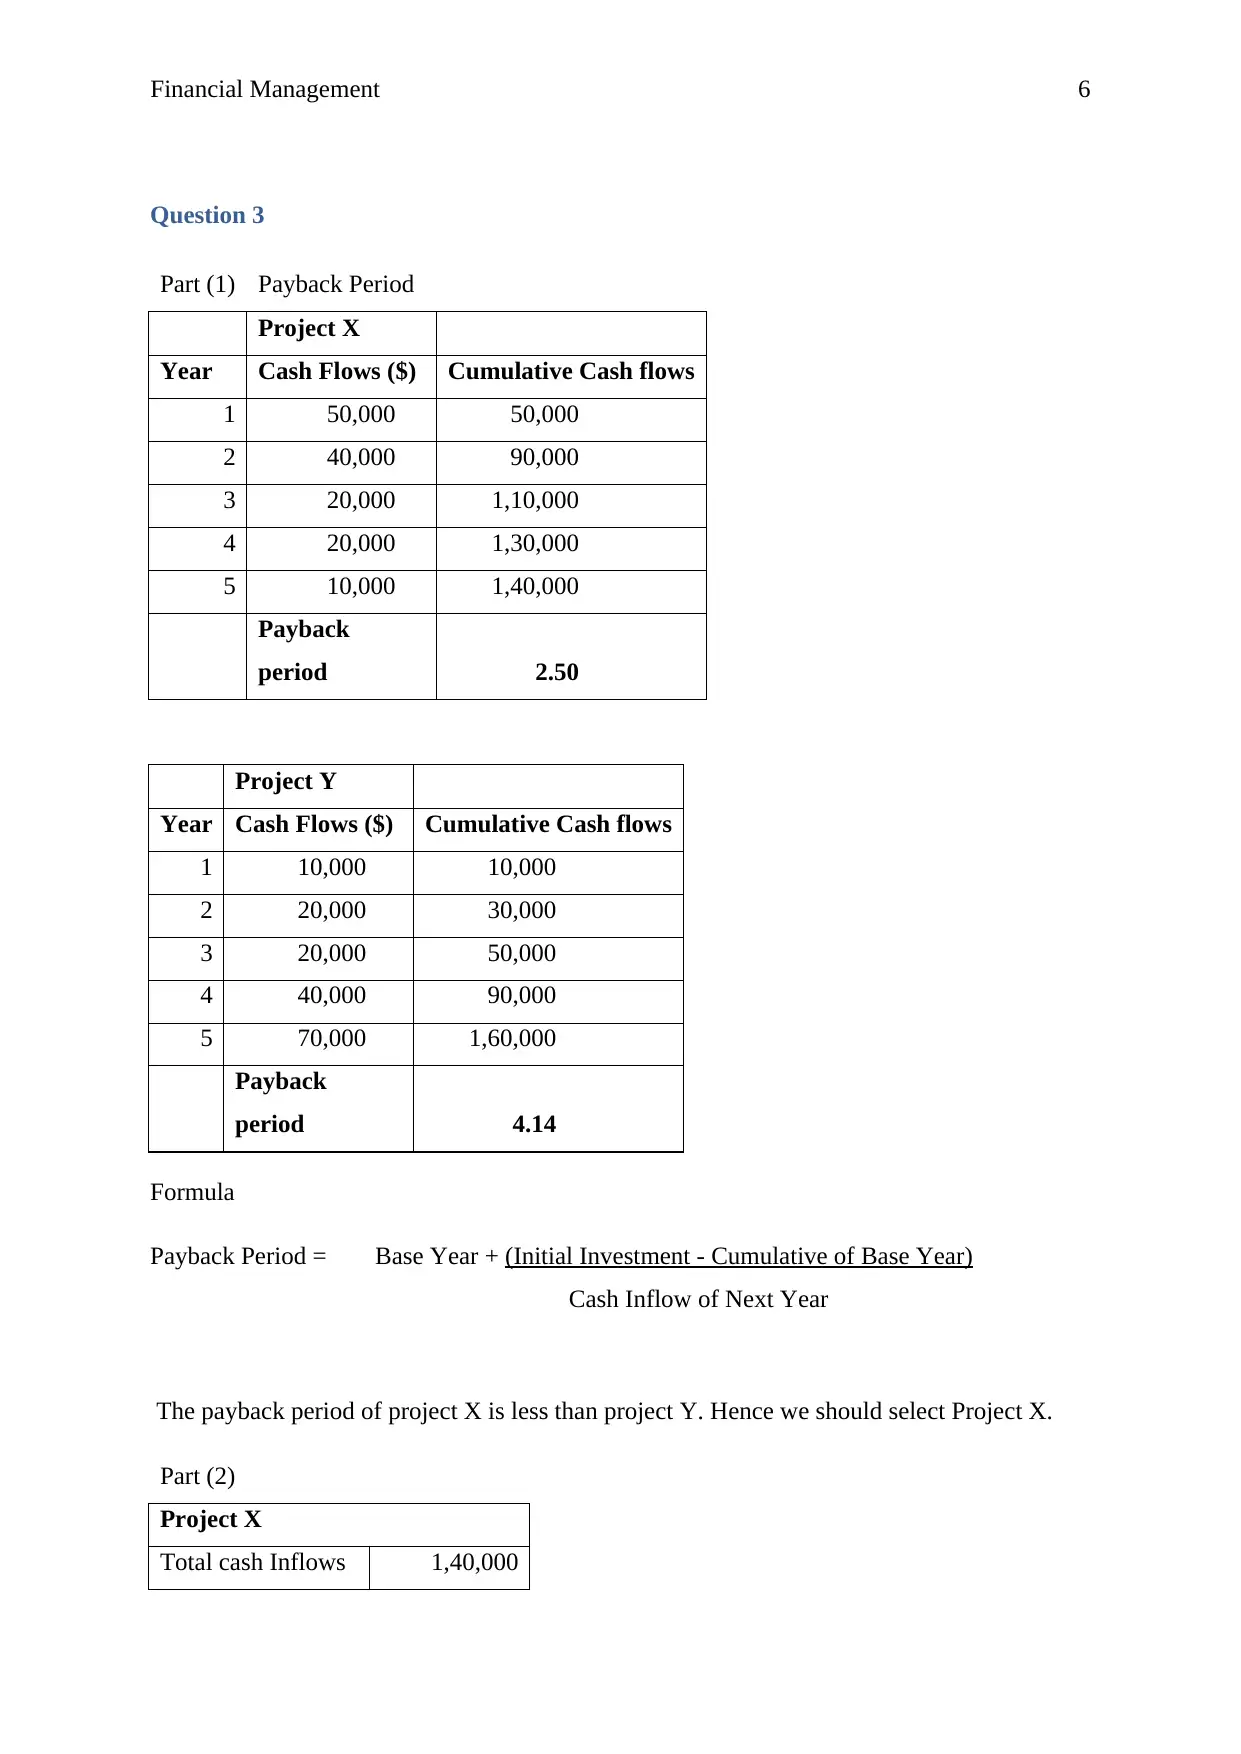
Question 3
Part (1) Payback Period
Project X
Year Cash Flows ($) Cumulative Cash flows
1 50,000 50,000
2 40,000 90,000
3 20,000 1,10,000
4 20,000 1,30,000
5 10,000 1,40,000
Payback
period 2.50
Project Y
Year Cash Flows ($) Cumulative Cash flows
1 10,000 10,000
2 20,000 30,000
3 20,000 50,000
4 40,000 90,000
5 70,000 1,60,000
Payback
period 4.14
Formula
Payback Period = Base Year + (Initial Investment - Cumulative of Base Year)
Cash Inflow of Next Year
The payback period of project X is less than project Y. Hence we should select Project X.
Part (2)
Project X
Total cash Inflows 1,40,000
⊘ This is a preview!⊘
Do you want full access?
Subscribe today to unlock all pages.
Trusted by 1+ million students worldwide
Financial Management 7
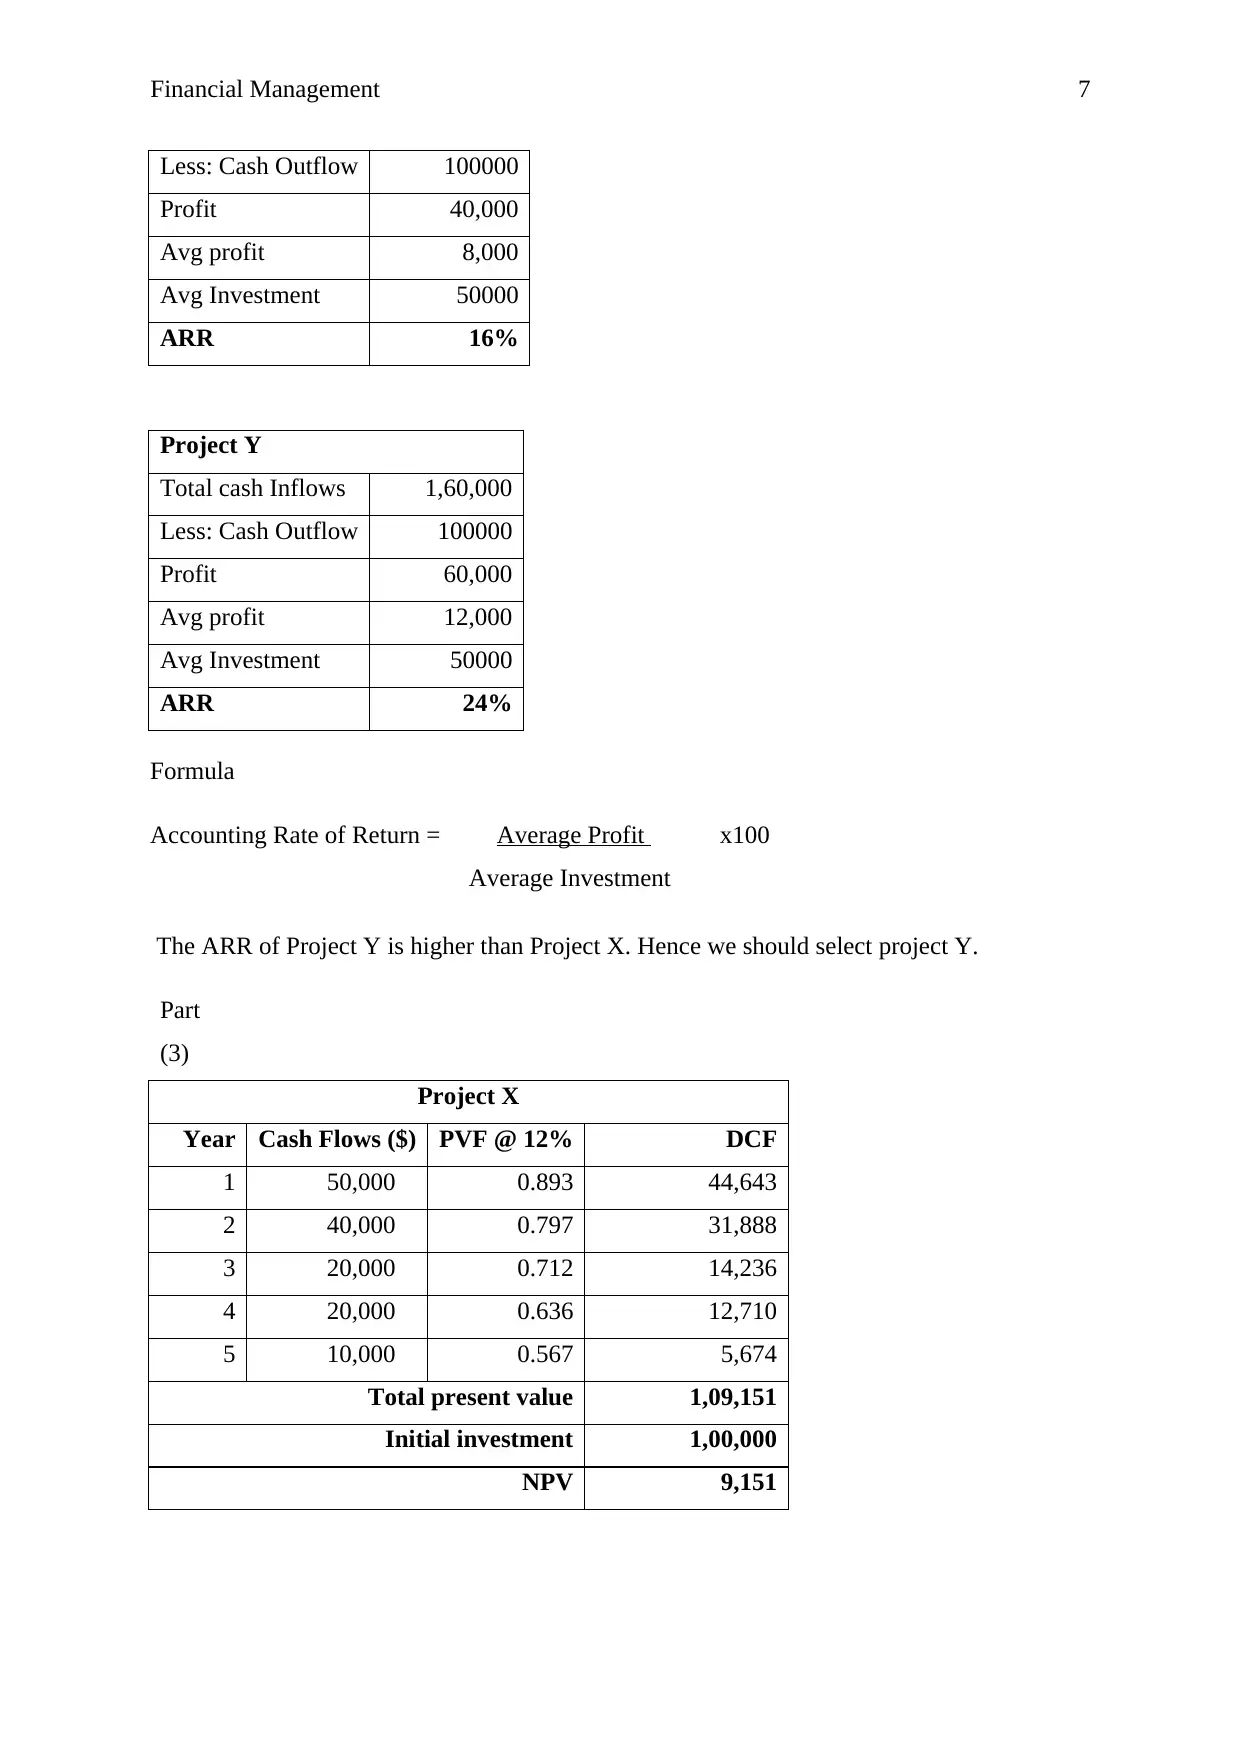
Less: Cash Outflow 100000
Profit 40,000
Avg profit 8,000
Avg Investment 50000
ARR 16%
Project Y
Total cash Inflows 1,60,000
Less: Cash Outflow 100000
Profit 60,000
Avg profit 12,000
Avg Investment 50000
ARR 24%
Formula
Accounting Rate of Return = Average Profit x100
Average Investment
The ARR of Project Y is higher than Project X. Hence we should select project Y.
Part
(3)
Project X
Year Cash Flows ($) PVF @ 12% DCF
1 50,000 0.893 44,643
2 40,000 0.797 31,888
3 20,000 0.712 14,236
4 20,000 0.636 12,710
5 10,000 0.567 5,674
Total present value 1,09,151
Initial investment 1,00,000
NPV 9,151
Less: Cash Outflow 100000
Profit 40,000
Avg profit 8,000
Avg Investment 50000
ARR 16%
Project Y
Total cash Inflows 1,60,000
Less: Cash Outflow 100000
Profit 60,000
Avg profit 12,000
Avg Investment 50000
ARR 24%
Formula
Accounting Rate of Return = Average Profit x100
Average Investment
The ARR of Project Y is higher than Project X. Hence we should select project Y.
Part
(3)
Project X
Year Cash Flows ($) PVF @ 12% DCF
1 50,000 0.893 44,643
2 40,000 0.797 31,888
3 20,000 0.712 14,236
4 20,000 0.636 12,710
5 10,000 0.567 5,674
Total present value 1,09,151
Initial investment 1,00,000
NPV 9,151
Paraphrase This Document
Need a fresh take? Get an instant paraphrase of this document with our AI Paraphraser
Financial Management 8
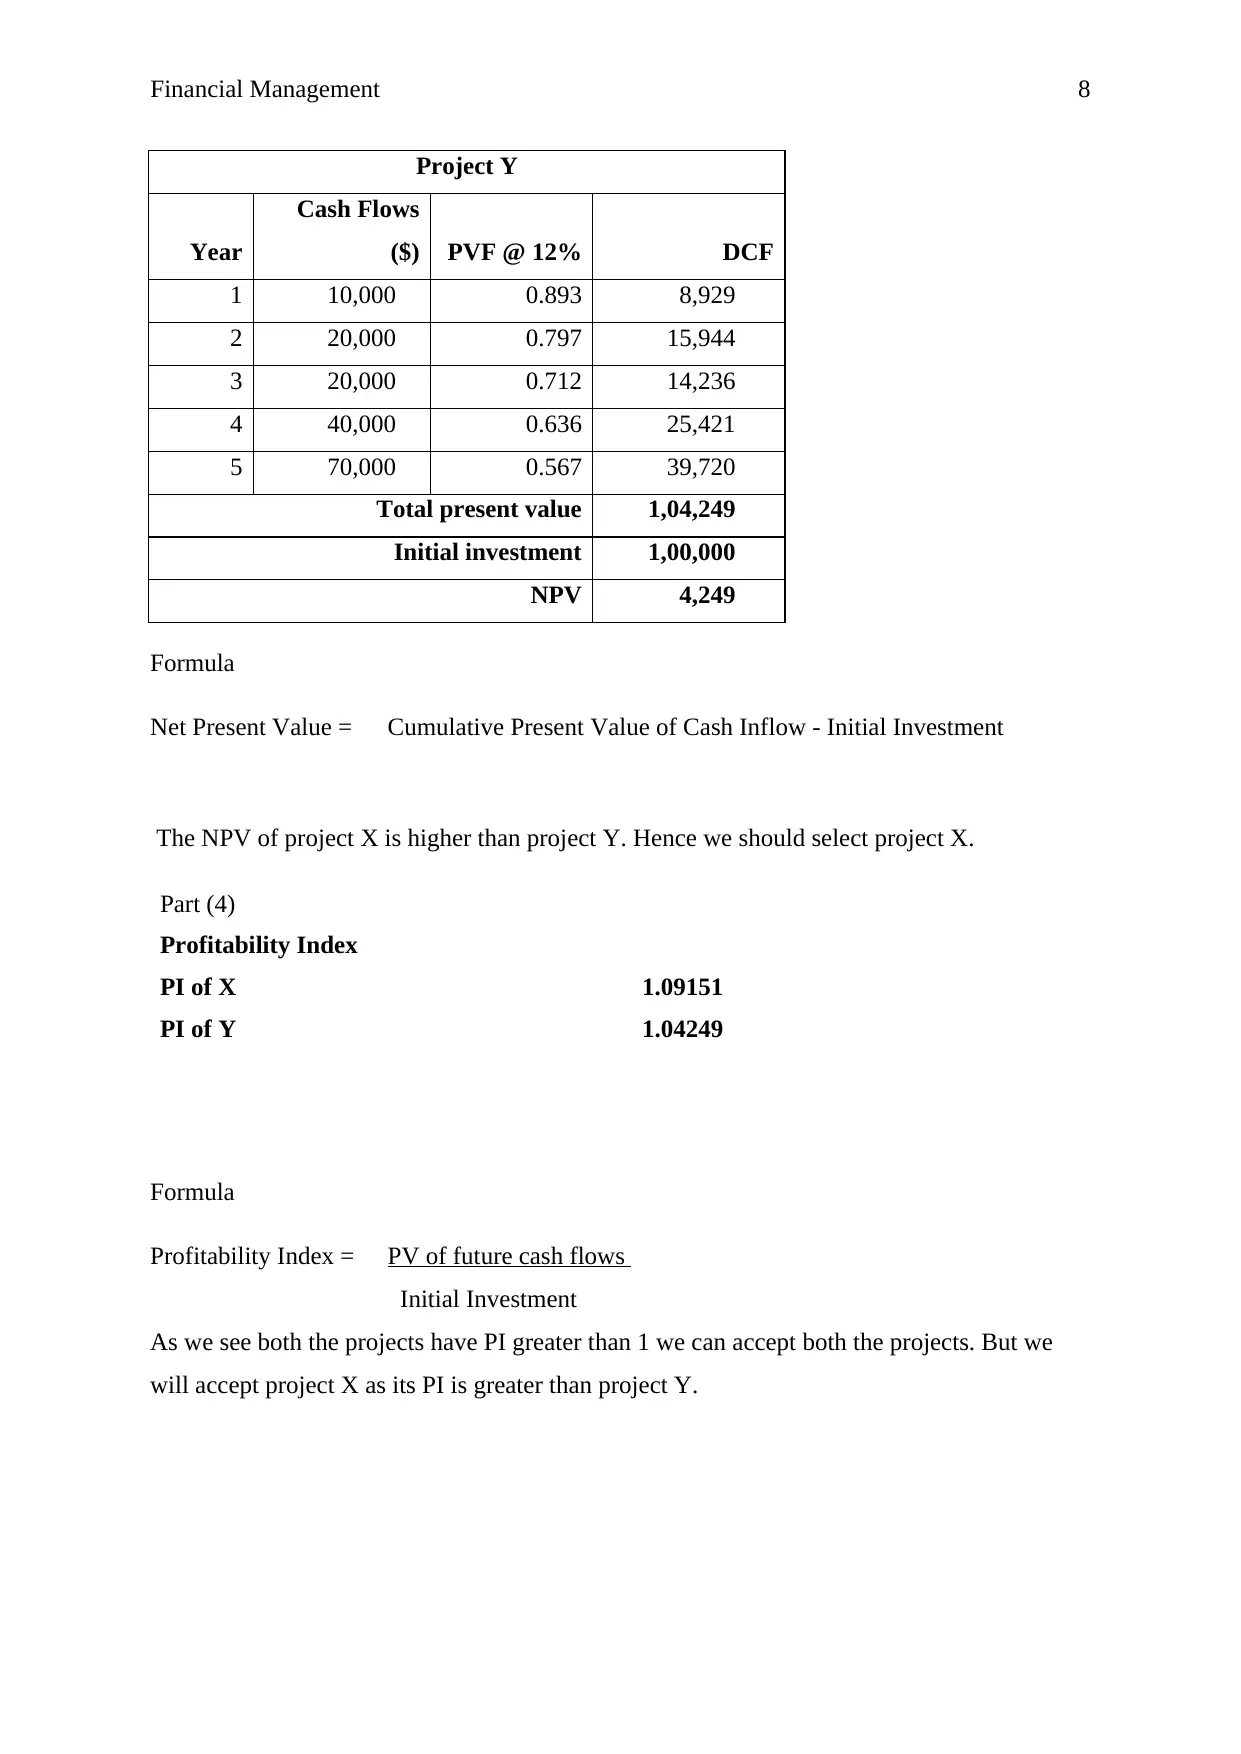
Project Y
Year
Cash Flows
($) PVF @ 12% DCF
1 10,000 0.893 8,929
2 20,000 0.797 15,944
3 20,000 0.712 14,236
4 40,000 0.636 25,421
5 70,000 0.567 39,720
Total present value 1,04,249
Initial investment 1,00,000
NPV 4,249
Formula
Net Present Value = Cumulative Present Value of Cash Inflow - Initial Investment
The NPV of project X is higher than project Y. Hence we should select project X.
Part (4)
Profitability Index
PI of X 1.09151
PI of Y 1.04249
Formula
Profitability Index = PV of future cash flows
Initial Investment
As we see both the projects have PI greater than 1 we can accept both the projects. But we
will accept project X as its PI is greater than project Y.
Financial Management 9
Question 4
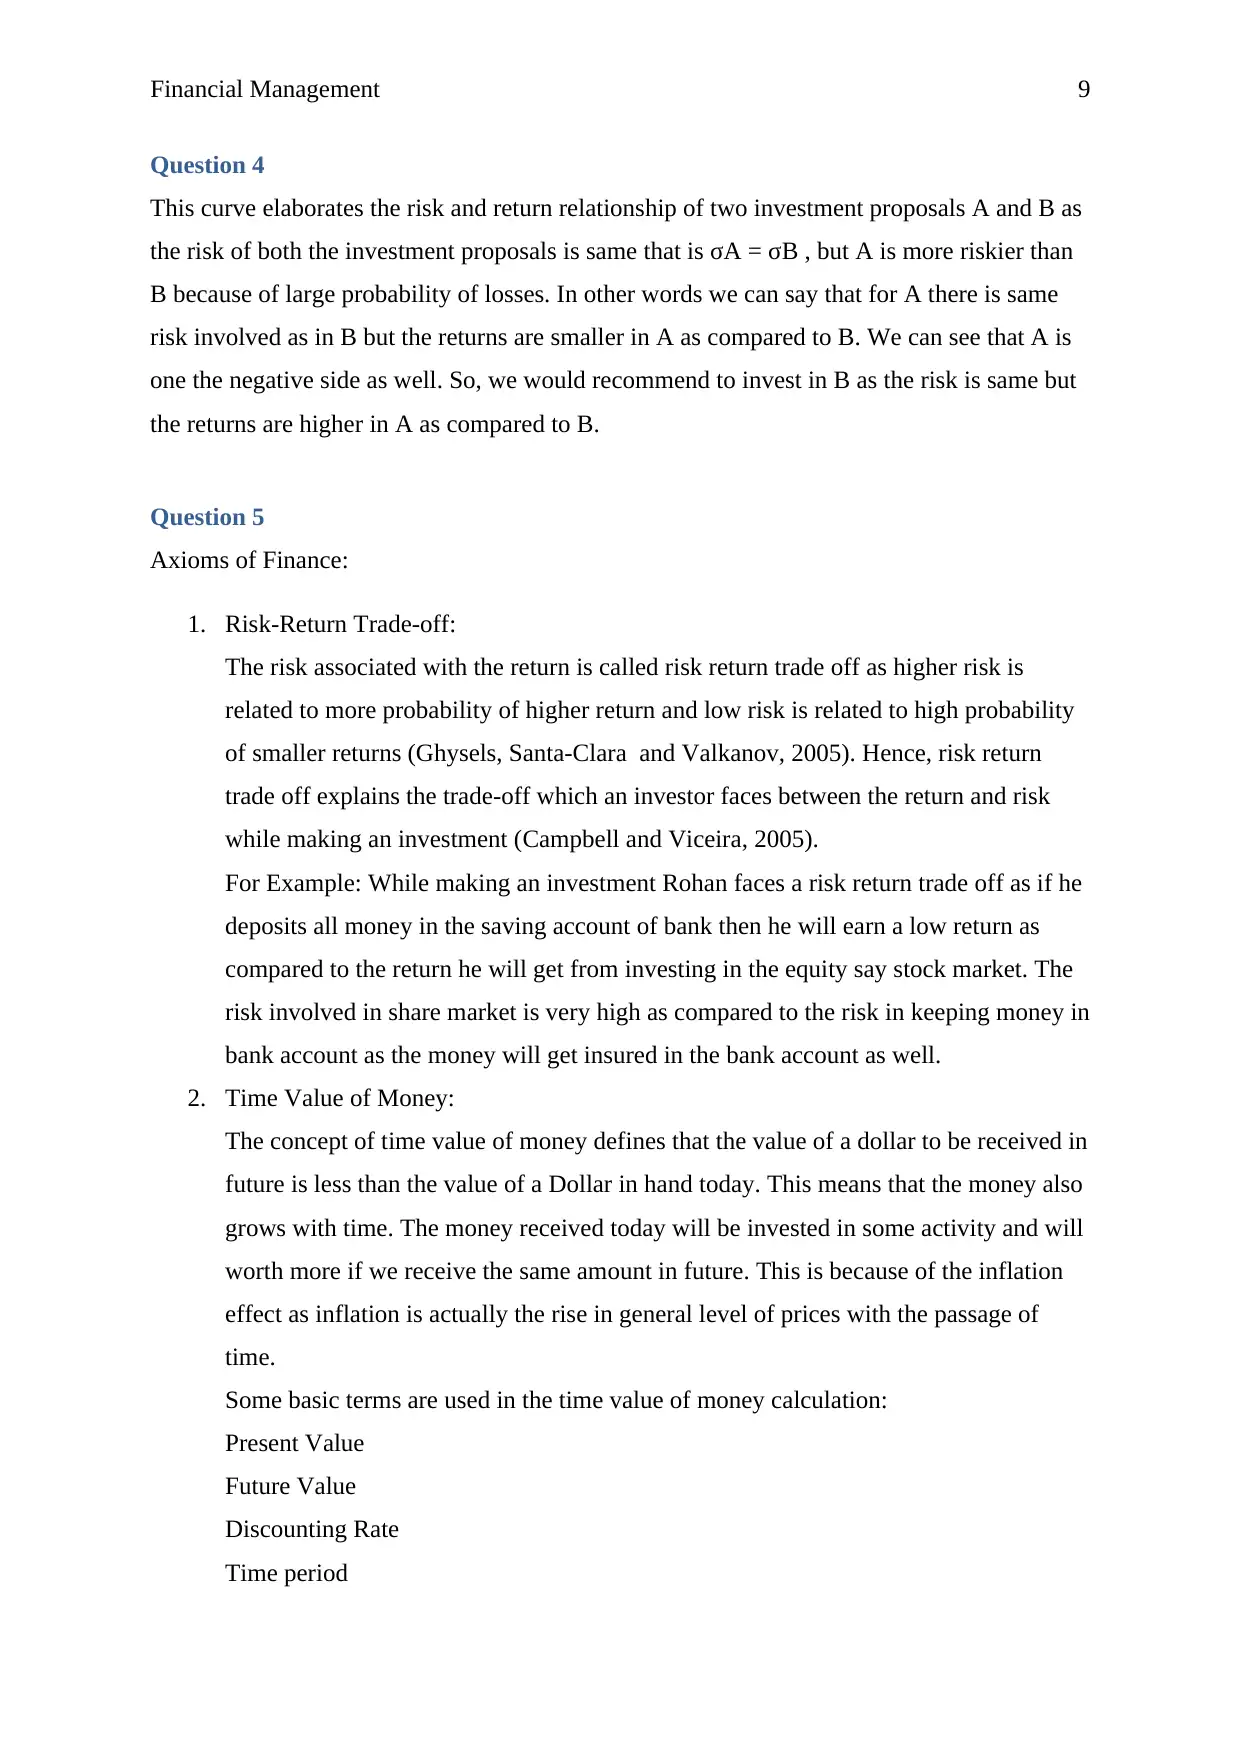
This curve elaborates the risk and return relationship of two investment proposals A and B as
the risk of both the investment proposals is same that is σA = σB , but A is more riskier than
B because of large probability of losses. In other words we can say that for A there is same
risk involved as in B but the returns are smaller in A as compared to B. We can see that A is
one the negative side as well. So, we would recommend to invest in B as the risk is same but
the returns are higher in A as compared to B.
Question 5
Axioms of Finance:
1. Risk-Return Trade-off:
The risk associated with the return is called risk return trade off as higher risk is
related to more probability of higher return and low risk is related to high probability
of smaller returns (Ghysels, Santa-Clara and Valkanov, 2005). Hence, risk return
trade off explains the trade-off which an investor faces between the return and risk
while making an investment (Campbell and Viceira, 2005).
For Example: While making an investment Rohan faces a risk return trade off as if he
deposits all money in the saving account of bank then he will earn a low return as
compared to the return he will get from investing in the equity say stock market. The
risk involved in share market is very high as compared to the risk in keeping money in
bank account as the money will get insured in the bank account as well.
2. Time Value of Money:
The concept of time value of money defines that the value of a dollar to be received in
future is less than the value of a Dollar in hand today. This means that the money also
grows with time. The money received today will be invested in some activity and will
worth more if we receive the same amount in future. This is because of the inflation
effect as inflation is actually the rise in general level of prices with the passage of
time.
Some basic terms are used in the time value of money calculation:
Present Value
Future Value
Discounting Rate
Time period
Question 4
This curve elaborates the risk and return relationship of two investment proposals A and B as
the risk of both the investment proposals is same that is σA = σB , but A is more riskier than
B because of large probability of losses. In other words we can say that for A there is same
risk involved as in B but the returns are smaller in A as compared to B. We can see that A is
one the negative side as well. So, we would recommend to invest in B as the risk is same but
the returns are higher in A as compared to B.
Question 5
Axioms of Finance:
1. Risk-Return Trade-off:
The risk associated with the return is called risk return trade off as higher risk is
related to more probability of higher return and low risk is related to high probability
of smaller returns (Ghysels, Santa-Clara and Valkanov, 2005). Hence, risk return
trade off explains the trade-off which an investor faces between the return and risk
while making an investment (Campbell and Viceira, 2005).
For Example: While making an investment Rohan faces a risk return trade off as if he
deposits all money in the saving account of bank then he will earn a low return as
compared to the return he will get from investing in the equity say stock market. The
risk involved in share market is very high as compared to the risk in keeping money in
bank account as the money will get insured in the bank account as well.
2. Time Value of Money:
The concept of time value of money defines that the value of a dollar to be received in
future is less than the value of a Dollar in hand today. This means that the money also
grows with time. The money received today will be invested in some activity and will
worth more if we receive the same amount in future. This is because of the inflation
effect as inflation is actually the rise in general level of prices with the passage of
time.
Some basic terms are used in the time value of money calculation:
Present Value
Future Value
Discounting Rate
Time period
⊘ This is a preview!⊘
Do you want full access?
Subscribe today to unlock all pages.
Trusted by 1+ million students worldwide
Financial Management 10
Time Value of money can be used to compare various investment alternatives and to
solve problems of mortgages, loans, leases and savings.
For example:
If we invest $1 today at an interest rate of 6% for one year then the future value will
be $1.06 that means the discounting rate is $1, time period is 1 year, future value is
$1.06 and present value is $1.
3. Cash is king:
It is an age-old saying that cash is a king as the business and household both require
cash in hand. Cash is the life blood as without the proper amount of cash both
business and household will be in trouble. It is necessary to have some amount of cash
in hand to run the day to day operation of business and the customers as well.
It is very necessary for business to have some amount of cash in hand as they often
need to invest the money in some unexpected exposures and for that they need
considerable amount of cash in hand or any other uncertainty can come in the way of
the business and interrupt their smooth flow of business. The flow of cash is very
necessary for long term growth of the company.
The same notation is for the customers as well households also as it is very necessary
for them to keep the considerable amount of cash handily and not keep all the money
for investment purpose as the flow of cash is also necessary.
4. Incremental Cash Flows:
The additional cash flow that an organisation receives from investing in a new project
is called incremental cash flows. The increase in cash flow from the acceptance of the
project is called positive incremental cash flow and if the cash flows will decrease
after the implementation of the new project then it is called non incremental cash
flows (Petty, Titman, Keown, Martin, Martin, and Burrow, 2015). If there is a positive
incremental cash flow then it is a good indicator for the company. Incremental cash
flow is the net cash flow that is inflows minus outflows of the new project over a
specified time period and the comparison is to be done between two or more business
proposal.
5. The agency problem:
The agency problem is the conflict of interest in any relationship where one party is
likely to act in the best interest of another party (Arye Bebchuk and Fried, 2003). In
corporate finance there are two primary agency relationships, the agency problem is
the conflict of interest between a company’s stockholders and a company’s
Paraphrase This Document
Need a fresh take? Get an instant paraphrase of this document with our AI Paraphraser
Financial Management 11
management and between the company’s creditors and its stakeholders (Chen, Lu,
and Sougiannis, 2012).
6. Taxes bias business decisions:
The government taxation incentives directly influence the business and financial
decisions of a company. It is very import for the companies to follow the government
tax policies as if they will not follow the taxation system then penalties will impose
on them (Buss, 2001). So, companies should not ignore the importance of government
tax policies as the tax realises is used in most cases for boosting the economic
purpose. Therefore it is important for the organisations to keep the awareness with the
government taxation policies because they may provide the benefit of cost reduction
(Park, Kim and Choi, 2007).
7. All risks are not equal:
Some risk can be diversified and some cannot, as the process of diversification
reduces the risk and as a result the risk of any project or asset cannot be measured
easily (Papa, 2009). A project’s risk is dependent on whether we measure it alone or
we measure it with other projects of the company as well.
8. Ethical Dilemmas is everywhere in finance:
Ethical Dilemmas is judging between what is right and what is wrong. There are
many cases in finance where ethical dilemmas occur as it is hard to make any choice
between the right ad right thing and the right and wrong thing (Dobos, Barry and
Pogge, 2011). As we take a small example to elaborate this, A firm had a choice to
invest in two investment proposal A and B namely one proposal offer a positive NPV
and other proposal offers a positive NPV but that too is lower than the first one, as we
move forward to IRR project A has lower IRR than project B. Here arises the ethical
dilemma as which proposal the company will accept it is hard to make a choice
between A and B. As like this there are many cases where ethical dilemmas arises in
the course of running the business where it is hard to make any choice.
The statement is absolute correct in its context “Although it is not necessary to understand
finance in order to understand these axioms, it is necessary to understand these axioms in
order to understand finance”. Finance is all about these axioms it is very necessary to have an
in-depth knowledge of these axioms to lean how financial decisions can be made in a
company (Lie, 2000). The company need to go through with all these conditions to run the
business smoothly and they need to keep in view all these condition on time and very
effectively (O’Fallon and Butterfield, 2005).
1 out of 11
Your All-in-One AI-Powered Toolkit for Academic Success.
+13062052269
info@desklib.com
Available 24*7 on WhatsApp / Email
![[object Object]](/_next/static/media/star-bottom.7253800d.svg)
Unlock your academic potential
Copyright © 2020–2026 A2Z Services. All Rights Reserved. Developed and managed by ZUCOL.